Article

Charge Regulation and pH Effects on Thermo-Osmotic Conversion

Department of Engineering Science, National Cheng Kung University, Tainan 70101, Taiwan
*
Author to whom correspondence should be addressed.
Nanomaterials 2022, 12(16), 2774; https://doi.org/10.3390/nano12162774
Submission received: 26 July 2022 / Revised: 7 August 2022 / Accepted: 11 August 2022 / Published: 13 August 2022
(This article belongs to the Special Issue Advances in Micro/Nanofluidic Power)

Abstract

:
Thermo-osmotic energy conversion using waste heat is one of the approaches to harvesting sustainable energy and reducing associated environmental impacts simultaneously. In principle, ions transport through a charged nanopore membrane under the effect of a thermal gradient, inducing a different voltage between two sides of the membrane. Recent publications mainly reported novel materials for enhancing the thermoelectric voltage in response to temperature difference, the so-called Seebeck coefficient. However, the effect of the surface charge distribution along nanopores on thermo-osmotic conversion has not been discussed yet. In this paper, a numerical simulation based on the Nernst–Planck–Poisson equations, Navier–Stokes equations, and heat transfer equations is carried out to consider the effect of surface charge-regulation density and pH of KCl solutions on the Seebeck coefficient. The results show that the highest ionic Seebeck coefficient of −0.64 mV/K is obtained at 10−4 M KCl solution and pH 9. The pH level and pore structure also reveal a strong effect on the thermo-osmotic performance. Moreover, the pH level at one reservoir is varied from 5 to 9, while the pH of 5 is fixed at the other reservoir to investigate the pH effect on the thermos-osmosis ion transport. The results confirm the feasibility that using the pH can enhance the thermo-osmotic conversion for harvesting osmotic power from low-grade heat energy.

1. Introduction

Harvesting energy for sustainable development has been one of the critical missions over the world. Solar and wind energy are being significantly developed and deployed on a large scale; however, their performance strongly depends on weather conditions [1]. Scientists are finding other resources that can convert energy from waste heat [2,3,4], for example, pressure-osmosis [5], droplet-triboelectric generators [6,7,8,9], and salinity gradient [10]. Thermo-osmosis conversion converts waste heat energy to electricity [11]. In principle, electrolytes containing positive and negative ions can be transported under a temperature gradient and surface-charge effect [12]. Using the temperature gradient, ions on the hot side with a higher diffusion are more active than that on the cold side [13]. Besides, a membrane containing a charged surface in its pore structure can control the direction and selectivity of ion transport [14,15]. The electrostatic force between positive ions and negative surface charge forms an electrical double layer (EDL). The EDL is a filter which attracts counter-ions and rejects a certain part of the co-ions to pass through the membrane [16]. Therefore, the surface charge in the membrane materials, pore size, and pore structure are the important parameters which decide the efficiency of thermo-osmosis. A 2D membrane with the layer-by-layer arrangement which forms high-density pore distribution of the nano-size channel has good potential application for thermo-osmosis conversion [17]. Sub-1 nm pore (with negative charge pore, for example) generates an overlapped EDL that only allows the positive ions to pass through the nano-channel and form the ion selectivity [18]. As a result, more positive ions are found on the cold side, and more negative ions remain on the hot side, leading to a different thermo-osmosis voltage.
The thermoelectric response in nanofluidics is involved with three sources, (1) thermo-electromigration [13,19], (2) Soret-type thermo diffusion [20,21,22,23], and (3) flow osmosis [24,25,26,27,28]. In thermo-electromigration, a thermoelectric potential is induced under the effect of the EDL in nanopores. Meanwhile, in the Soret-type thermo diffusion, the ions in the hot region of the nanopore diffuse naturally to the cooler side which generates thermoelectric potential as a result. Finally, flow osmosis is the process by which ions are driven by the flow field. The three sources exist simultaneously within the nanopore and are governed not only by the temperature gradient, flow field, and EDL but also by the interaction among them. The interaction of thermo-electromigration, thermo-diffusion, and flow osmosis is named the thermo-osmosis phenomenon.
Recent publications on the thermo-osmosis conversion reported the application of materials such as the covalent-organic framework [29], cellulosic membrane [30], and ionogels with cationic doping [31]. Others studied in thermo-osmosis showed hydrophilic or nanopore structures and membrane properties strongly influence the performance of the membrane [32,33]. Zhang et al. [34] discussed controlling ion transport through the nanopore by the surface charge of the 2D membrane. However, no study has been reported on the effect of pH environment or charge-regulation surfaces that may significantly control the ion transport in the confined sub-1 nm membrane used in thermo-osmosis energy conversion.
In this paper, the feasibility of utilizing graphene oxide membrane to study the thermo-osmosis conversion is considered, and the ionic transport under a pH charge-regulated mechanism is discussed. Nanopore membranes fulfilled by a KCl solution are used to study the thermoelectric response (see Figure 1). Temperature-dependent ionic electromigration dominated the transport in the channel, and its effect becomes significant with decreases in the KCl solution concentration. Numerical simulation is carried out to explore the charge-governed effect on thermo-osmosis ion transport. A charge-regulation model and pH levels are adopted to describe the deprotonation and protonation processes [35]. Two cases of simulation settings are studied, including (1) the pH being constant in all computational domains to study the effect of the pH environment on the ionic Seebeck coefficient, (2) the pH 5 being fixed at one reservoir while the pH at another side is varied from 5 to 9 to explore the effect of the pH on the thermos-osmosis ion transport. The main purpose is to find an optimal operation condition that one can use to obtain the maximum ionic Seebeck coefficient.

2. Methodology

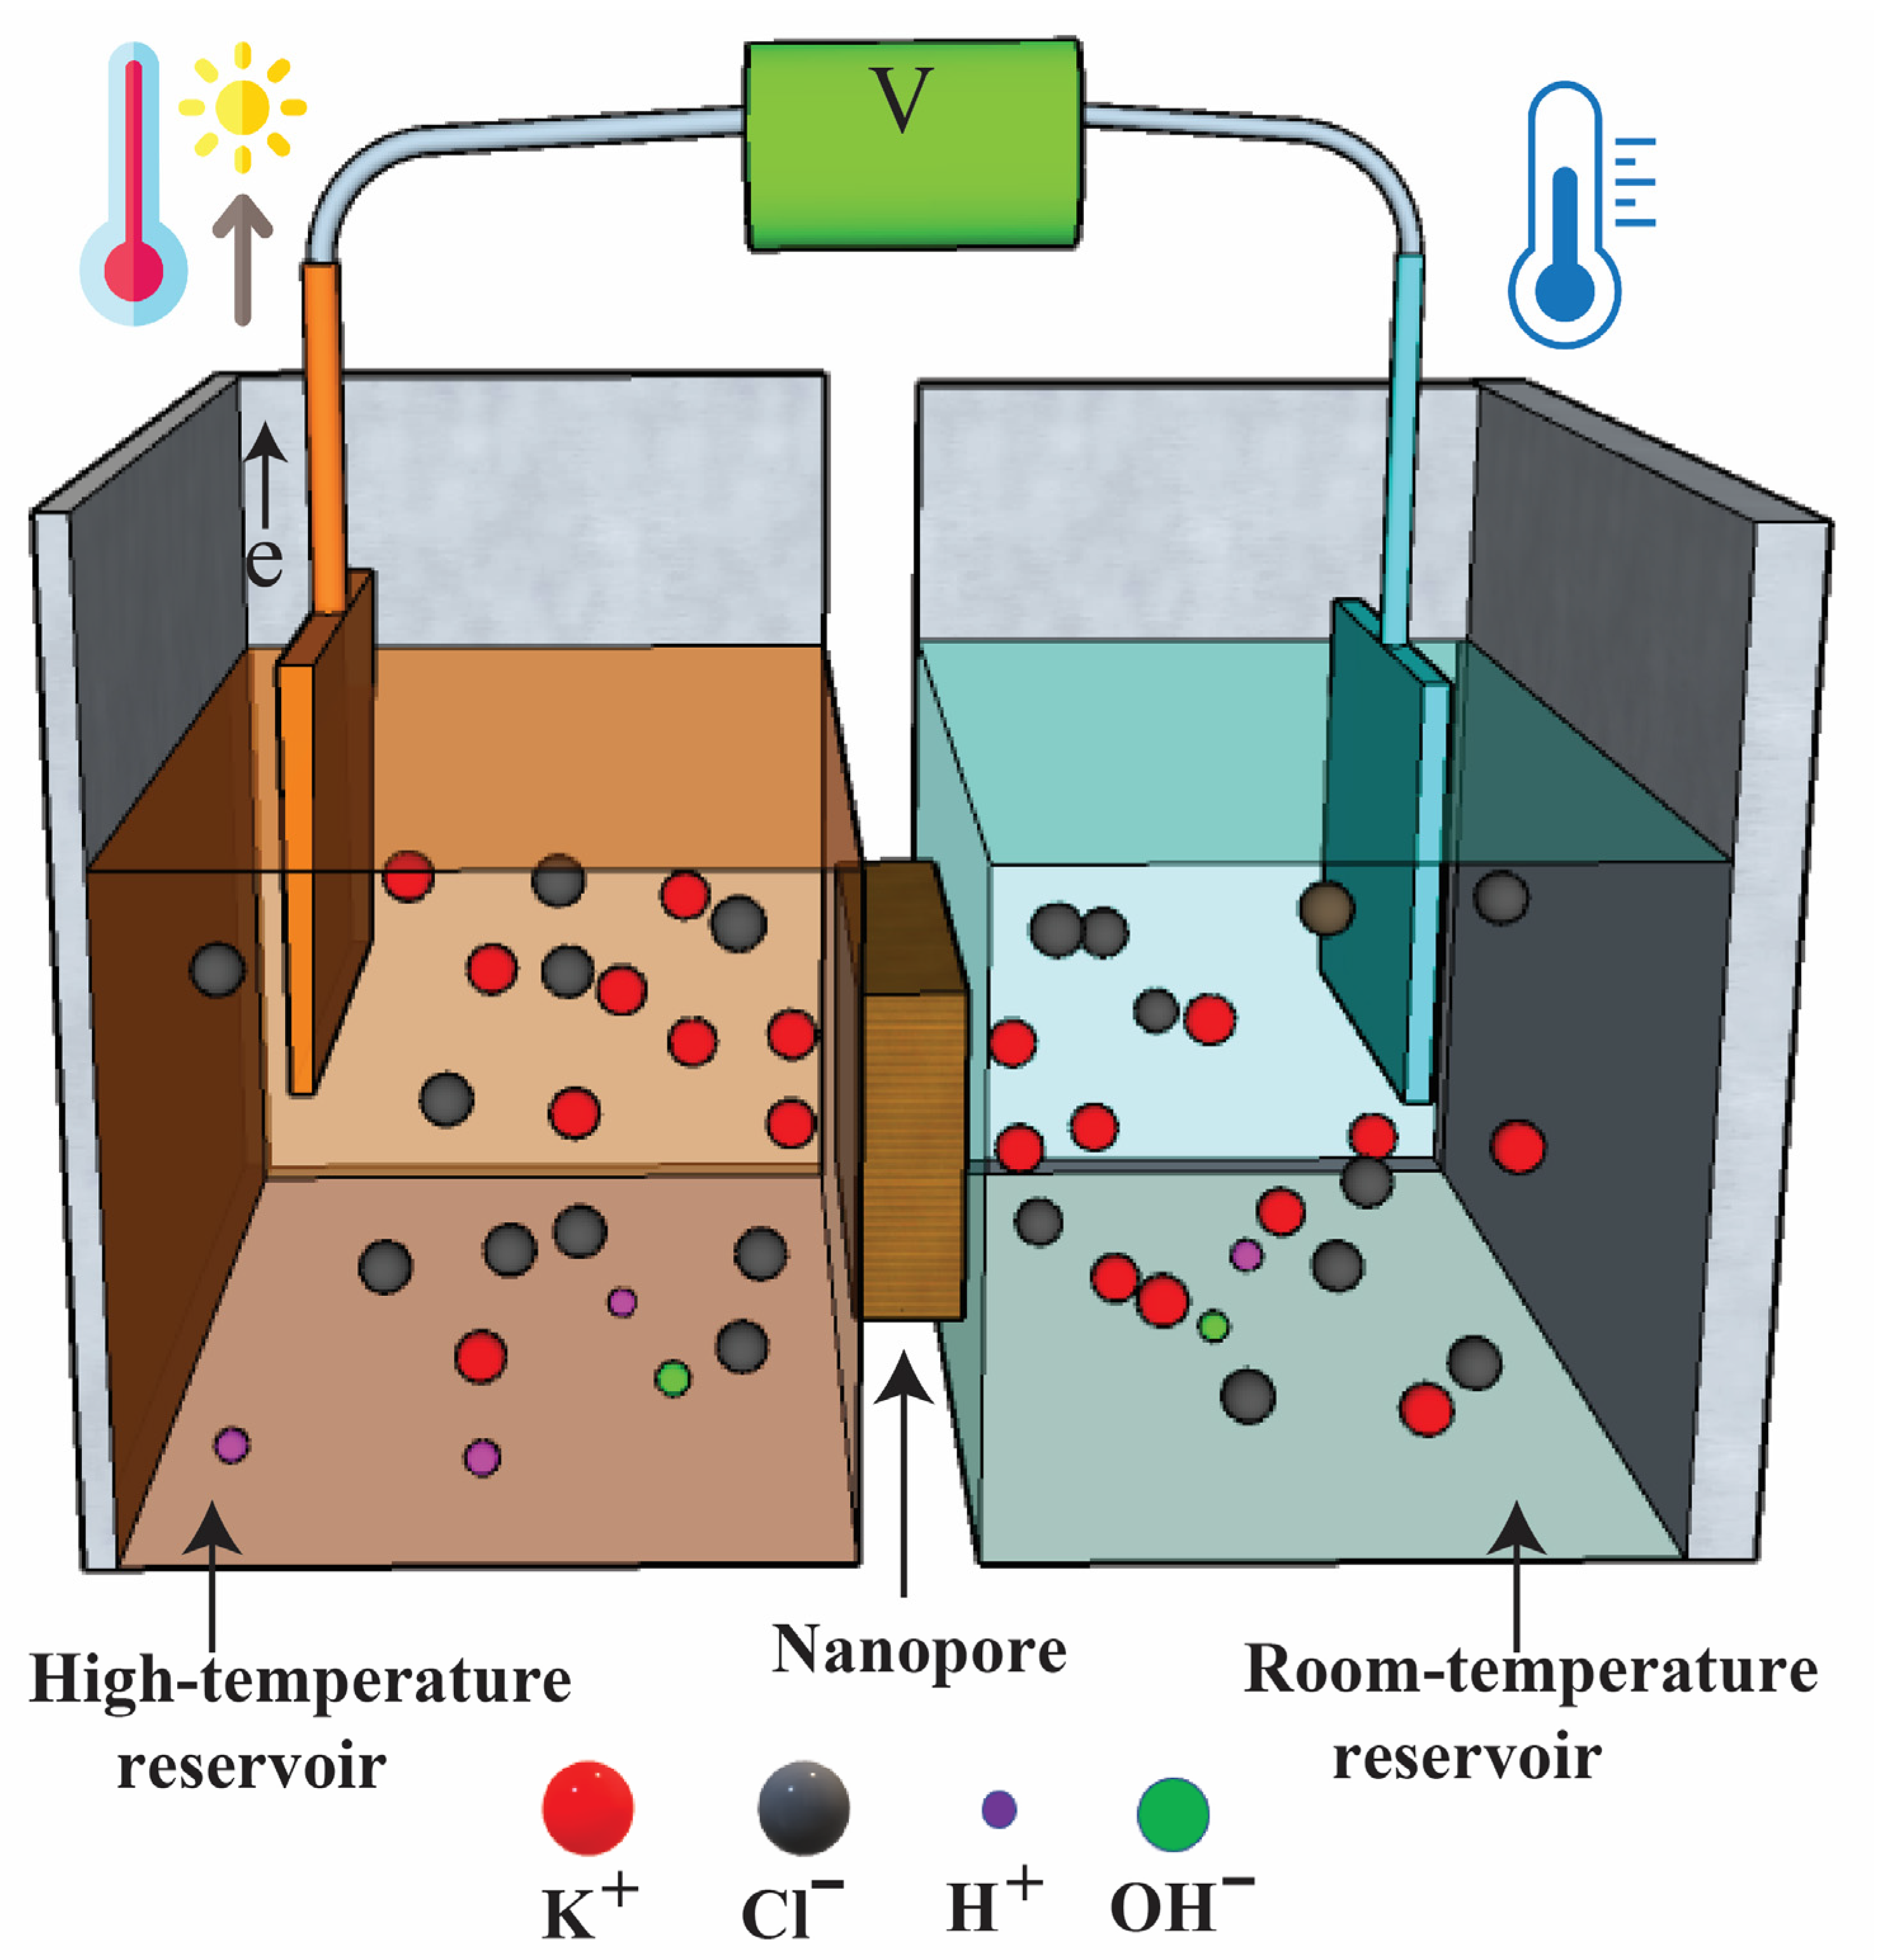
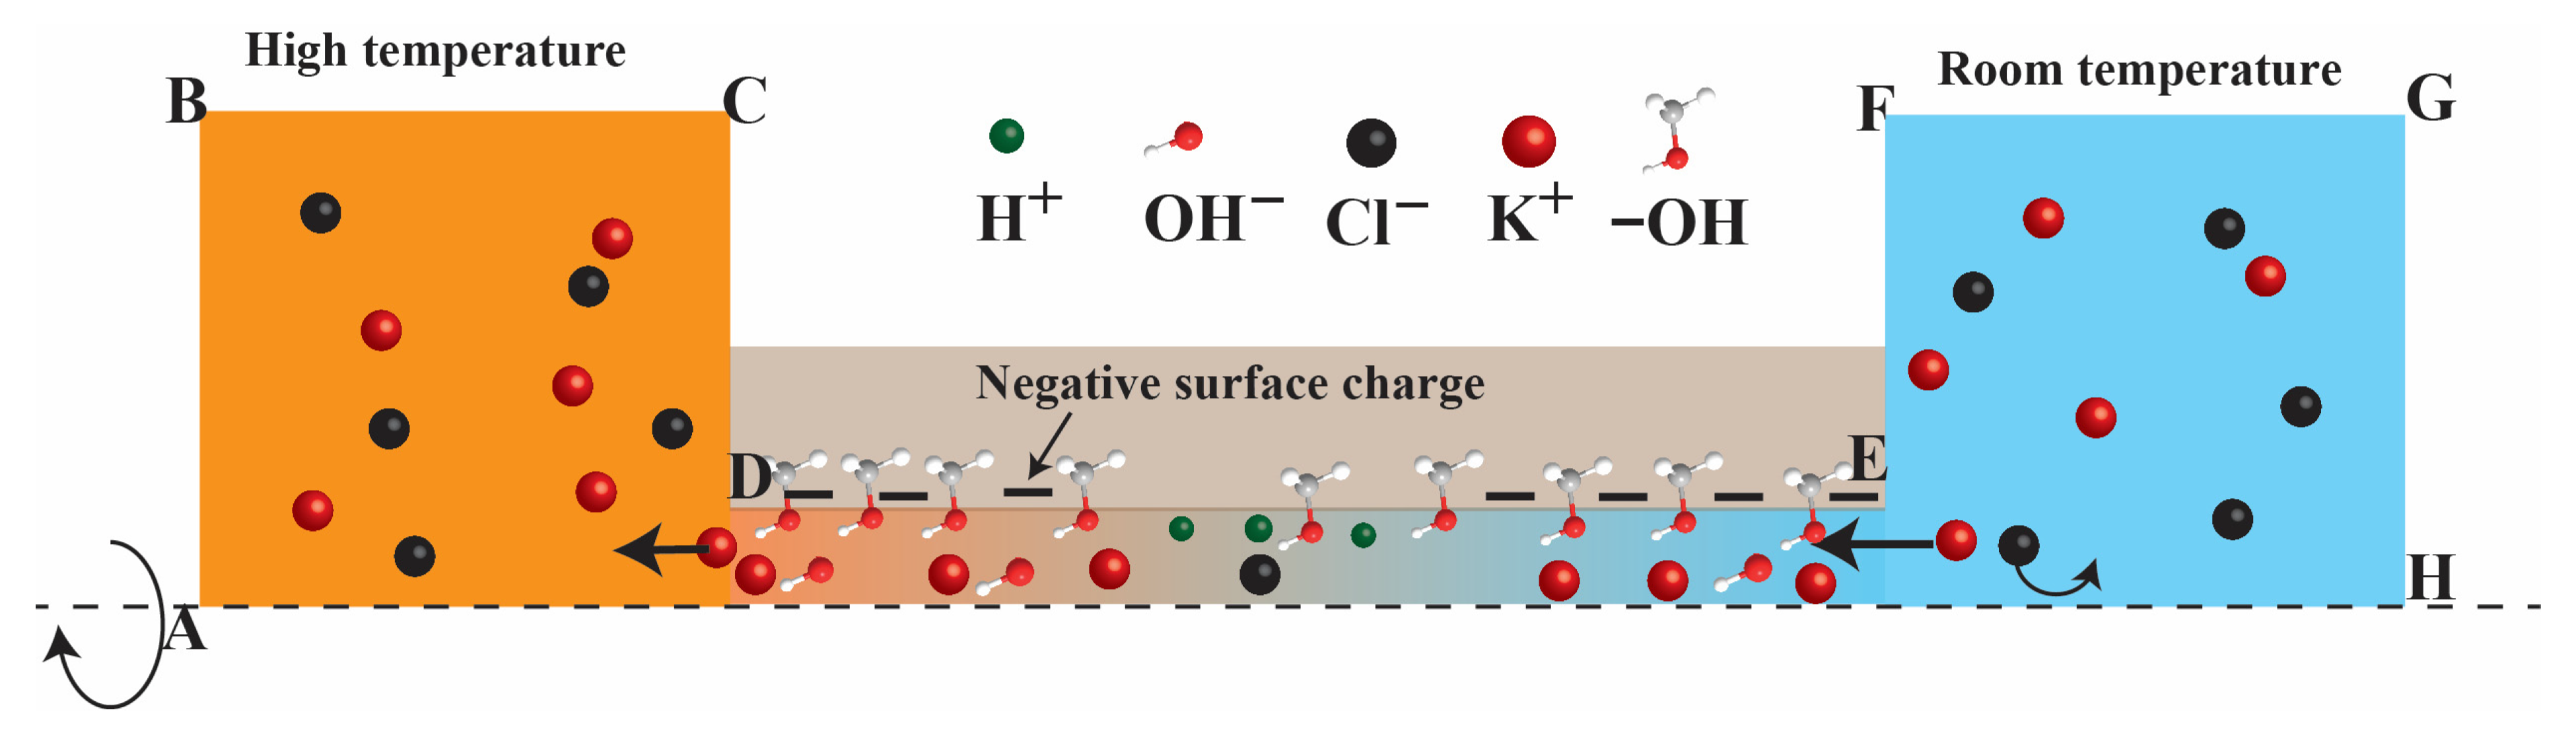
2.1. Theoretical Model and Mechanism

Ion transport under the effect of a temperature gradient and potential interaction were modelled using the coupling of the Nernst–Planck equation, Poisson equation, Navier–Stokes equations, and heat transfer equation. The governing equation for the ith ionic species flux was formulated as:
J i = c i u D i c i F R T D i z i c i ϕ 2 D i c i α i T T
. J i = 0
. ( ε r ε 0 ϕ ) = F i = 1 4 z i c i
where ε 0 is the permittivity of a vacuum, ε r is the relative permittivity, ϕ is the electric potential, and F is the Faraday constant. z i is the valence, c i is the concentration. D i is the diffusivity and α i is the Soret coefficient. i denotes of the ith ionic specie including K+, Cl, H+, and OH. The inertial term in the Navier–Stokes equations was ignored in this study, which can be written as:
p + . ( μ u ) F i = 1 4 z i c i ϕ 1 2 ε 0 | ϕ | 2 ε r = 0
. ( ρ u ) = 0  
where p, u, and μ are the pressure, flow field velocity and viscosity, respectively. The temperature in Equation (1) is obtained from the heat transfer equation as
ρ C p u . T = . ( k T )
where ρ , Cp and k are the density, specific capacity and thermal conductivity of the electrolyte, respectively. The ion diffusivity and viscosity of the electrolytes are temperature-dependent with the temperature in the range of 273 K to 373 K [10,14]. This range is smaller than that of solid materials for thermoelectric use [36]. Solid-state nanopore contains chemical functional groups which generate negative (or positive) surface charge density. The pH value strongly influences the deprotonation and protonation reactions of the functional group on the nanopore surface. The influence of the equilibrium deprotonation reaction that happened in functional carboxyl groups of graphene oxide was reported by Elisa et al. [37,38]. The surface charge density on the nanopore surface was modelled as [35,39,40]
σ s = σ 0 10 p K A 10 p K B [ H + ] s 2 10 p K A + [ H + ] s + 10 p K B [ H + ] s 2
where σ 0 is the basic charge density, pKA describes the acidity of −COOH functional group, pKB defines protonation reaction, and [ H + ] s is the surface proton concentration.

2.2. Numerical Modelling

The governing equations given above couple the relations between the ion transport, electrostatic field, flow field, and heat transfer modules. They are solved numerically by COMSOL Multiphysics simulations (COMSOL, Inc., Stockholm, Sweden). The purpose of the simulation is to investigate the combined effect of the thermal conditions and pH level in the surface charge regulation in KCl electrolyte within a confined nanopore (see Figure 2). The nanopore was assumed to have a size of 0.8 nm and the pore length was set as 50 nm. Moreover, the width and length of the two reservoirs were set as 1000 × 1000 nm2. The surface charge density on the nanopore wall was computed using Equation (7) with the basic charge ( σ 0 ) set equal to −0.1 C/m2. The pH level was set in the range of 5 to 9. Finally, the asymmetric thermal (298 K and 298 + ΔT K) was set as the reservoir room temperature and the reservoir high temperature, respectively (See Table 1). Full details of the simulation process are also mentioned in our previous studies [10,14].

3. Results and Discussion

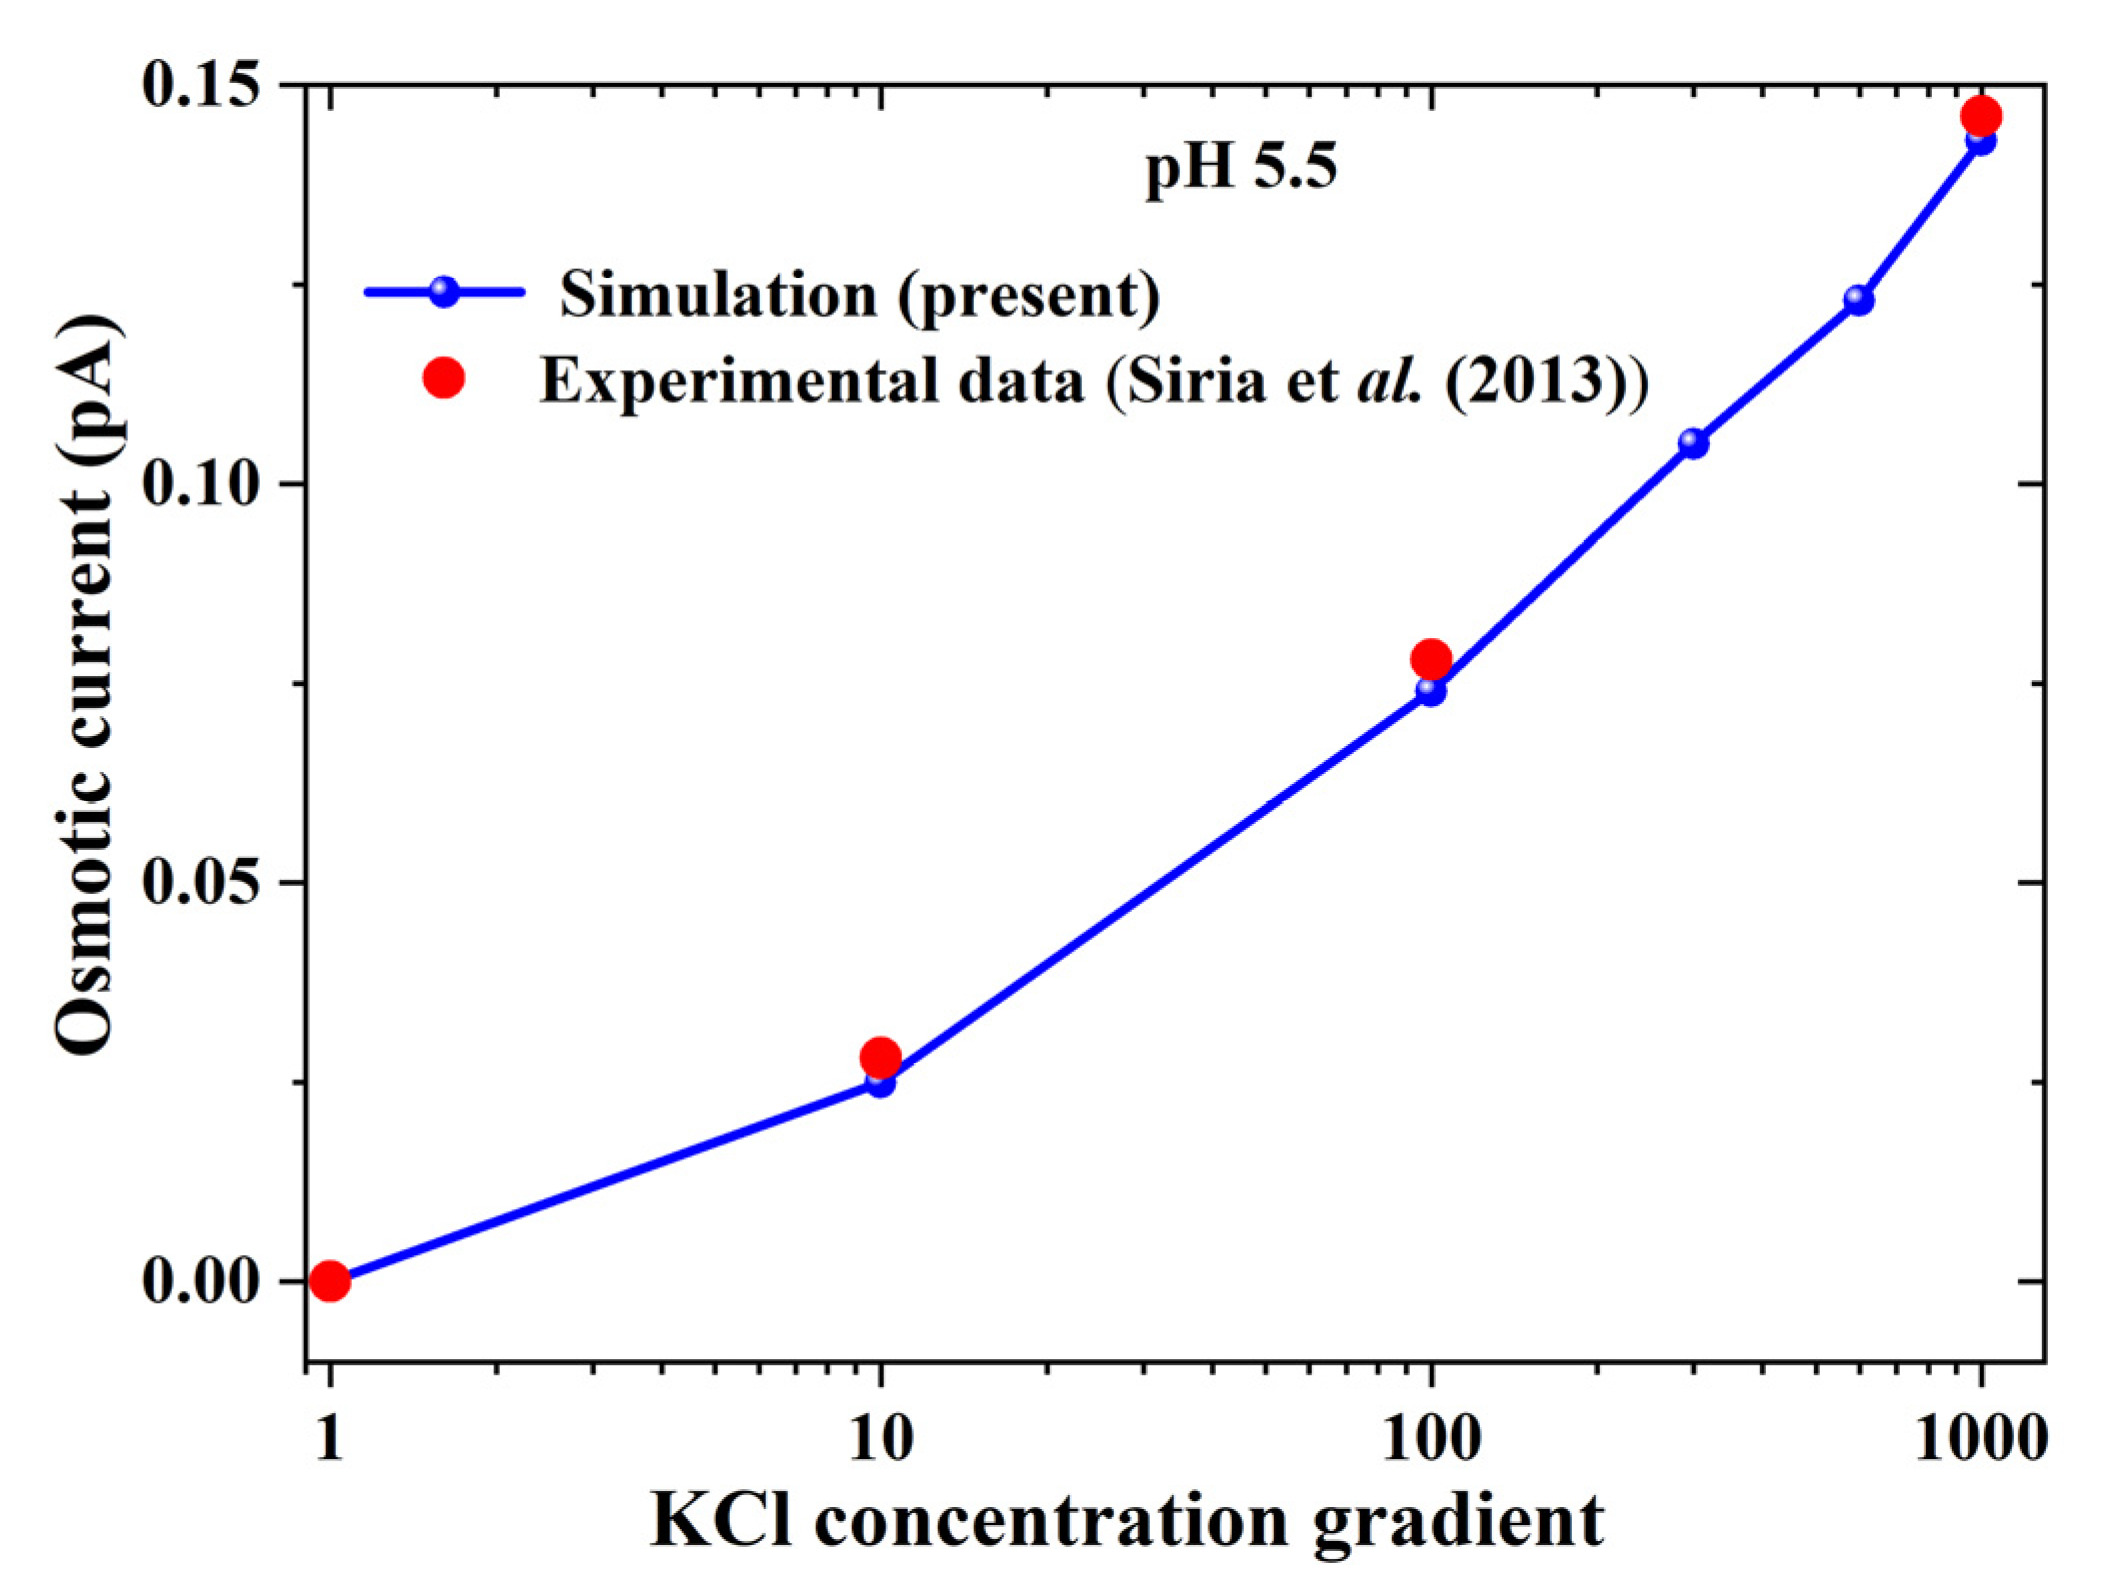
3.1. Verifying Numerical Simulation

To verify the numerical setting, the simulation results based on the coupled Poisson–Nernst–Plank and Navier–Stokes equations (PNP-NS) were first compared with the experimental data [41] (see Figure 3). The experiment used a boron nitride nanotube with a diameter of 40 nm and a length of 1250 nm. The results refer to a KCl solution with pH = 5.5, hence, four species (K+, H+, Cl and OH) appeared in the system. The surface charge density is set as 18 sites/nm2 in accordance with the prediction of Siria et al. (2013) [41]. The pH condition used in the verification case will be applied in our simulation. Note that our simulation cases further explore the coupling effect of heat transfer and pH environment in ion transport.

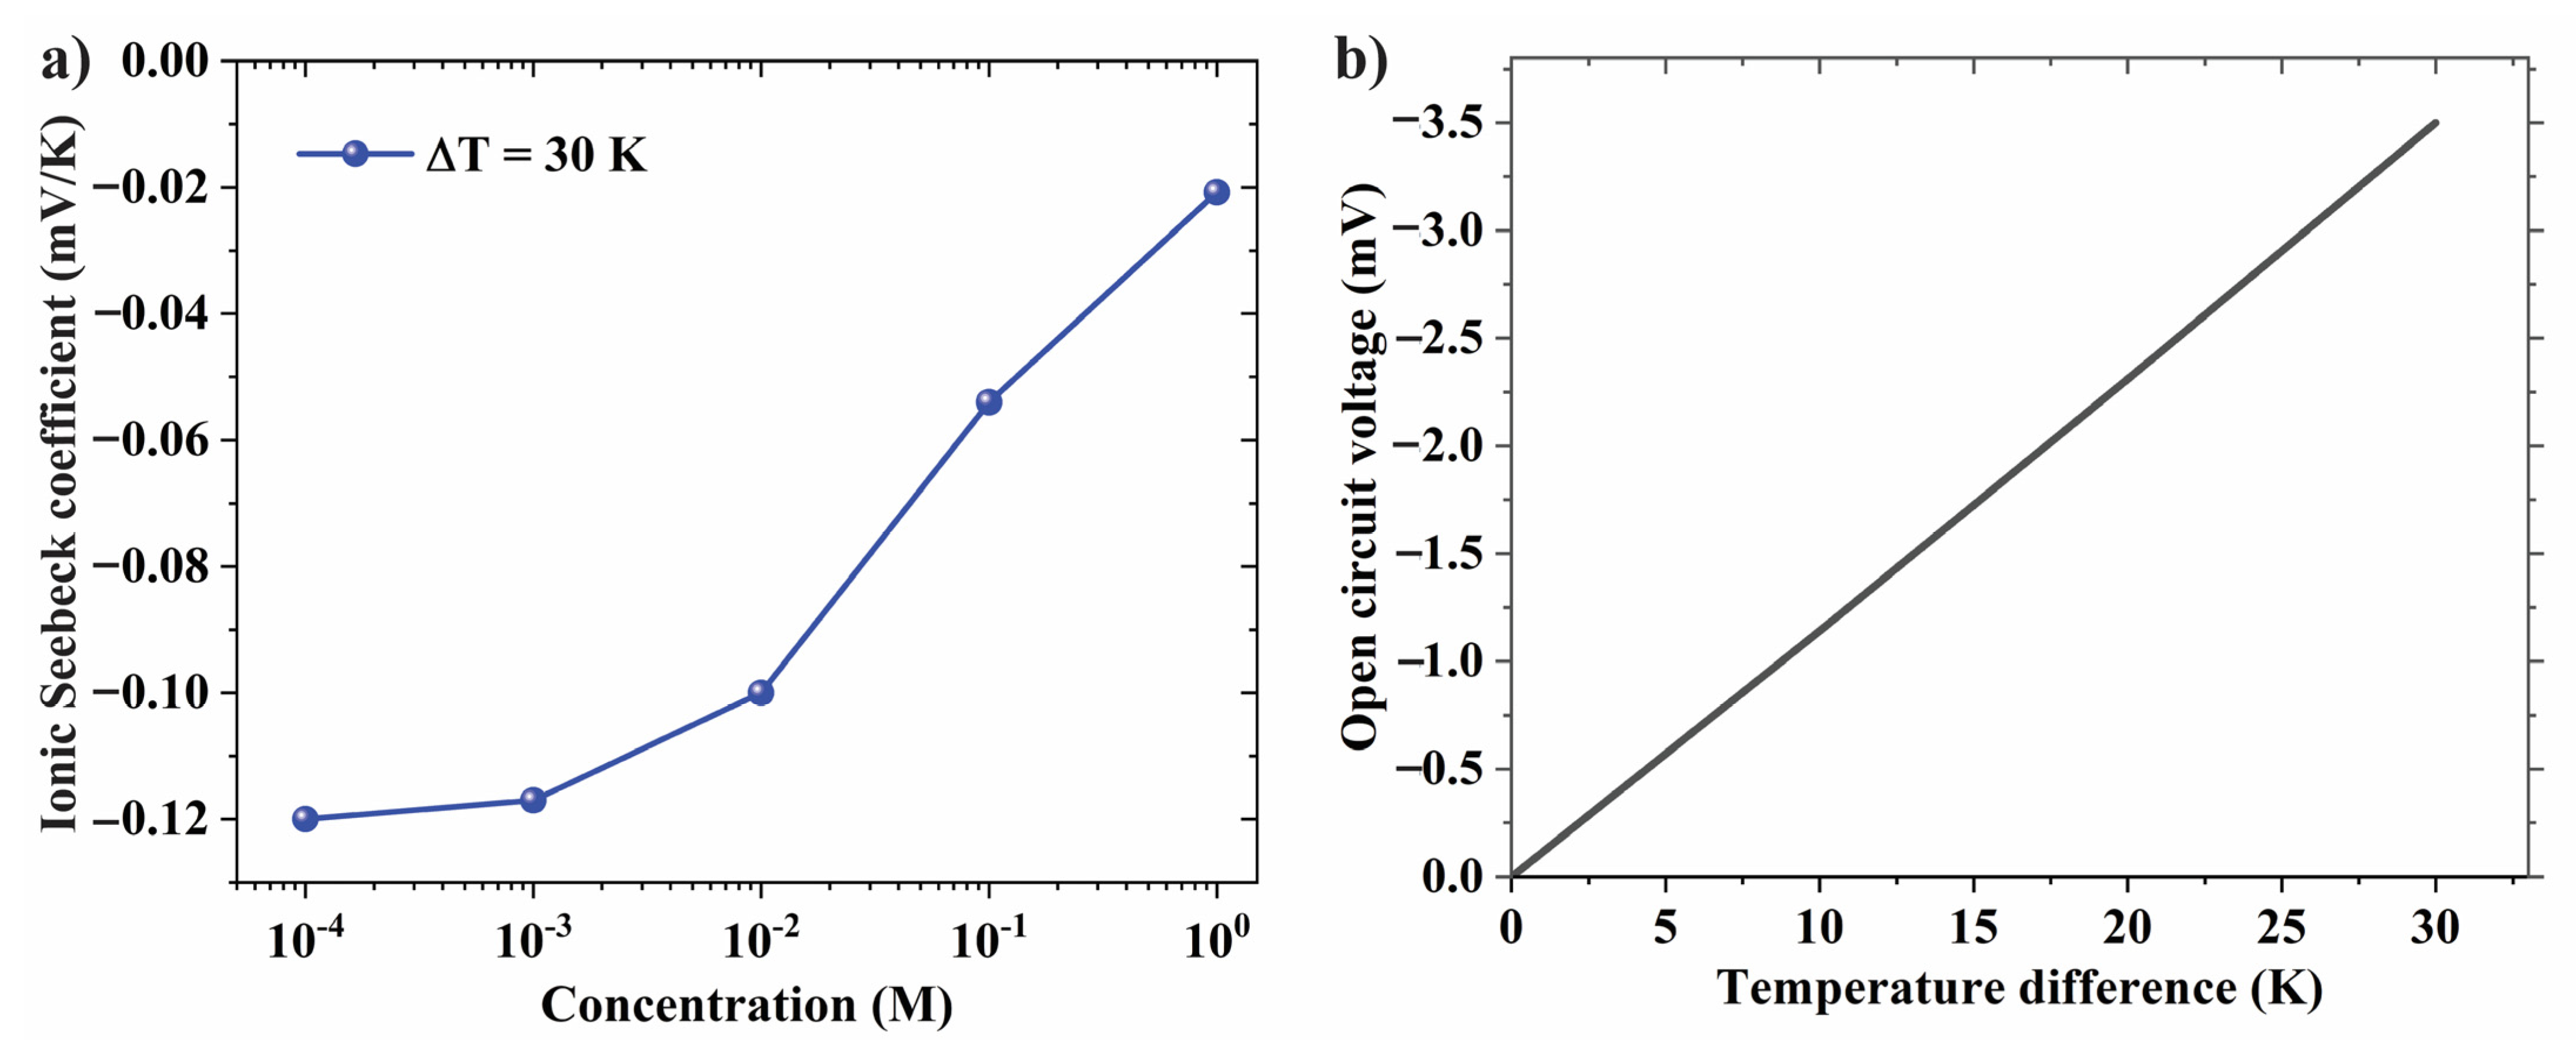
3.2. Effect of Electrolyte Concentration on Ionic Seebeck Coefficient

Figure 4a shows the ionic Seebeck coefficient as a function of the concentration gradient. Note that the ionic Seebeck coefficient is defined as the ratio of voltage difference ΔV and temperature difference ΔT between the two ends of reservoirs as S = Δ V Δ T . As the concentration increases from 10−4 M to 10−3 M, the ionic Seebeck coefficient slowly goes down from −0.12 to −0.117. The ionic Seebeck coefficient noticeably drops as concentration further increases to 10−2 M. The reason is due to the overlapped electrical double layer (EDL) occurring in the confined space of the nanopore. As the concentration increases, the EDL thickness decreases, resulting in lower ion selectivity and more co-ions (e.g., Cl) being transferred to the hot side compared to the overlapped EDL case. As a result, the thermos-electric voltage is reduced as the concentration increases. Therefore, we will choose the concentration of 10−3 M or 10−4 M for further analysis. Figure 4b shows the linear relationship between the open-circuit voltage and the temperature at the KCl concentration of 10−4 M and pH 5.5. The corresponding slope, which represents thermosensation selectivity, is obtained to be −0.12 mV K−1.

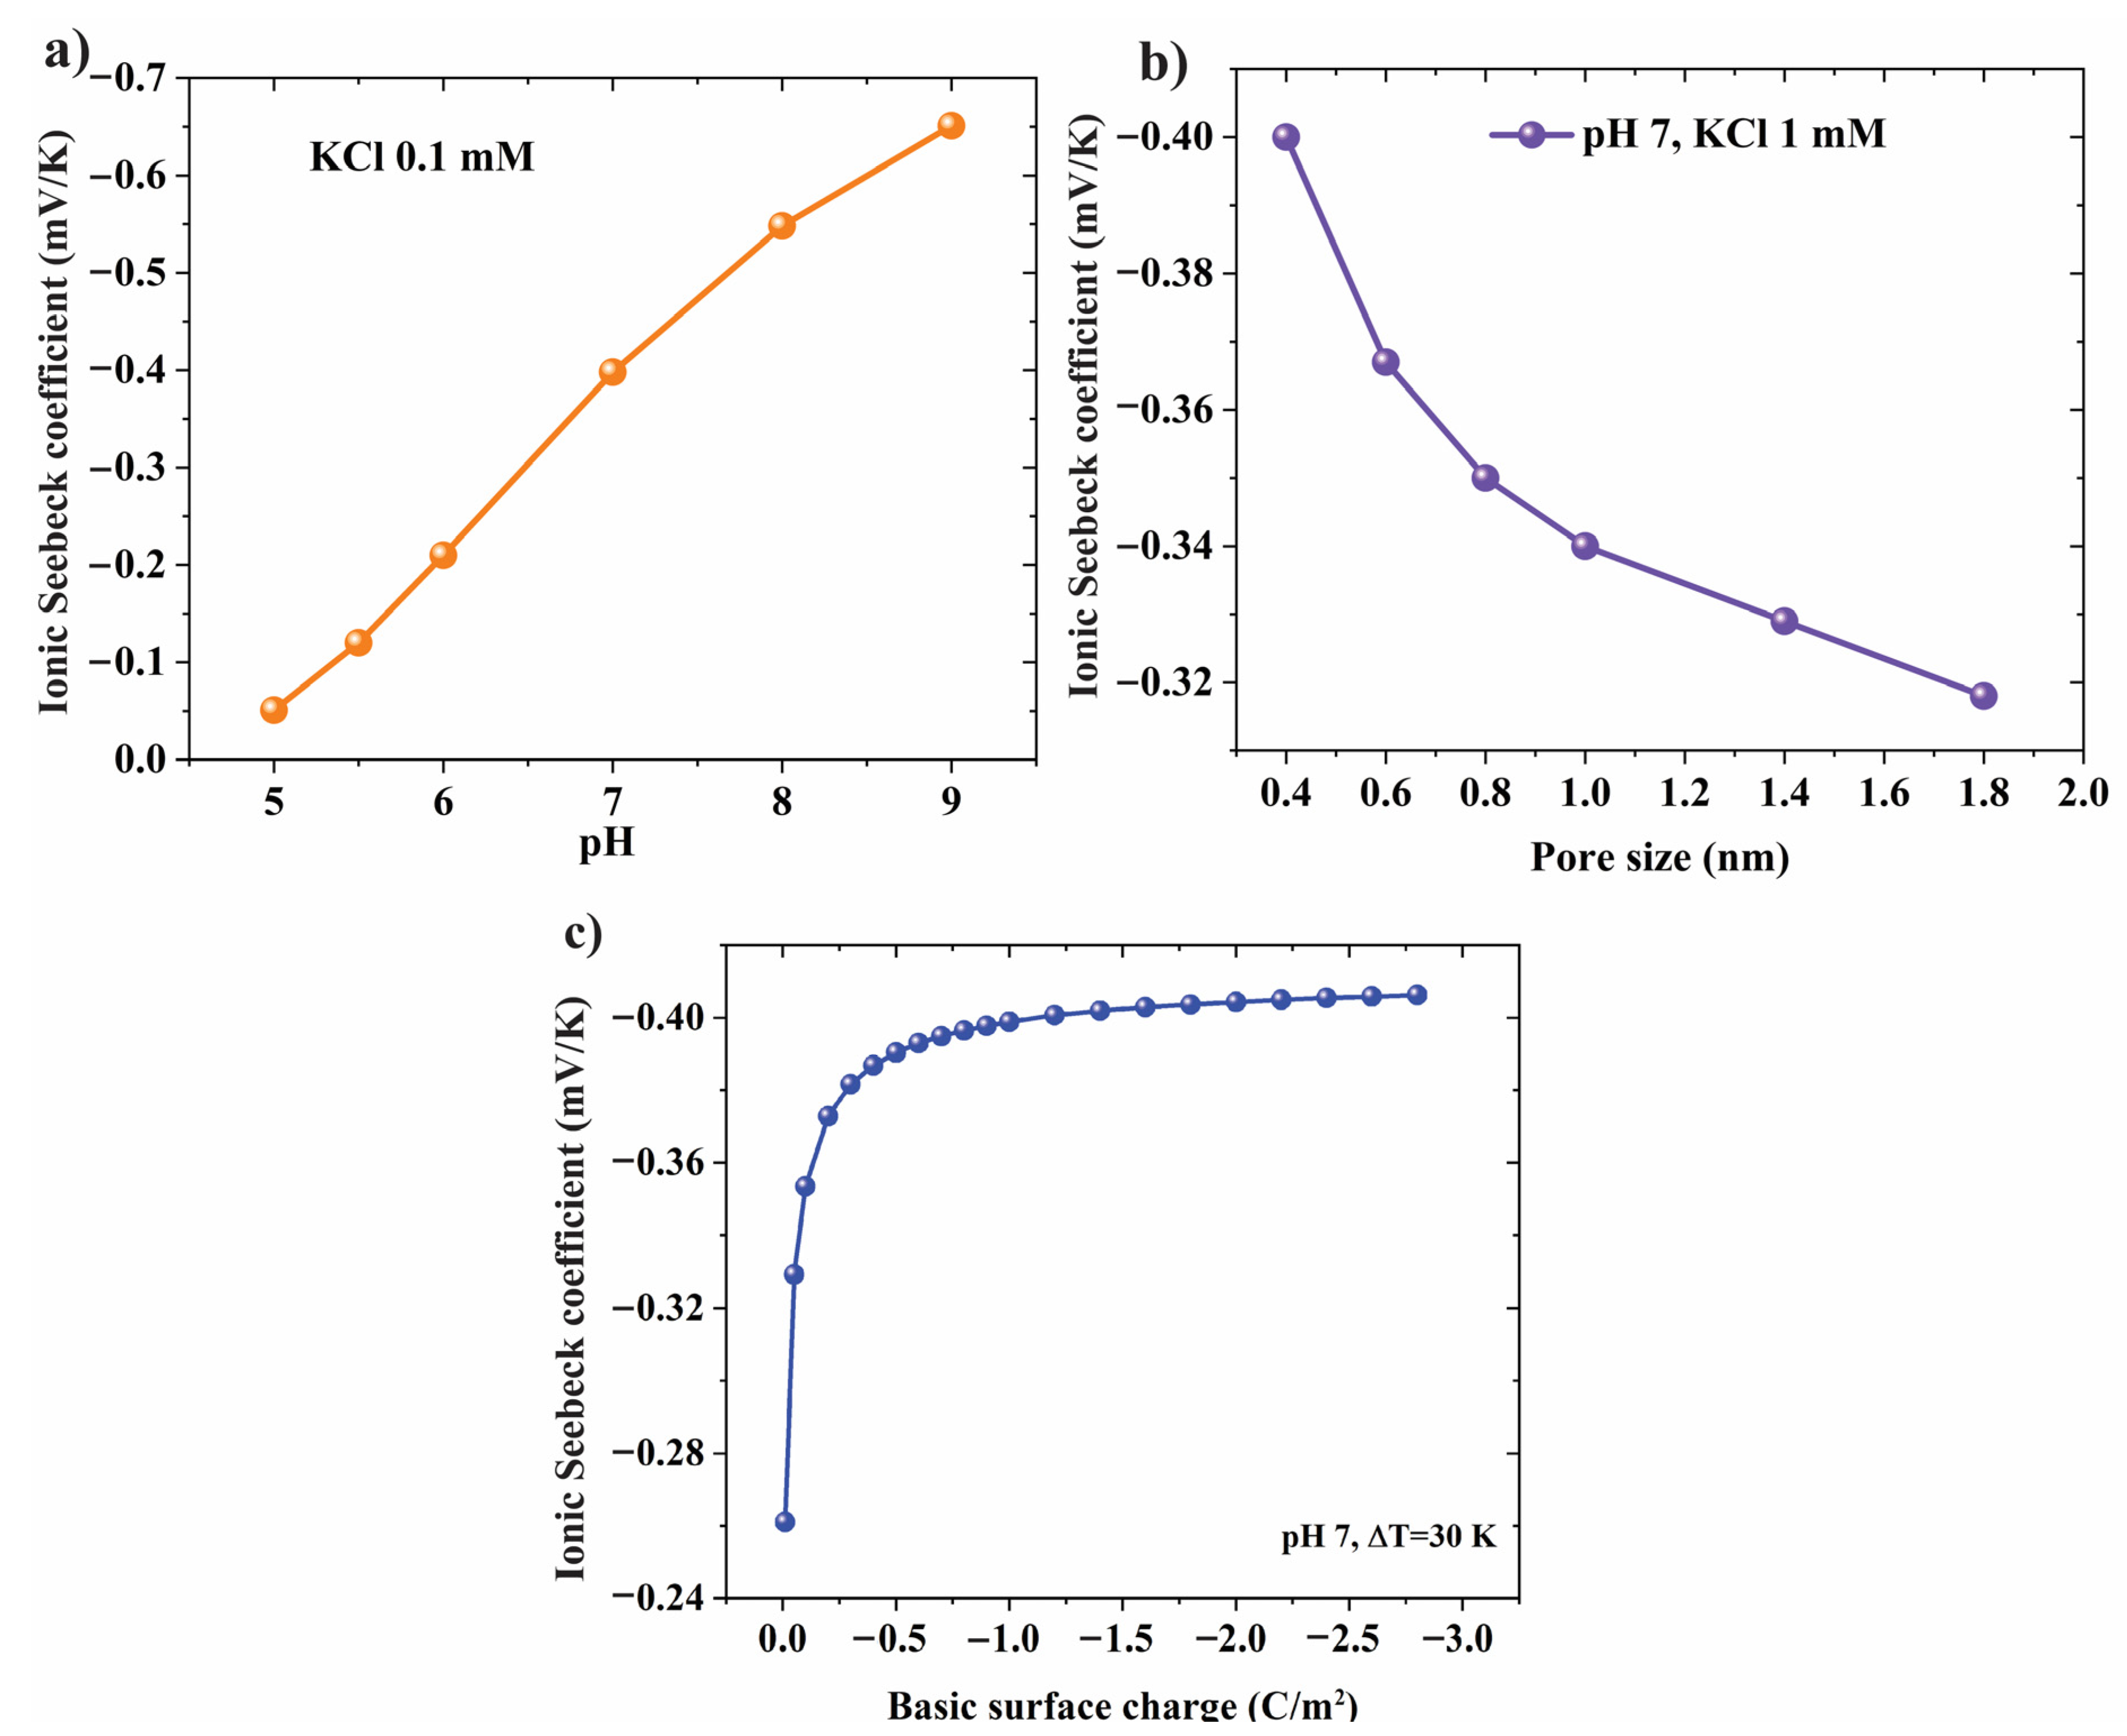
3.3. Effect of pH Level and Pore Structure on Ionic Seebeck Coefficient

Surface charge density has a significant impact on ion transport phenomena through nanopore membranes. The pH environment directly influences the deprotonation reaction on the surface of the membrane resulting in the change in the number of charge sites per nm2. Figure 5a shows the ionic Seebeck coefficient increases 13 times as the pH level increases from 5 to 9. Therefore, choosing high-surface charge materials and a high-pH environment are suggested to enhance thermoelectric performance. Pore or layer distance is also an important factor for boosting the Seebeck coefficient. Theoretically, ion transport in small pore size leads to the overlap of the EDL in nanochannels. Figure 5b shows that the ionic Seebeck coefficient decreases as pore size increases. Hence, using a confined membrane with sub-1 nm can take advantage of the confined space for thermo-osmotic ion transport. The thermos-electric performance is dramatically reduced as the layer distance or pore space increases. Figure 5c shows that the ionic Seebeck climbs remarkably as the magnitude of the surface charge increase from 0.01 to 0.3 C/m2, and then the ionic Seebeck saturates as the surface charge further increases.

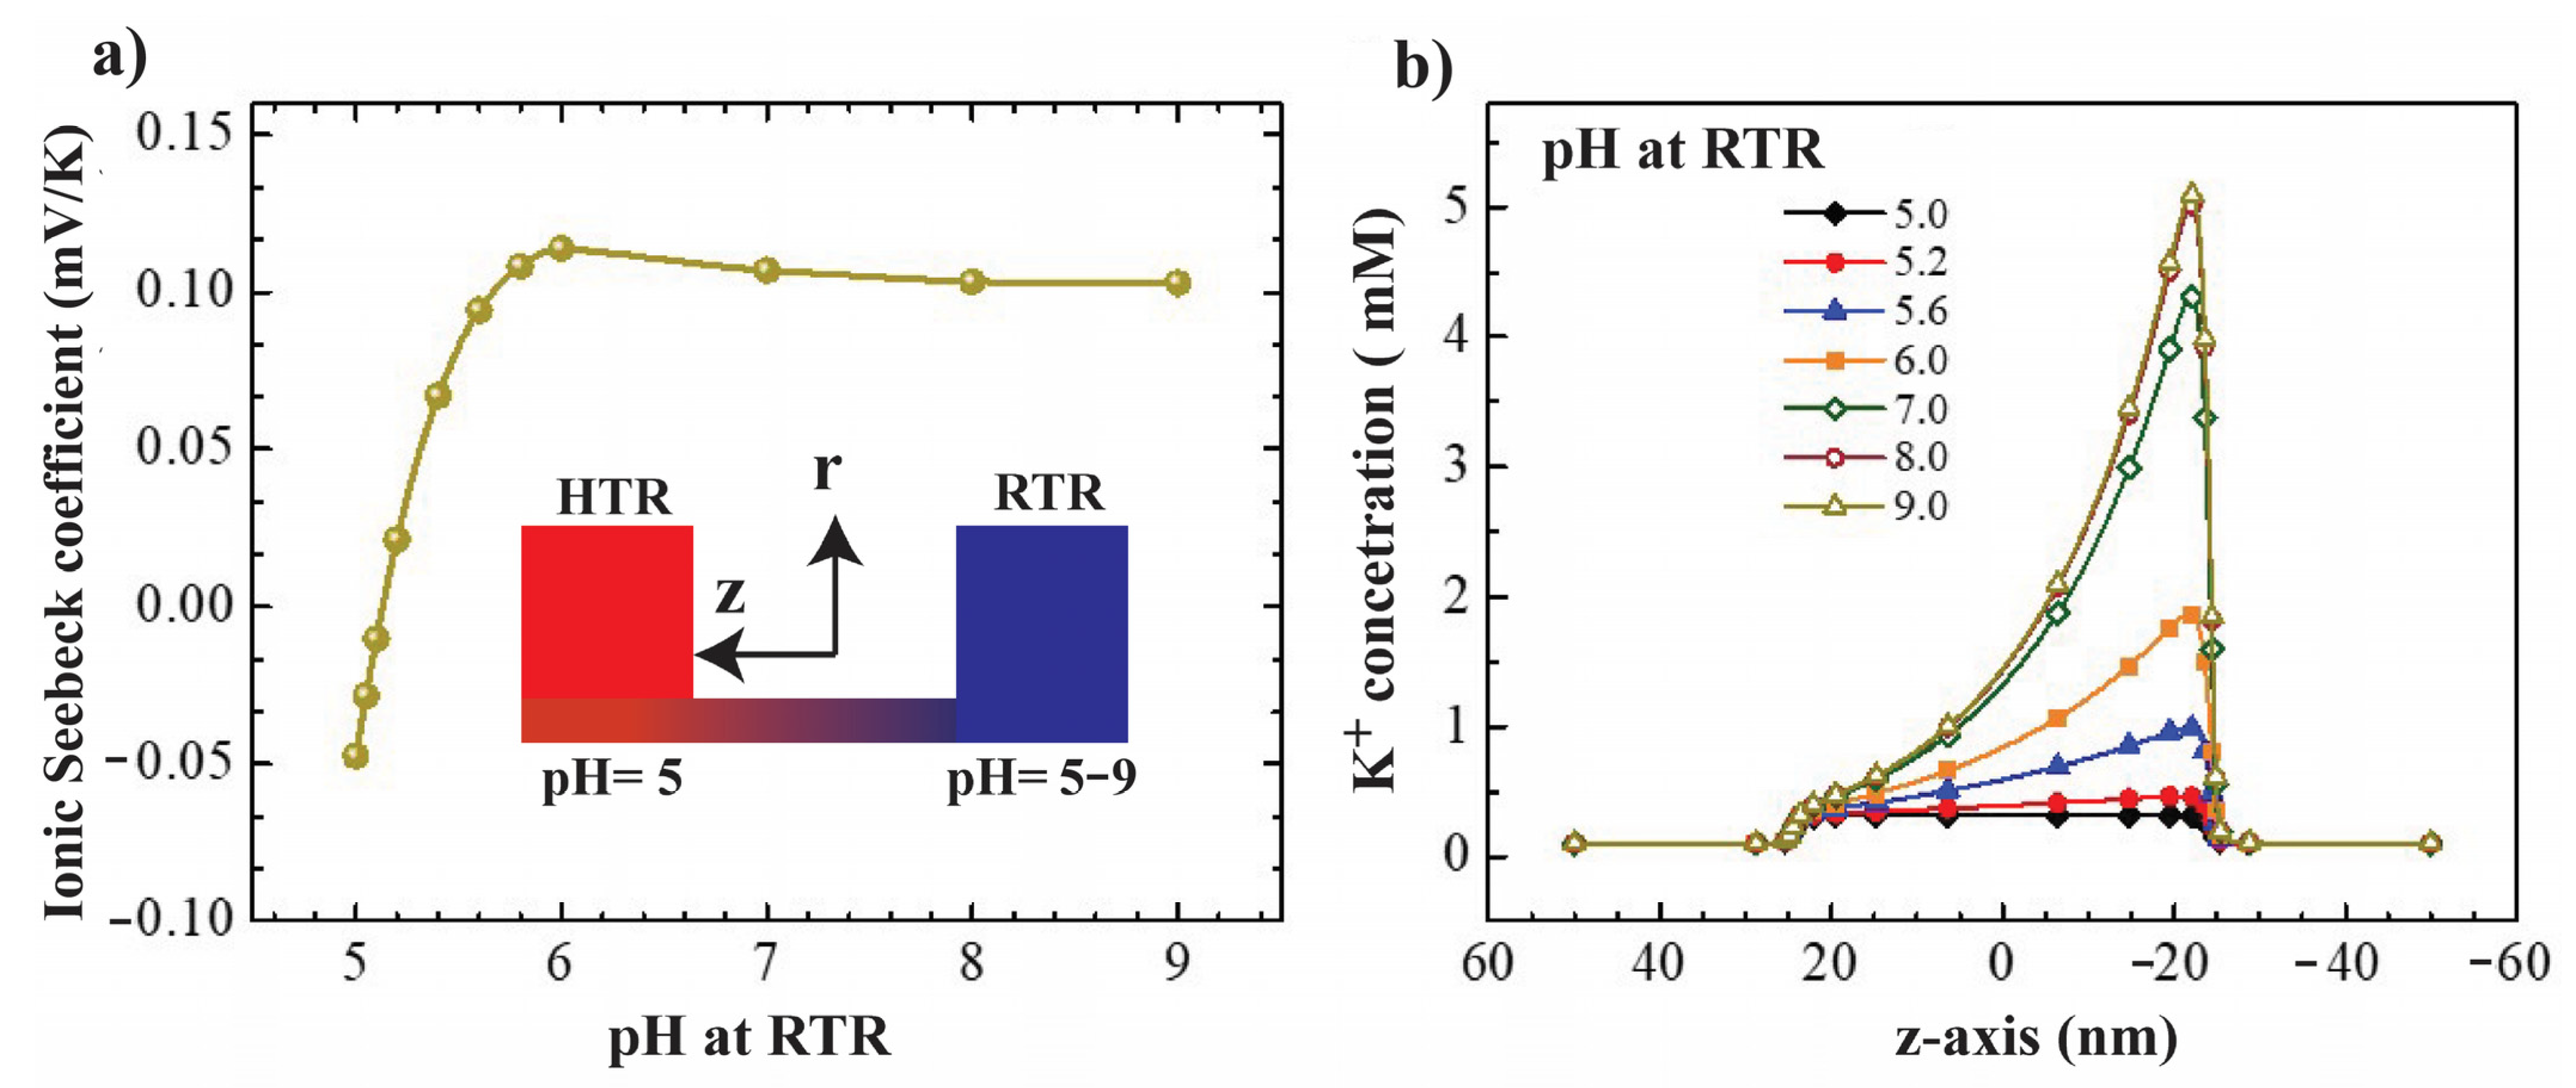
3.4. Effect of pH Gradient on Thermo-Osmosis

To explore the effect of pH on thermo-osmotic ion transport in confined nanopore, simulations with different pH condition between two reservoirs are proposed. In case 1, the pH level at the high temperature reservoir (HTR) is fixed at 5.0, while the pH at the room temperature reservoir (RTR) is varied from 5 to 9. Figure 6a shows that the ionic Seebeck coefficient is changed from −0.05 to 0.1 as the pH level increases from 5.1 to 6.0 and then saturates as the pH level further increases from 6 to 9. A High pH level in the RTR induces more cation (e.g., K+) concentration gradient (see Figure 6b); however, it fails to increase the ionic Seebeck coefficient. To explain this saturation, we switch the pH level setting by fixing the pH 5 at RTR and varying pH at HTR, namely case 2.
In case 2, the pH level at the RTR was fixed at 5.0 while the pH level at the HTR varied from 5 to 9. Figure 7a shows that the magnitude of ionic Seebeck coefficient increases around eight times (from 0.05 to 0.415) as the pH level at the HTR increased from 5 to 7, and then slightly increases as the pH further increases to 9. Figure 7b shows the potassium concentrations along the centreline of nanopore. More K+ ion is attracted to the nanopore and then flows to the HTR as the high pH is set at the HTR. Moreover, the thermo-osmotic ion-transport is significantly enhanced, resulting in an increase in fluid flow through the nanopore from the RTR to the HTR (see Figure 7c,d). Overall, we explore that the effect of the pH on improving the ionic Seebeck coefficient in confined nanopore mainly contributed as a high pH level is set at the HTR.

4. Conclusions

In summary, we have demonstrated the thermo-osmostic conversion in a confined space. The effect of the pH environment on the charge-regulation material is examined. The results show that the highest ionic Seebeck coefficient of −0.64 mV/K is obtained at the concentration of 10−4 M KCl solution, pH 9, and it rapidly decreases as the concentration further increases. The improvement in the thermo-osmosis performance is mainly contributed by the charge-regulation under the effect of a high-pH environment or small confined space in nanopores. These findings confirm the feasibility of using pH in charge-regulation in the confined pore to enhance the thermo-osmosis performance.

Author Contributions

Conceptualization, V.-P.M. and R.-J.Y.; Data Curation and Methodology, V.-P.M. and W.-H.H.; Writing—Original Draft, V.-P.M.; Writing—Review and Editing, R.-J.Y.; Simulation, V.-P.M. and W.-H.H.; Funding Acquisition, R.-J.Y.; Project Administration, R.-J.Y. All authors have read and agreed to the published version of the manuscript.

Funding

This work was funded by the financial support provided for this study by the Ministry of Science and Technology (MOST) of Taiwan, grant number MOST-110-2221-E-006-134-MY2, MOST-110-2811-E-006-518 and MOST-110-2221-E-006-134-MY2.

Institutional Review Board Statement

Not applicable.

Informed Consent Statement

Not applicable.

Data Availability Statement

Data will be provided via requests to the corresponding author.

Conflicts of Interest

The authors declare that they have no known competing financial interests or personal relationships that could have appeared to influence the work reported in this paper.

References

  1. Laing, T. Solar power challenges. Nat. Sustain. 2022, 5, 285–286. [Google Scholar] [CrossRef]
  2. Bu, Z.; Zhang, X.; Hu, Y.; Chen, Z.; Lin, S.; Li, W.; Xiao, C.; Pei, Y. A record thermoelectric efficiency in tellurium-free modules for low-grade waste heat recovery. Nat. Commun. 2022, 13, 237. [Google Scholar] [CrossRef] [PubMed]
  3. Jouhara, H.; Khordehgah, N.; Almahmoud, S.; Delpech, B.; Chauhan, A.; Tassou, S.A. Waste heat recovery technologies and applications. Therm. Sci. Eng. Prog. 2018, 6, 268–289. [Google Scholar] [CrossRef]
  4. Rodríguez-Gutiérrez, I.; Bedin, K.C.; Mouriño, B.; Souza Junior, J.B.; Souza, F.L. Advances in Engineered Metal Oxide Thin Films by Low-Cost, Solution-Based Techniques for Green Hydrogen Production. Nanomaterials 2022, 12, 1957. [Google Scholar] [CrossRef]
  5. Chang, C.-C. Asymmetric Electrokinetic Energy Conversion in Slip Conical Nanopores. Nanomaterials 2022, 12, 1100. [Google Scholar] [CrossRef]
  6. Sun, Y.Y.; Mai, V.P.; Yang, R.J. Effects of electrode placement position and tilt angles of a platform on voltage induced by NaCl electrolyte flowing over graphene wafer. Appl. Energy 2020, 261, 114435. [Google Scholar] [CrossRef]
  7. Yeh, L.H.; Huang, Z.Y.; Liu, Y.C.; Deng, M.J.; Chou, T.H.; Yang, H.C.; Ahamad, T.; Alshehri, S.M.; Wu, K.C. A nanofluidic osmotic power generator demonstrated in polymer gel electrolytes with substantially enhanced performance. J. Mater. Chem. A 2019, 7, 26791–26796. [Google Scholar] [CrossRef]
  8. Jiang, T.; Pang, H.; An, J.; Lu, P.; Feng, Y.; Liang, X.; Zhong, W.; Wang, Z.L. Robust Swing-Structured Triboelectric Nanogenerator for Efficient Blue Energy Harvesting. Adv. Energy Mater. 2020, 10, 2000064. [Google Scholar] [CrossRef]
  9. Zhai, L.; Gao, L.; Wang, Z.; Dai, K.; Wu, S.; Mu, X. An Energy Harvester Coupled with a Triboelectric Mechanism and Electrostatic Mechanism for Biomechanical Energy Harvesting. Nanomaterials 2022, 12, 933. [Google Scholar] [CrossRef]
  10. Mai, V.-P.; Yang, R.-J. Boosting power generation from salinity gradient on high-density nanoporous membrane using thermal effect. Appl. Energy 2020, 274, 115294. [Google Scholar] [CrossRef]
  11. Li, J.; Zhang, Z.; Zhao, R.; Zhang, B.; Liang, Y.; Long, R.; Liu, W.; Liu, Z. Stack Thermo-Osmotic System for Low-Grade Thermal Energy Conversion. ACS Appl. Mater. Interfaces 2021, 13, 21371–21378. [Google Scholar] [CrossRef]
  12. Chen, K.; Yao, L.; Yan, F.; Liu, S.; Yang, R.; Su, B. Thermo-osmotic energy conversion and storage by nanochannels. J. Mater. Chem. A 2019, 7, 25258–25261. [Google Scholar] [CrossRef]
  13. Zhang, W.; Wang, Q.; Zeng, M.; Zhao, C. Thermoelectric effect and temperature-gradient-driven electrokinetic flow of electrolyte solutions in charged nanocapillaries. Int. J. Heat Mass Transfer. 2019, 143, 118569. [Google Scholar] [CrossRef]
  14. Mai, V.-P.; Yang, R.-J. Active control of salinity-based power generation in nanopores using thermal and pH effects. RSC Adv. 2020, 10, 18624–18631. [Google Scholar] [CrossRef]
  15. Yeh, L.-H.; Chen, F.; Chiou, Y.-T.; Su, Y.-S. Anomalous pH-Dependent Nanofluidic Salinity Gradient Power. Small 2017, 13, 1702691. [Google Scholar] [CrossRef]
  16. Mai, V.-P.; Huang, W.-H.; Yang, R.-J. Enhancing Ion Transport through Nanopores in Membranes for Salinity Gradient Power Generation. ACS EST Eng. 2021, 1, 1725–1752. [Google Scholar] [CrossRef]
  17. Zhang, Z.; Shen, W.; Lin, L.; Wang, M.; Li, N.; Zheng, Z.; Liu, F.; Cao, L. Vertically Transported Graphene Oxide for High-Performance Osmotic Energy Conversion. Adv. Sci. 2020, 7, 2000286. [Google Scholar]
  18. Su, S.; Sun, Q.; Gu, X.; Xu, Y.; Shen, J.; Zhu, D.; Chao, J.; Fan, C.; Wang, L. Two-dimensional nanomaterials for biosensing applications. TrAC Trends Anal. Chem. 2019, 119, 115610. [Google Scholar] [CrossRef]
  19. Dietzel, M.; Hardt, S. Thermoelectricity in confined liquid electrolytes. Phys. Rev. Lett. 2016, 116, 225901. [Google Scholar] [CrossRef] [PubMed]
  20. Ghonge, T.; Chakraborty, J.; Dey, R.; Chakraborty, S. Electrohydrodynamics within the electrical double layer in the presence of finite temperature gradients. Phys. Rev. E 2013, 88, 053020. [Google Scholar] [CrossRef]
  21. Di Lecce, S.; Bresme, F. Thermal polarization of water influences the thermoelectric response of aqueous solutions. J. Phys. Chem. B 2018, 122, 1662–1668. [Google Scholar] [CrossRef] [PubMed]
  22. Rahman, M.; Saghir, M. Thermodiffusion or Soret effect: Historical review. Int. J. Heat Mass Transfer. 2014, 73, 693–705. [Google Scholar] [CrossRef]
  23. Hernández, A.; Arcos, J.; Martínez-Trinidad, J.; Bautista, O.; Sánchez, S.; Méndez, F. Thermodiffusive effect on the local Debye-length in an electroosmotic flow of a viscoelastic fluid in a slit microchannel. Int. J. Heat Mass Transf. 2022, 187, 122522. [Google Scholar] [CrossRef]
  24. Würger, A. Transport in charged colloids driven by thermoelectricity. Phys. Rev. Lett. 2008, 101, 108302. [Google Scholar] [CrossRef] [PubMed]
  25. Fu, L.; Merabia, S.; Joly, L. What controls thermo-osmosis? Molecular simulations show the critical role of interfacial hydrodynamics. Phys. Rev. Lett. 2017, 119, 214501. [Google Scholar] [CrossRef]
  26. Fu, L.; Joly, L.; Merabia, S. Giant thermoelectric response of nanofluidic systems driven by water excess enthalpy. Phys. Rev. Lett. 2019, 123, 138001. [Google Scholar] [CrossRef]
  27. Herrero, C.; de San Feliciano, M.; Merabia, S.; Joly, L. Fast and versatile thermo-osmotic flows with a pinch of salt. Nanoscale 2022, 14, 626–631. [Google Scholar] [CrossRef]
  28. Wang, X.; Liu, M.; Jing, D.; Mohamad, A.; Prezhdo, O. Net unidirectional fluid transport in locally heated nanochannel by thermo-osmosis. Nano Lett. 2020, 20, 8965–8971. [Google Scholar] [CrossRef]
  29. Zuo, X.; Zhu, C.; Xian, W.; Meng, Q.W.; Guo, Q.; Zhu, X.; Wang, S.; Wang, Y.; Ma, S.; Sun, Q. Thermo-Osmotic Energy Conversion Enabled by Covalent-Organic-Framework Membranes with Record Output Power Density. Angew. Chem. Int. Ed. 2022, 61, e202116910. [Google Scholar] [CrossRef]
  30. Li, T.; Zhang, X.; Lacey, S.D.; Mi, R.; Zhao, X.; Jiang, F.; Song, J.; Liu, Z.; Chen, G.; Dai, J.; et al. Cellulose ionic conductors with high differential thermal voltage for low-grade heat harvesting. Nat. Mater. 2019, 18, 608–613. [Google Scholar] [CrossRef]
  31. Liu, Z.; Cheng, H.; Le, Q.; Chen, R.; Li, J.; Ouyang, J. Giant Thermoelectric Properties of Ionogels with Cationic Doping. Adv. Energy Mater. 2022, 12, 2200858. [Google Scholar] [CrossRef]
  32. Chen, W.Q.; Sedighi, M.; Jivkov, A.P. Thermo-osmosis in hydrophilic nanochannels: Mechanism and size effect. Nanoscale 2021, 13, 1696–1716. [Google Scholar] [CrossRef] [PubMed]
  33. Zhang, W.; Farhan, M.; Jiao, K.; Qian, F.; Guo, P.; Wang, Q.; Yang, C.C.; Zhao, C. Simultaneous thermoosmotic and thermoelectric responses in nanoconfined electrolyte solutions: Effects of nanopore structures and membrane properties. J. Colloid. Interface Sci. 2022, 618, 333–351. [Google Scholar] [CrossRef] [PubMed]
  34. Zhang, M.; Guan, K.; Ji, Y.; Liu, G.; Jin, W.; Xu, N. Controllable ion transport by surface-charged graphene oxide membrane. Nat. Commun. 2019, 10, 1253. [Google Scholar] [CrossRef]
  35. Su, Y.-S.; Hsu, S.-C.; Peng, P.-H.; Yang, J.-Y.; Gao, M.; Yeh, L.-H. Unraveling the anomalous channel-length-dependent blue energy conversion using engineered alumina nanochannels. Nano Energy 2021, 84, 105930. [Google Scholar] [CrossRef]
  36. Liu, W.-D.; Yang, L.; Chen, Z.-G. Cu2Se thermoelectrics: Property, methodology, and device. Nano Today 2020, 35, 100938. [Google Scholar] [CrossRef]
  37. Konkena, B.; Vasudevan, S. Understanding Aqueous Dispersibility of Graphene Oxide and Reduced Graphene Oxide through pKa Measurements. J. Phys. Chem. Lett. 2012, 3, 867–872. [Google Scholar] [CrossRef]
  38. Orth, E.S.; Ferreira, J.G.; Fonsaca, J.E.; Blaskievicz, S.F.; Domingues, S.H.; Dasgupta, A.; Terrones, M.; Zarbin, A.J. pKa determination of graphene-like materials: Validating chemical functionalization. J. Colloid. Interface Sci. 2016, 467, 239–244. [Google Scholar] [CrossRef]
  39. Hsu, J.-P.; Su, T.-C.; Peng, P.-H.; Hsu, S.-C.; Zheng, M.-J.; Yeh, L.-H. Unraveling the Anomalous Surface-Charge-Dependent Osmotic Power Using a Single Funnel-Shaped Nanochannel. ACS Nano 2019, 13, 13374–13381. [Google Scholar] [CrossRef]
  40. Tsai, P.-C.; Su, Y.-S.; Gao, M.; Yeh, L.-H. Realization of robust mesoscale ionic diodes for ultrahigh osmotic energy generation at mild neutral pH. J. Mater. Chem. A 2021, 9, 20502–20509. [Google Scholar] [CrossRef]
  41. Siria, A.; Poncharal, P.; Biance, A.L.; Fulcrand, R.; Blase, X.; Purcell, S.T.; Bocquet, L. Giant osmotic energy conversion measured in a single transmembrane boron nitride nanotube. Nature 2013, 494, 455–458. [Google Scholar] [CrossRef] [PubMed]
Figure 1. Illustration of thermal-osmotic generation using nanopore membrane.
Nanomaterials 12 02774 g001
Figure 2. Illustration of charge-regulated surface controls thermo-osmosis.
Nanomaterials 12 02774 g002
Figure 3. Comparison of present simulation and experimental results by Siria et al. [41] at pH 5.5.
Nanomaterials 12 02774 g003
Figure 4. (a) Effect of electrolyte concentration on Seebeck coefficient. (b) Linear relation between open-circuit voltage and temperature difference.
Nanomaterials 12 02774 g004
Figure 5. (a) Ionic Seebeck coefficient as functions of pH level, (b) pore size, and (c) basic surface charge.
Nanomaterials 12 02774 g005
Figure 6. (a) Ionic Seebeck coefficient as a function of pH level at RTR. (b) K+ concentrations along the centreline of nanopore with the pH level at RTR varies from 5.0 to 9.0. Note that the pH level of HTR is fixed at 5.0.
Nanomaterials 12 02774 g006
Figure 7. (a) Ionic Seebeck coefficient as a function of pH level at high-temperature reservoir. (b) K+ concentrations along the centreline of nanopore with respect to different pH levels at high-temperature reservoir. (c) Velocity of fluid flow as a function of pH level at HTR, the maximum velocity of 0.73 μm/s obtained at pH 9.0. (d) Flow field in nanopore (reservoirs are not in scale). Note that the pH level of RTR is fixed at 5.0.
Nanomaterials 12 02774 g007
Table 1. Boundary conditions for axisymmetric model.
SurfaceElectric PotentialIon TransportFlow FieldHeat Transfer
ABOpen circuit voltageConcentration of K+, Cl, H+, and OHPressure = 0298 + ΔT K
BC, FGZero charge
n . ϕ = 0
No flux
n . J i = 0
Slip Thermal insulation
CD, EFZero charge
n . ϕ = 0
No flux
n . J i = 0
No slipThermal insulation
DESurface charge density
ε 0 ε r ϕ n = σ s
No flux
n . J i = 0
No slipThermal insulation
GHGroundConcentration of K+, Cl, H+, and OHPressure = 0298 K
Publisher’s Note: MDPI stays neutral with regard to jurisdictional claims in published maps and institutional affiliations.

