In Situ Direct Monitoring of the Morphological Transformation of Single Au Nanostars Induced by Iodide through Dual-Laser Dark-Field Microscopy: Unexpected Mechanism and Sensing Applications

Abstract
:1. Introduction
2. Materials and Methods
2.1. Materials
2.2. Apparatus
2.3. Preparation of GNSs
2.4. Shape Transition of GNSs Monitored under UV–VIS Spectroscopy
2.5. Real-Time Monitoring of the Morphological Transformation of Single GNSs Induced by I− under DFM
2.6. Sensitive Detection of I− by DFM Imaging of Single GNS Nanoparticles
2.7. Selectivity
2.8. I− Detection in Real Sample
3. Results and Discussion
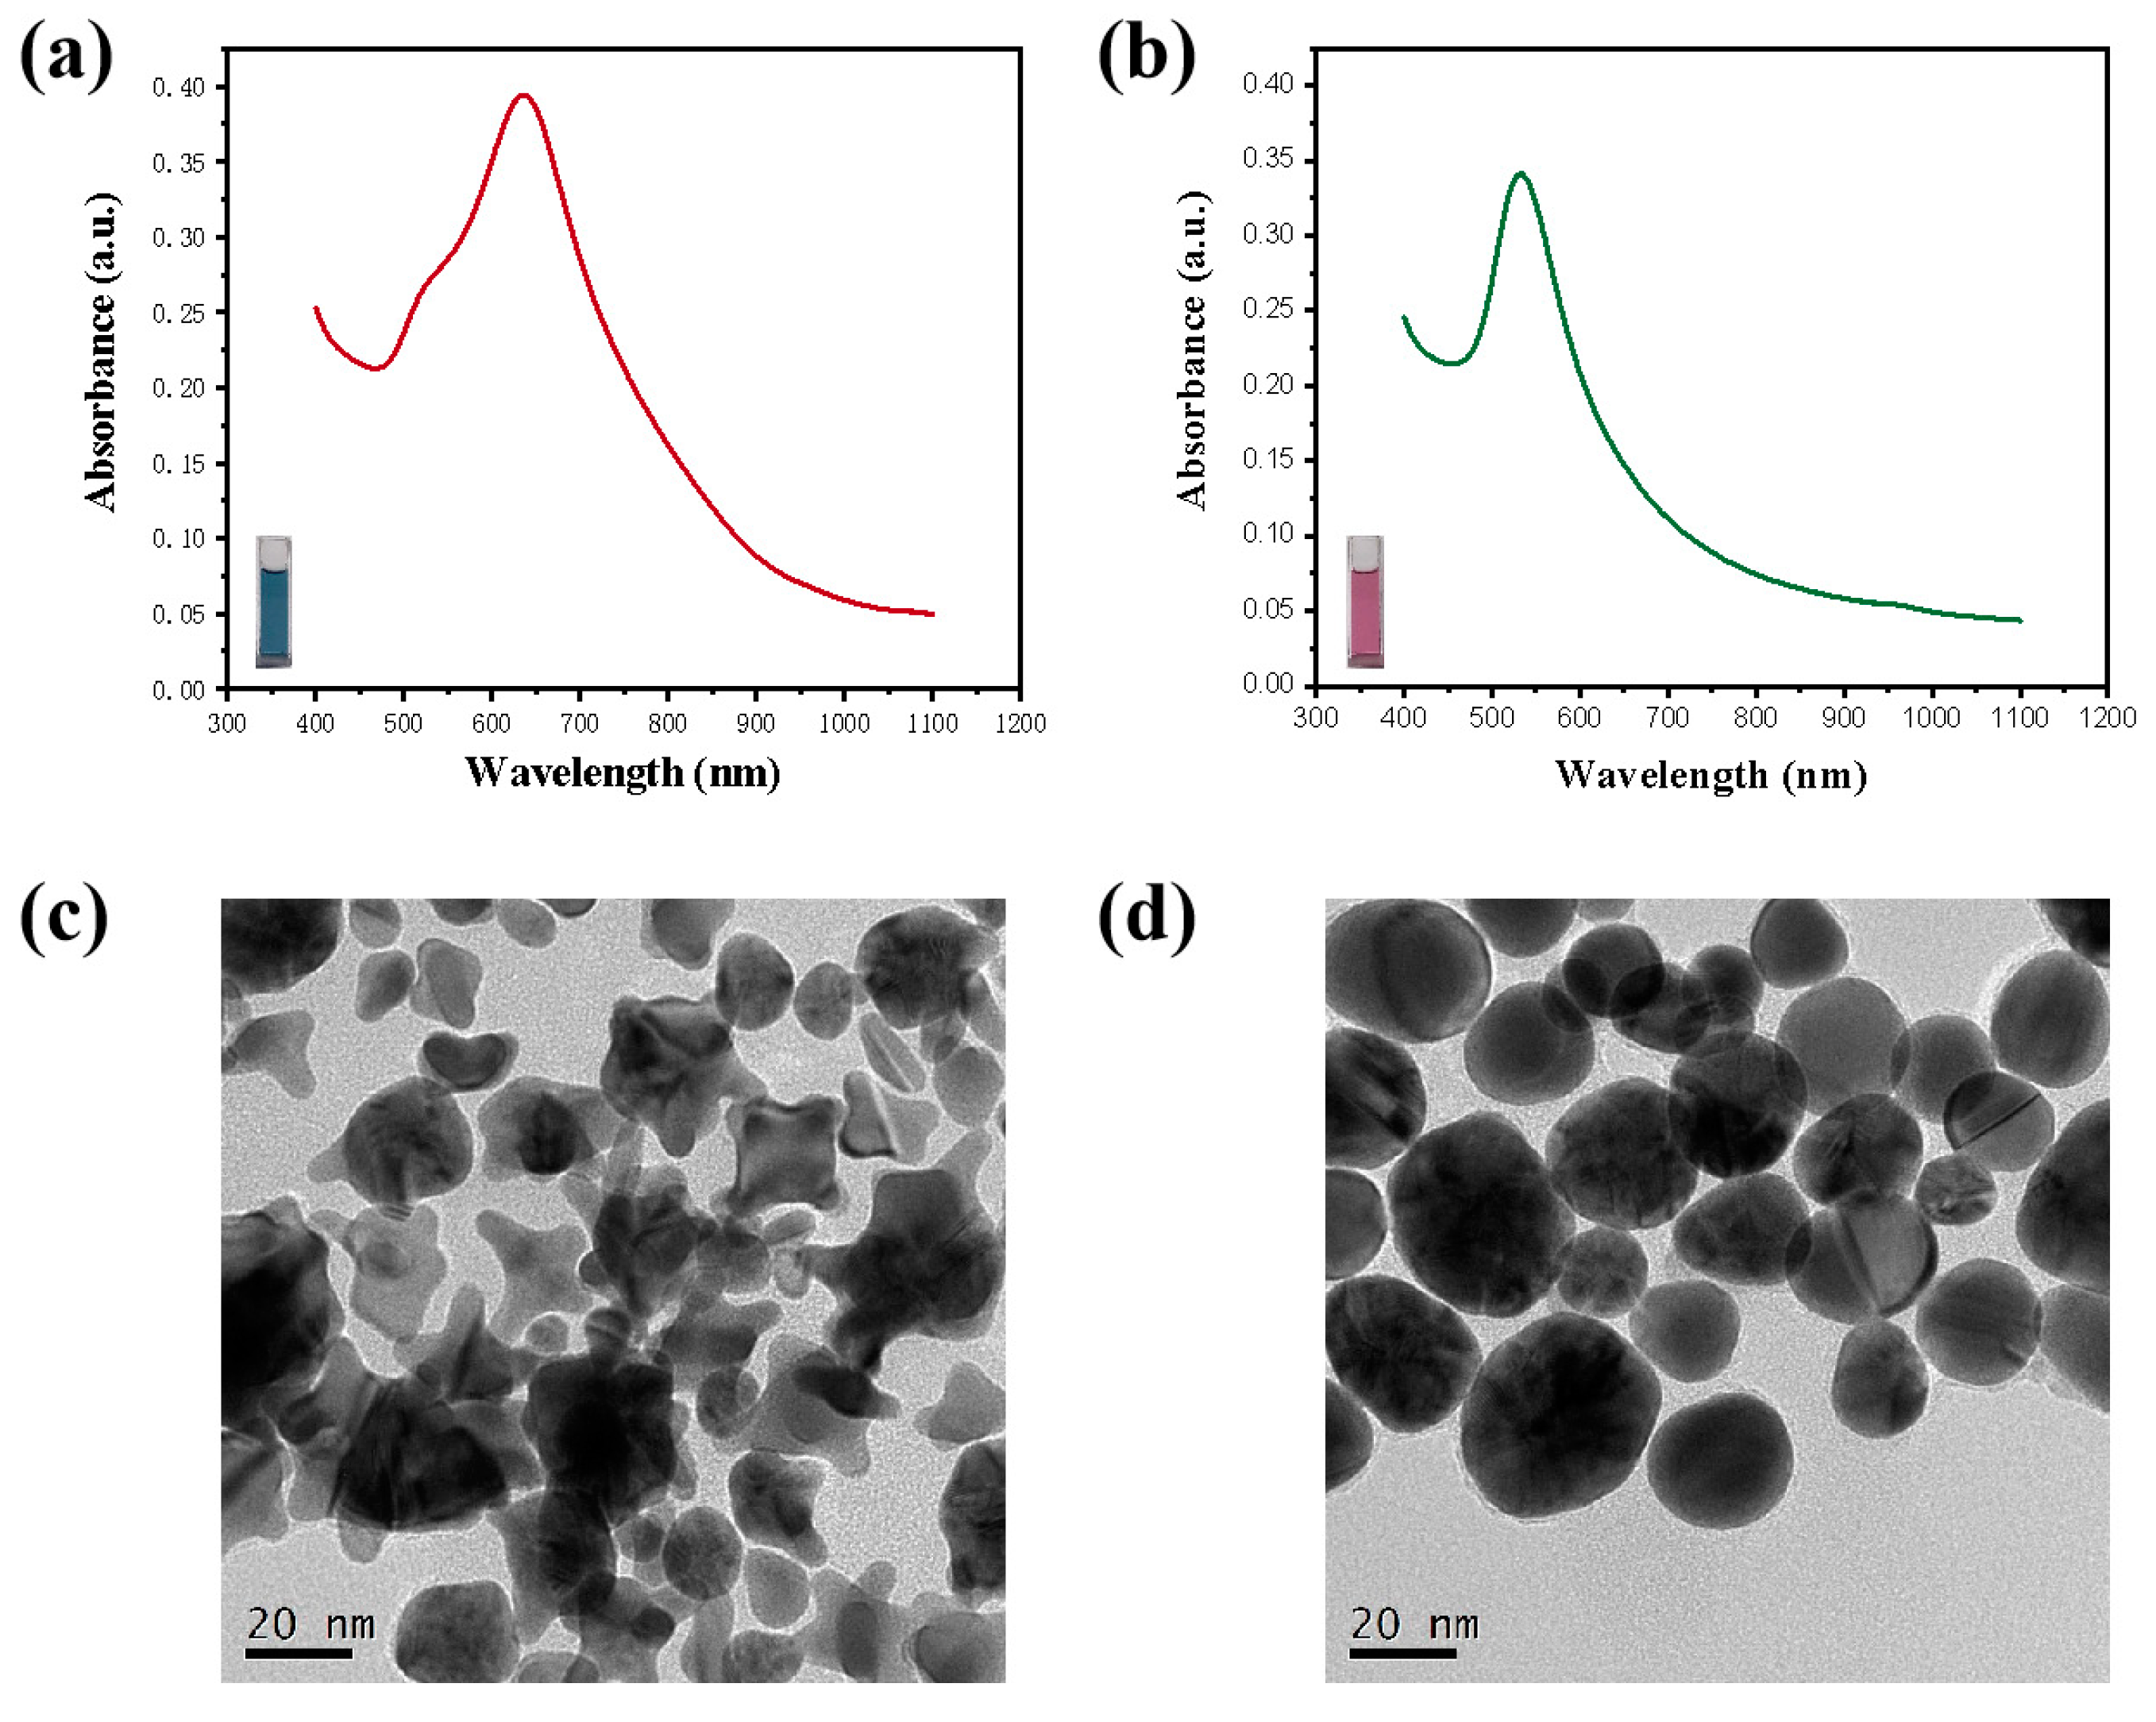
3.1. Transformation of GNSs after the Introduction of I−
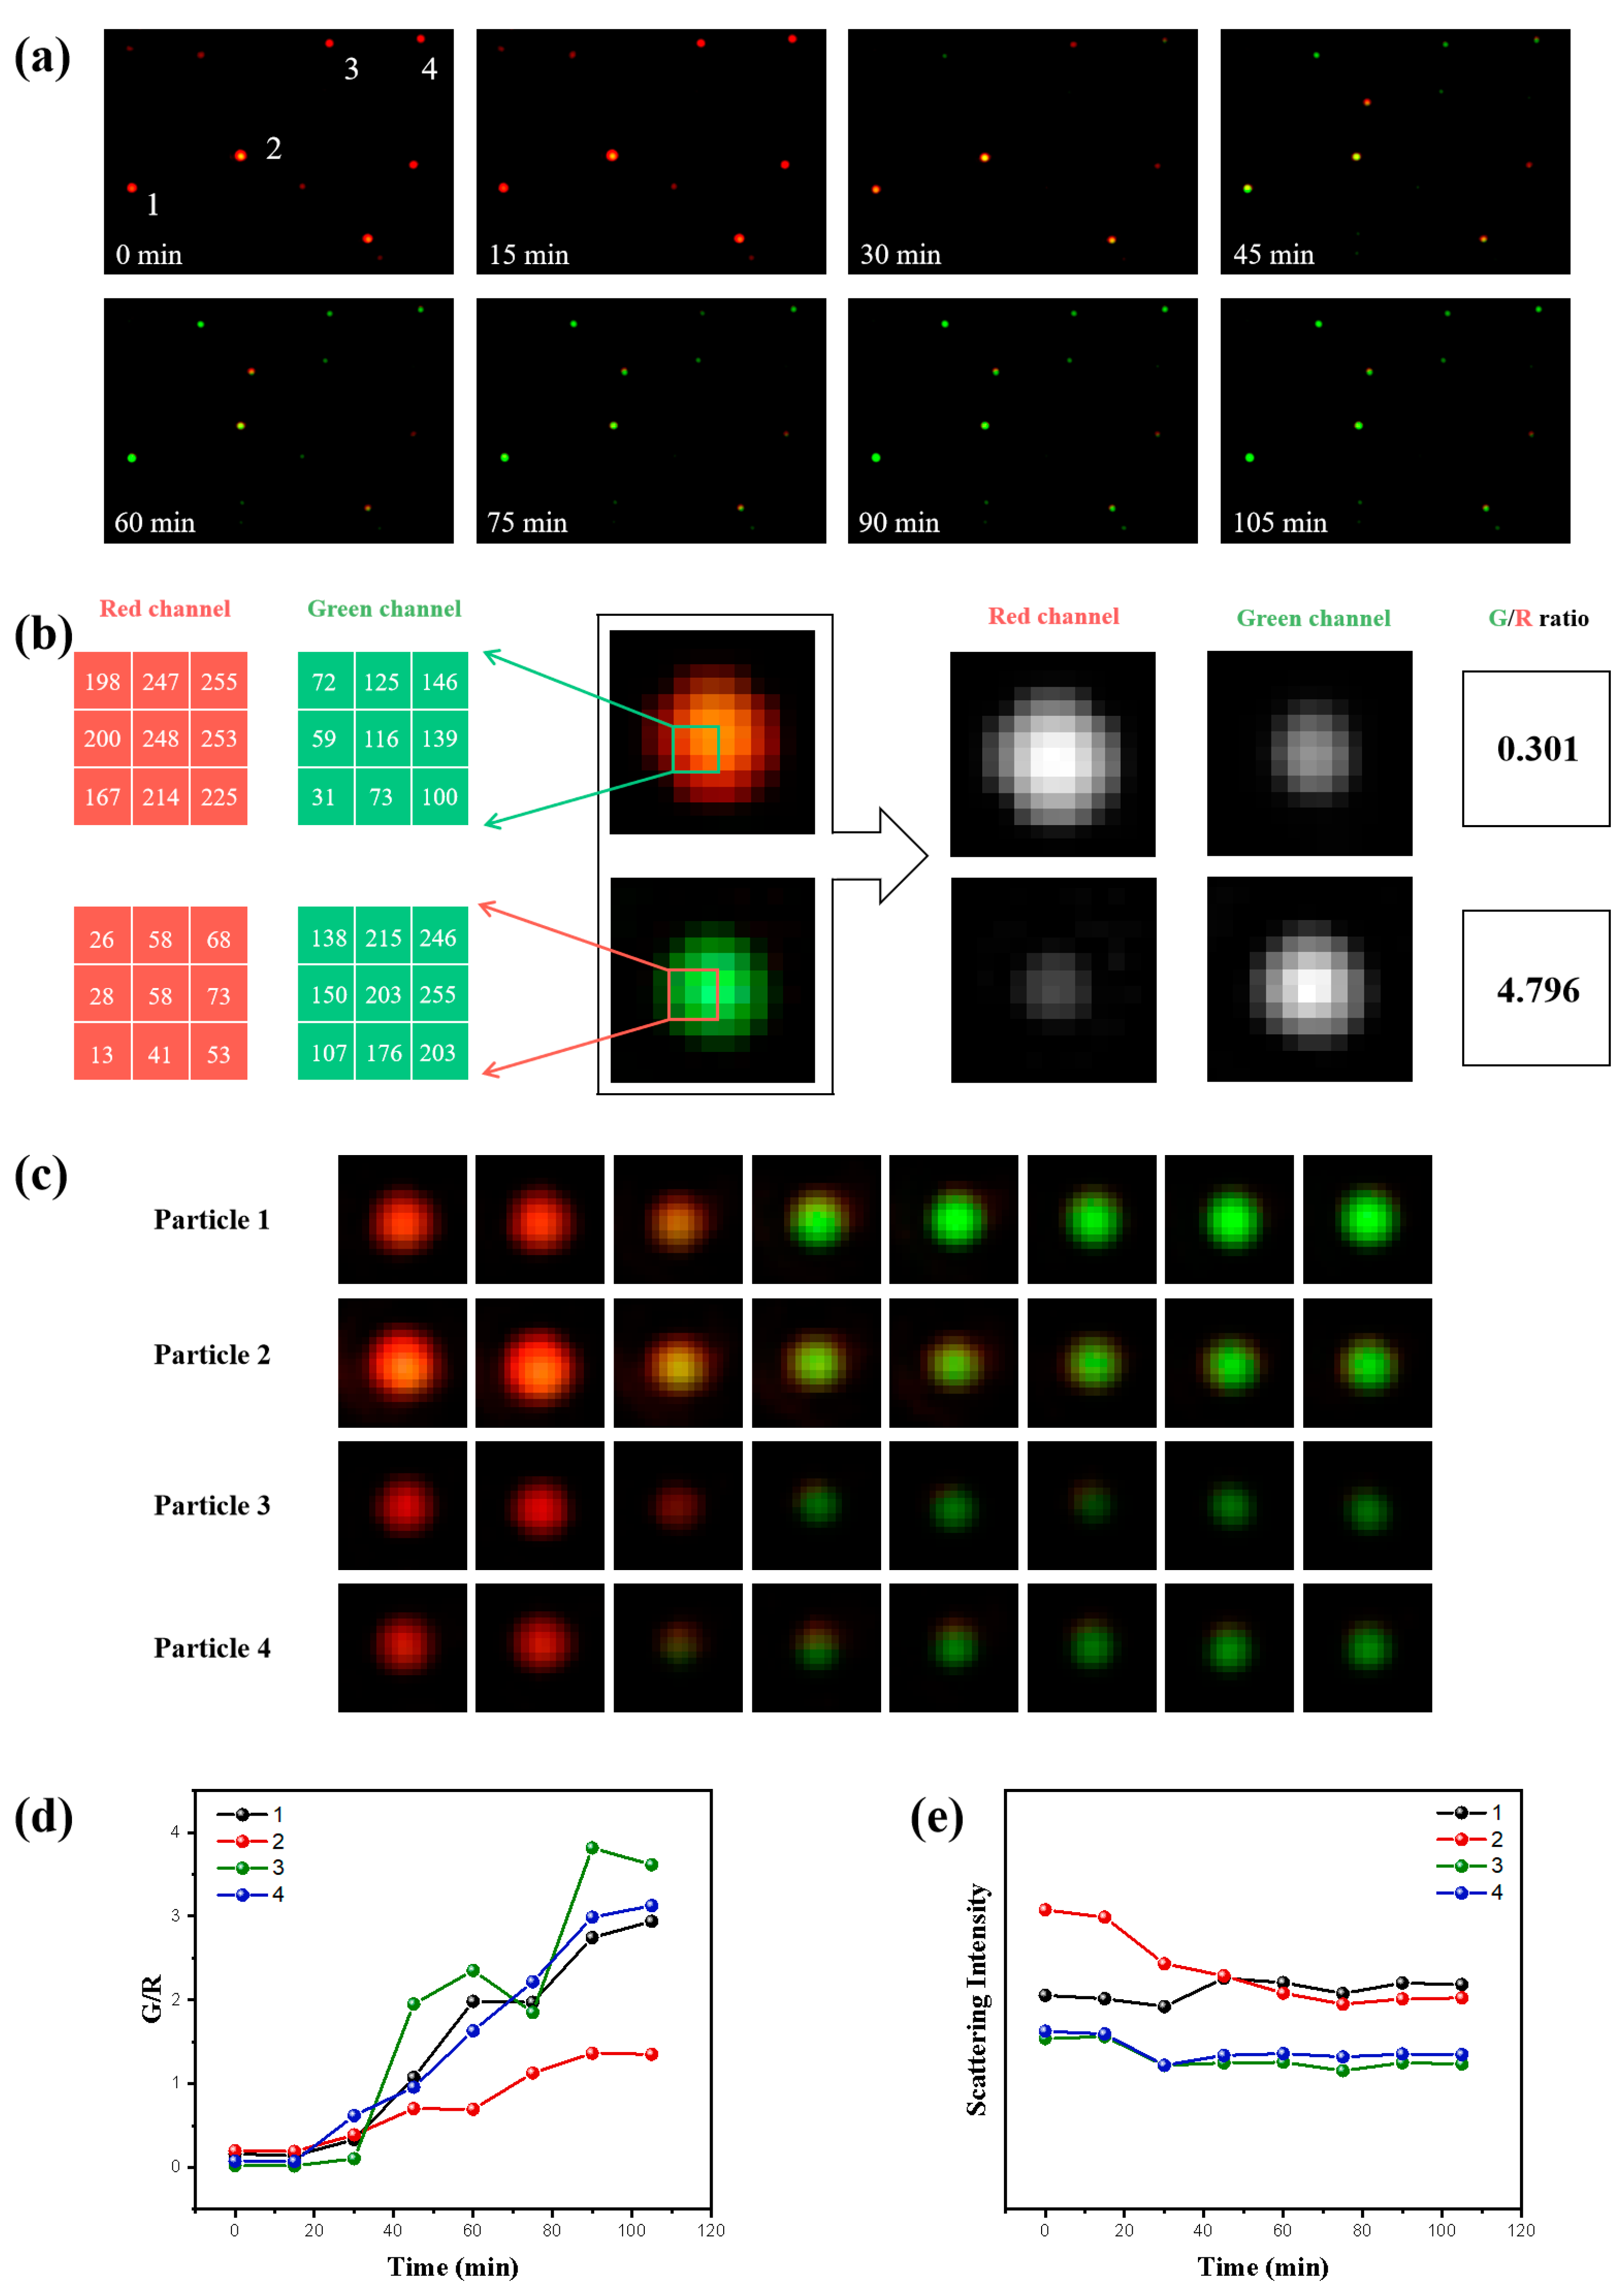
3.2. Enhanced Image Quality of Single GNSs through DFM with G and R Lasers
3.3. Monitoring the Dynamic Transformation of Single GNSs
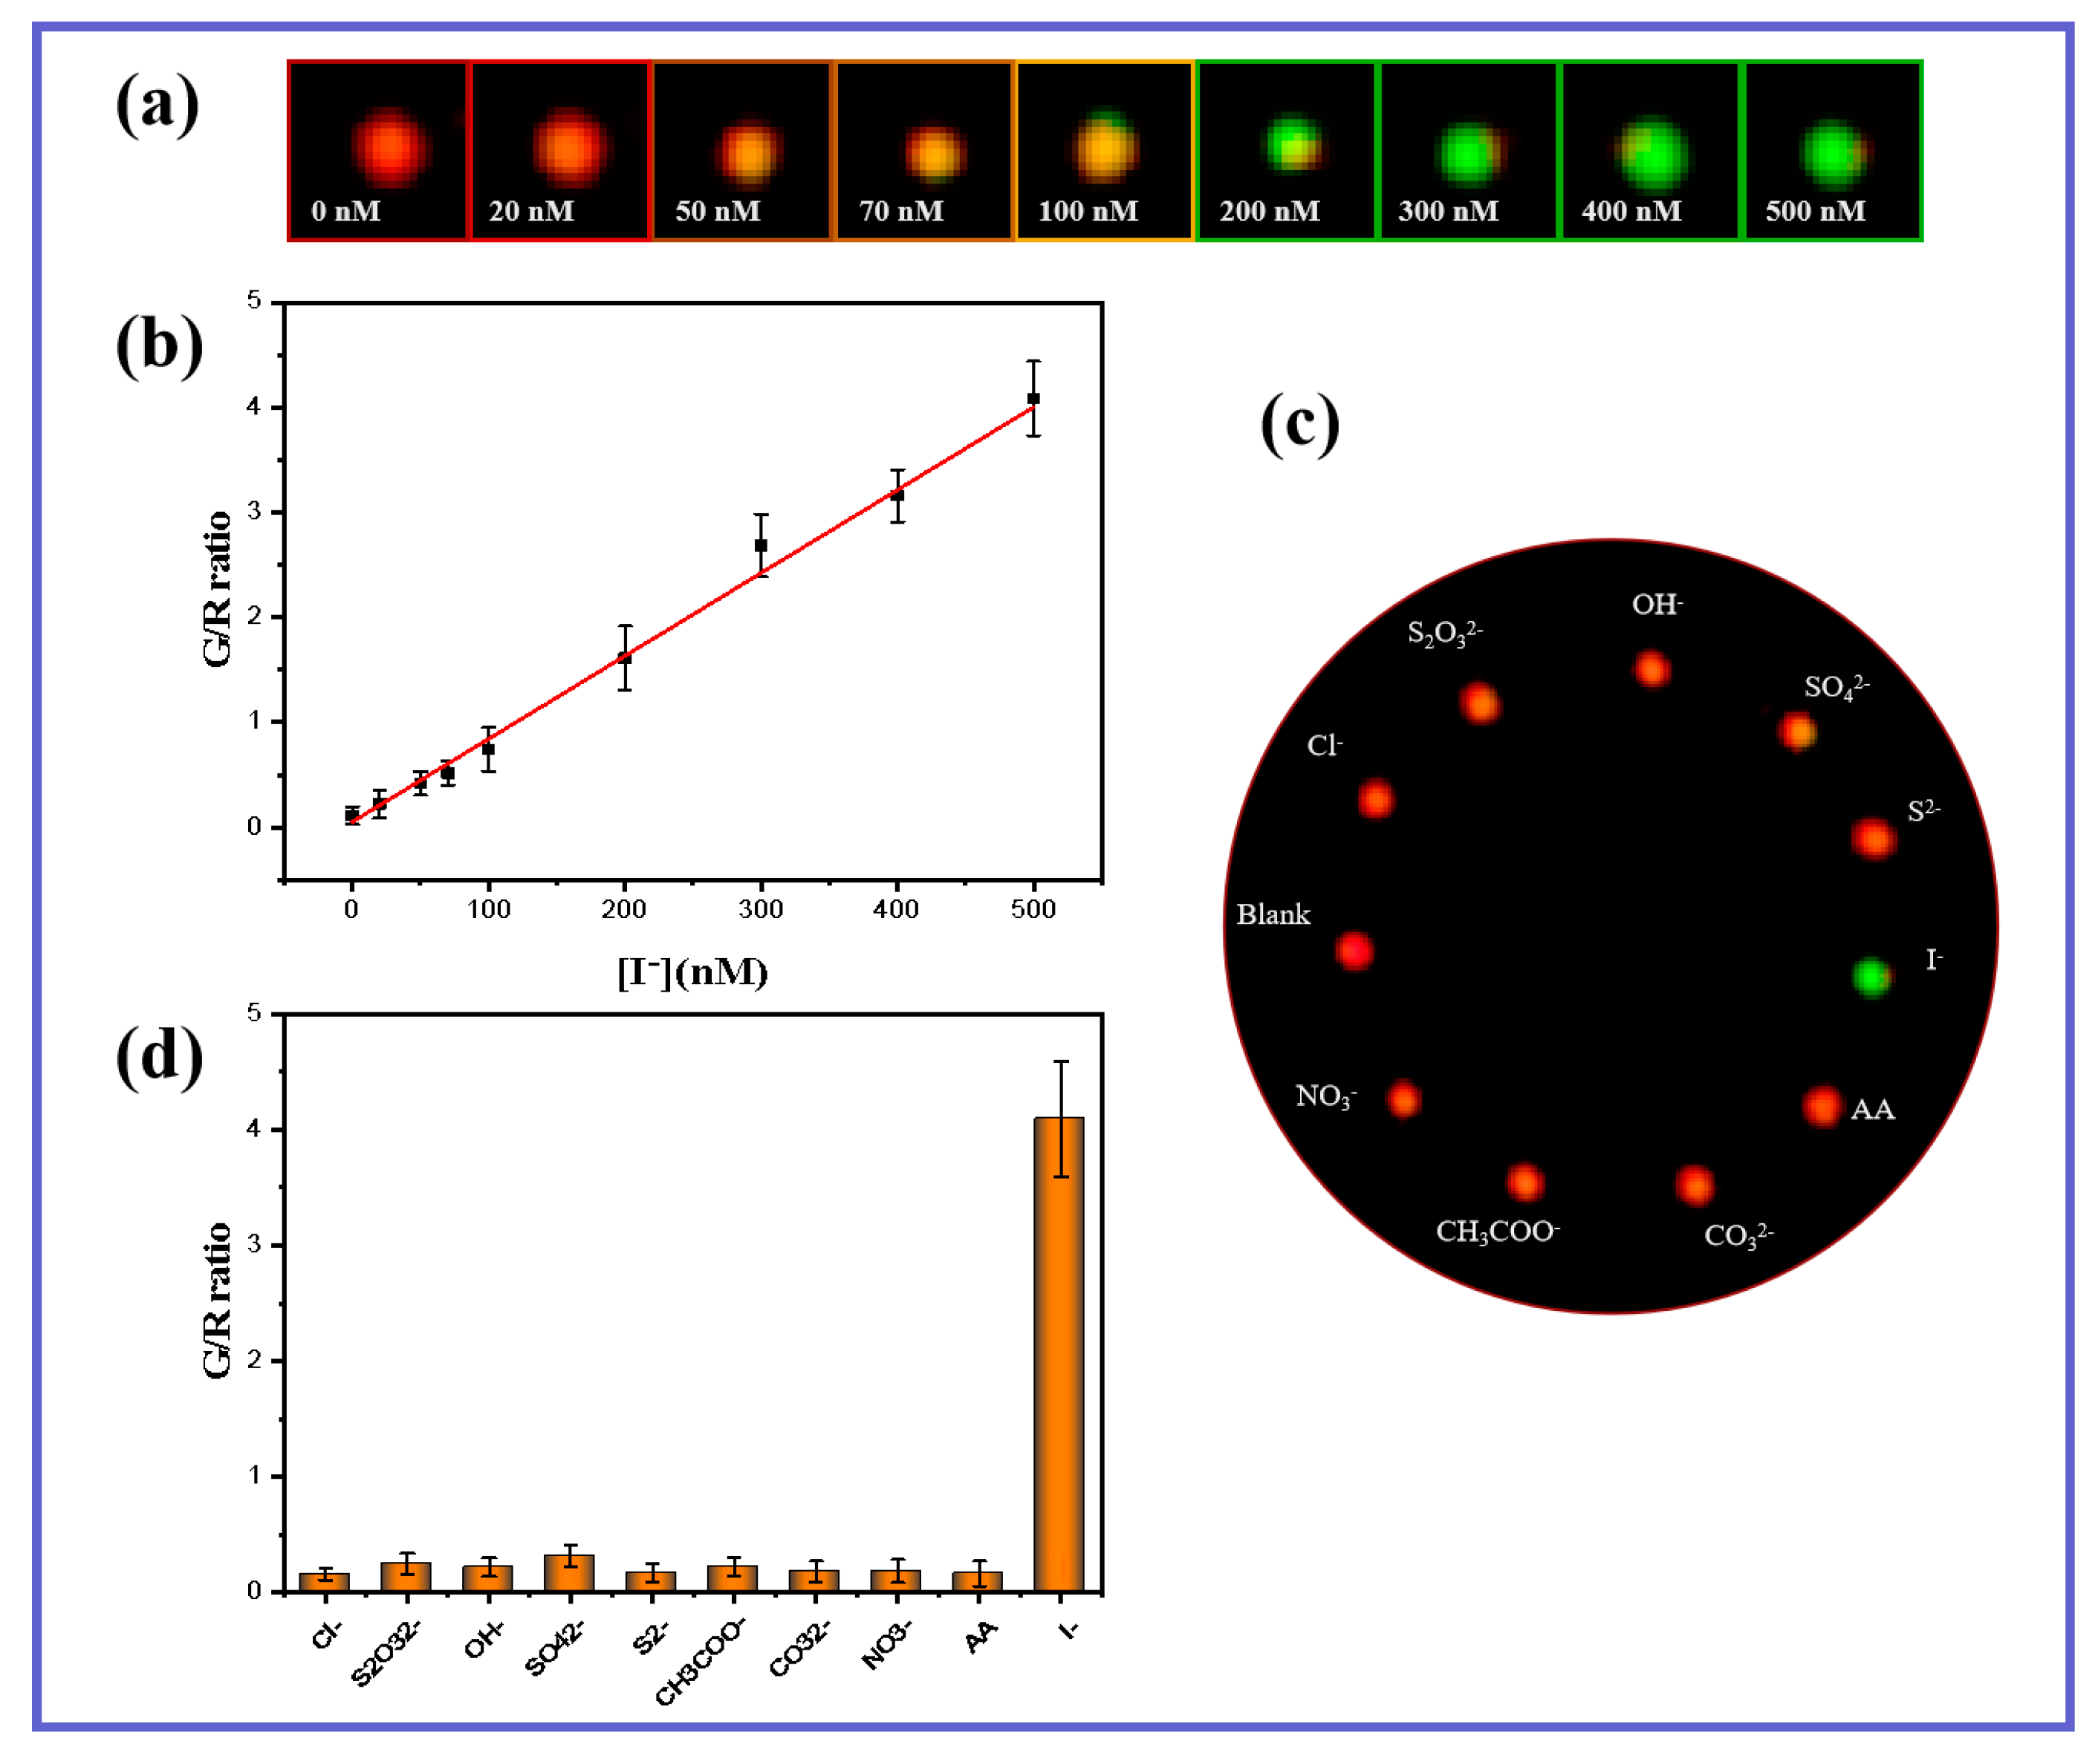
3.4. Sensitivity and Selectivity

| Method | Linear Range | LOD | Ref |
|---|---|---|---|
| Colorimetric | 10–600 nM | 10 nM | [64] |
| Fluorescence | 0.5–20 μM | 430 nM | [65] |
| Fluorescence | 0.1–6 μM | 90 nM | [66] |
| Colorimetric | 8.8–260 nM | 8.8 nM | [51] |
| Fluorescence | 0–200 μM | 22.6 nM | [67] |
| Fluorescence | 0–90 μM | 92.3 nM | [68] |
| Single-particle color imaging | 0–500 nM | 6.9 nM | This work |
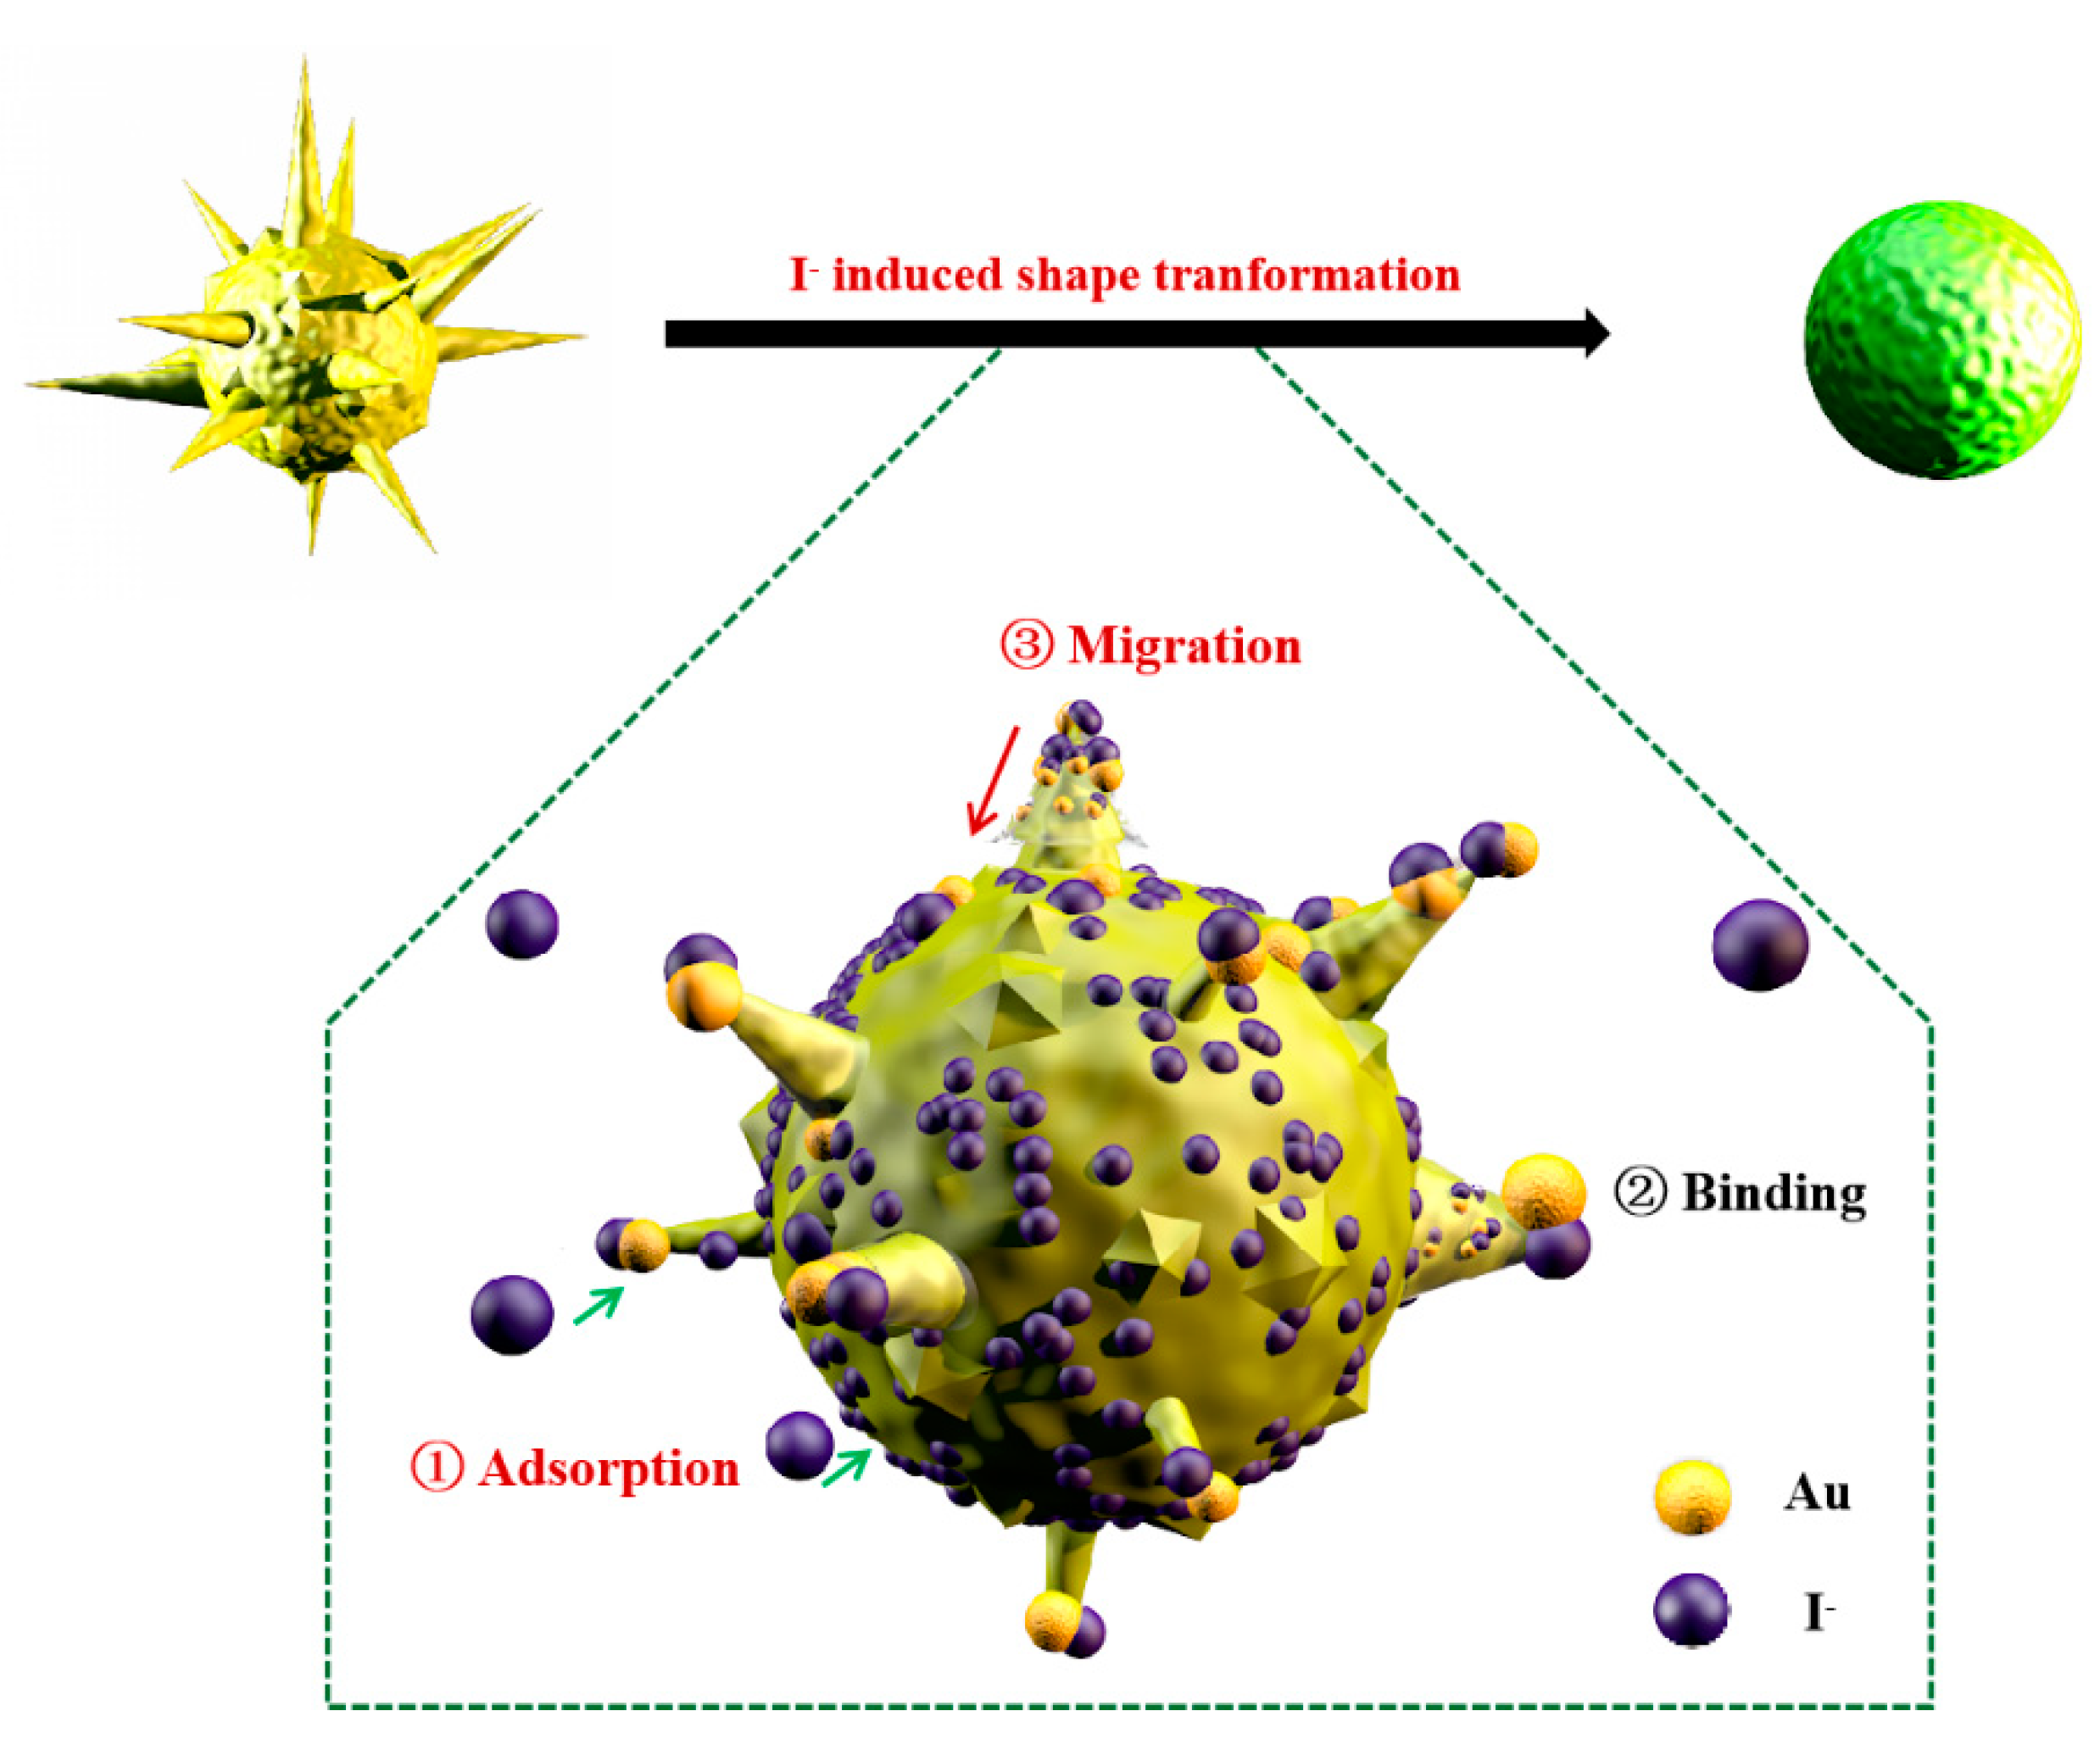
3.5. Mechanism for I−-Inducing Transformation of GNSs
3.6. Single GNS Sensor for the Quantification of I− Real Sample Detection
4. Conclusions
Supplementary Materials
Author Contributions
Funding
Institutional Review Board Statement
Informed Consent Statement
Data Availability Statement
Acknowledgments
Conflicts of Interest
References
- Xu, S.; Yu, X.; Chen, Z.; Zeng, Y.; Guo, L.; Li, L.; Luo, F.; Wang, J.; Qiu, B.; Lin, Z. Real-Time Visualization of the Single-Nanoparticle Electrocatalytic Hydrogen Generation Process and Activity under Dark Field Microscopy. Anal. Chem. 2020, 92, 9016–9023. [Google Scholar] [CrossRef]
- Zhang, H.Z.; Li, R.S.; Gao, P.F.; Wang, N.; Lei, G.; Huang, C.Z.; Wang, J. Real-Time Dark-Field Light Scattering Imaging to Monitor the Coupling Reaction with Gold Nanorods as an Optical Probe. Nanoscale 2017, 9, 3568–3575. [Google Scholar] [CrossRef] [PubMed]
- Wang, H.; Zhao, W.; Zhao, Y.; Xu, C.-H.; Xu, J.-J.; Chen, H.-Y. Real-Time Tracking The Electrochemical Synthesis of Au@Metal Core-Shell Nanoparticles toward Photo Enhanced Methanol Oxidation. Anal. Chem. 2020, 92, 14006–14011. [Google Scholar] [CrossRef] [PubMed]
- Chen, M.-M.; Xu, C.-H.; Zhao, W.; Chen, H.-Y.; Xu, J.-J. Super-Resolution Electrogenerated Chemiluminescence Microscopy for Single-Nanocatalyst Imaging. J. Am. Chem. Soc. 2021, 143, 18511–18518. [Google Scholar] [CrossRef] [PubMed]
- Lei, G.; Gao, P.F.; Yang, T.; Zhou, J.; Zhang, H.Z.; Sun, S.S.; Gao, M.X.; Huang, C.Z. Photoinduced Electron Transfer Process Visualized on Single Silver Nanoparticles. ACS Nano 2017, 11, 2085–2093. [Google Scholar] [CrossRef] [PubMed]
- Khelfa, A.; Nelayah, J.; Amara, H.; Wang, G.; Ricolleau, C.; Alloyeau, D. Quantitative In Situ Visualization of Thermal Effects on the Formation of Gold Nanocrystals in Solution. Adv. Mater. 2021, 33, 2102514. [Google Scholar] [CrossRef]
- Ge, F.; Xue, J.; Du, Y.; He, Y. Unmodified Single Nanoparticles Undergo a Motion-Pattern Transition on the Plasma Membrane before Cellular Uptake. Nano Today 2021, 39, 101158. [Google Scholar] [CrossRef]
- Liu, M.; Wang, F.; Zhang, X.; Mao, X.; Wang, L.; Tian, Y.; Fan, C.; Li, Q. Tracking Endocytosis and Intracellular Distribution of Spherical Nucleic Acids with Correlative Single-Cell Imaging. Nat. Protoc. 2020, 16, 384–404. [Google Scholar] [CrossRef]
- Wei, Z.; Qi, H.; Li, M.; Tang, B.; Zhang, Z.; Han, R.; Wang, J.; Zhao, Y. Watching Single Gold Nanorods Grow. Small 2012, 8, 1331–1335. [Google Scholar] [CrossRef]
- Zhao, Y.; Kong, X.; Shearer, M.J.; Ding, F.; Jin, S. Chemical Etching of Screw Dislocated Transition Metal Dichalcogenides. Nano Lett. 2021, 21, 7815–7822. [Google Scholar] [CrossRef]
- Furuya, R.; Omagari, S.; Tan, Q.; Lokstein, H.; Vacha, M. Enhancement of the Photocurrent of a Single Photosystem I Complex by the Localized Plasmon of a Gold Nanorod. J. Am. Chem. Soc. 2021, 143, 13167–13174. [Google Scholar] [CrossRef] [PubMed]
- Jiang, Y.; Zhu, G.; Lin, F.; Zhang, H.; Jin, C.; Yuan, J.; Yang, D.; Zhang, Z. In Situ Study of Oxidative Etching of Palladium Nanocrystals by Liquid Cell Electron Microscopy. Nano Lett. 2014, 14, 3761–3765. [Google Scholar] [CrossRef] [PubMed]
- Liu, Y.; Lin, X.M.; Sun, Y.; Rajh, T. In Situ Visualization of Self-Assembly of Charged Gold Nanoparticles. J. Am. Chem. Soc. 2013, 135, 3764–3767. [Google Scholar] [CrossRef] [PubMed]
- Chee, S.W.; Tan, S.F.; Baraissov, Z.; Bosman, M.; Mirsaidov, U. Direct Qbservation of the Nanoscale Kirkendall Effect during Galvanic Replacement Reactions. Nat. Commun. 2017, 8, 1224. [Google Scholar] [CrossRef]
- Arrigo, R.; Sasaki, T.; Callison, J.; Gianoliob, D.; Schuster, M.E. Monitoring Dynamics of Defects and Single Fe Atoms in N-Functionalized Few-Layer Graphene by In Situ Temperature Programmed Scanning Transmission Electron Microscopy. J. Energ. Chem. 2022, 64, 520–530. [Google Scholar] [CrossRef]
- Dachraoui, W.; Keller, D.; Henninen, T.R.; Ashton, O.J.; Erni, R. Atomic Mechanisms of Nanocrystallization via Cluster-Clouds in Solution Studied by Liquid-Phase Scanning Transmission Electron Microscopy. Nano Lett. 2021, 21, 2861–2869. [Google Scholar] [CrossRef]
- Zhang, X.; Wang, H.; Wang, H.; Zhang, Q.; Xie, J.; Tian, Y.; Wang, J.; Xie, Y. Single-Layered Graphitic-C3n4 Quantum Dots for Two-Photon Fluorescence Imaging of Cellular Nucleus. Adv. Mater. 2014, 26, 4438–4443. [Google Scholar] [CrossRef]
- Shang, L.; Doerlich, R.M.; Brandholt, S.; Schneider, R.; Trouillet, V.; Bruns, M.; Gerthsen, D.; Nienhaus, G.U. Facile Preparation of Water-Soluble Fluorescent Gold Nanoclusters for Cellular Imaging Applications. Nanoscale 2011, 3, 2009–2014. [Google Scholar] [CrossRef]
- Mehta, S.B.; Mcquilken, M.; La Riviere, P.J.; Tani, T. Dissection of Molecular Assembly Dynamics by Tracking Orientation and Position of Single Molecules in Live Cells. Proc. Natl. Acad. Sci. USA 2016, 113, E6352–E6361. [Google Scholar] [CrossRef] [Green Version]
- Wang, K.; Li, S.; Liu, Y.; Jiang, L.; Zhang, F.; Wei, Y.; Zhang, Y.; Qi, Z.; Wang, K.; Liu, S. In Situ Detection and Imaging of Telomerase Activity in Cancer Cell Lines via Disassembly of Plasmonic Core-Satellites Nanostructured Probe. Anal. Chem. 2017, 89, 7262–7268. [Google Scholar] [CrossRef]
- Saqib, M.; Fan, Y.; Hao, R.; Zhang, B. Optical Imaging of Nanoscale Electrochemical Interfaces in Energy Applications. Nano Energy 2021, 90, 106539. [Google Scholar] [CrossRef]
- Hwu, S.; Blickenstorfer, Y.; Tiefenauer, R.F.; Gonnelli, C.; Schmidheini, L.; Lüchtefeld, I.; Hoogenberg, B.-J.; Gisiger, A.B.; Vörös, J. Dark-Field Microwells toward High-Throughput Direct Mirna Sensing with Gold Nanoparticles. ACS Sens. 2019, 4, 1950–1956. [Google Scholar] [CrossRef] [PubMed]
- Hao, J.; Xiong, B.; Cheng, X.D.; He, Y.; Yeung, E.S. High-Throughput Sulfide Sensing with Colorimetric Analysis of Single Au-Ag Core-Shell Nanoparticles. Anal. Chem. 2014, 86, 4663–4667. [Google Scholar] [CrossRef]
- Zhao, Y.; Zhao, W.; Chen, H.-Y.; Xu, J.-J. Dark-Field Microscopic Real-Time Monitoring the Growth of Au On Cu2o Nanocubes for Ultra-Sensitive Glucose Detection. Anal. Chim. Acta 2021, 1162, 338503. [Google Scholar] [CrossRef] [PubMed]
- Chuang, C.C.; Chang, C.W. Complexation of Bioreducible Cationic Polymers with Gold Nanoparticles for Improving Stability in Serum and Application on Nonviral Gene Delivery. ACS Appl. Mater. Interfaces 2015, 7, 7724–7731. [Google Scholar] [CrossRef]
- Shi, L.; Jing, C.; Ma, W.; Li, D.-W.; Halls, J.E.; Marken, F.; Long, Y.-T. Plasmon Resonance Scattering Spectroscopy at the Single-Nanoparticle Level: Real-Time Monitoring of a Click Reaction. Angew. Chem. Int. Ed. 2013, 52, 1–5. [Google Scholar] [CrossRef]
- Novo, C.; Funston, A.M.; Mulvaney, P. Direct Observation of Chemical Reactions on Single Gold Nanocrystals Using Surface Plasmon Spectroscopy. Nat. Nanotechnol. 2008, 3, 598–602. [Google Scholar] [CrossRef]
- Novo, C.; Funston, A.M.; Gooding, A.K.; Mulvaney, P. Electrochemical Charging of Single Gold Nanorods. J. Am. Chem. Soc. 2009, 131, 14664–14666. [Google Scholar] [CrossRef]
- Xie, T.; Jing, C.; Ma, W.; Ding, Z.; Gross, A.J.; Long, Y.-T. Real-Time Monitoring for the Morphological Variations of Single Gold Nanorods. Nanoscale 2014, 7, 511–517. [Google Scholar] [CrossRef]
- Liu, Y.; Huang, C.Z. Real-Time Dark-Field Scattering Microscopic Monitoring of the In Situ Growth of Single Ag@Hg Nanoalloys. ACS Nano 2013, 7, 11026–11034. [Google Scholar] [CrossRef]
- Schopf, C.; Wahl, A.; Martin, A.; O’Riordan, A.; Iacopino, D. Direct Observation of Mercury Amalgamation on Individual Gold Nanorods Using Spectroelectrochemistry. J. Phys. Chem. C 2016, 120, 19295–19301. [Google Scholar] [CrossRef]
- Smith, J.G.; Yang, Q.; Jain, P.K. Identification of a Critical Intermediate in Galvanic Exchange Reactions by Single-Nanoparticle-Resolved Kinetics. Angew. Chem.-Int. Ed. 2014, 53, 2867–2872. [Google Scholar] [CrossRef] [PubMed]
- Zhou, J.; Yang, T.; He, W.; Pan, Z.Y.; Huang, C.Z. A Galvanic Exchange Process Visualized on Single Silver Nanoparticles Via Dark-Field Microscopy Imaging. Nanoscale 2018, 10, 12805–12812. [Google Scholar] [CrossRef] [PubMed]
- Ahad, F.; Ganie, S.A. Iodine Metabolism and Iodine Deficiency Disorders Revisited. Indian J. Endocrinol. Metab. 2010, 14, 13–17. [Google Scholar]
- Zimmermann, M.B.; Boelaert, K. Iodine Deficiency and Thyroid Disorders. Lancet Diabetes Endocrinol. 2015, 3, 286–295. [Google Scholar] [CrossRef]
- Leung, A.M.; Braverman, L.E. Iodine-Induced Thyroid Dysfunction. Curr. Opin. Endocrinol. Diabetes Obes. 2012, 19, 414. [Google Scholar] [CrossRef] [Green Version]
- Carl, A.; Krejbjerg, A.; Laurberg, P. Epidemiology of Nodular Goitre. Influence of Iodine Intake. Best Pract. Res. Clin. Endocrinol. Metab. 2014, 28, 465–479. [Google Scholar] [CrossRef]
- Laurberg, P.; Cerqueira, C.; Ovesen, L.; Rasmussen, L.B.; Perrild, H.; Andersen, S.; Pedersen, I.B.; Carlé, A. Iodine Intake as a Determinant of Thyroid Disorders in Populations. Best Pract. Res. Clin. Endocrinol. Metab. 2010, 24, 13–27. [Google Scholar] [CrossRef]
- Clark, M.N. A Fatal Case of Iodine Poisoning. Clin. Toxicol. 1981, 18, 807–811. [Google Scholar] [CrossRef]
- Pennington, J.A. A Review of Iodine Toxicity Reports. J. Am. Diet. Assoc. 1990, 90, 1571–1582. [Google Scholar] [CrossRef]
- Wang, J.; Li, Y.F.; Huang, C.Z. Identification of Iodine-Induced Morphological Transformation of Gold Nanorods. J. Phys. Chem. C 2008, 112, 11691–11695. [Google Scholar] [CrossRef]
- Walsh, A.A. Chemisorption of Iodine-125 to Gold Nanoparticles Allows for Real-Time Quantitation and Potential Use in Nanomedicine. J. Nanopart. Res. 2017, 19, 152. [Google Scholar] [CrossRef] [PubMed] [Green Version]
- Cheng, W.; Dong, S.; Wang, E. Iodine-Induced Gold-Nanoparticle Fusion/Fragmentation/Aggregation and Iodine-Linked Nanostructured Assemblies on a Glass Substrate. Angew. Chem. Int. Ed. 2003, 115, 449–452. [Google Scholar] [CrossRef]
- Ha, T.H.; Koo, H.J.; Chung, B.H. Shape-Controlled Syntheses of Gold Nanoprisms and Nanorods Influenced by Specific Adsorption of Halide Ions. J. Phys. Chem. C 2007, 111, 1123–1130. [Google Scholar] [CrossRef]
- Xiang, Y.; Wu, X.; Liu, D.; Feng, L.; Zhang, K.; Chu, W.; Zhou, W.; Xie, S. Tuning the Morphology of Gold Nanocrystals by Switching the Growth Of {110} Facets from Restriction to Preference. J. Phys. Chem. C 2008, 112, 3203–3208. [Google Scholar] [CrossRef]
- Jessl, S.; Tebbe, M.; Guerrini, L.; Fery, A.; Alvarez-Puebla, R.A.; Pazos-Perez, N. Silver-Assisted Synthesis of Gold Nanorods: The Relation Between Silver Additive and Iodide Impurities. Small 2018, 14, 1703879. [Google Scholar] [CrossRef] [PubMed]
- Millstone, J.E.; Wei, W.; Jones, M.R.; Yoo, H.; Mirkin, C.A. Iodide Ions Control Seed-Mediated Growth of Anisotropic Gold Nanoparticles. Nano Lett. 2008, 8, 2526–2529. [Google Scholar] [CrossRef]
- Chung, P.-J.; Lyu, L.-M.; Huang, M.H. Seed-Mediated and Iodide-Assisted Synthesis of Gold Nanocrystals with Systematic Shape Evolution from Rhombic Dodecahedral to Octahedral Structures. Chem.-Eur. J. 2011, 17, 9746–9752. [Google Scholar] [CrossRef] [PubMed]
- Grzelczak, M.; SNchez-Iglesias, A.; Rodríguez-González, B.; Alvarez-Puebla, R.; Pérez-Juste, J.; Liz-Marzán, L.M. Influence of Iodide Ions on the Growth of Gold Nanorods: Tuning Tip Curvature and Surface Plasmon Resonance. Adv. Funct. Mater. 2008, 18, 3780–3786. [Google Scholar] [CrossRef]
- Zhang, J.; Xu, X.; Yang, C.; Yang, F.; Yang, X. Colorimetric Iodide Recognition and Sensing by Citrate-Stabilized Core/Shell Cu@Au Nanoparticles. Anal. Chem. 2011, 83, 3911–3917. [Google Scholar] [CrossRef]
- Yang, X.-H.; Ling, J.; Peng, J.; Cao, Q.-E.; Ding, Z.-T.; Bian, L.-C. A Colorimetric Method for Highly Sensitive and Accurate Detection of Iodide by Finding the Critical Color in a Color Change Process Using Silver Triangular Nanoplates. Anal. Chim. Acta 2013, 798, 74–81. [Google Scholar] [CrossRef] [PubMed]
- Zhen, S.; Wu, T.; Huang, X.; Li, Y.; Huang, C. Facile Synthesis of Gold Nanoflowers as Sers Substrates and Their Morphological Transformation Induced by Iodide Ions. Sci. China Chem. 2016, 59, 1045–1050. [Google Scholar] [CrossRef]
- Xie, J.; Lee, J.Y.; Wang, D.I.C. Seedless, Surfactantless, High-Yield Synthesis of Branched Gold Nanocrystals in Hepes Buffer Solution. Chem. Mater. 2007, 19, 2823–2830. [Google Scholar] [CrossRef]
- Machado, A.; Mesquita, R.B.; Oliveira, S.; Bordalo, A.A. Development of a Robust, Fast Screening Method for the Potentiometric Determination of Iodide in Urine and Salt Samples. Talanta 2017, 167, 688–694. [Google Scholar] [CrossRef] [PubMed]
- Liu, X.-L.; Wang, J.-H.; Liang, S.; Yang, D.-J.; Nan, F.; Ding, S.-J.; Zhou, L.; Hao, Z.-H.; Wang, Q.-Q. Tuning Plasmon Resonance of Gold Nanostars for Enhancements of Nonlinear Optical Response and Raman Scattering. J. Phys. Chem. C 2014, 118, 9659–9664. [Google Scholar] [CrossRef]
- Dam, D.H.M.; Lee, J.H.; Sisco, P.N.; Co, D.T.; Zhang, M.; Wasielewski, M.R.; Odom, T.W. Direct Observation of Nanoparticle-Cancer Cell Nucleus Interactions. ACS Nano 2012, 6, 3318–3326. [Google Scholar] [CrossRef] [Green Version]
- Liu, Y.; Huang, C.Z. Screening Sensitive Nanosensors Via The Investigation of Shape-Dependent Localized Surface Plasmon Resonance of Single Ag Nanoparticles. Nanoscale 2013, 5, 7458–7466. [Google Scholar] [CrossRef]
- Cheng, X.; Dai, D.; Yuan, Z.; Peng, L.; He, Y.; Yeung, E.S. Color Difference Amplification between Gold Nanoparticles in Colorimetric Analysis with Actively Controlled Multiband Illumination. Anal. Chem. 2014, 86, 7584–7592. [Google Scholar] [CrossRef]
- Cheng, J.; Liu, Y.; Cheng, X.; He, Y.; Yeung, E.S. Real Time Observation of Chemical Reactions of Individual Metal Nanoparticles with High-Throughput Single Molecule Spectral Microscopy. Anal. Chem. 2010, 82, 8744–8749. [Google Scholar] [CrossRef]
- Lezna, R.O.; Tacconi, N.; Arvia, A.J. Modulated Reflectance Spectroscopy and Voltammetry of the Sulphide/Gold System. J. Electroanal. Chem. 1990, 283, 319–336. [Google Scholar] [CrossRef] [Green Version]
- Lay, M.; Varazo, K.; Stickney, J.L. Formation of Sulfur Atomic Layers on Gold from Aqueous Solutions of Sulfide and Thiosulfate: Studies Using Ec-Stm, Uhv-Ec, and Tlec. Langmuir 2003, 19, 8416–8427. [Google Scholar] [CrossRef]
- Fan, J.; Li, R.; Xu, P.; Di, J.; Tu, Y.; Yan, J. Sensitive Sulfide Sensor with a Trypsin-Stabilized Gold Nanocluster. Anal. Sci. 2014, 30, 457–462. [Google Scholar] [CrossRef] [PubMed] [Green Version]
- Aylmore, M.G.; Muir, D.M. Thiosulfate Leaching of Gold—A Review. Miner. Eng. 2001, 14, 135–174. [Google Scholar] [CrossRef]
- Chen, L.; Lu, W.; Wang, X.; Chen, L. A Highly Selective and Sensitive Colorimetric Sensor for Iodide Detection Based on Anti-Aggregation of Gold Nanoparticles. Sens. Actuators B Chem. 2013, 182, 482–488. [Google Scholar] [CrossRef]
- Du, F.; Zeng, F.; Ming, Y.; Wu, S. Carbon Dots-Based Fluorescent Probes for Sensitive and Selective Detection of Iodide. Microchim. Acta 2013, 180, 453–460. [Google Scholar] [CrossRef]
- Nabavi, S.; Alizadeh, N. A Highly Sensitive and Selective Turn-on Fluorescence Sensor for Iodide Detection Based on Newly Synthesized Oligopyrrole Derivative and Application to Real Samples. Sens. Actuators B Chem. 2014, 200, 76–82. [Google Scholar] [CrossRef]
- Zhang, R.X.; Li, P.F.; Zhang, W.J.; Li, N.; Zhao, N. A Highly Sensitive Fluorescent Sensor with Aggregation-Induced Emission Characteristics for the Detection of Iodide and Mercury Ions in Aqueous Solution. J. Mater. Chem. C 2016, 4, 10479–10485. [Google Scholar] [CrossRef]
- Huang, H.; Weng, Y.; Zheng, L.; Yao, B.; Weng, W.; Lin, X. Nitrogen-Doped Carbon Quantum Dots as Fluorescent Probe for “off-on” Detection of Mercury Ions, L-Cysteine and Iodide Ions. J. Colloid Interface Sci. 2017, 506, 373–378. [Google Scholar] [CrossRef]
- Bravo, B.G.; Michelhaugh, S.L.; Soriaga, M.P.; Villegas, I.; Suggs, D.W.; Stickney, J.L. Anodic Underpotential Deposition and Cathodic Stripping of Iodine at Polycrystalline and Single-Crystal Gold. Studies by Leed, Aes, Xps, and Electrochemistry. J. Phys. Chem. 1991, 95, 5245–5249. [Google Scholar] [CrossRef]
- Li, K.; Zhao, Y.; Zhang, P.; He, C.; Deng, J.; Ding, S.; Shi, W. Combined Dft and Xps Investigation of Iodine Anions Adsorption on the Sulfur Terminated (001) Chalcopyrite Surface. Appl. Surf. Sci. 2016, 390, 412–421. [Google Scholar] [CrossRef]
- Xi, W.; Haes, A.J. Elucidation of Hepes Affinity to and Structure on Gold Nanostars. J. Am. Chem. Soc. 2019, 141, 4034–4042. [Google Scholar] [CrossRef] [PubMed]
- Ni, W.; Kou, X.; Yang, Z.; Wang, J. Tailoring Longitudinal Surface Plasmon Wavelengths, Scattering and Absorption Cross Sections of Gold Nanorods. ACS Nano 2008, 2, 677–686. [Google Scholar] [CrossRef] [PubMed]
- Ren, W.; Huang, Z.; Xu, Y.; Li, Y.; Ji, Y.; Su, B. Urchin-Like Gold Nanoparticle-based Immunochromatographic Strip Test for Rapid Detection of Fumonisin B-1 in Grains. Anal. Bioanal. Chem. 2015, 407, 7341–7348. [Google Scholar] [CrossRef]
- Liu, B.; Zeng, H. Symmetric and Asymmetric Ostwald Ripening in the Fabrication of Homogeneous Core–Shell Semiconductors. Small 2010, 1, 566–571. [Google Scholar] [CrossRef] [PubMed]
- Redmond, P.L.; Hallock, A.J.; Brus, L.E. Electrochemical Ostwald Ripening of Colloidal Ag Particles on Conductive Substrates. Nano Lett. 2005, 5, 131–135. [Google Scholar] [CrossRef] [PubMed]
- Sun, M.; Ran, G.; Fu, Q.; Xu, W. The Effect of Iodide on the Synthesis of Gold Nanoprisms. J. Exp. Nanosci. 2015, 10, 1309–1318. [Google Scholar] [CrossRef] [Green Version]


| Sample | Added (mg/kg) | Detected (mg/kg) | Recovery (%) | RSD (%) |
|---|---|---|---|---|
| Uniodized table salt | 0 | ND | / | / |
| Table salt | 0 | 22.8 | / | 3.2 |
| 5 | 28.1 | 101.3 | 4.5 | |
| 10 | 33.9 | 104.8 | 3.8 | |
| 20 | 44.3 | 106.5 | 3.6 | |
| Seaweeds (chilled) | 0 | 1620.4 | / | 3.7 |
| 100 | 1721.4 | 100.1 | 5.2 | |
| 200 | 1805.4 | 98.5 | 6.7 | |
| 500 | 2115.4 | 99.4 | 5.9 |
Publisher’s Note: MDPI stays neutral with regard to jurisdictional claims in published maps and institutional affiliations. |
© 2022 by the authors. Licensee MDPI, Basel, Switzerland. This article is an open access article distributed under the terms and conditions of the Creative Commons Attribution (CC BY) license (https://creativecommons.org/licenses/by/4.0/).
Share and Cite
Xu, W.; Luo, H.; Ouyang, M.; Long, T.; Lin, Q. In Situ Direct Monitoring of the Morphological Transformation of Single Au Nanostars Induced by Iodide through Dual-Laser Dark-Field Microscopy: Unexpected Mechanism and Sensing Applications. Nanomaterials 2022, 12, 2555. https://doi.org/10.3390/nano12152555
Xu W, Luo H, Ouyang M, Long T, Lin Q. In Situ Direct Monitoring of the Morphological Transformation of Single Au Nanostars Induced by Iodide through Dual-Laser Dark-Field Microscopy: Unexpected Mechanism and Sensing Applications. Nanomaterials. 2022; 12(15):2555. https://doi.org/10.3390/nano12152555
Chicago/Turabian StyleXu, Weizhen, Hongmei Luo, Min Ouyang, Tiantian Long, and Qinlu Lin. 2022. "In Situ Direct Monitoring of the Morphological Transformation of Single Au Nanostars Induced by Iodide through Dual-Laser Dark-Field Microscopy: Unexpected Mechanism and Sensing Applications" Nanomaterials 12, no. 15: 2555. https://doi.org/10.3390/nano12152555
APA StyleXu, W., Luo, H., Ouyang, M., Long, T., & Lin, Q. (2022). In Situ Direct Monitoring of the Morphological Transformation of Single Au Nanostars Induced by Iodide through Dual-Laser Dark-Field Microscopy: Unexpected Mechanism and Sensing Applications. Nanomaterials, 12(15), 2555. https://doi.org/10.3390/nano12152555