
Adsorption of Methylene Blue from Aqueous Solution Using Gelatin-Based Carboxylic Acid-Functionalized Carbon Nanotubes@Metal–Organic Framework Composite Beads

 and
and
Abstract
:Highlights
- A new gelatin composite was used to remove methylene blue.
- The adsorbent was composed of carbon nanotubes, a metal–organic framework and gelatin.
- The adsorbent had a simple preparation process and was friendly to the environment.
- The fixation of carbon nanomaterials with gelatin as the substrate avoided secondary pollution.
- Using carbon nanotubes as the intermediate improved the adsorption capacity.
Abstract
1. Introduction
2. Materials and Methods
2.1. Reagents and Materials
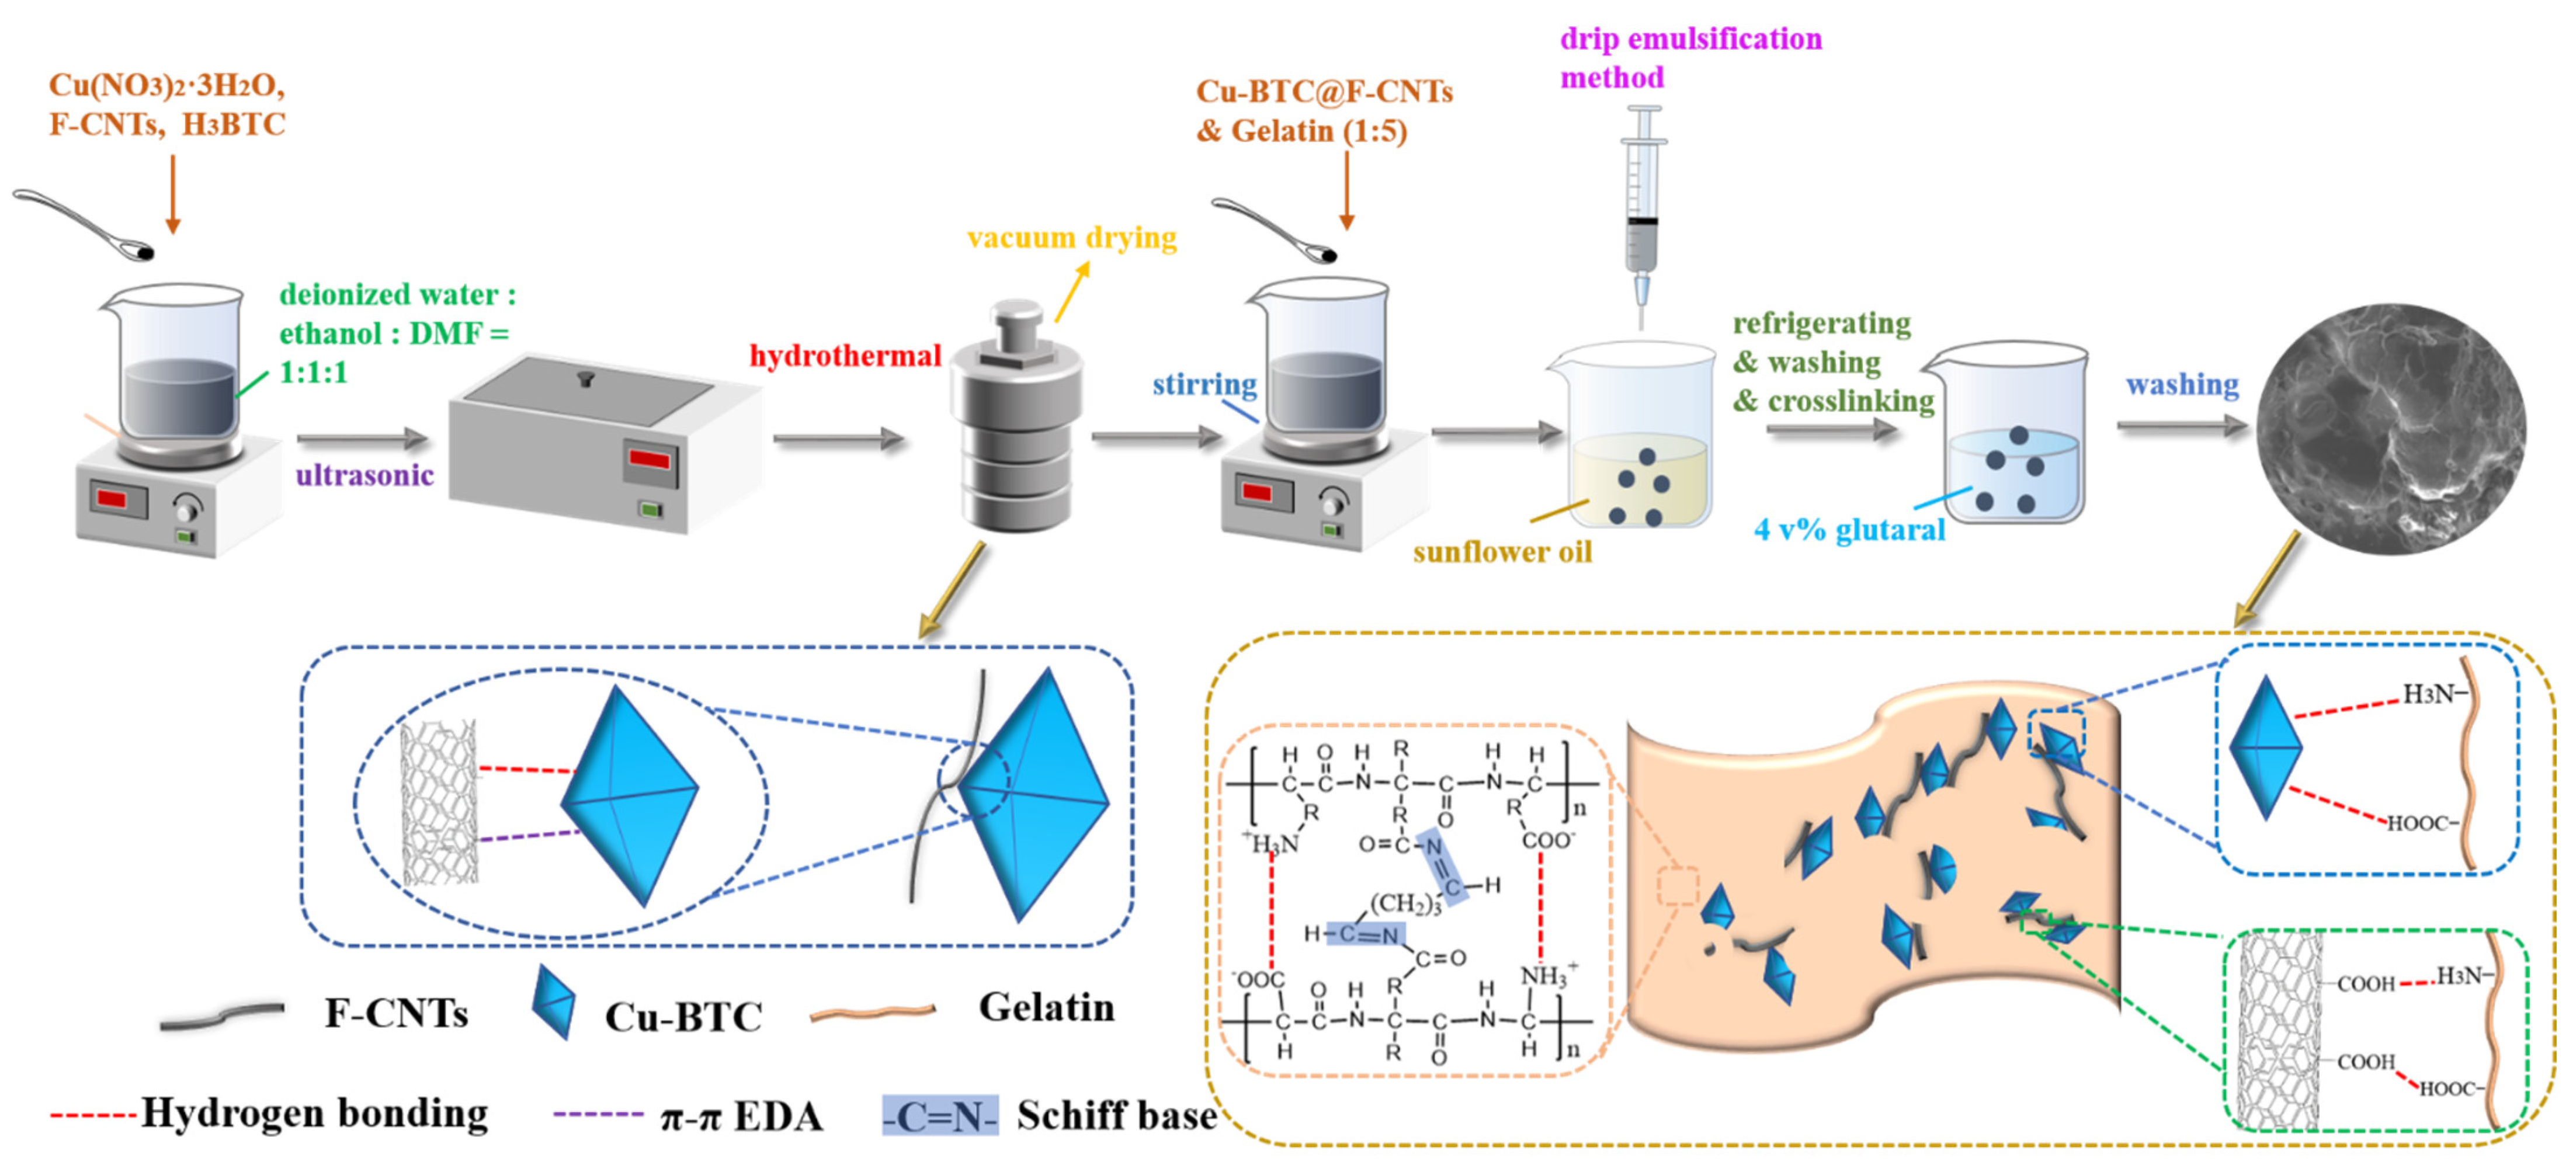
2.2. Preparation of F-CNTs
2.3. Synthesis of F-CNTs@Cu-BTC
2.4. Synthesis of F-CNTs@Cu-BTC@Gel Beads
2.5. Characterization
2.6. Adsorption Experiments
2.7. Model Selection Criteria
2.8. Regeneration Experiments
3. Results and Discussions
3.1. Characterization Results of Materials
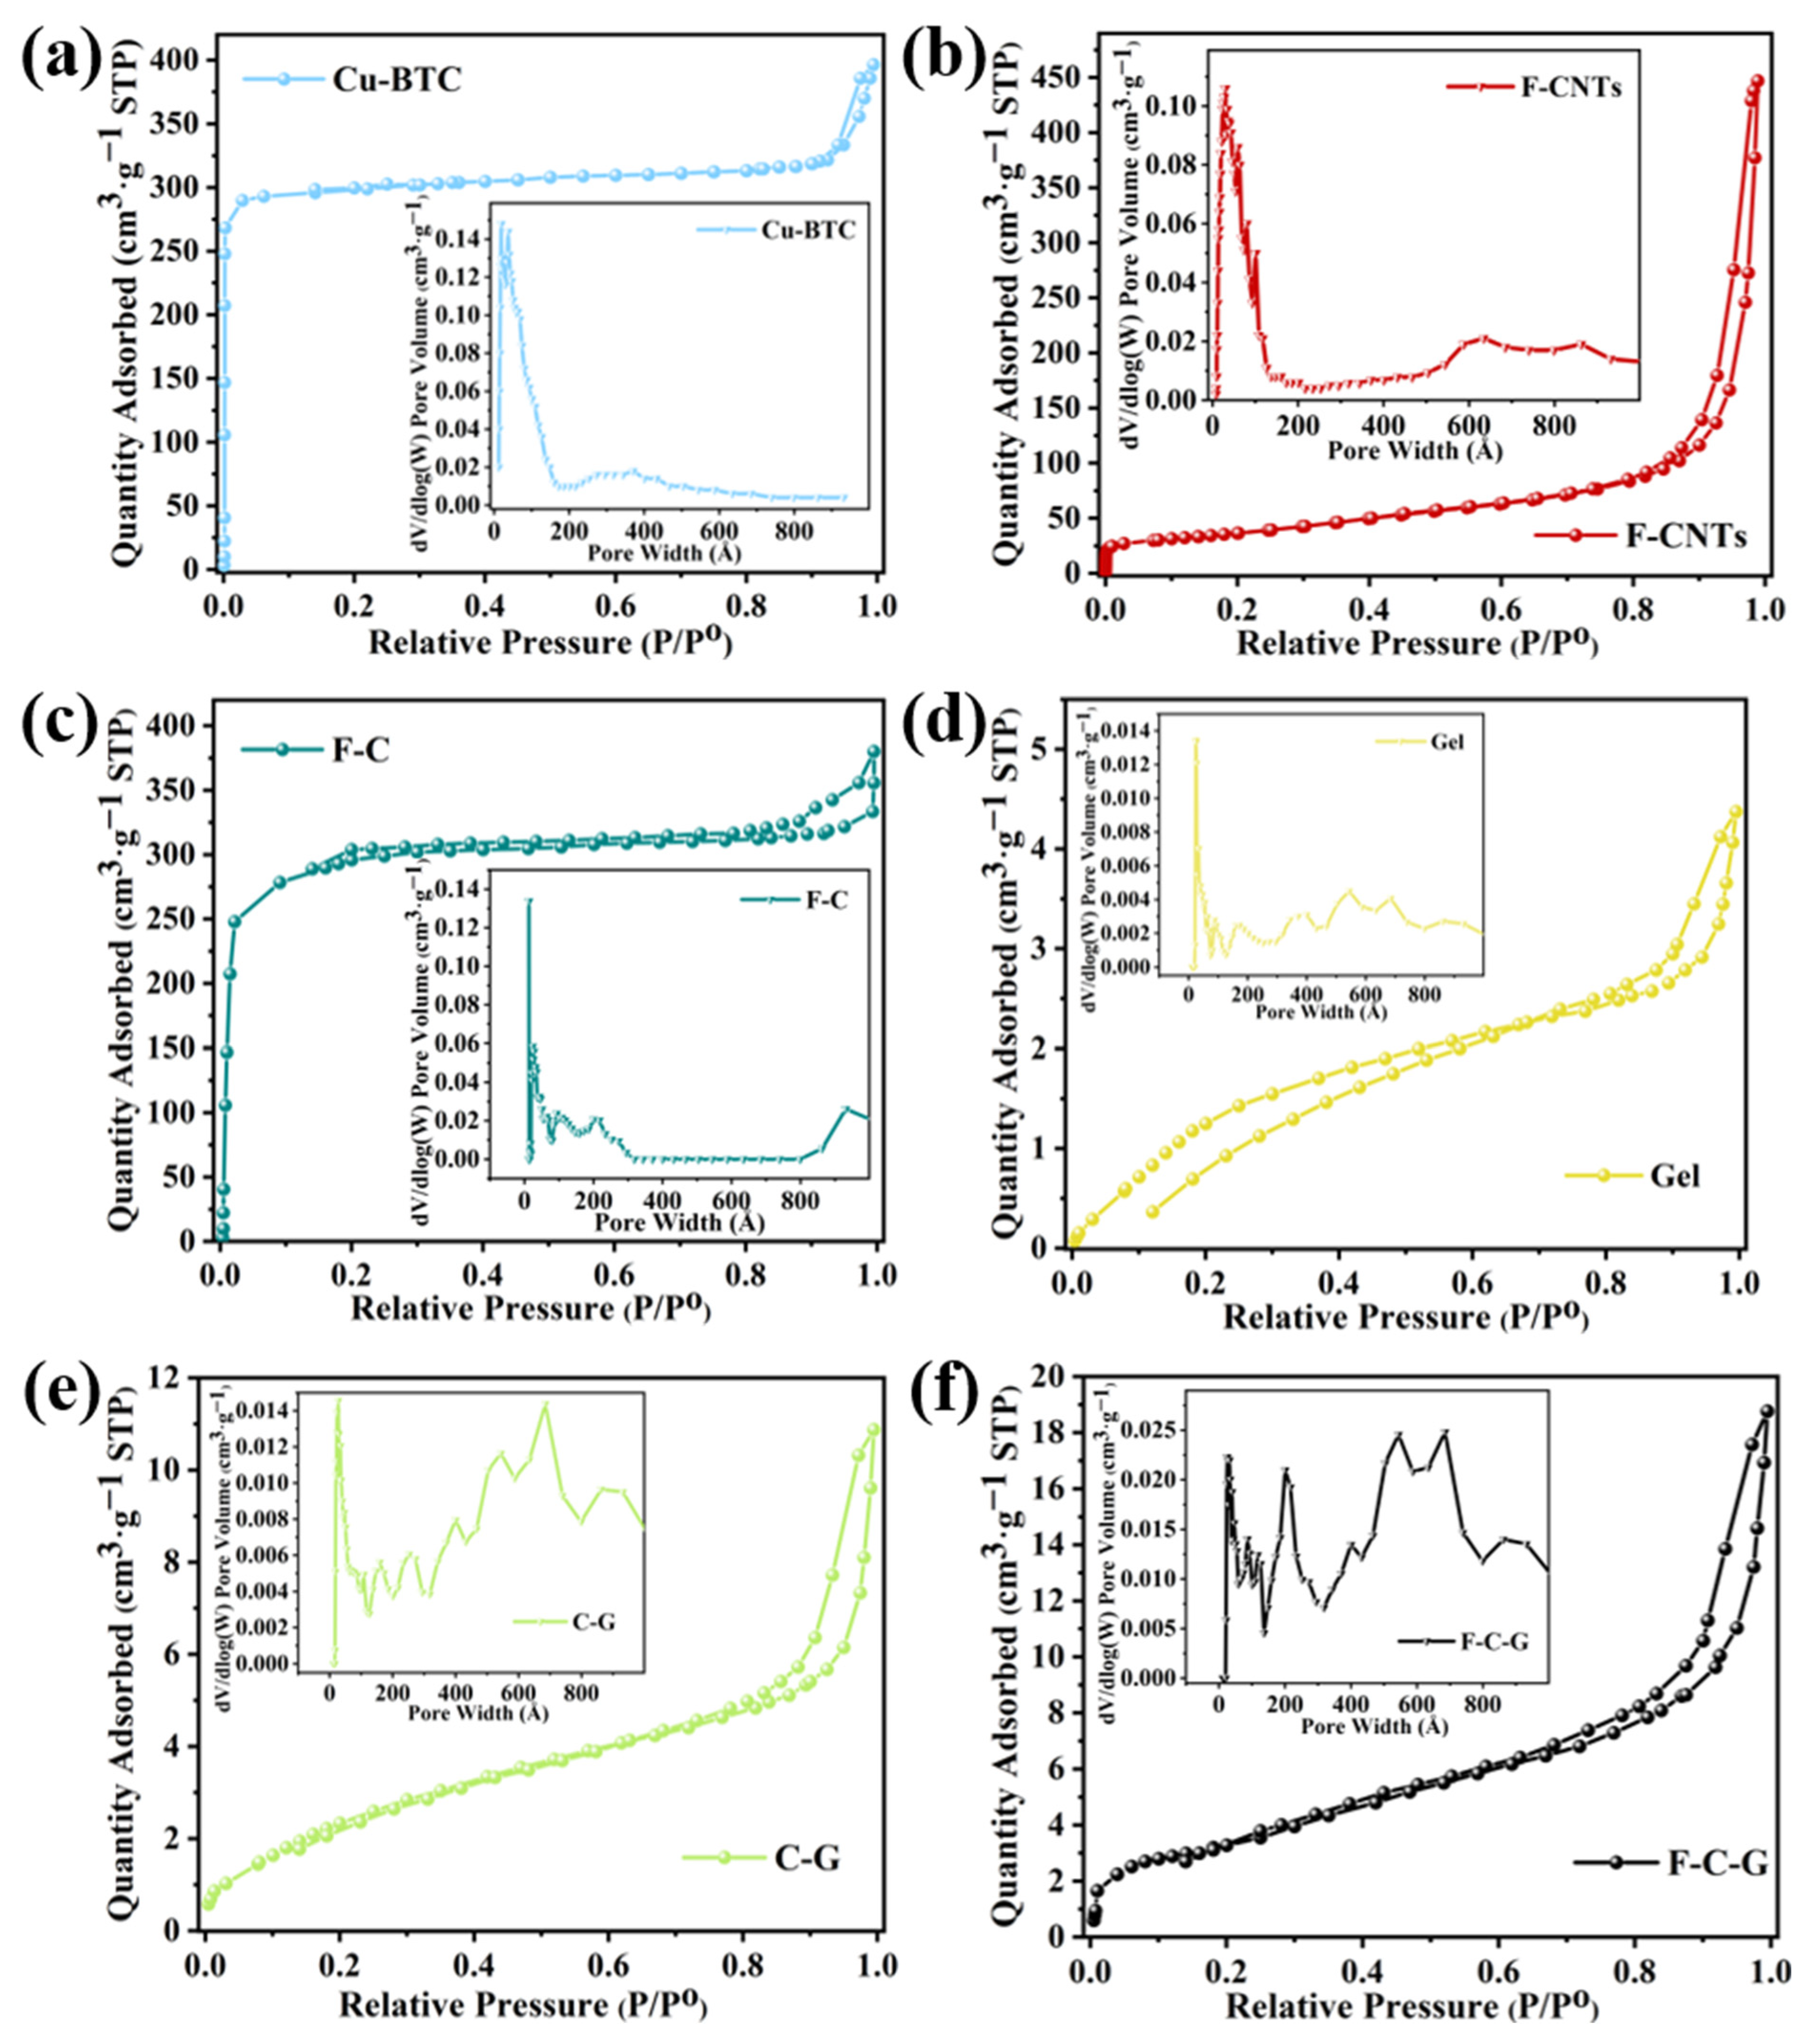
3.1.1. BET Analysis
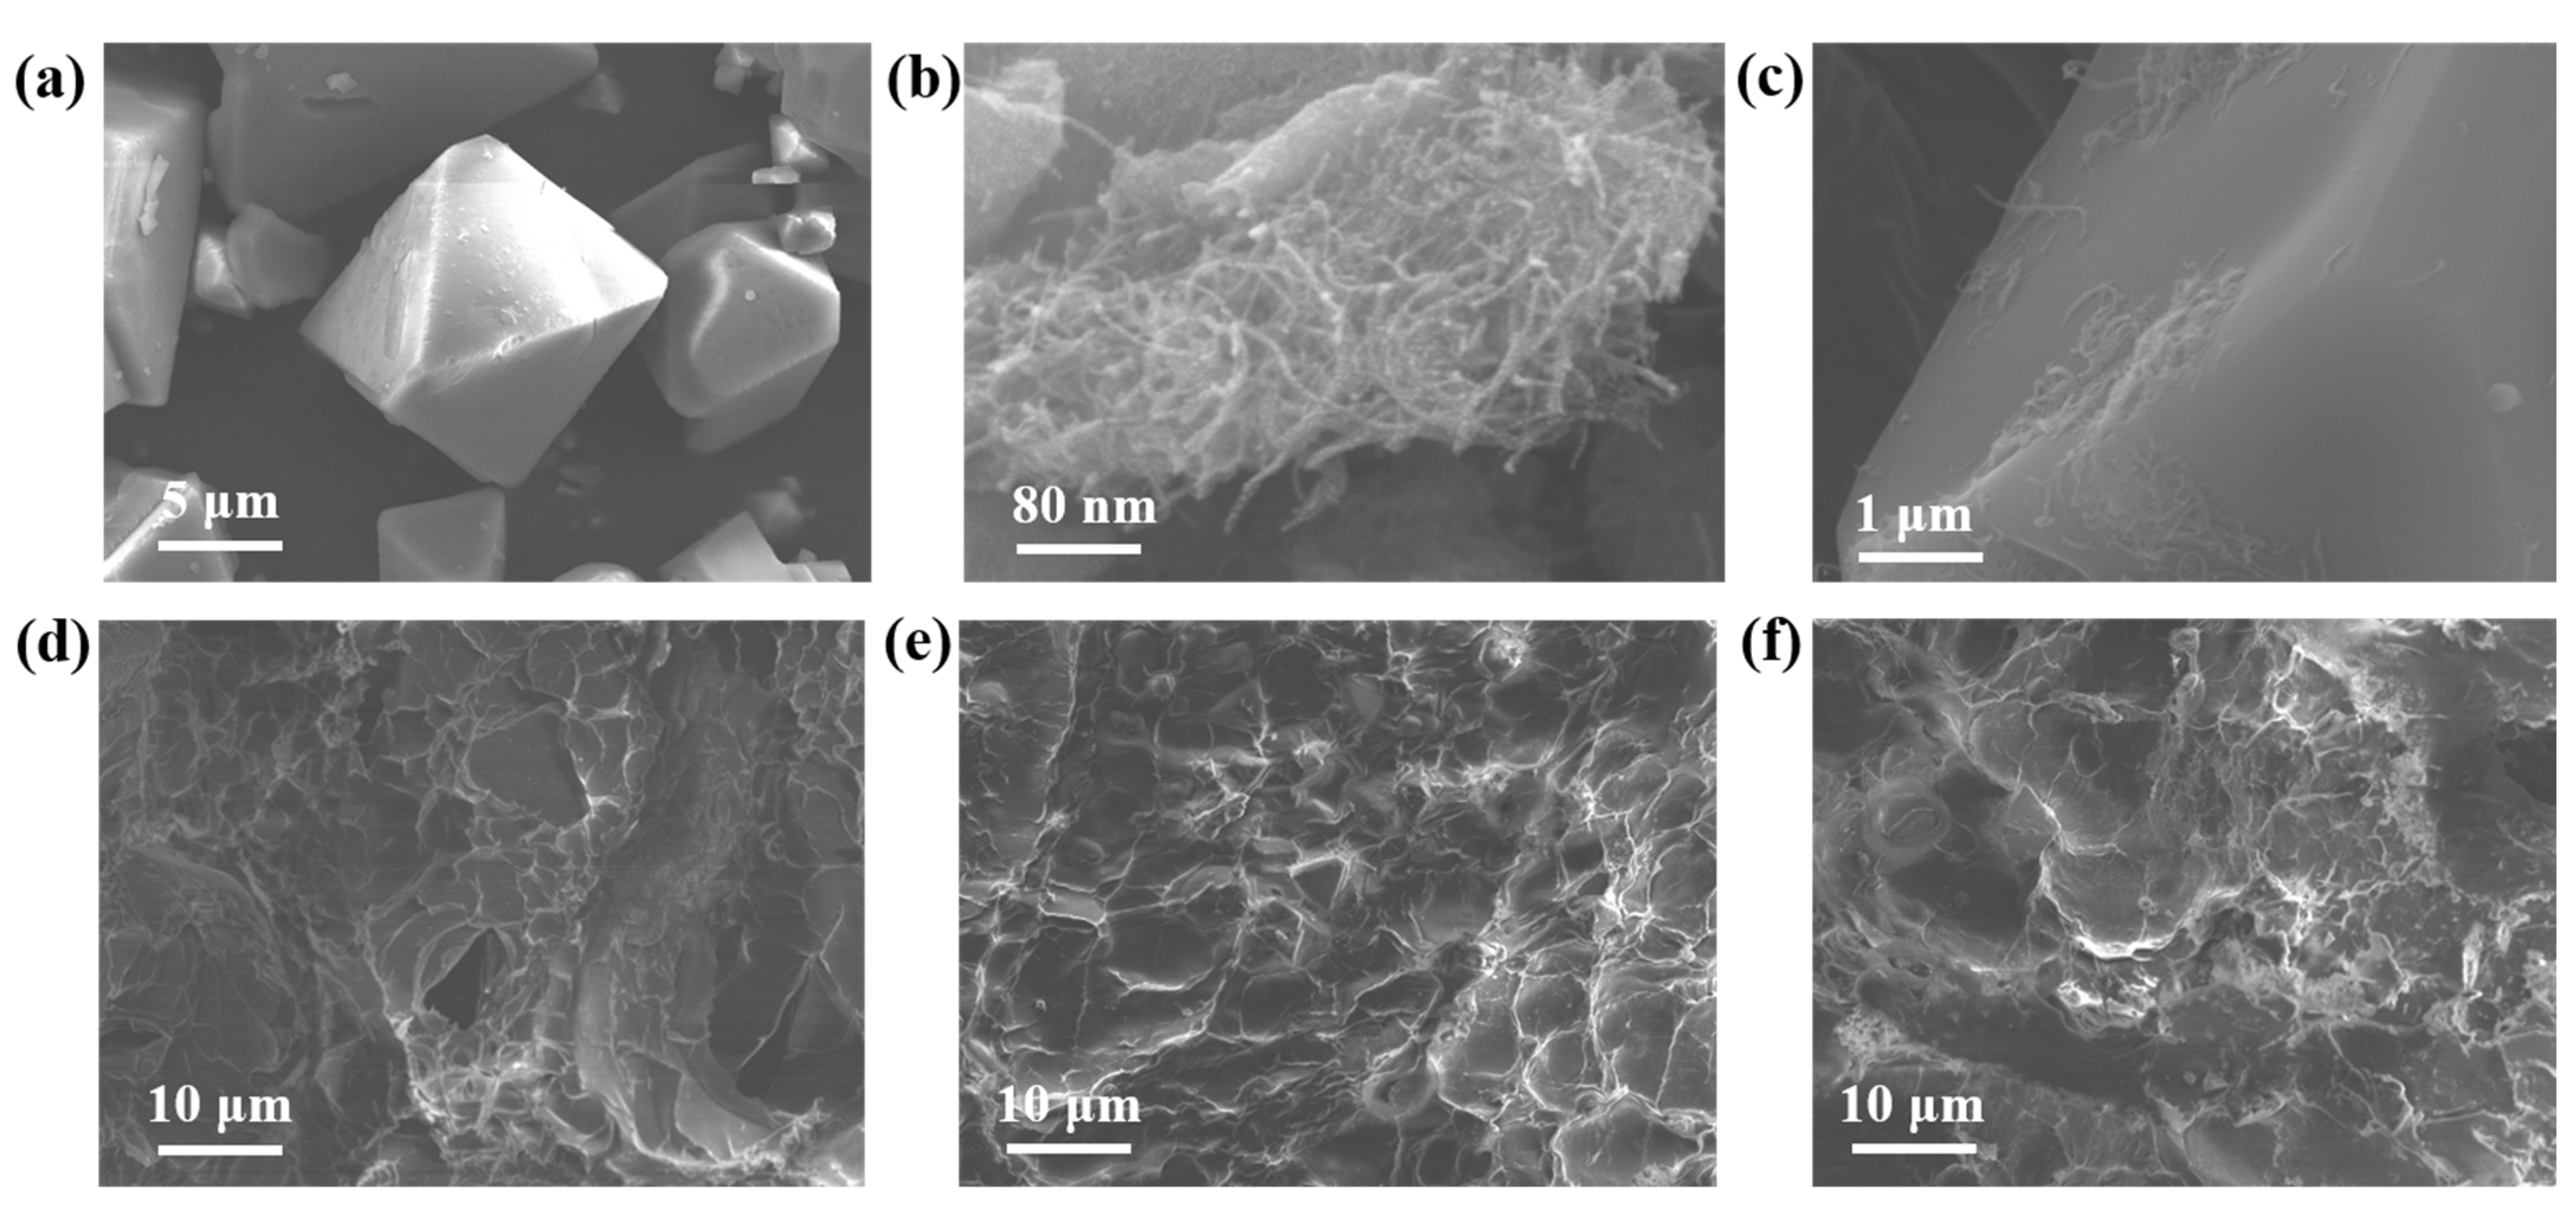
3.1.2. SEM Analysis
3.1.3. TGA and DTG Results
3.1.4. XRD Results
3.1.5. FTIR Results
3.2. Results of Adsorption Experiments
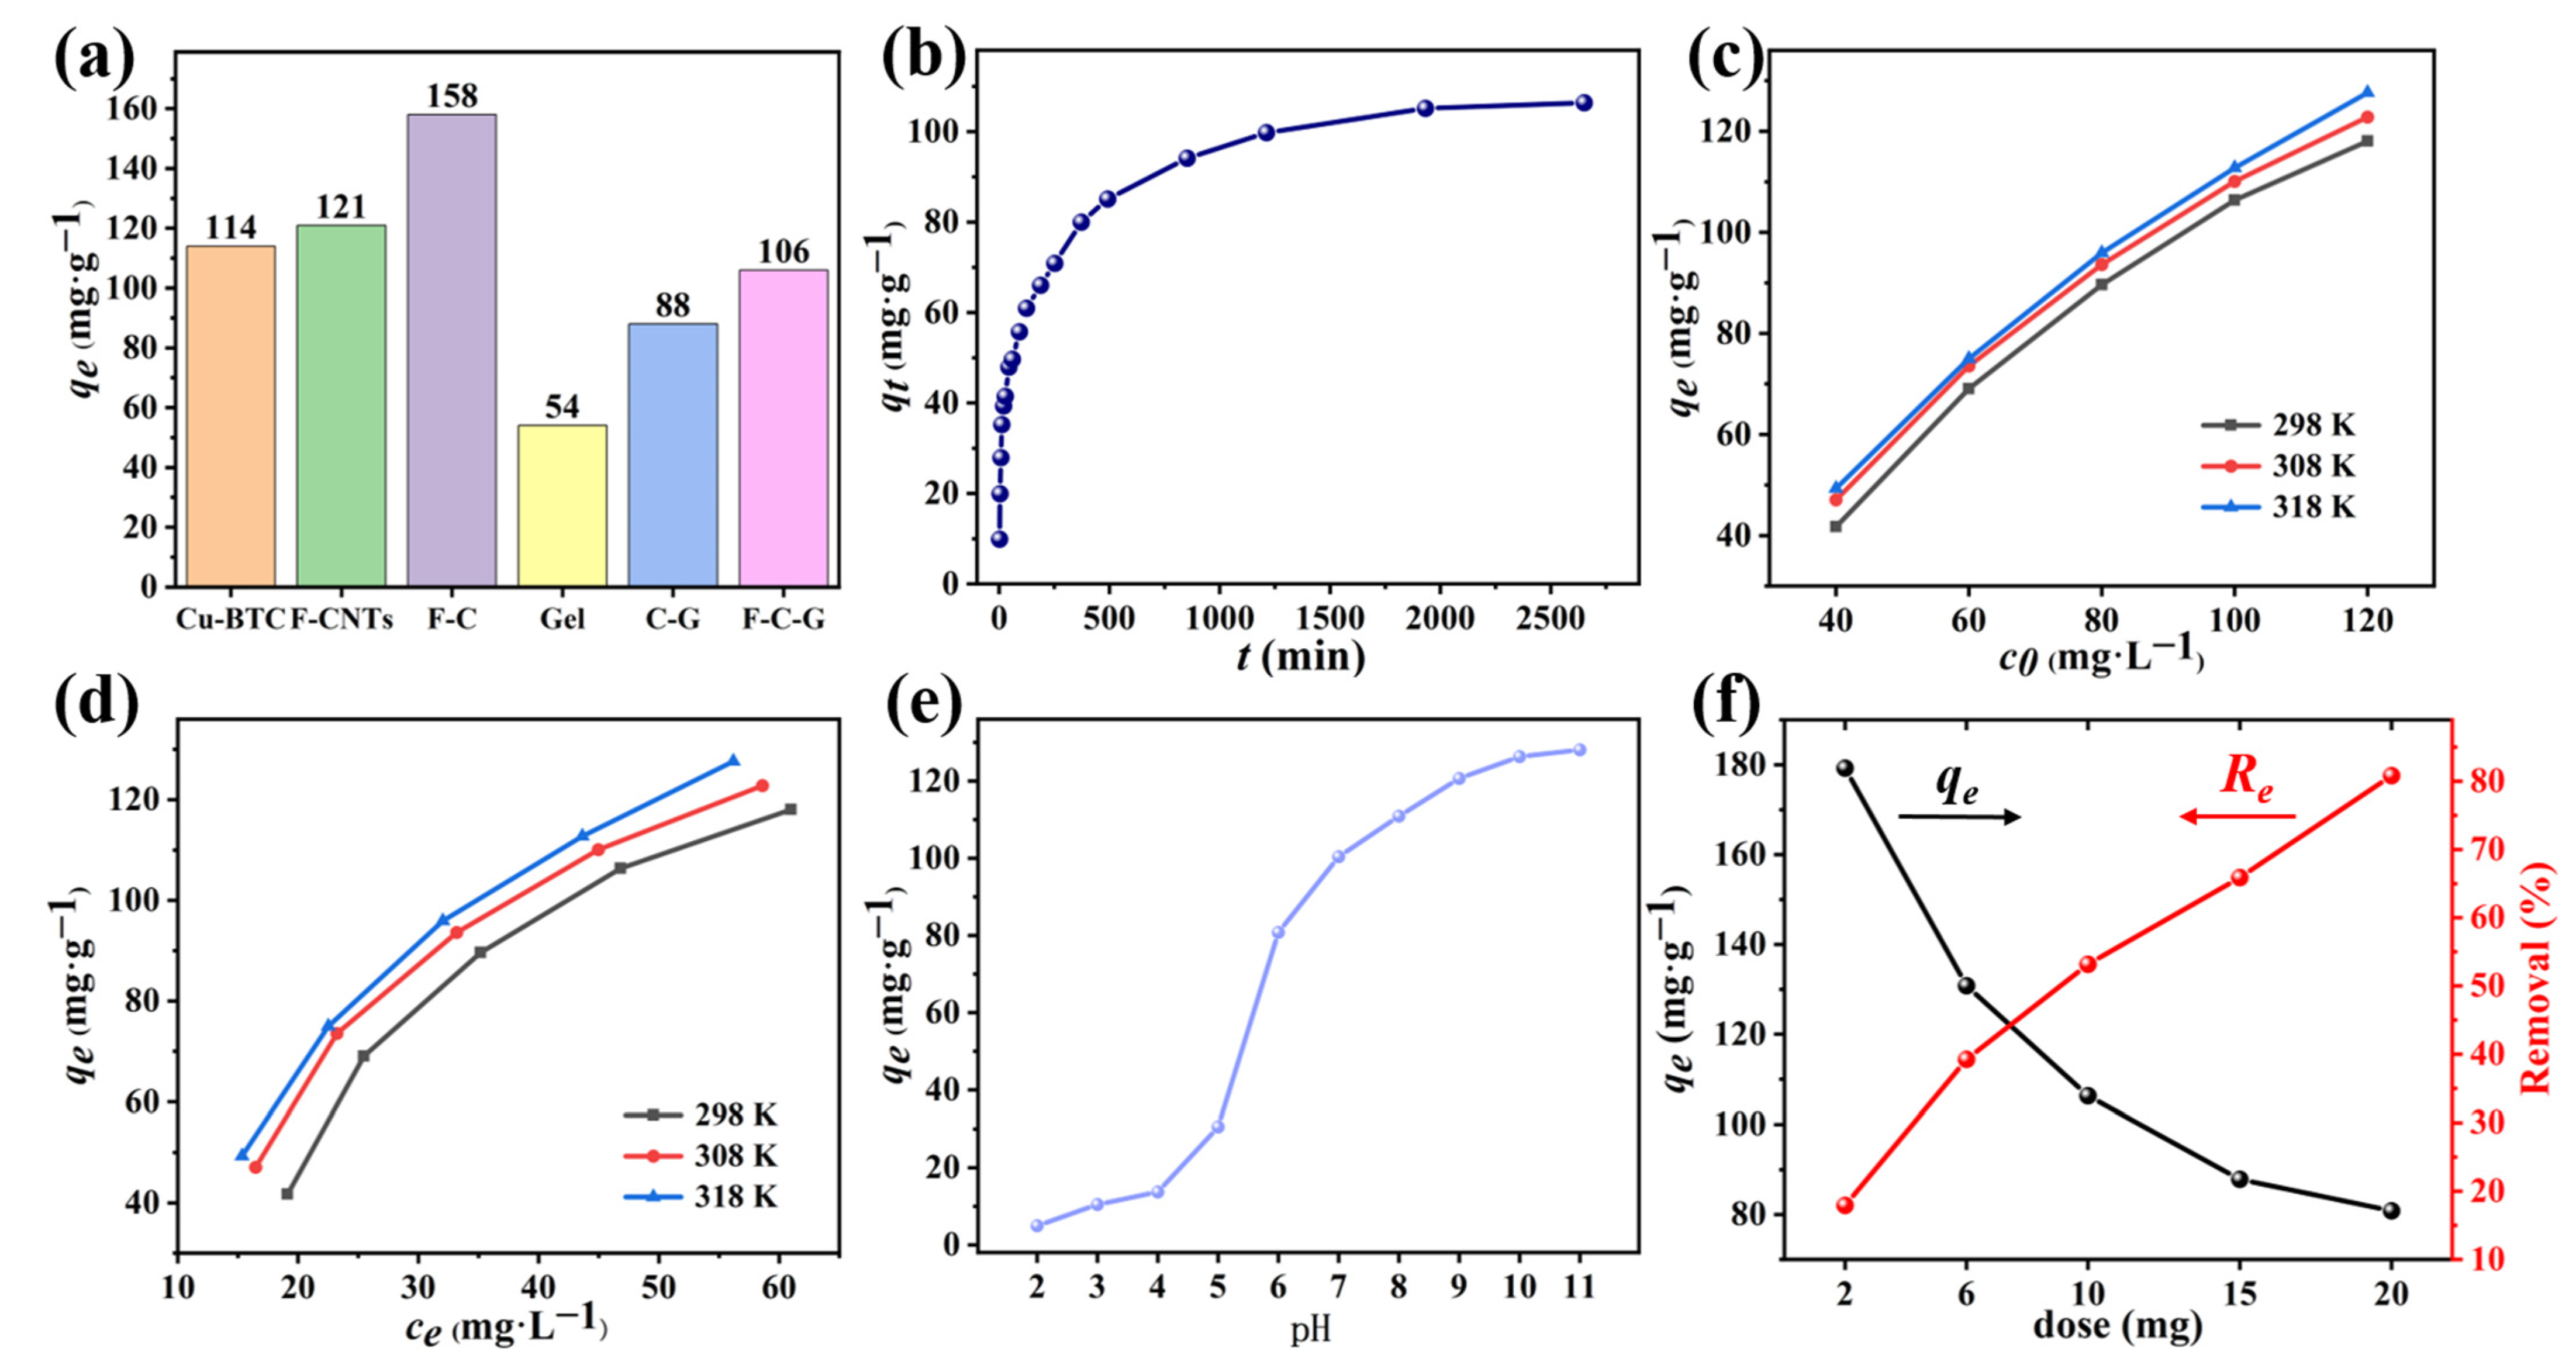
3.2.1. Comparison of Adsorption Properties of Six Adsorbents
3.2.2. Effects of Different Conditions
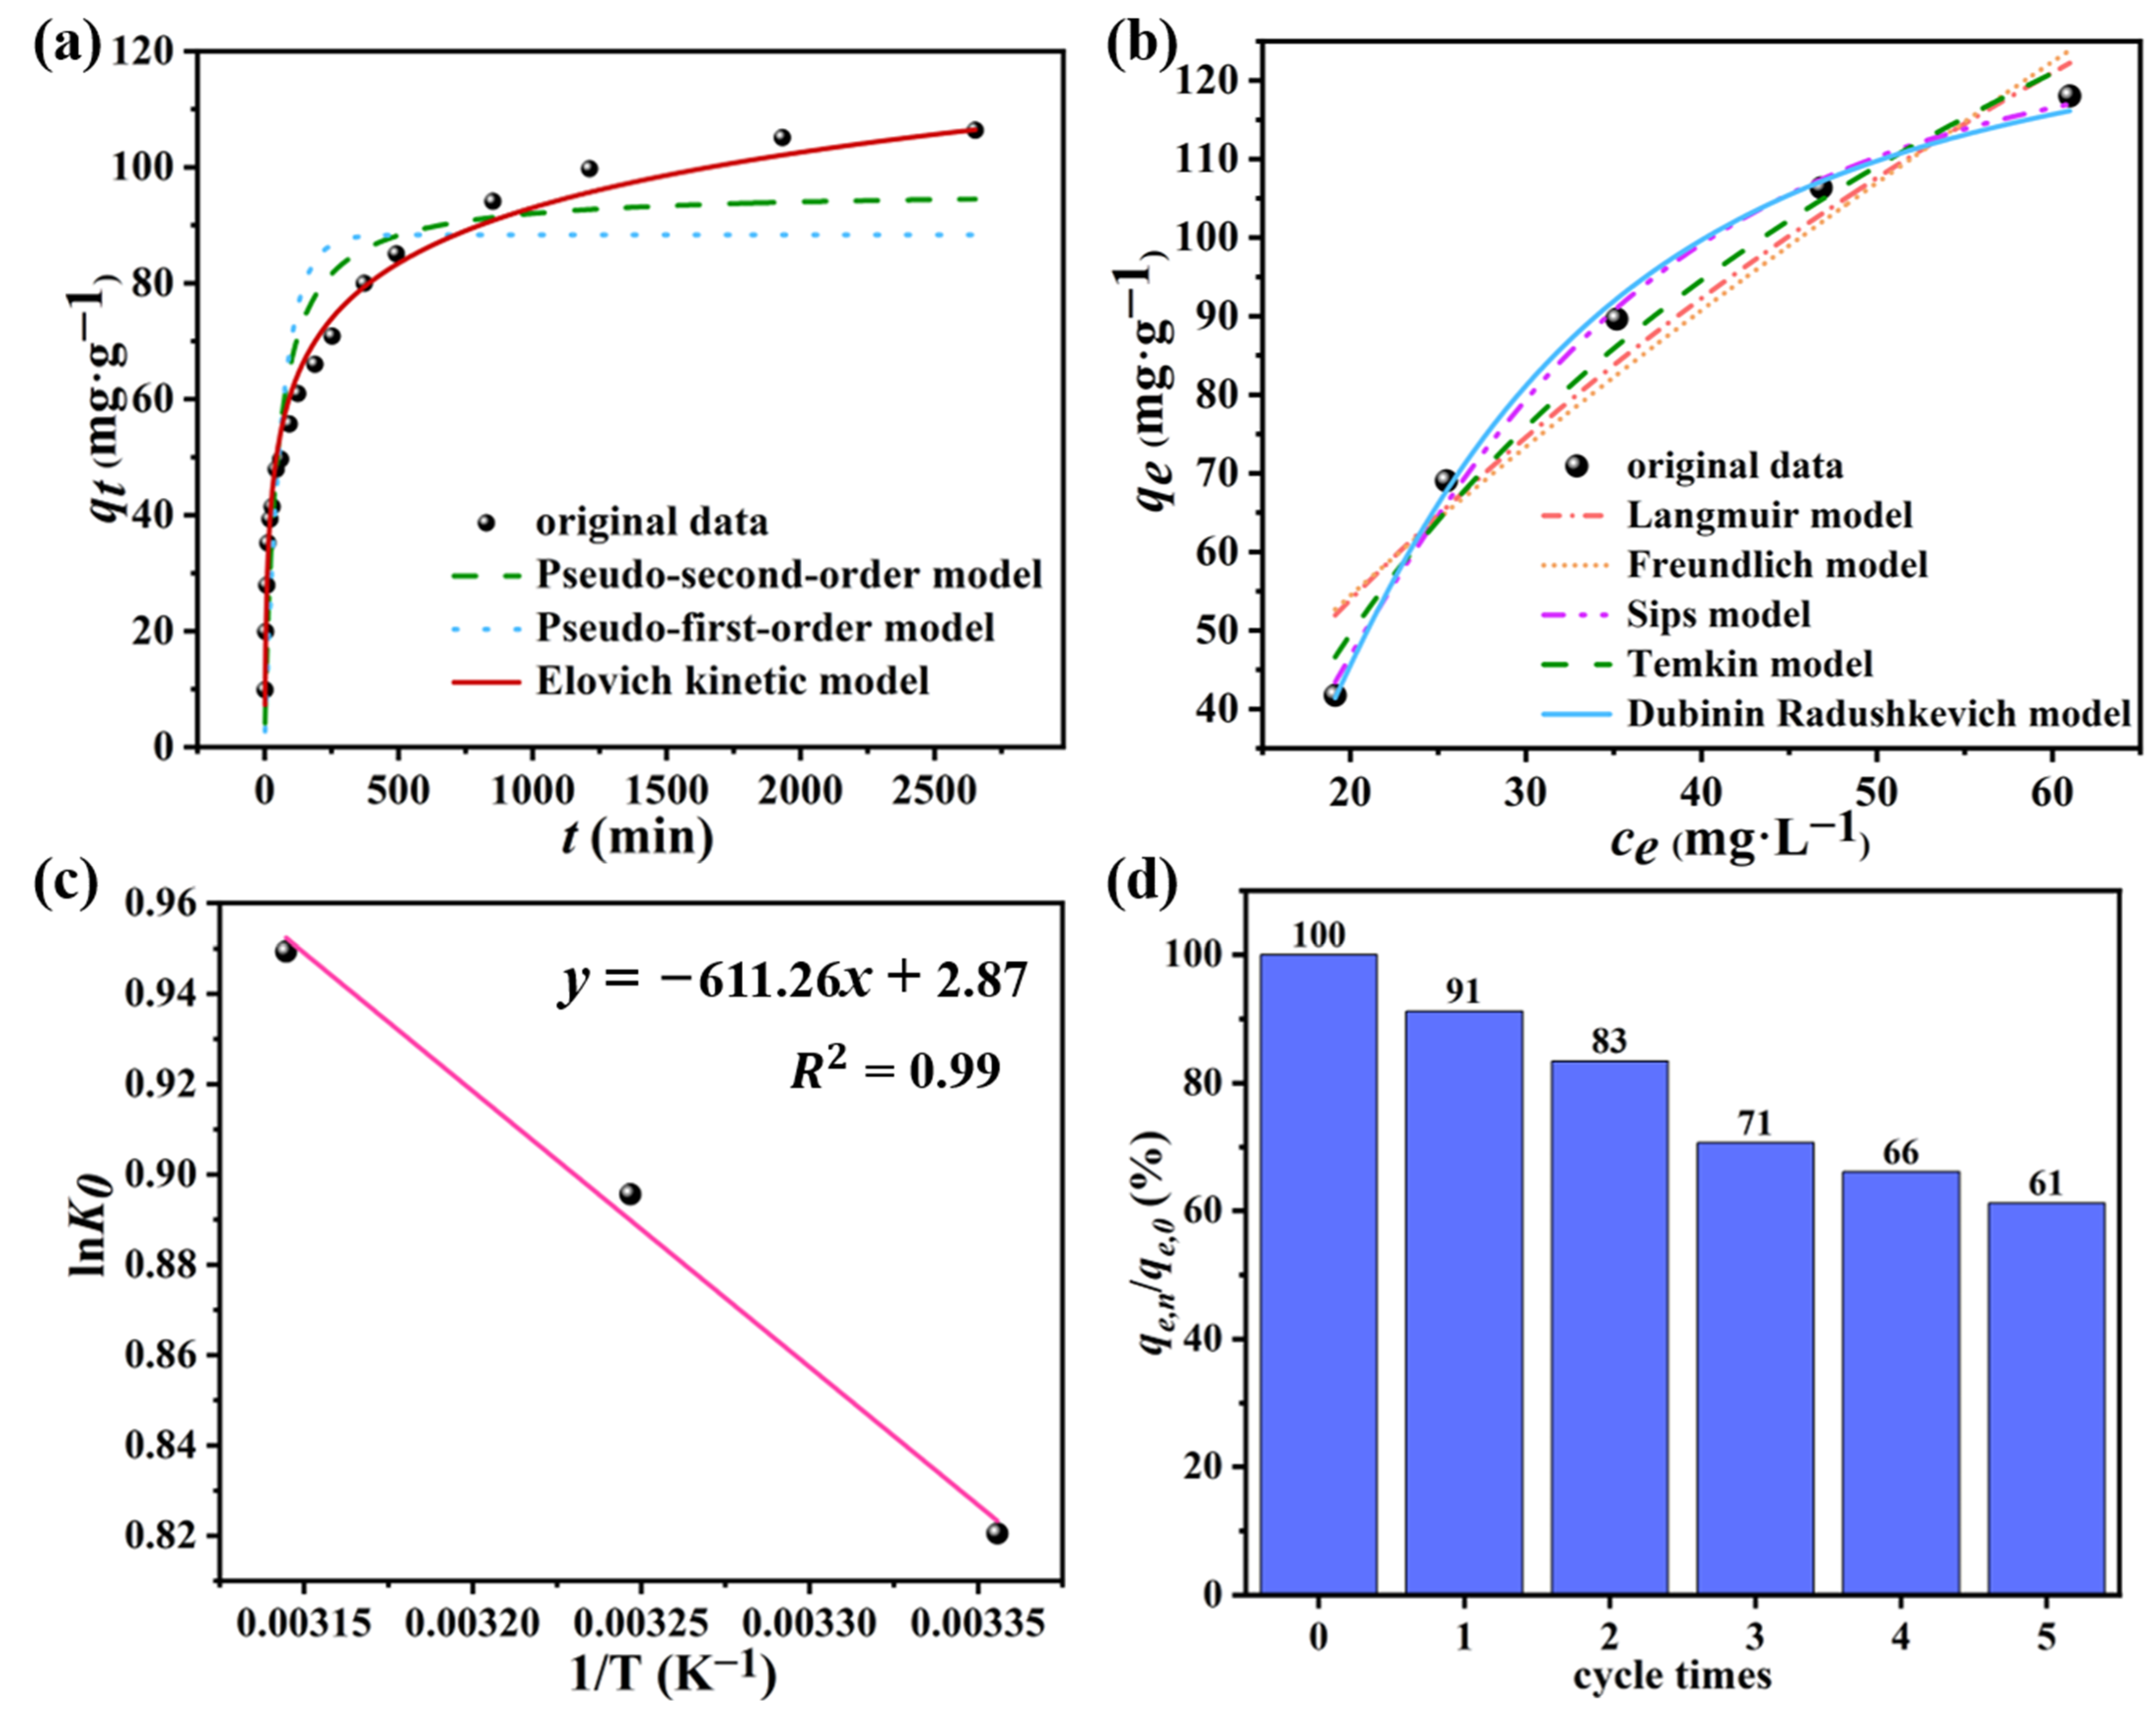
3.3. Adsorption Kinetics and Adsorption Isotherm Analysis
3.3.1. Adsorption Kinetics
3.3.2. Adsorption isotherm
3.4. Adsorption Thermodynamic
3.5. Results of Regeneration Experiment
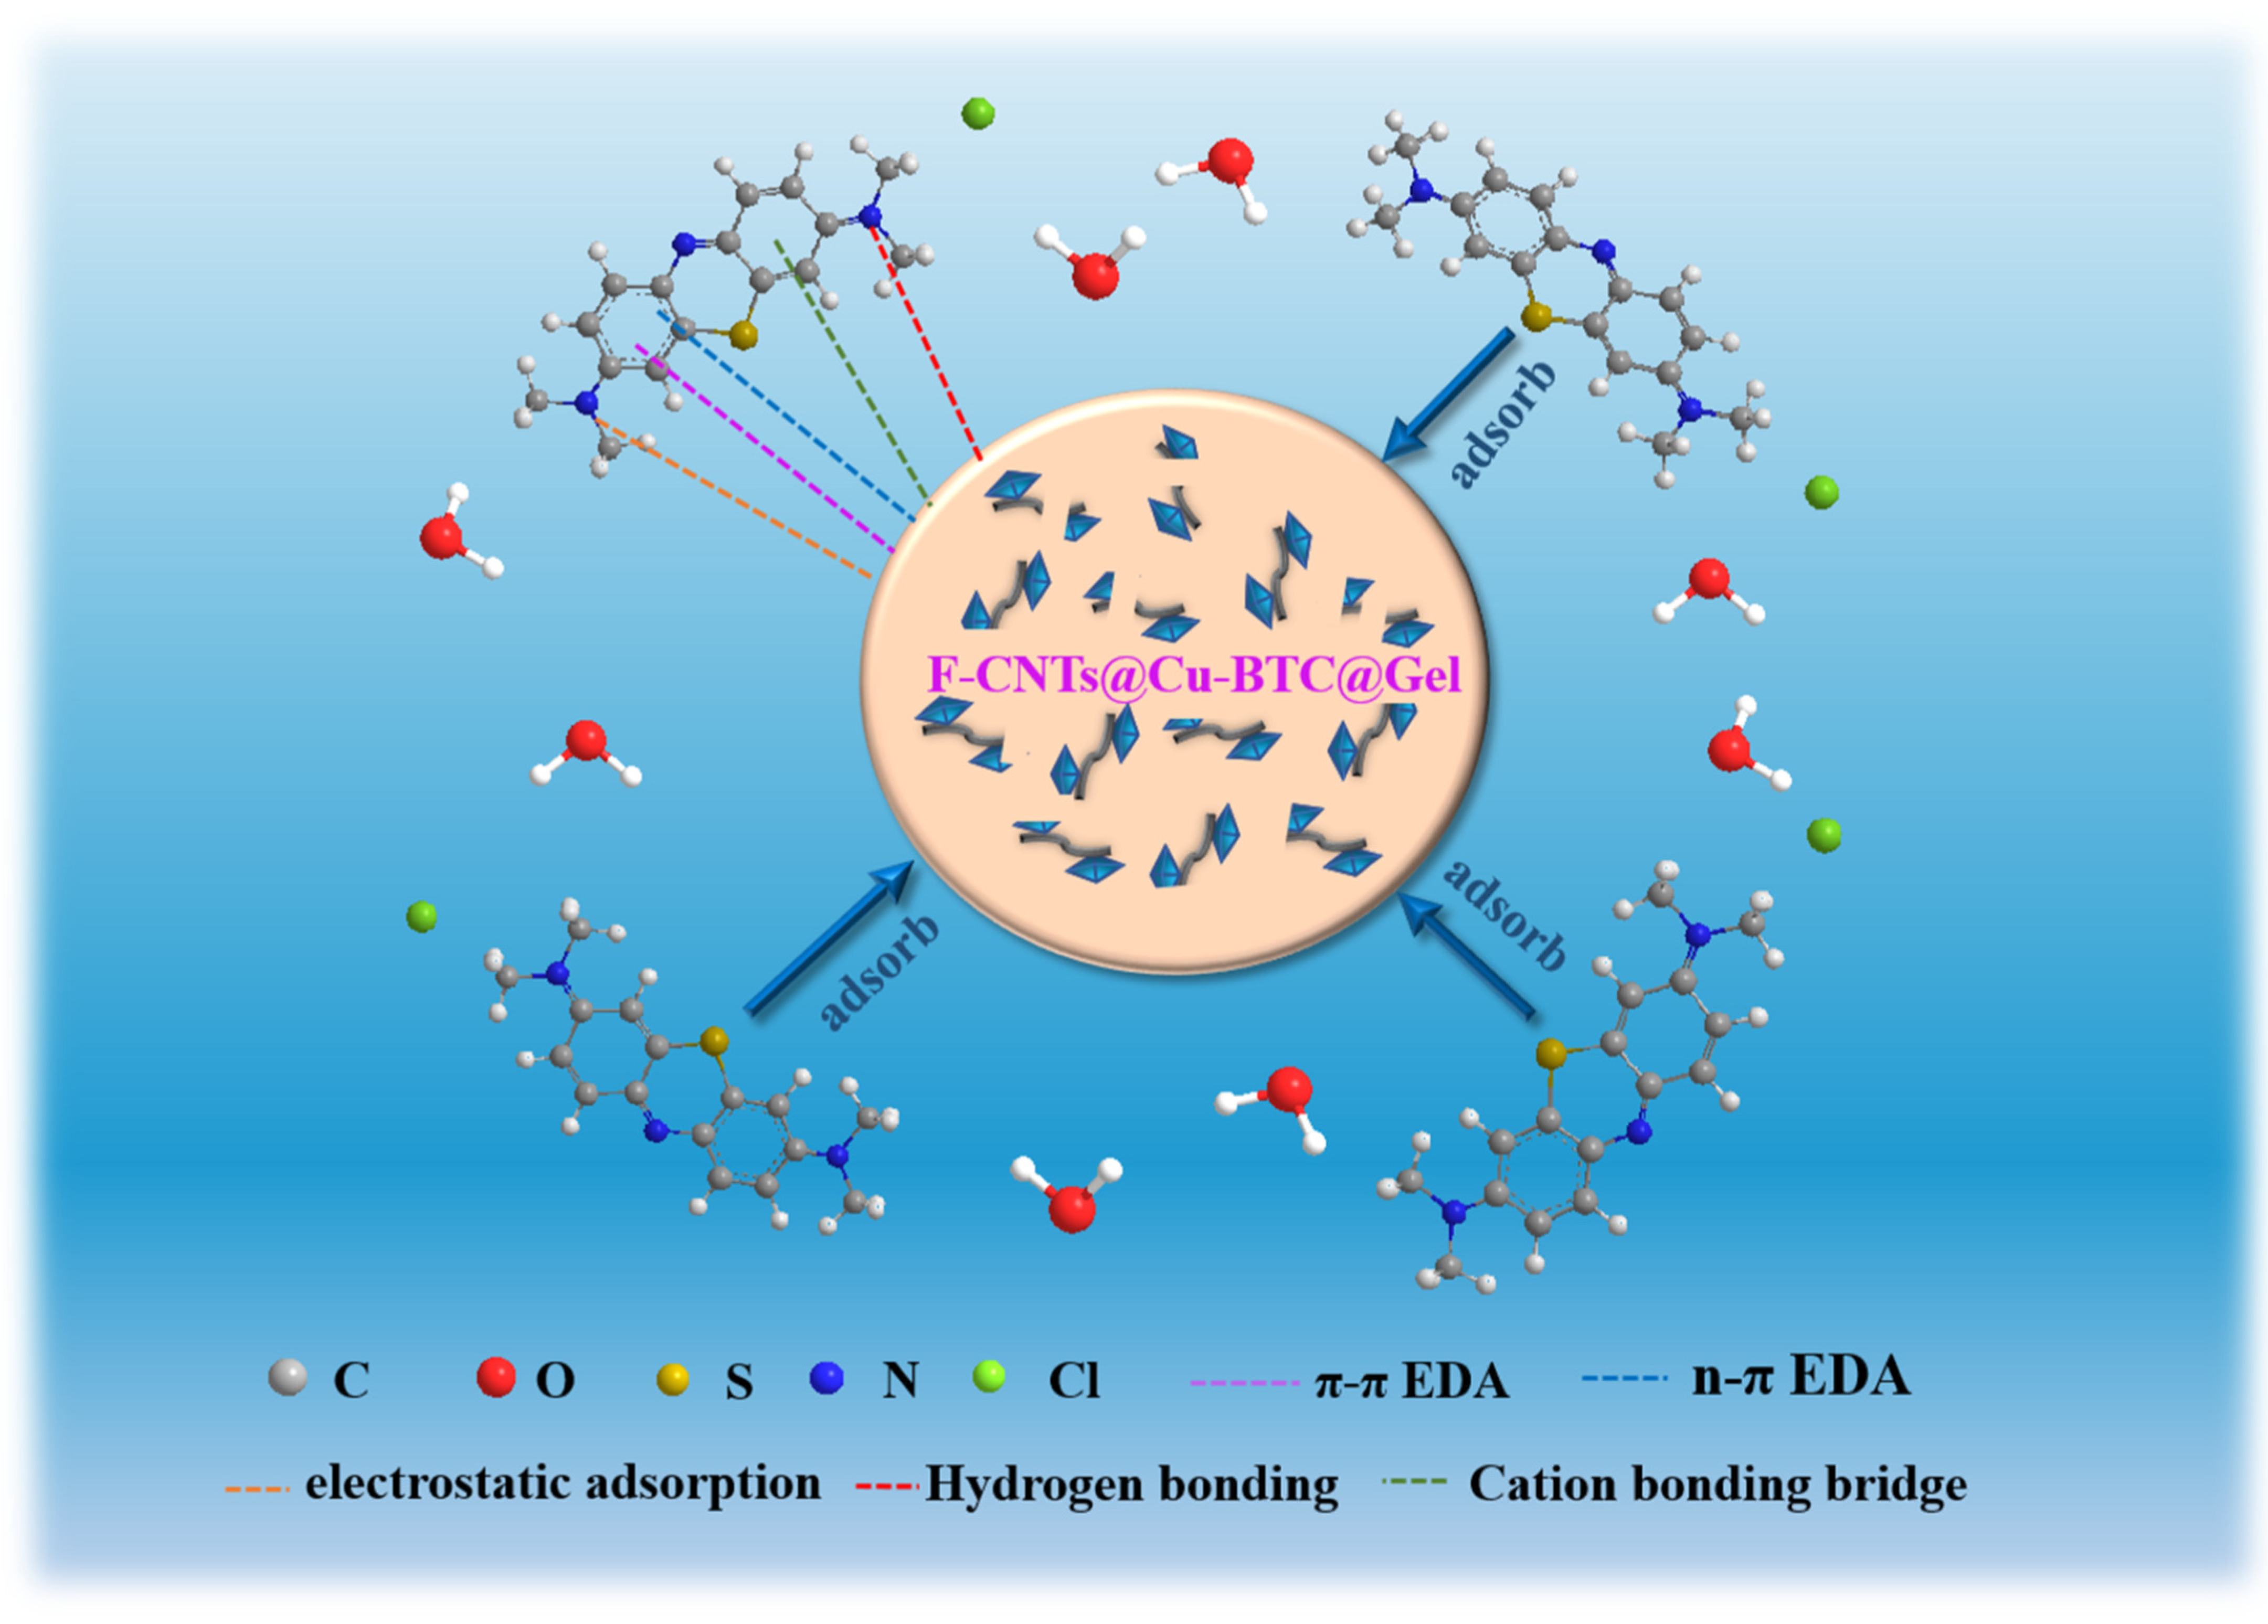
3.6. Analysis of Adsorption Mechanism
3.7. Comparison of Adsorption of Methylene Blue on Various Adsorbents
4. Conclusions
Author Contributions
Funding
Institutional Review Board Statement
Informed Consent Statement
Data Availability Statement
Acknowledgments
Conflicts of Interest
References
- Youcef, L.D.; Belaroui, L.S.; Lopez-Galindo, A. Adsorption of a cationic methylene blue dye on an Algerian palygorskite. Appl. Clay Sci. 2019, 179, 105145. [Google Scholar] [CrossRef]
- Alver, E.; Metin, A.U.; Brouers, F. Methylene blue adsorption on magnetic alginate/rice husk bio-composite. Int. J. Biol. Macromol. 2020, 154, 104–113. [Google Scholar] [CrossRef] [PubMed]
- Nguyen, C.H.; Fu, C.-C.; Juang, R.-S. Degradation of methylene blue and methyl orange by palladium-doped TiO2 photocatalysis for water reuse: Efficiency and degradation pathways. J. Clean. Prod. 2018, 202, 413–427. [Google Scholar] [CrossRef]
- Zhang, Y.; Li, Y.; Xu, W.; Cui, M.; Wang, M.; Chen, B.; Sun, Y.; Chen, K.; Li, L.; Du, Q.; et al. Filtration and adsorption of tetracycline in aqueous solution by copper alginate-carbon nanotubes membrane which has the muscle-skeleton structure. Chem. Eng. Res. Des. 2022, 183, 424–438. [Google Scholar] [CrossRef]
- Lyu, H.; Gao, B.; He, F.; Zimmerman, A.R.; Ding, C.; Tang, J.; Crittenden, J.C. Experimental and modeling investigations of ball-milled biochar for the removal of aqueous methylene blue. Chem. Eng. J. 2018, 335, 110–119. [Google Scholar] [CrossRef]
- Machado, T.F.; Serra, M.E.S.; Murtinho, D.; Valente, A.J.M.; Naushad, M. Covalent Organic Frameworks: Synthesis, Properties and Applications—An Overview. Polymers 2021, 13, 970. [Google Scholar] [CrossRef]
- Munir, M.; Nazar, M.F.; Zafar, M.N.; Zubair, M.; Ashfaq, M.; Hosseini-Bandegharaei, A.; Khan, S.U.-D.; Ahmad, A. Effective Adsorptive Removal of Methylene Blue from Water by Didodecyldimethylammonium Bromide-Modified Brown Clay. ACS Omega 2020, 5, 16711–16721. [Google Scholar] [CrossRef]
- Yang, Y.; Zhu, Q.; Peng, X.; Sun, J.; Li, C.; Zhang, X.; Zhang, H.; Chen, J.; Zhou, X.; Zeng, H.; et al. Hydrogels for the removal of the methylene blue dye from wastewater: A review. Environ. Chem. Lett. 2022. [Google Scholar] [CrossRef]
- Kumar, A.; Jena, H.M. Removal of methylene blue and phenol onto prepared activated carbon from Fox nutshell by chemical activation in batch and fixed-bed column. J. Clean. Prod. 2016, 137, 1246–1259. [Google Scholar] [CrossRef]
- Soni, S.; Bajpai, P.; Mittal, J.; Arora, C. Utilisation of cobalt doped Iron based MOF for enhanced removal and recovery of methylene blue dye from waste water. J. Mol. Liq. 2020, 314, 113642. [Google Scholar] [CrossRef]
- Li, Y.; Du, Q.; Liu, T.; Peng, X.; Wang, J.; Sun, J.; Wang, Y.; Wu, S.; Wang, Z.; Xia, Y.; et al. Comparative study of methylene blue dye adsorption onto activated carbon, graphene oxide, and carbon nanotubes. Chem. Eng. Res. Des. 2013, 91, 361–368. [Google Scholar] [CrossRef]
- Li, Y.-Z.; Wang, G.-D.; Yang, H.-Y.; Hou, L.; Wang, Y.-Y.; Zhu, Z. Novel cage-like MOF for gas separation, CO2 conversion and selective adsorption of an organic dye. Inorg. Chem. Front. 2020, 7, 746–755. [Google Scholar] [CrossRef]
- Chen, B.; Li, Y.; Li, M.; Cui, M.; Xu, W.; Li, L.; Sun, Y.; Wang, M.; Zhang, Y.; Chen, K. Rapid adsorption of tetracycline in aqueous solution by using MOF-525/graphene oxide composite. Microporous Mesoporous Mater. 2021, 328, 111457. [Google Scholar] [CrossRef]
- Li, Y.; Gao, C.; Jiao, J.; Cui, J.; Li, Z.; Song, Q. Selective Adsorption of Metal–Organic Framework toward Methylene Blue: Behavior and Mechanism. ACS Omega 2021, 6, 33961–33968. [Google Scholar] [CrossRef]
- Lin, S.; Song, Z.; Che, G.; Ren, A.; Li, P.; Liu, C.; Zhang, J. Adsorption behavior of metal–organic frameworks for methylene blue from aqueous solution. Microporous Mesoporous Mater. 2014, 193, 27–34. [Google Scholar] [CrossRef]
- Lahtinen, E.; Precker, R.L.M.; Lahtinen, M.; Hey-Hawkins, E.; Haukka, M. Selective Laser Sintering of Metal-Organic Frameworks: Production of Highly Porous Filters by 3D Printing onto a Polymeric Matrix. ChemPlusChem 2019, 84, 222–225. [Google Scholar] [CrossRef] [PubMed] [Green Version]
- Pei, R.; Fan, L.; Zhao, F.; Xiao, J.; Yang, Y.; Lai, A.; Zhou, S.-F.; Zhan, G. 3D-Printed metal-organic frameworks within biocompatible polymers as excellent adsorbents for organic dyes removal. J. Hazard. Mater. 2020, 384, 121418. [Google Scholar] [CrossRef]
- Saber-Samandari, S.; Saber-Samandari, S.; Joneidi-Yekta, H.; Mohseni, M. Adsorption of anionic and cationic dyes from aqueous solution using gelatin-based magnetic nanocomposite beads comprising carboxylic acid functionalized carbon nanotube. Chem. Eng. J. 2017, 308, 1133–1144. [Google Scholar] [CrossRef]
- Zhang, Y.; Wibowo, H.; Zhong, L.; Horttanainen, M.; Wang, Z.; Yu, C.; Yan, M. Cu-BTC-based composite adsorbents for selective adsorption of CO2 from syngas. Sep. Purif. Technol. 2021, 279, 119644. [Google Scholar] [CrossRef]
- Jabbari, V.; Veleta, J.; Zarei-Chaleshtori, M.; Gardea-Torresdey, J.; Villagrán, D. Green synthesis of magnetic MOF@GO and MOF@CNT hybrid nanocomposites with high adsorption capacity towards organic pollutants. Chem. Eng. J. 2016, 304, 774–783. [Google Scholar] [CrossRef] [Green Version]
- Rigueto, C.V.T.; Rosseto, M.; Nazari, M.T.; Ostwald, B.E.P.; Alessandretti, I.; Manera, C.; Piccin, J.S.; Dettmer, A. Adsorption of diclofenac sodium by composite beads prepared from tannery wastes-derived gelatin and carbon nanotubes. J. Environ. Chem. Eng. 2021, 9, 105030. [Google Scholar] [CrossRef]
- Santoso, E.; Ediati, R.; Kusumawati, Y.; Bahruji, H.; Sulistiono, D.O.; Prasetyoko, D. Review on recent advances of carbon based adsorbent for methylene blue removal from waste water. Mater. Today Chem. 2020, 16, 100233. [Google Scholar] [CrossRef]
- Zhang, X.; Li, Y.; Wu, M.; Pang, Y.; Hao, Z.; Hu, M.; Qiu, R.; Chen, Z. Enhanced adsorption of tetracycline by an iron and manganese oxides loaded biochar: Kinetics, mechanism and column adsorption. Bioresour. Technol. 2021, 320, 124264. [Google Scholar] [CrossRef] [PubMed]
- Cao, Y.; Dong, S.; Dai, Z.; Zhu, L.; Xiao, T.; Zhang, X.; Yin, S.; Soltanian, M.R. Adsorption model identification for chromium (VI) transport in unconsolidated sediments. J. Hydrol. 2021, 598, 126228. [Google Scholar] [CrossRef]
- Li, Y.; Liu, F.; Xia, B.; Du, Q.; Zhang, P.; Wang, D.; Wang, Z.; Xia, Y. Removal of copper from aqueous solution by carbon nanotube/calcium alginate composites. J. Hazard. Mater. 2010, 177, 876–880. [Google Scholar] [CrossRef]
- Ren, J.; Wang, X.; Zhao, L.; Li, M.; Yang, W. Double Network Gelatin/Chitosan Hydrogel Effective Removal of Dyes from Aqueous Solutions. J. Polym. Environ. 2021, 30, 2007–2021. [Google Scholar] [CrossRef]
- El-Naas, M.H.; Alhaija, M.A.; Al-Zuhair, S. Evaluation of an activated carbon packed bed for the adsorption of phenols from petroleum refinery wastewater. Environ. Sci. Pollut. Res. 2017, 24, 7511–7520. [Google Scholar] [CrossRef]
- Bouabidi, Z.B.; El-Naas, M.H.; Cortes, D.; McKay, G. Steel-Making dust as a potential adsorbent for the removal of lead (II) from an aqueous solution. Chem. Eng. J. 2018, 334, 837–844. [Google Scholar] [CrossRef]
- Wang, M.; Li, Y.; Cui, M.; Li, M.; Xu, W.; Li, L.; Sun, Y.; Chen, B.; Chen, K.; Zhang, Y. Barium alginate as a skeleton coating graphene oxide and bentonite-derived composites: Excellent adsorbent based on predictive design for the enhanced adsorption of methylene blue. J. Colloid Interface Sci. 2022, 611, 629–643. [Google Scholar] [CrossRef]
- Wang, W.; Tian, G.; Zhang, Z.; Wang, A. A simple hydrothermal approach to modify palygorskite for high-efficient adsorption of Methylene blue and Cu(II) ions. Chem. Eng. J. 2015, 265, 228–238. [Google Scholar] [CrossRef]
- Yan, L.; Liu, Y.; Zhang, Y.; Liu, S.; Wang, C.; Chen, W.; Liu, C.; Chen, Z.; Zhang, Y. ZnCl2 modified biochar derived from aerobic granular sludge for developed microporosity and enhanced adsorption to tetracycline. Bioresour. Technol. 2020, 297, 122381. [Google Scholar] [CrossRef] [PubMed]
- Liu, Y.; Ghimire, P.; Jaroniec, M. Copper benzene-1,3,5-tricarboxylate (Cu-BTC) metal-organic framework (MOF) and porous carbon composites as efficient carbon dioxide adsorbents. J. Colloid Interface Sci. 2019, 535, 122–132. [Google Scholar] [CrossRef] [PubMed]
- Lucena, F.R.S.; de Araújo, L.C.C.; Rodrigues, M.d.D.; da Silva, T.G.; Pereira, V.R.A.; Militão, G.C.G.; Fontes, D.A.F.; Rolim-Neto, P.J.; da Silva, F.F.; Nascimento, S.C. Induction of cancer cell death by apoptosis and slow release of 5-fluoracil from metal-organic frameworks Cu-BTC. Biomed. Pharmacother. 2013, 67, 707–713. [Google Scholar] [CrossRef] [PubMed] [Green Version]
- Li, Y.; Miao, J.; Sun, X.; Xiao, J.; Li, Y.; Wang, H.; Xia, Q.; Li, Z. Mechanochemical synthesis of Cu-BTC@GO with enhanced water stability and toluene adsorption capacity. Chem. Eng. J. 2016, 298, 191–197. [Google Scholar] [CrossRef]
- Sun, X.; Li, H.; Li, Y.; Xu, F.; Xiao, J.; Xia, Q.; Li, Y.; Li, Z. A novel mechanochemical method for reconstructing the moisture-degraded HKUST-1. Chem. Commun. 2015, 51, 10835–10838. [Google Scholar] [CrossRef] [PubMed]
- Domán, A.; Klébert, S.; Madarász, J.; Sáfrán, G.; Wang, Y.; László, K. Graphene Oxide Protected Copper Benzene-1,3,5-Tricarboxylate for Clean Energy Gas Adsorption. Nanomaterials 2020, 10, 1182. [Google Scholar] [CrossRef] [PubMed]
- Cui, L.; Xiong, Z.; Guo, Y.; Liu, Y.; Zhao, J.; Zhang, C.; Zhu, P. Fabrication of interpenetrating polymer network chitosan/gelatin porous materials and study on dye adsorption properties. Carbohydr. Polym. 2015, 132, 330–337. [Google Scholar] [CrossRef]
- Li, S.; Gong, Y.; Yang, Y.; He, C.; Hu, L.; Zhu, L.; Sun, L.; Shu, D. Recyclable CNTs/Fe3O4 magnetic nanocomposites as adsorbents to remove bisphenol A from water and their regeneration. Chem. Eng. J. 2015, 260, 231–239. [Google Scholar] [CrossRef]
- Alinejad-Mir, A.; Amooey, A.A.; Ghasemi, S. Adsorption of direct yellow 12 from aqueous solutions by an iron oxide-gelatin nanoadsorbent; kinetic, isotherm and mechanism analysis. J. Clean. Prod. 2018, 170, 570–580. [Google Scholar] [CrossRef]
- Jiang, J.; Zhang, Q.; Zhan, X.; Chen, F. A multifunctional gelatin-based aerogel with superior pollutants adsorption, oil/water separation and photocatalytic properties. Chem. Eng. J. 2019, 358, 1539–1551. [Google Scholar] [CrossRef]
- Arora, C.; Soni, S.; Sahu, S.; Mittal, J.; Kumar, P.; Bajpai, P.K. Iron based metal organic framework for efficient removal of methylene blue dye from industrial waste. J. Mol. Liq. 2019, 284, 343–352. [Google Scholar] [CrossRef]
- Tang, K.; Li, Y.; Zhang, X.; Li, M.; Du, Q.; Li, H.; Wang, Y.; Wang, D.; Wang, C.; Sui, K.; et al. Synthesis of citric acid modified β-cyclodextrin/activated carbon hybrid composite and their adsorption properties toward methylene blue. J. Appl. Polym. Sci. 2019, 137, 48315. [Google Scholar] [CrossRef]
- Dai, H.; Huang, Y.; Huang, H. Eco-friendly polyvinyl alcohol/carboxymethyl cellulose hydrogels reinforced with graphene oxide and bentonite for enhanced adsorption of methylene blue. Carbohydr. Polym. 2018, 185, 1–11. [Google Scholar] [CrossRef] [PubMed]
- Liu, L.; Gao, Z.Y.; Su, X.P.; Chen, X.; Jiang, L.; Yao, J.M. Adsorption Removal of Dyes from Single and Binary Solutions Using a Cellulose-based Bioadsorbent. ACS Sustain. Chem. Eng. 2015, 3, 432–442. [Google Scholar] [CrossRef]
- Seera, S.D.K.; Kundu, D.; Gami, P.; Naik, P.K.; Banerjee, T. Synthesis and characterization of xylan-gelatin cross-linked reusable hydrogel for the adsorption of methylene blue. Carbohydr. Polym. 2021, 256, 117520. [Google Scholar] [CrossRef]
- Lu, B.; Lin, Q.; Yin, Z.; Lin, F.; Chen, X.; Huang, B. Robust and lightweight biofoam based on cellulose nanofibrils for high-efficient methylene blue adsorption. Cellulose 2021, 28, 273–288. [Google Scholar] [CrossRef]
- Zhang, X.; Lin, X.; He, Y.; Luo, X. Phenolic hydroxyl derived copper alginate microspheres as superior adsorbent for effective adsorption of tetracycline. Int. J. Biol. Macromol. 2019, 136, 445–459. [Google Scholar] [CrossRef]
- Shenvi, S.S.; Isloor, A.M.; Ismail, A.F.; Shilton, S.J.; Al Ahmed, A. Humic Acid Based Biopolymeric Membrane for Effective Removal of Methylene Blue and Rhodamine, B. Ind. Eng. Chem. Res. 2015, 54, 4965–4975. [Google Scholar] [CrossRef] [Green Version]
- Li, W.; Zuo, P.; Xu, D.; Xu, Y.; Wang, K.; Bai, Y.; Ma, H. Tunable adsorption properties of bentonite/carboxymethyl cellulose-g-poly(2-(dimethylamino) ethyl methacrylate) composites toward anionic dyes. Chem. Eng. Res. Des. 2017, 124, 260–270. [Google Scholar] [CrossRef]
- Zhang, P.; Ouyang, S.; Li, P.; Huang, Y.; Frost, R.L. Enhanced removal of ionic dyes by hierarchical organic three-dimensional layered double hydroxide prepared via soft-template synthesis with mechanism study. Chem. Eng. J. 2019, 360, 1137–1149. [Google Scholar] [CrossRef]
- Makhado, E.; Pandey, S.; Ramontja, J. Microwave assisted synthesis of xanthan gum-cl-poly (acrylic acid) based-reduced graphene oxide hydrogel composite for adsorption of methylene blue and methyl violet from aqueous solution. Int. J. Biol. Macromol. 2018, 119, 255–269. [Google Scholar] [CrossRef] [PubMed]
- Boukhalfa, N.; Boutahala, M.; Djebri, N.; Idris, A. Kinetics, thermodynamics, equilibrium isotherms, and reusability studies of cationic dye adsorption by magnetic alginate/oxidized multiwalled carbon nanotubes composites. Int. J. Biol. Macromol. 2019, 123, 539–548. [Google Scholar] [CrossRef] [PubMed]
- Wang, Y.; Pan, J.; Li, Y.; Zhang, P.; Li, M.; Zheng, H.; Zhang, X.; Li, H.; Du, Q. Methylene blue adsorption by activated carbon, nickel alginate/activated carbon aerogel, and nickel alginate/graphene oxide aerogel: A comparison study. J. Mater. Res. Technol. 2020, 9, 12443–12460. [Google Scholar] [CrossRef]
- Kaur, R.; Kaur, A.; Umar, A.; Anderson, W.A.; Kansal, S.K. Metal organic framework (MOF) porous octahedral nanocrystals of Cu-BTC: Synthesis, properties and enhanced adsorption properties. Mater. Res. Bull. 2019, 109, 124–133. [Google Scholar] [CrossRef]
- Zhang, X.; Lin, X.; He, Y.; Chen, Y.; Luo, X.; Shang, R. Study on adsorption of tetracycline by Cu-immobilized alginate adsorbent from water environment. Int. J. Biol. Macromol. 2019, 124, 418–428. [Google Scholar] [CrossRef] [PubMed]
- Jeong, M.; Jang, H.; Cha, H.-J.; Park, B.; Kim, J.; Yoo, J.-K.; Park, T.; Yi, J.W.; Seong, D.G.; Oh, Y. The shape tunable gelatin/carbon nanotube wet-gels for complex three-dimensional cellular structures with high elasticity. Carbon 2021, 184, 811–820. [Google Scholar] [CrossRef]
- Yu, B.; Bai, Y.; Ming, Z.; Yang, H.; Chen, L.; Hu, X.; Feng, S.; Yang, S.-T. Adsorption behaviors of tetracycline on magnetic graphene oxide sponge. Mater. Chem. Phys. 2017, 198, 283–290. [Google Scholar] [CrossRef]


| Models | Parameters | |||||||
|---|---|---|---|---|---|---|---|---|
| Pseudo-first-order model | k1 (min−1) | qe (mg·g−1) | R2 | AIC | AICC | wi | BIC | HIC |
| 1.58 × 10⁻² | 88.3 | 0.79 | 96.7 | 97.5 | 1.79 × 10⁻¹² | 98.5 | 97.0 | |
| Pseudo-second-order model | k2 (min−1) | qe (mg·g−1) | R2 | AIC | AICC | wi | BIC | HIC |
| 2.35 × 10⁻⁴ | 96.1 | 0.89 | 83.7 | 84.5 | 1.20 × 10⁻⁹ | 85.5 | 84.0 | |
| Elovich kinetic model | α (mg·g−1·min−1) | β (g·mg−1) | R2 | AIC | AICC | wi | BIC | HIC |
| 11.7 | 0.07 | 0.99 | 42.6 | 43.4 | 0.99 | 44.4 | 42.9 | |
| Models | Parameters | ||||||||
|---|---|---|---|---|---|---|---|---|---|
| Langmuir | qm (mg·g−1) | KL (L·mg−1) | R2 | AIC | AICc | wi | BIC | HIC | |
| 320 | 0.01 | 0.94 | 21.8 | 27.8 | 1.41 × 10⁻³ | 21.0 | 19.7 | ||
| Freundlich | Kf (mg1−1/n·L1/n·g−1) | n | R2 | AIC | AICc | wi | BIC | HIC | |
| 5.97 | 1.36 | 0.93 | 23.3 | 29.3 | 6.50 × 10⁻⁴ | 22.6 | 21.3 | ||
| Sips | qm (mg·g−1) | KS [(L·mg−1)1/b] | b | R2 | AIC | AICc | wi | BIC | HIC |
| 129 | 0.04 | 2.55 | 0.99 | 11.6 | 35.6 | 2.82 × 10⁻⁵ | 10.5 | 8.47 | |
| Temkin | BT (J·mol−1) | AT (L·mg−1) | R2 | AIC | AICc | wi | BIC | HIC | |
| 65.0 | 0.11 | 0.98 | 17.1 | 23.1 | 1.50 × 10⁻² | 16.3 | 15.0 | ||
| D-R | qm (mg·g−1) | AD | E (kJ·mol−1) | R2 | AIC | AICc | wi | BIC | HIC |
| 131 | 442 | 83.3 | 0.99 | 8.70 | 14.7 | 0.98 | 7.92 | 6.60 | |
| ΔH0 (kJ·mol−1) | ΔS0 (J·mol−1·K−1) | ΔG0 (kJ·mol−1) | ||
|---|---|---|---|---|
| 298 K | 308 K | 318 K | ||
| 5.08 | 23.9 | −2.03 | −2.27 | −2.51 |
Publisher’s Note: MDPI stays neutral with regard to jurisdictional claims in published maps and institutional affiliations. |
© 2022 by the authors. Licensee MDPI, Basel, Switzerland. This article is an open access article distributed under the terms and conditions of the Creative Commons Attribution (CC BY) license (https://creativecommons.org/licenses/by/4.0/).
Share and Cite
Zhang, Y.; Li, Y.; Wang, M.; Chen, B.; Sun, Y.; Chen, K.; Du, Q.; Pi, X.; Wang, Y. Adsorption of Methylene Blue from Aqueous Solution Using Gelatin-Based Carboxylic Acid-Functionalized Carbon Nanotubes@Metal–Organic Framework Composite Beads. Nanomaterials 2022, 12, 2533. https://doi.org/10.3390/nano12152533
Zhang Y, Li Y, Wang M, Chen B, Sun Y, Chen K, Du Q, Pi X, Wang Y. Adsorption of Methylene Blue from Aqueous Solution Using Gelatin-Based Carboxylic Acid-Functionalized Carbon Nanotubes@Metal–Organic Framework Composite Beads. Nanomaterials. 2022; 12(15):2533. https://doi.org/10.3390/nano12152533
Chicago/Turabian StyleZhang, Yang, Yanhui Li, Mingzhen Wang, Bing Chen, Yaohui Sun, Kewei Chen, Qiujv Du, Xinxin Pi, and Yuqi Wang. 2022. "Adsorption of Methylene Blue from Aqueous Solution Using Gelatin-Based Carboxylic Acid-Functionalized Carbon Nanotubes@Metal–Organic Framework Composite Beads" Nanomaterials 12, no. 15: 2533. https://doi.org/10.3390/nano12152533
APA StyleZhang, Y., Li, Y., Wang, M., Chen, B., Sun, Y., Chen, K., Du, Q., Pi, X., & Wang, Y. (2022). Adsorption of Methylene Blue from Aqueous Solution Using Gelatin-Based Carboxylic Acid-Functionalized Carbon Nanotubes@Metal–Organic Framework Composite Beads. Nanomaterials, 12(15), 2533. https://doi.org/10.3390/nano12152533