
Synthesis of Nanoceria with Varied Ratios of Ce3+/Ce4+ Utilizing Soluble Borate Glass

 ,
,
Abstract
:1. Introduction
2. Materials and Methods
2.1. Synthesis of the Glass Embedded Nanoceria
2.2. Extraction of Nanoceria
2.3. Characterization of the Glass and the Nanoceria
3. Results and Discussion
3.1. Ce3+/Ce4+ Ratio of the Nanoceria Embedded within the Glass
3.2. Ce3+/Ce4+ Ratio of the Extracted Nanoceria
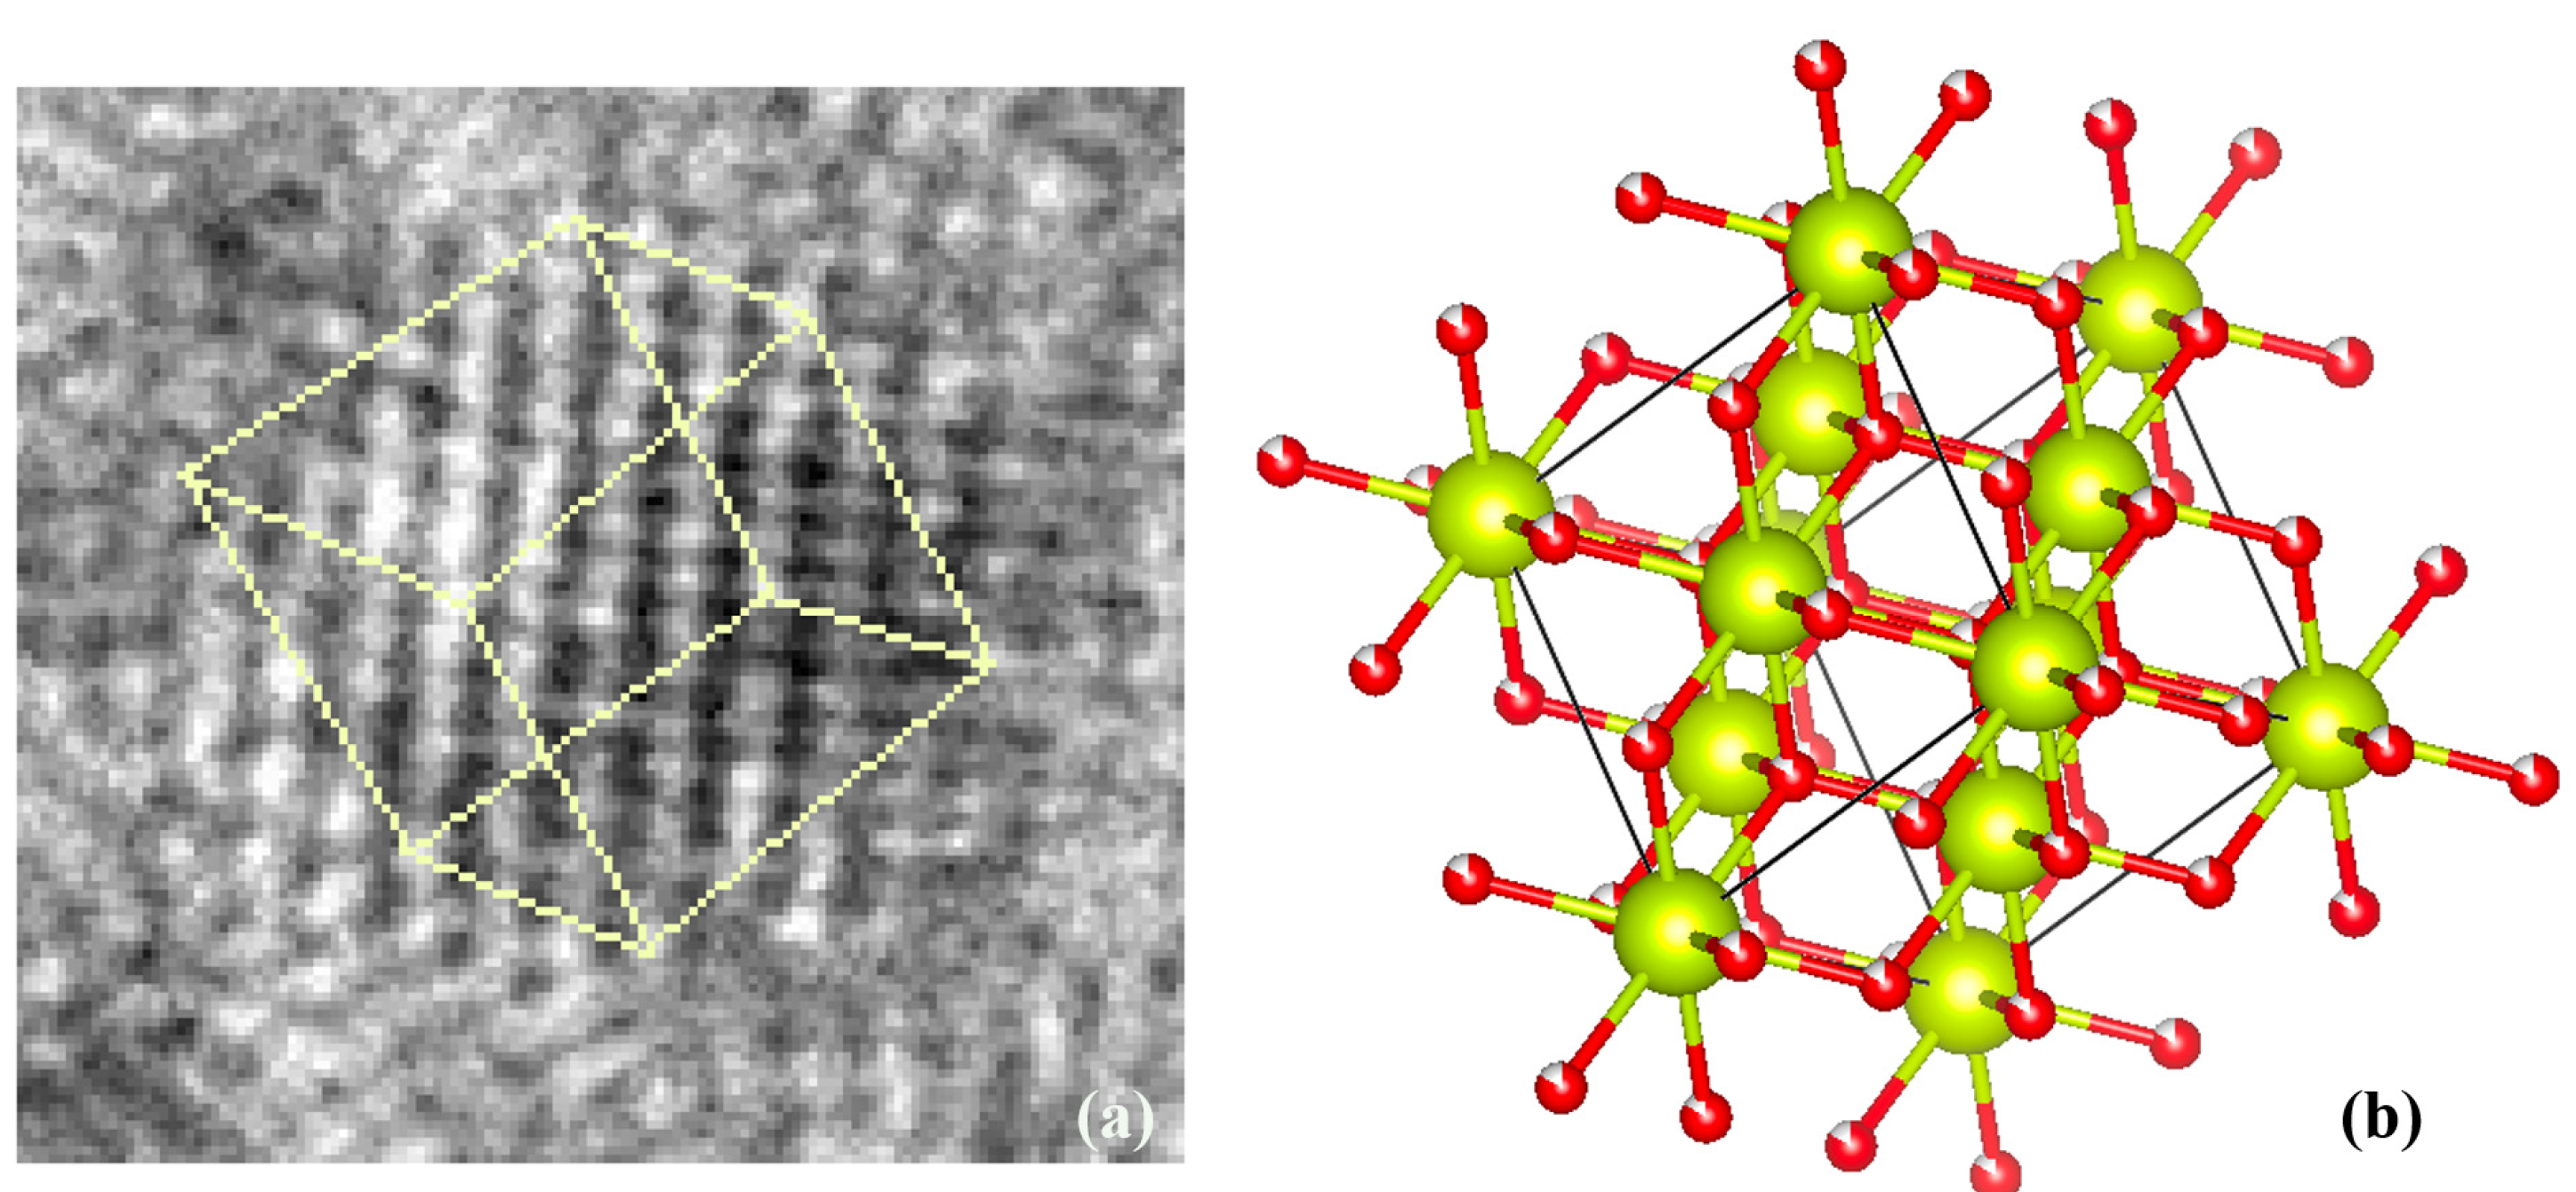
3.3. TEM Analysis of Extracted Nanoceria
4. Conclusions
5. Patents
Supplementary Materials
Author Contributions
Funding
Institutional Review Board Statement
Informed Consent Statement
Data Availability Statement
Acknowledgments
Conflicts of Interest
References
- Cicconi, M.R.; Neuville, D.R.; Blanc, W.; Lupi, J.-F.; Vermillac, M.; de Ligny, D. Cerium/aluminum correlation in aluminosilicate glasses and optical silica fiber preforms. J. Non-Cryst. Solids 2017, 475, 85–95. [Google Scholar] [CrossRef] [Green Version]
- Dey, S.; Dhal, G.C. Cerium catalysts applications in carbon monoxide oxidations. Mater. Sci. Energy Technol. 2020, 3, 6–24. [Google Scholar] [CrossRef]
- Pandiyan, A.; Uthayakumar, A.; Subrayan, R.; Cha, S.W.; Moorthy, S.B.K. Review of solid oxide electrolysis cells: A clean energy strategy for hydrogen generation. Nanomater. Energy 2019, 8, 2–22. [Google Scholar] [CrossRef]
- Kwon, K.; Lee, K.H.; Jin, S.; You, D.J.; Pak, C. Ceria-promoted oxygen reduction reaction in Pd-based electrocatalysts. Electrochem. Commun. 2011, 13, 1067–1069. [Google Scholar] [CrossRef]
- Jing, Y.; Zhou, X.; Lund, P.; Chen, C.; Fan, L. Electrochemical impact of the carbonate in ceria-carbonate composite for low temperature solid oxide fuel cell. Int. J. Hydrogen Energy 2021, 46, 9898–9904. [Google Scholar] [CrossRef]
- Agnihotri, R.; Oommen, C. Impact of HAN Ternary Propellant System Decomposition on Catalytic Sustainability. Propellants Explos. Pyrotech. 2021, 46, 440–449. [Google Scholar] [CrossRef]
- Jia, M.; Wen, J.; Luo, W.; Dong, Y.; Pang, F.; Chen, Z.; Peng, G.; Wang, T. Improved scintillating properties in Ce:YAG derived silica fiber with the reduction from Ce4 + to Ce3+ ions. J. Lumin. 2020, 221, 117063. [Google Scholar] [CrossRef]
- Rittisut, W.; Wantana, N.; Butburee, A.; Ruangtaweep, Y.; Padchasri, J.; Rujirawat, S.; Manyum, P.; Kidkhunthod, P.; Yimnirun, R.; Kothan, S.; et al. Luminescence properties of Ce3+- doped borate scintillating glass for new radiation detection material. Radiat. Phys. Chem. 2021, 185, 109498. [Google Scholar] [CrossRef]
- Sun, X.; Liu, X.; Xiao, Z.; Jiang, D.; Wang, W.; Wen, Y.; Yang, Q.; Kang, Z. Enhancement of emission intensity in Ce3+-activated aluminoborosilicate scintillating glass synthesized in air. J. Am. Ceram. Soc. 2020, 103, 768–772. [Google Scholar] [CrossRef]
- Zhang, L.; Dai, J.; Li, Y.; Sun, S.; Li, H.; Wang, J.; Jing, F.; Gao, C. Photodarkening Properties of Typical Ytterbium Doped Silica Fiber. In Proceedings of the 14th Pacific Rim Conference on Lasers and Electro-Optics (CLEO PR 2020), Sydney, Australia, 3–5 August 2020; p. P2_33. [Google Scholar] [CrossRef]
- Gökçe, M.; Burgaz, G.; Gökçe, A.G. Cerium doped glasses containing reducing agent for enhanced luminescence. J. Lumin. 2020, 222, 117175. [Google Scholar] [CrossRef]
- Środa, M.; Świontek, S.; Gieszczyk, W.; Bilski, P. The effect of CeO2 on the thermal stability, structure and thermoluminescence and optically stimulated luminescence properties of barium borate glass. J. Non-Cryst. Solids 2019, 517, 61–69. [Google Scholar] [CrossRef]
- Xu, C.; Qu, X. Cerium oxide nanoparticle: A remarkably versatile rare earth nanomaterial for biological applications. NPG Asia Mater. 2014, 6, e90. [Google Scholar] [CrossRef]
- Lu, B.; Zhu, D.; Yin, J.; Xu, H.; Zhang, C.; Ke, Q.; Gao, Y.; Guo, Y. Incorporation of cerium oxide in hollow mesoporous bioglass scaffolds for enhanced bone regeneration by activating the ERK signaling pathway. Biofabrication 2019, 11, 025012. [Google Scholar] [CrossRef]
- Saatchi, A.; Arani, A.R.; Moghanian, A.; Mozafari, M. Synthesis and characterization of electrospun cerium-doped bioactive glass/chitosan/polyethylene oxide composite scaffolds for tissue engineering applications. Ceram. Int. 2021, 47, 260–271. [Google Scholar] [CrossRef]
- Westhauser, F.; Rehde, F.; Decker, S.; Kunisch, E.; Moghaddam, A.; Zheng, K.; Boccaccini, A.R. Ionic dissolution products of Cerium-doped bioactive glass nanoparticles promote cellular osteogenic differentiation and extracellular matrix formation of human bone marrow derived mesenchymal stromal cells. Biomed. Mater. 2021, 16, 035028. [Google Scholar] [CrossRef] [PubMed]
- Sontakke, A.D.; Ueda, J.; Xu, J.; Asami, K.; Katayama, M.; Inada, Y.; Tanabe, S. A Comparison on Ce3+ Luminescence in Borate Glass and YAG Ceramic: Understanding the Role of Host’s Characteristics. J. Phys. Chem. C 2016, 120, 17683–17691. [Google Scholar] [CrossRef]
- Nicolini, V.; Gambuzzi, E.; Malavasi, G.; Menabue, L.; Menziani, M.C.; Lusvardi, G.; Pedone, A.; Benedetti, F.; Luches, P.; D’Addato, S.; et al. Evidence of Catalase Mimetic Activity in Ce3+/Ce4+ Doped Bioactive Glasses. J. Phys. Chem. B 2015, 119, 4009–4019. [Google Scholar] [CrossRef]
- Kargozar, S.; Baino, F.; Hoseini, S.J.; Hamzehlou, S.; Darroudi, M.; Verdi, J.; Hasanzadeh, L.; Kim, H.-W.; Mozafari, M. Biomedical applications of nanoceria: New roles for an old player. Nanomedicine 2018, 13, 3051–3069. [Google Scholar] [CrossRef]
- Ranasinghe, K.S.; Singh, R.; Day, D.E.; Attenkofer, K.; Stavitski, E.; Quinn, L.A.; Patterson, D.; Duenas, A. Evidence of the coexistence of multivalence cerium oxide nano-particles in a sodium borate glass. J. Non-Cryst. Solids 2019, 515, 75–81. [Google Scholar] [CrossRef]
- Camp, C.H. pyMCR: A Python Library for MultivariateCurve Resolution Analysis with Alternating Regression (MCR-AR). J. Res. Natl. Inst. Stand. Technol. 2019, 124, 1–10. [Google Scholar] [CrossRef]
- Darab, J.G.; Li, H.; Vienna, J.D. X-ray absorption spectroscopic investigation of the environment of cerium in glasses based on complex cerium alkali borosilicate compositions. J. Non-Cryst. Solids 1998, 226, 162–174. [Google Scholar] [CrossRef]
- Schelter, E.J. Cerium under the lens. Nat. Chem. 2013, 5, 348. [Google Scholar] [CrossRef]
- Kümmerle, E.A.; Heger, G. The Structures of C–Ce2O3+δ, Ce7O12, and Ce11O20. J. Solid State Chem. 1999, 147, 485–500. [Google Scholar] [CrossRef]
- Zachariasen, W. Die Kristallstruktur der A-Modifikation von den Sesquioxyden der seltenen Erdmetalle. (La2O3 Ce2O3, Pr2O3, Nd2O3). Z. Für Phys. Chem. 1926, 123U, 134–150. [Google Scholar] [CrossRef]
- Artini, C.; Pani, M.; Carnasciali, M.M.; Buscaglia, M.T.; Plaisier, J.R.; Costa, G.A. Structural Features of Sm- and Gd-Doped Ceria Studied by Synchrotron X-ray Diffraction and μ-Raman Spectroscopy. Inorg. Chem. 2015, 54, 4126–4137. [Google Scholar] [CrossRef] [PubMed]
- Artini, C.; Costa, G.A.; Pani, M.; Lausi, A.; Plaisier, J. Structural characterization of the CeO2/Gd2O3 mixed system by synchrotron X-ray diffraction. J. Solid State Chem. 2012, 190, 24–28. [Google Scholar] [CrossRef]
- Nikolenko, A.; Strelchuk, V.; Gnatyuk, O.; Kraszkiewicz, P.; Boiko, V.; Kovalska, E.; Mista, W.; Klimkiewicz, R.; Karbivskii, V.; Dovbeshko, G. In situ Raman study of laser-induced stabilization of reduced nanoceria (CeO2−x) supported on graphene. J. Raman Spectrosc. 2019, 50, 490–498. [Google Scholar] [CrossRef]
- Patil, S.; Dasari, H.P. Effect of fuel and solvent on soot oxidation activity of ceria nanoparticles synthesized by solution combustion method. Mater. Sci. Energy Technol. 2019, 2, 485–489. [Google Scholar] [CrossRef]
- Trenque, I.; Magnano, G.C.; Bolzinger, M.A.; Roiban, L.; Chaput, F.; Pitault, I.; Briançon, S.; Devers, T.; Masenelli-Varlot, K.; Bugnet, M.; et al. Shape-selective synthesis of nanoceria for degradation of paraoxon as a chemical warfare simulant. Phys. Chem. Chem. Phys. 2019, 21, 5455–5465. [Google Scholar] [CrossRef]
- Olbrich, R.; Murgida, G.E.; Ferrari, V.; Barth, C.; Llois, A.M.; Reichling, M.; Ganduglia-Pirovano, M.V. Surface Stabilizes Ceria in Unexpected Stoichiometry. J. Phys. Chem. C 2017, 121, 6844–6851. [Google Scholar] [CrossRef] [Green Version]
- Bekheet, M.F.; Grünbacher, M.; Schlicker, L.; Gili, A.; Doran, A.; Epping, J.D.; Gurlo, A.; Klötzer, B.; Penner, S. On the structural stability of crystalline ceria phases in undoped and acceptor-doped ceria materials under in situ reduction conditions. CrystEngComm 2019, 21, 145–154. [Google Scholar] [CrossRef] [Green Version]
- Murgida, G.E.; Ferrari, V.; Llois, A.M.; Ganduglia-Pirovano, M.V. Reduced CeO2 (111) ordered phases as bulk terminations: Introducing the structure of Ce3O5. Phys. Rev. Mater. 2018, 2, 083609. [Google Scholar] [CrossRef] [Green Version]
- Xu, Y.; Mofarah, S.S.; Mehmood, R.; Cazorla, C.; Koshy, P.; Sorrell, C.C. Design strategies for ceria nanomaterials: Untangling key mechanistic concepts. Mater. Horiz. 2021, 8, 102–123. [Google Scholar] [CrossRef] [PubMed]
- Zhang, F.; Chan, S.-W.; Spanier, J.E.; Apak, E.; Jin, Q.; Robinson, R.D.; Herman, I.P. Cerium oxide nanoparticles: Size-selective formation and structure analysis. Appl. Phys. Lett. 2002, 80, 127–129. [Google Scholar] [CrossRef] [Green Version]
- Kurian, M.; Kunjachan, C. Investigation of size dependency on lattice strain of nanoceria particles synthesised by wet chemical methods. Int. Nano Lett. 2014, 4, 73–80. [Google Scholar] [CrossRef] [Green Version]
- Chen, L.; Fleming, P.; Morris, V.; Holmes, J.D.; Morris, M.A. Size-Related Lattice Parameter Changes and Surface Defects in Ceria Nanocrystals. J. Phys. Chem. C 2010, 114, 12909–12919. [Google Scholar] [CrossRef]
- Prieur, D.; Bonani, W.; Popa, K.; Walter, O.; Kriegsman, K.W.; Engelhard, M.H.; Guo, X.; Eloirdi, R.; Gouder, T.; Beck, A.; et al. Size Dependence of Lattice Parameter and Electronic Structure in CeO2 Nanoparticles. Inorg. Chem. 2020, 59, 5760–5767. [Google Scholar] [CrossRef] [PubMed]
- Hailstone, R.K.; DiFrancesco, A.G.; Leong, J.G.; Allston, T.D.; Reed, K.J. A Study of Lattice Expansion in CeO2 Nanoparticles by Transmission Electron Microscopy. J. Phys. Chem. C 2009, 113, 15155–15159. [Google Scholar] [CrossRef]
- Baranchikov, A.E.; Polezhaeva, O.S.; Ivanov, V.K.; Tretyakov, Y.D. Lattice expansion and oxygen non-stoichiometry of nanocrystalline ceria. CrystEngComm 2010, 12, 3531–3533. [Google Scholar] [CrossRef]
- Da Silva, J.L.F. Stability of the Ce2O3 phases: ADFT + Uinvestigation. Phys. Rev. B 2007, 76, 193108. [Google Scholar] [CrossRef]
- Tsunekawa, S.; Ishikawa, K.; Li, Z.-Q.; Kawazoe, Y.; Kasuya, A. Erratum: Origin of Anomalous Lattice Expansion in Oxide Nanoparticles [Phys. Rev. Lett. 85, 3440 (2000)]. Phys. Rev. Lett. 2002, 89, 249905. [Google Scholar] [CrossRef]
- Diehm, P.M.; Ágoston, P.; Albe, K. Size-Dependent Lattice Expansion in Nanoparticles: Reality or Anomaly? ChemPhysChem 2012, 13, 2443–2454. [Google Scholar] [CrossRef]
- Wu, L.; Wiesmann, H.J.; Moodenbaugh, A.R.; Klie, R.F.; Zhu, Y.; Welch, D.O.; Suenaga, M. Oxidation state and lattice expansion of CeO2−x nanoparticles as a function of particle size. Phys. Rev. B 2004, 69, 125415. [Google Scholar] [CrossRef]
- Sayle, T.X.T.; Parker, S.C.; Sayle, D.C. Shape of CeO2 nanoparticles using simulated amorphisation and recrystallisation. Chem. Commun. 2004, 2438–2439. [Google Scholar] [CrossRef] [PubMed]
- Wang, Z.L.; Feng, X. Polyhedral Shapes of CeO2 Nanoparticles. J. Phys. Chem. B 2003, 107, 13563–13566. [Google Scholar] [CrossRef] [Green Version]


| Sample | CeO2 Concentration | Melting Temperature | Melting Time |
|---|---|---|---|
| S1NBCe | 0.01 mol | 1100 °C | 1 h |
| S2NBCe | 0.02 mol | 1100 °C | 1 h |
| S3NBCe | 0.03 mol | 1100 °C | 1 h |
| S4NBCe | 0.04 mol | 1100 °C | 1 h |
| S5NBCe | 0.05 mol | 1100 °C | 1 h |
| S6NBCe | 0.06 mol | 1100 °C | 1 h |
| Sample | CeO2 mols | Ce3+/ΣCe (±0.09) 2 | Ce3+/Ce4+ |
|---|---|---|---|
| S1NBCe | 0.01 | 0.71 | 2.41 ± 0.80 |
| S2NBCe | 0.02 | 0.61 | 1.55 ± 0.42 |
| S3NBCe | 0.03 | 0.61 | 1.55 ± 0.42 |
| S4NBCe | 0.04 | 0.42 | 0.72 ± 0.19 |
| S5NBCe | 0.05 | 0.58 | 1.38 ± 0.37 |
| S6NBCe | 0.06 | 0.63 | 1.72 ± 0.49 |
| Melted Time (h) | Ce3+ /∑Ce (±0.09) (1100 °C) | Ce3+ /∑Ce (±0.09) (1200 °C) | Ce3+ /∑Ce (±0.09) (1300 °C) |
|---|---|---|---|
| 1 | 0.62 | 0.77 | 0.87 |
| 3 | 0.70 | 0.79 | 0.87 |
| 5 | 0.69 | 0.80 | 0.87 |
| 8 | 0.68 | 0.80 | 0.88 |
| 12 | 0.69 | 0.78 | - |
| 15 | 0.668 | 0.80 | 0.88 |
| 18 | 0.69 | - | - |
| Sample | Cerium Source | Concentration (mol) | Temperature | Time | Furnace Atmosphere | Ce3+ /∑Ce (±0.09) |
|---|---|---|---|---|---|---|
| S1NBCe | Ce(IV)O2 | 0.01 | 1000 °C | 1 h | air | 0.90 |
| S1NBCe | Ce(IV)O2 | 0.01 | 1100 °C | 1 h | air | 0.70 |
| S1NBCe | Ce(IV)O2 | 0.01 | 1200 °C | 1 h | air | 0.93 |
| S1NBCe | Ce(IV)O2 | 0.01 | 1100 °C | 2 h | air | 0.70 |
| S1NBCe | Ce(IV)O2 | 0.01 | 1100 °C | 3 h | air | 0.70 |
| S5NBCe | Ce(IV)O2 | 0.05 | 1100 °C | 1 h | Dry air | 0.64 |
| S5NBCe | Ce(IV)O2 | 0.05 | 1100 °C | 1 h | Ar | 0.68 |
| S5NBCe | Ce(IV)O2 | 0.05 | 1100 °C | 1 h | N2 | 0.84 |
| S5NBCe | Ce(NO3)3 | 0.05 | 1100 °C | 1 h | air | 0.77 |
| S5NBCe | Ce(SO4)2 | 0.05 | 1100 °C | 1 h | air | 0.56 |
| S5NBCe | Ce(IV)O2 | 0.05 | 1100 °C | 1 h | air | 0.57 |
| S5NBCe * | Ce(IV)O2 | 0.05 | 1100 °C | 1 h | air | 0.58 |
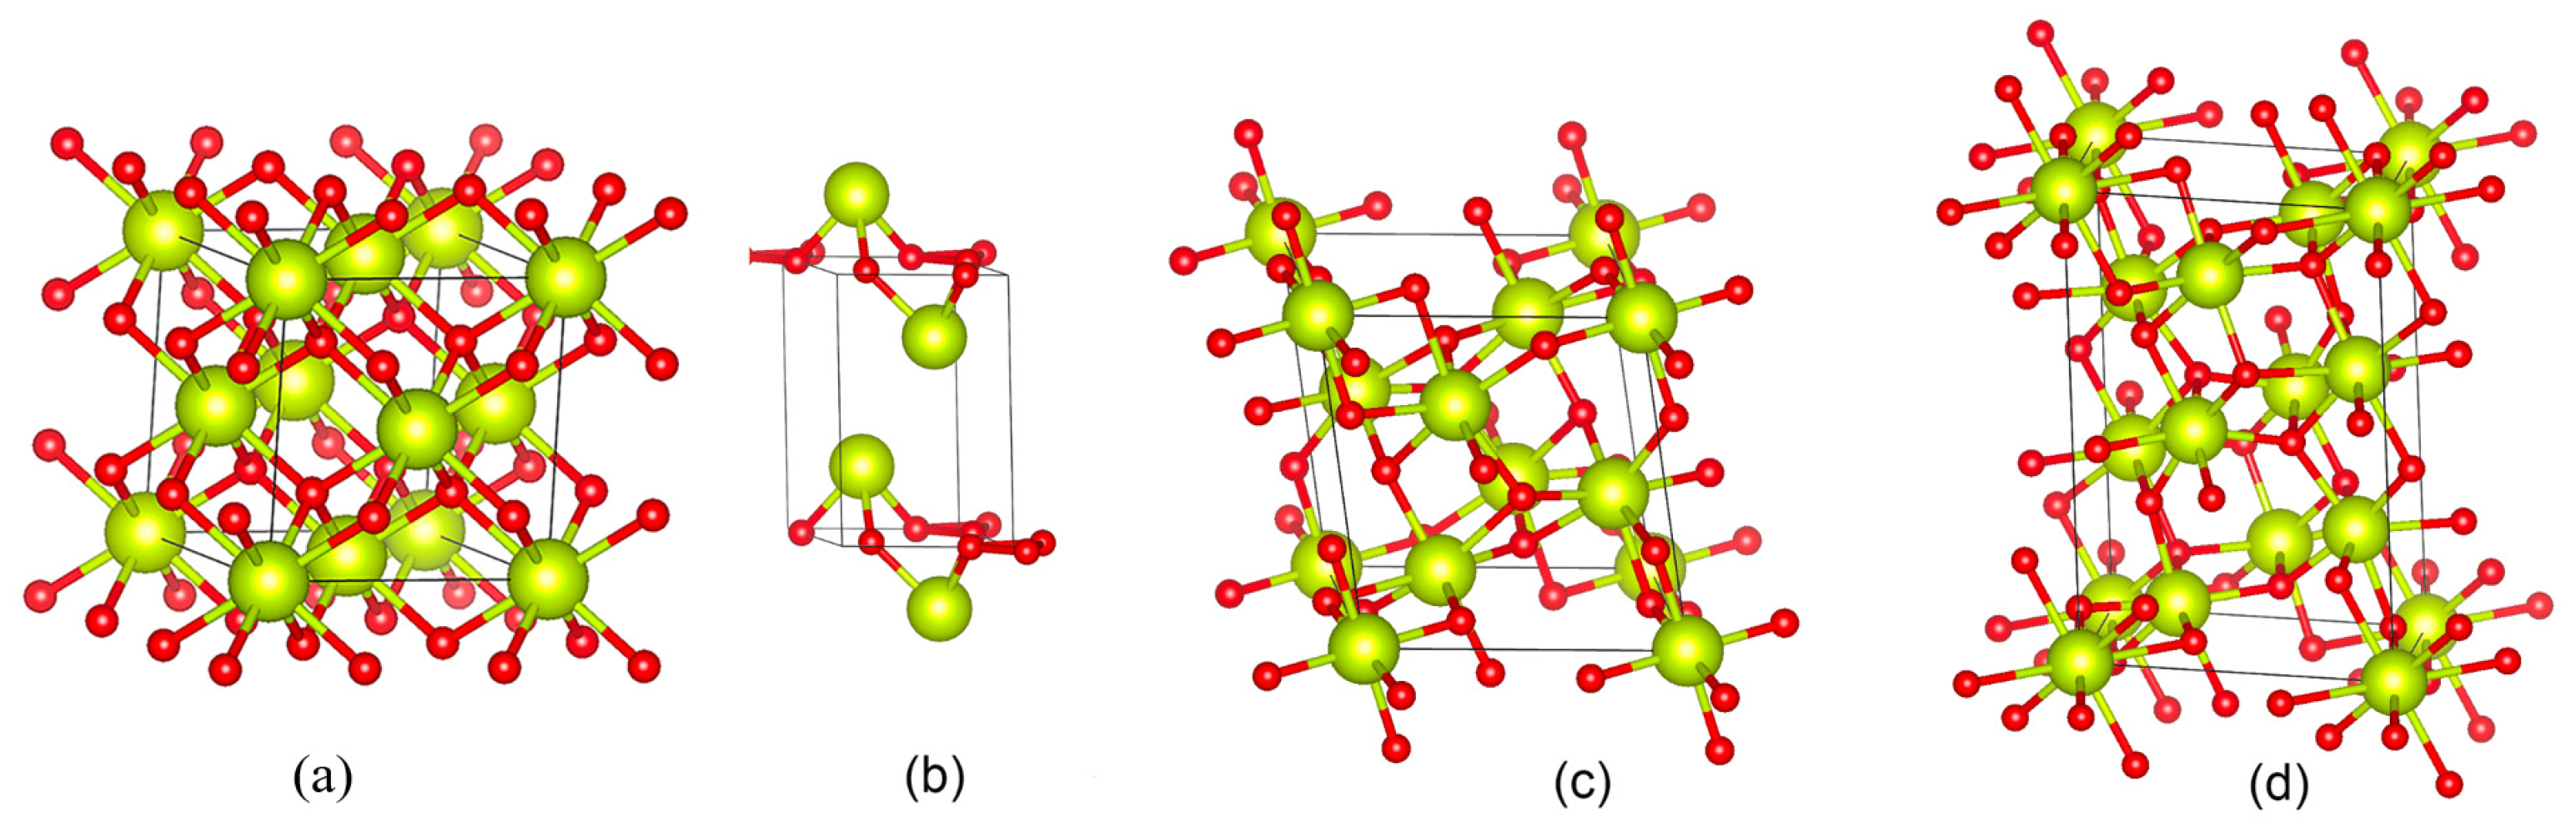
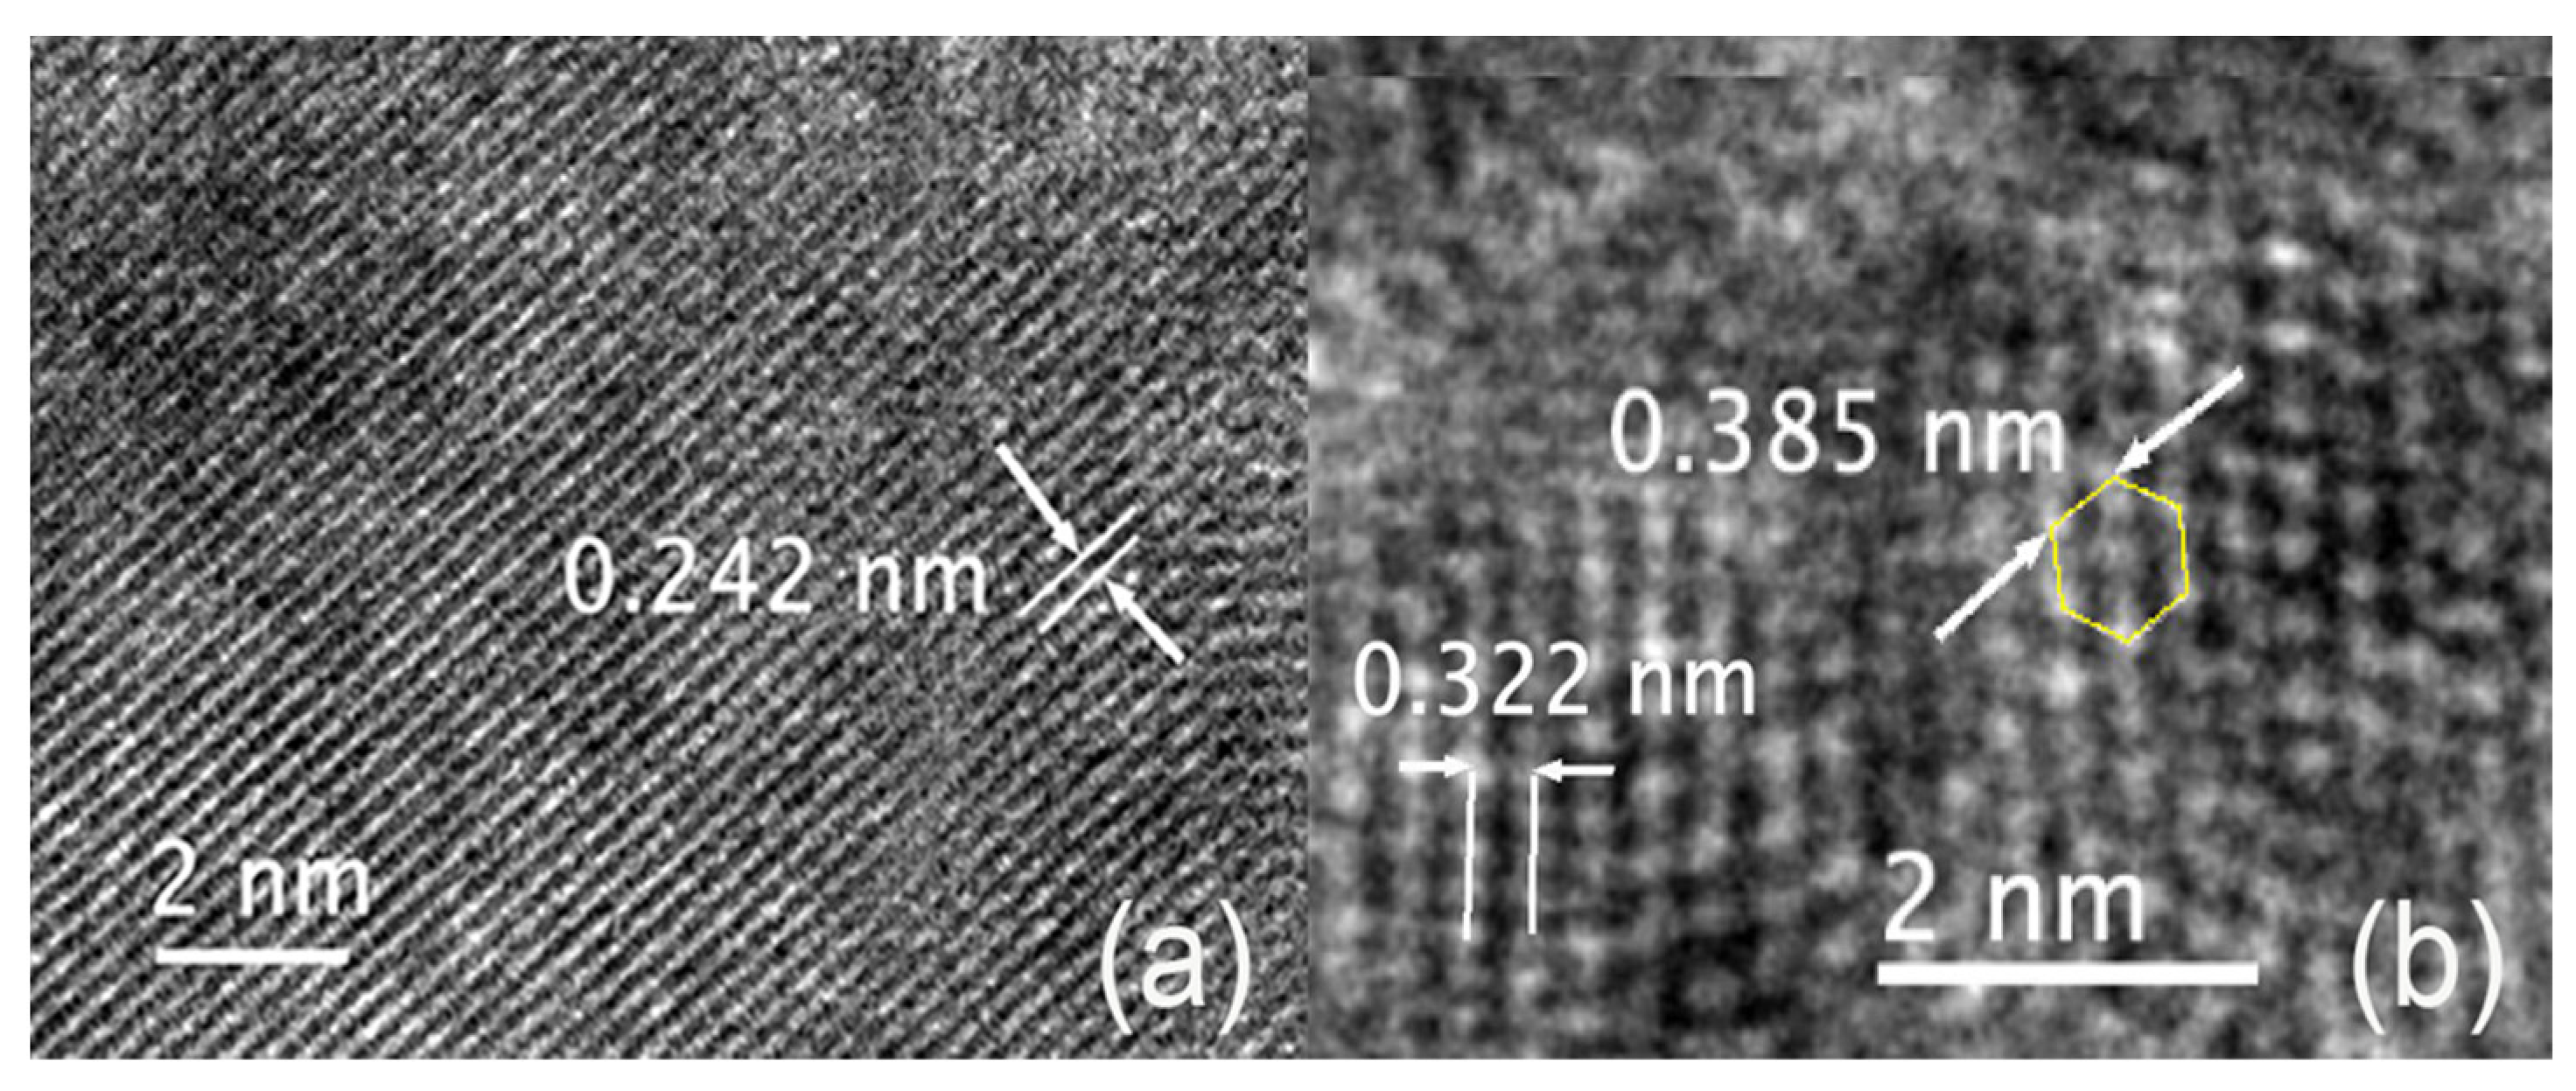
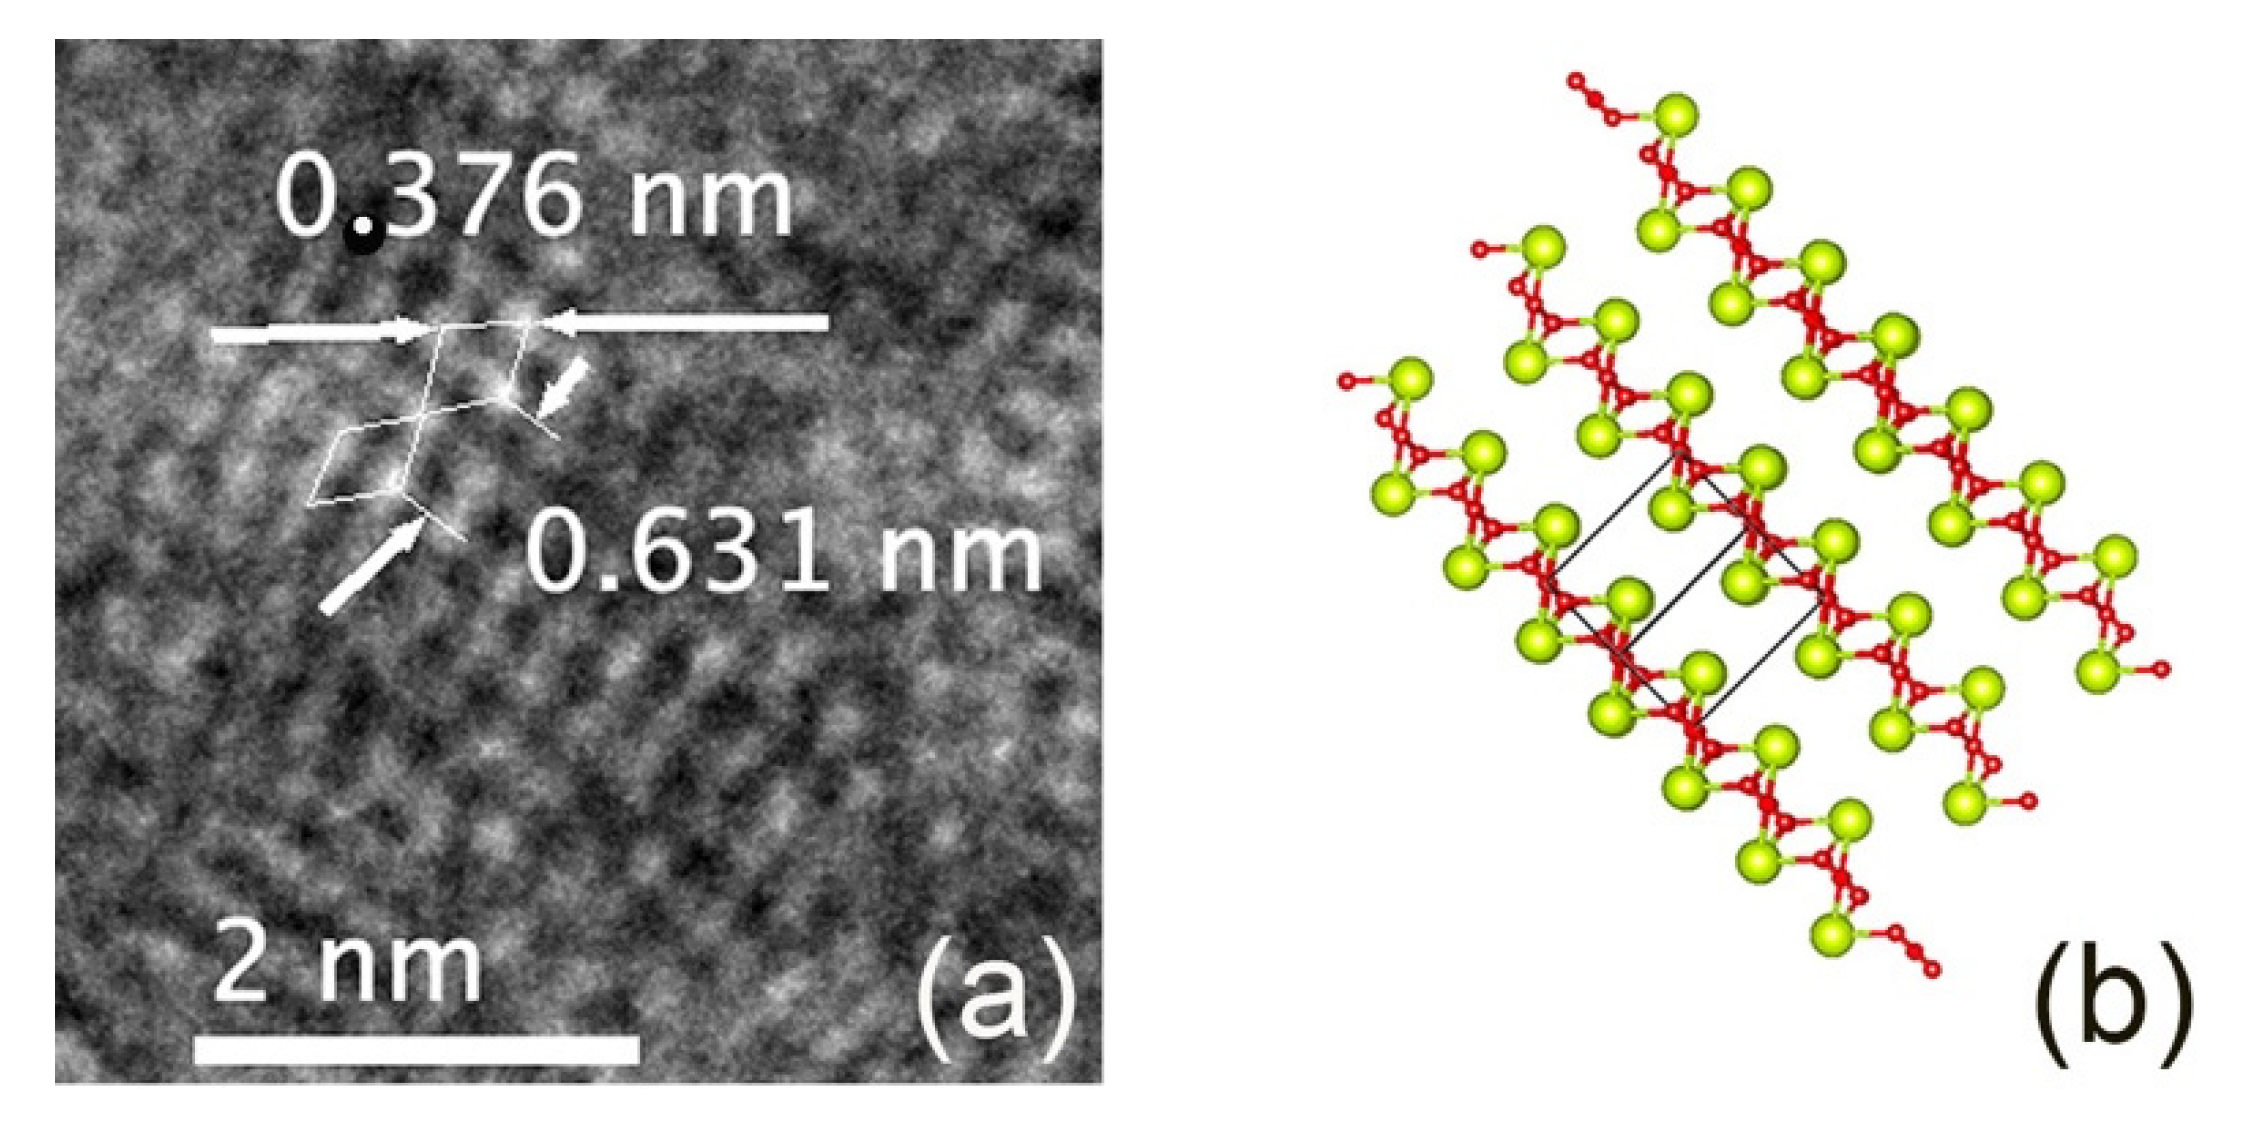
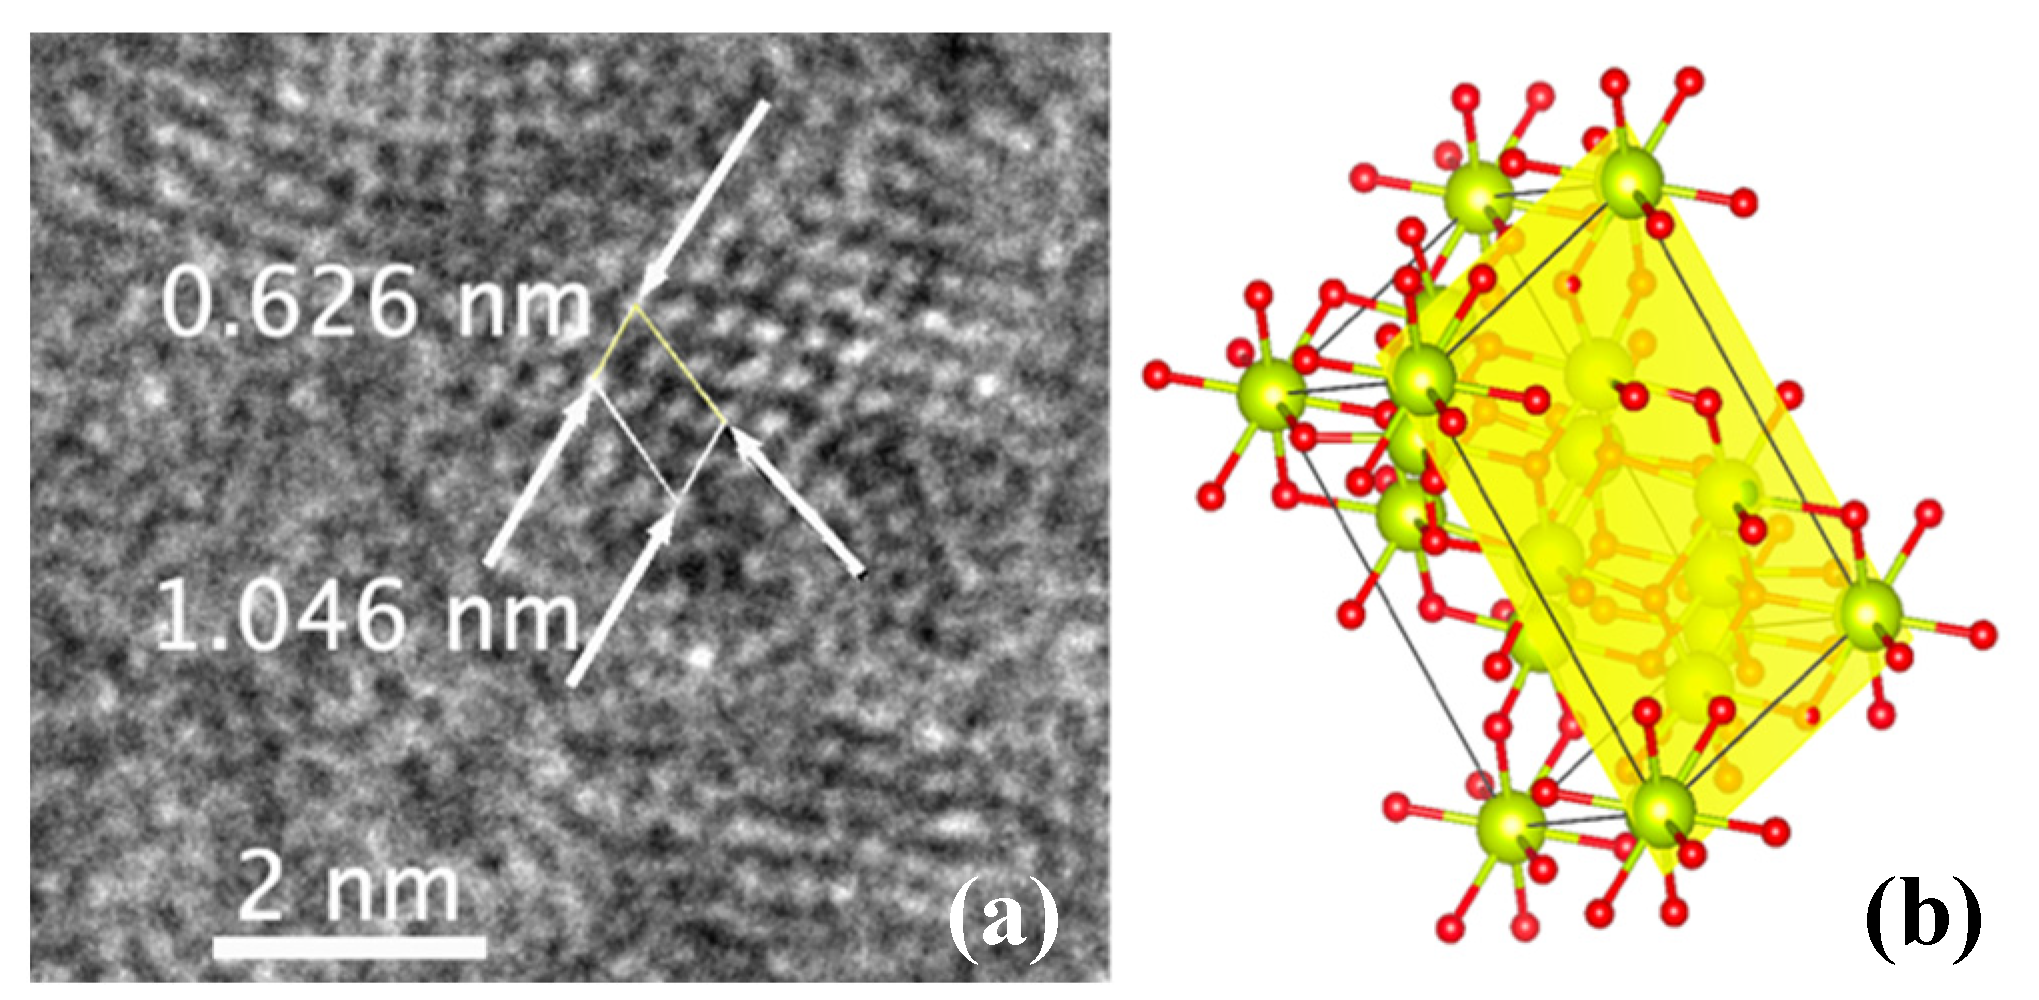
| Nanocrystal | Ce-Ce Lattice Distance Measured (Å) | Ce-Ce Theoretical Lattice Distance (Å) | Lattice Expansion |
|---|---|---|---|
| CeO2 | (3.85 ± 0.06) | 3.825 [26] | +0.653% |
| Ce2O3 | (3.76 ± 0.04) and (6.31 ± 0.07) | 3.77 and 6.06 [25] | −0.398% and +4.175% |
| Ce7O12 | (6.35 ± 0.08) and 3.80 ± 0.09) | 6.78 and 3.812 [24] | −6.298% and −0.262% |
| Ce11O20 | (3.73 ± 0.01) | 3.717 [24] | +0.215% |
Publisher’s Note: MDPI stays neutral with regard to jurisdictional claims in published maps and institutional affiliations. |
© 2022 by the authors. Licensee MDPI, Basel, Switzerland. This article is an open access article distributed under the terms and conditions of the Creative Commons Attribution (CC BY) license (https://creativecommons.org/licenses/by/4.0/).
Share and Cite
Ranasinghe, K.S.; Singh, R.; Leshchev, D.; Vasquez, A.; Stavitski, E.; Foster, I. Synthesis of Nanoceria with Varied Ratios of Ce3+/Ce4+ Utilizing Soluble Borate Glass. Nanomaterials 2022, 12, 2363. https://doi.org/10.3390/nano12142363
Ranasinghe KS, Singh R, Leshchev D, Vasquez A, Stavitski E, Foster I. Synthesis of Nanoceria with Varied Ratios of Ce3+/Ce4+ Utilizing Soluble Borate Glass. Nanomaterials. 2022; 12(14):2363. https://doi.org/10.3390/nano12142363
Chicago/Turabian StyleRanasinghe, Kisa S., Rajnish Singh, Denis Leshchev, Angel Vasquez, Eli Stavitski, and Ian Foster. 2022. "Synthesis of Nanoceria with Varied Ratios of Ce3+/Ce4+ Utilizing Soluble Borate Glass" Nanomaterials 12, no. 14: 2363. https://doi.org/10.3390/nano12142363
APA StyleRanasinghe, K. S., Singh, R., Leshchev, D., Vasquez, A., Stavitski, E., & Foster, I. (2022). Synthesis of Nanoceria with Varied Ratios of Ce3+/Ce4+ Utilizing Soluble Borate Glass. Nanomaterials, 12(14), 2363. https://doi.org/10.3390/nano12142363