
Synthesis of Hydroxyapatite/Bioglass Composite Nanopowder Using Design of Experiments

Abstract
:1. Introduction
2. Materials and Methods
2.1. Synthesis of HAp
2.2. Synthesis of BG (77 s)
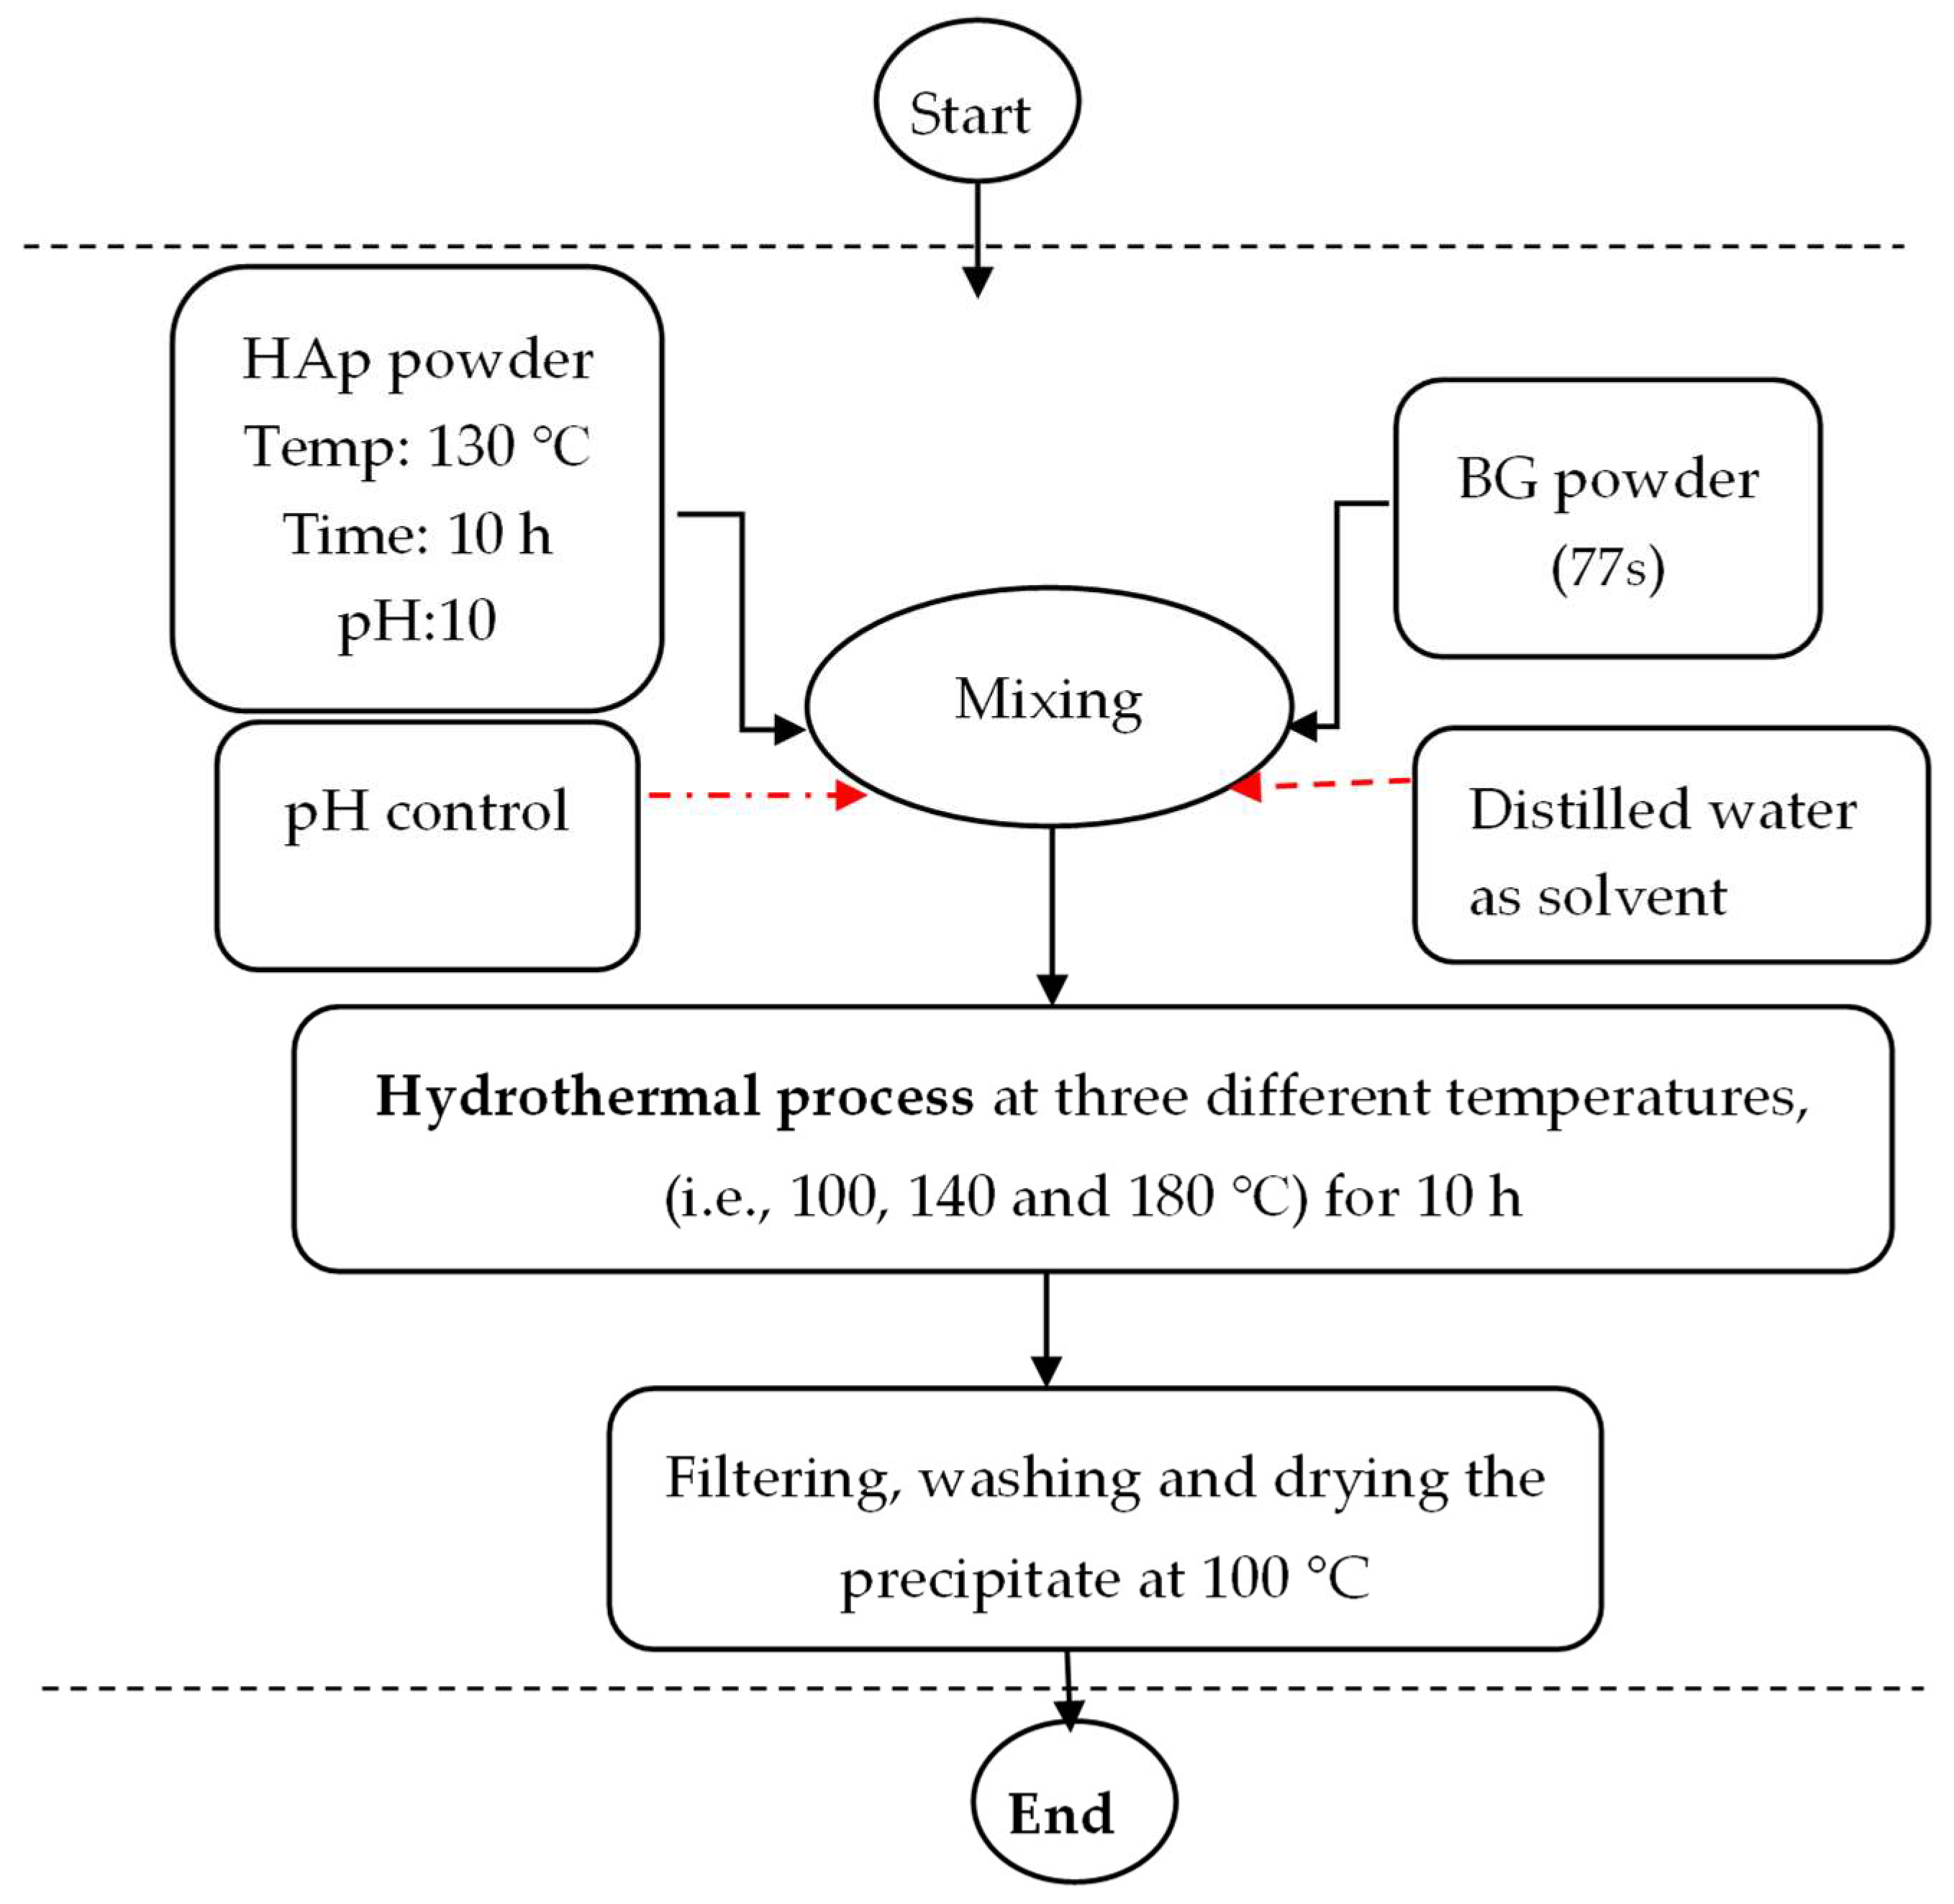
2.3. Synthesis of HAp/BG Nanocomposite Powder
2.4. Investigation of Sample Bioactivity in SBF Solution
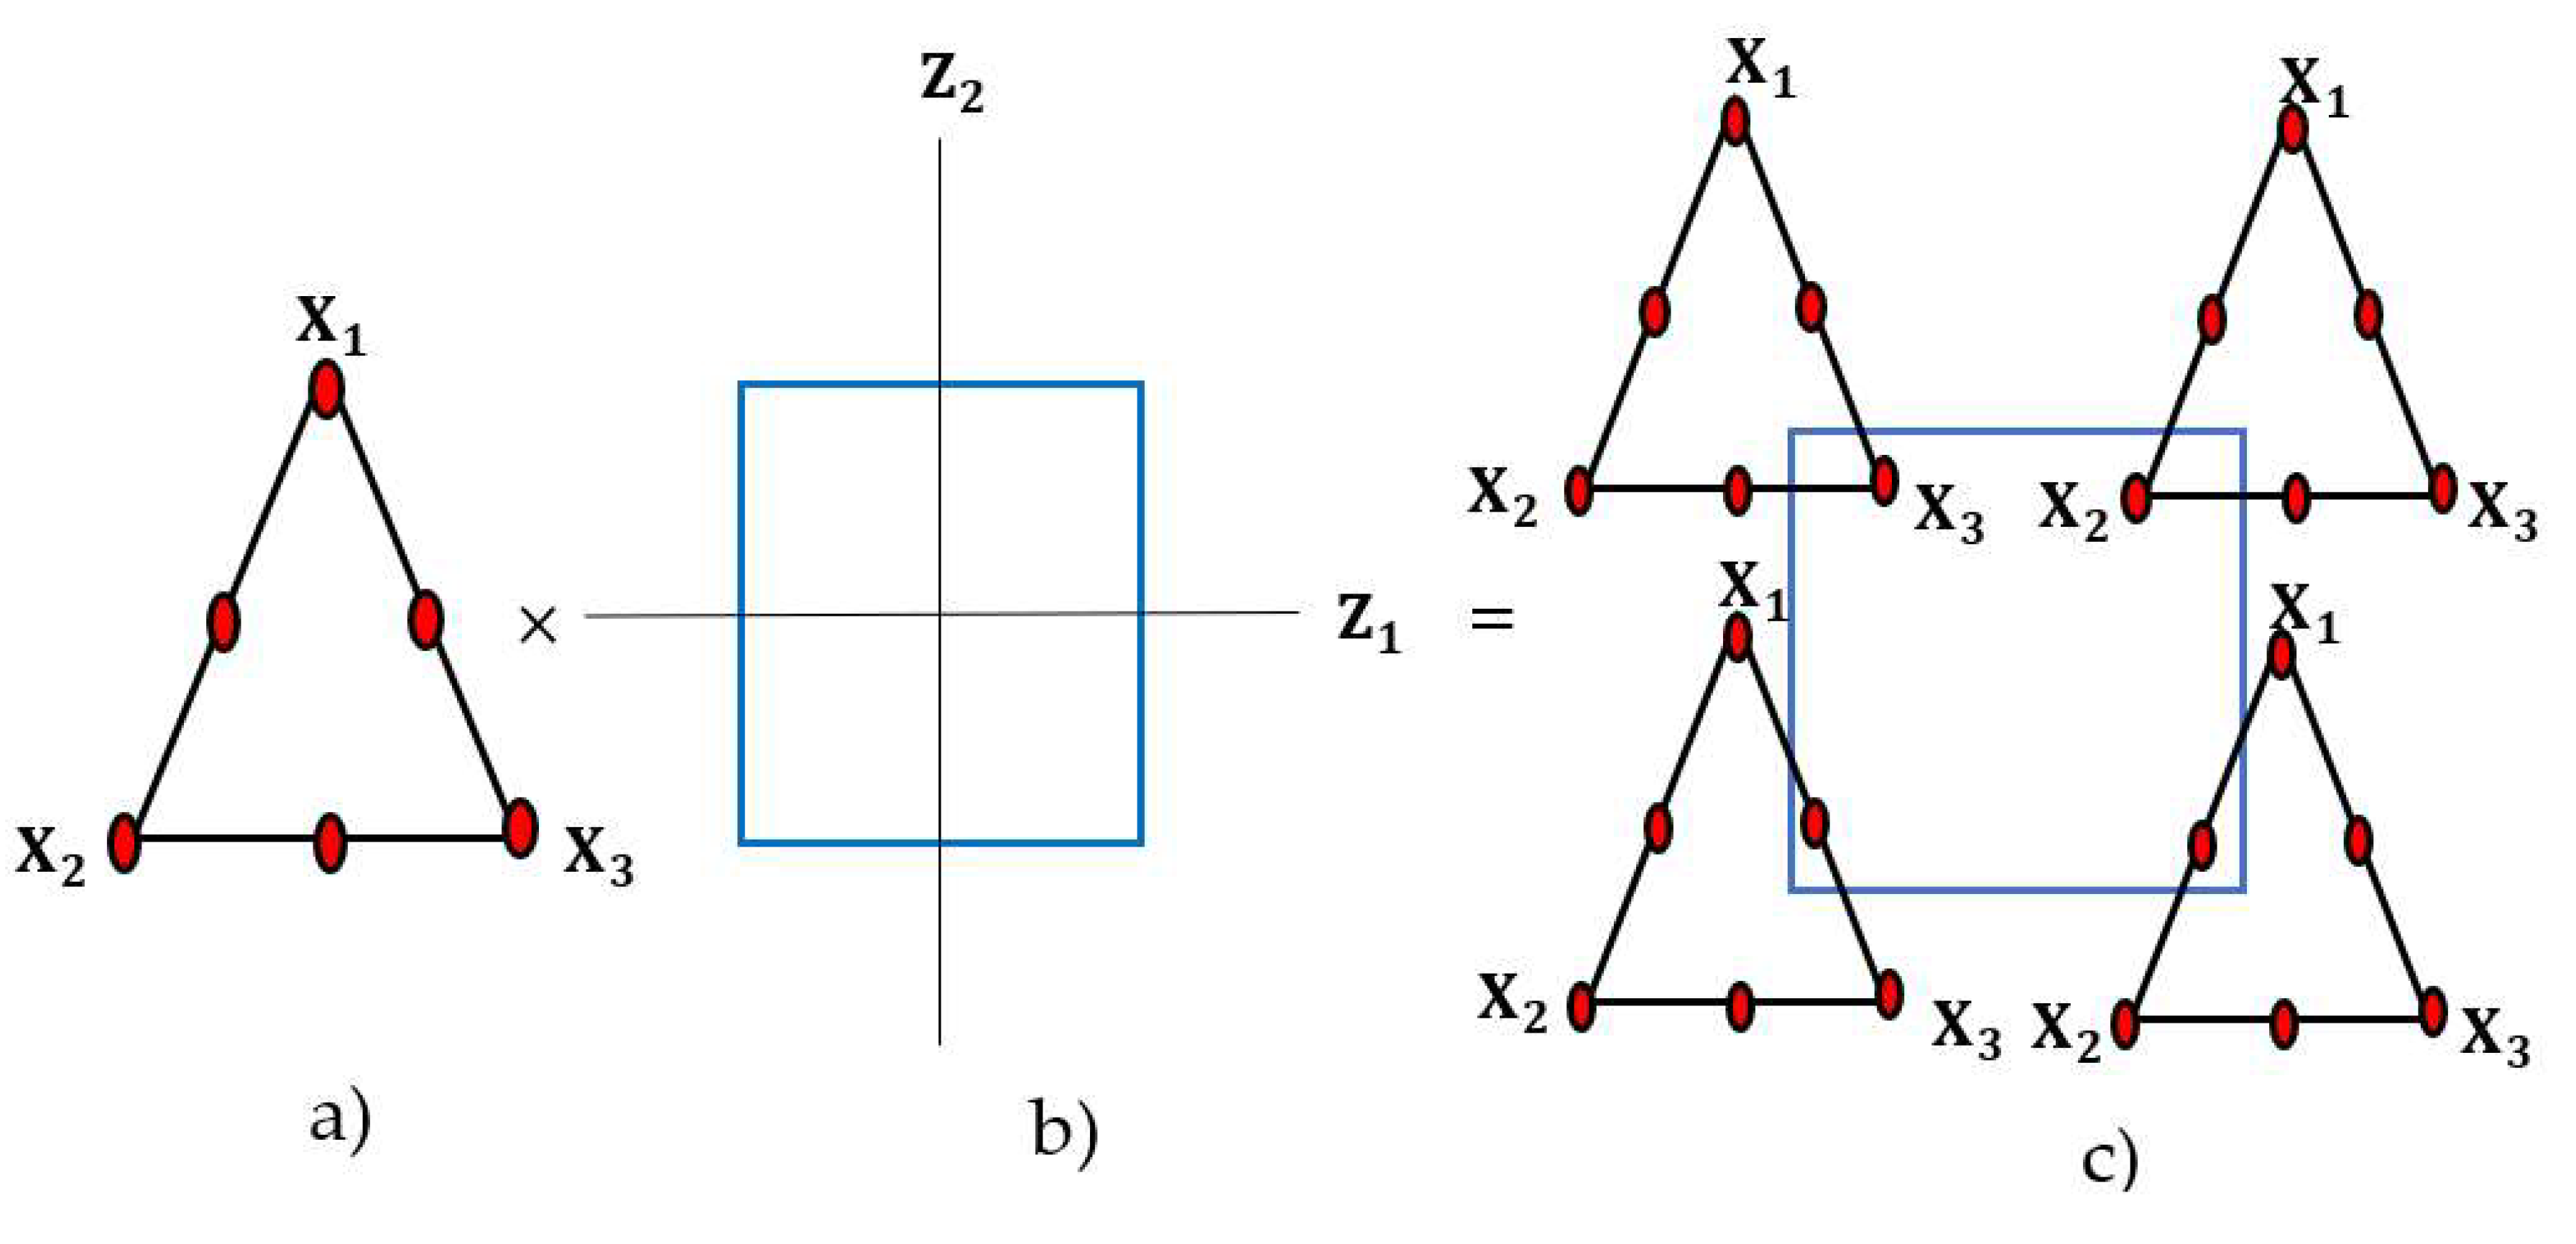
2.5. Design of Experiments
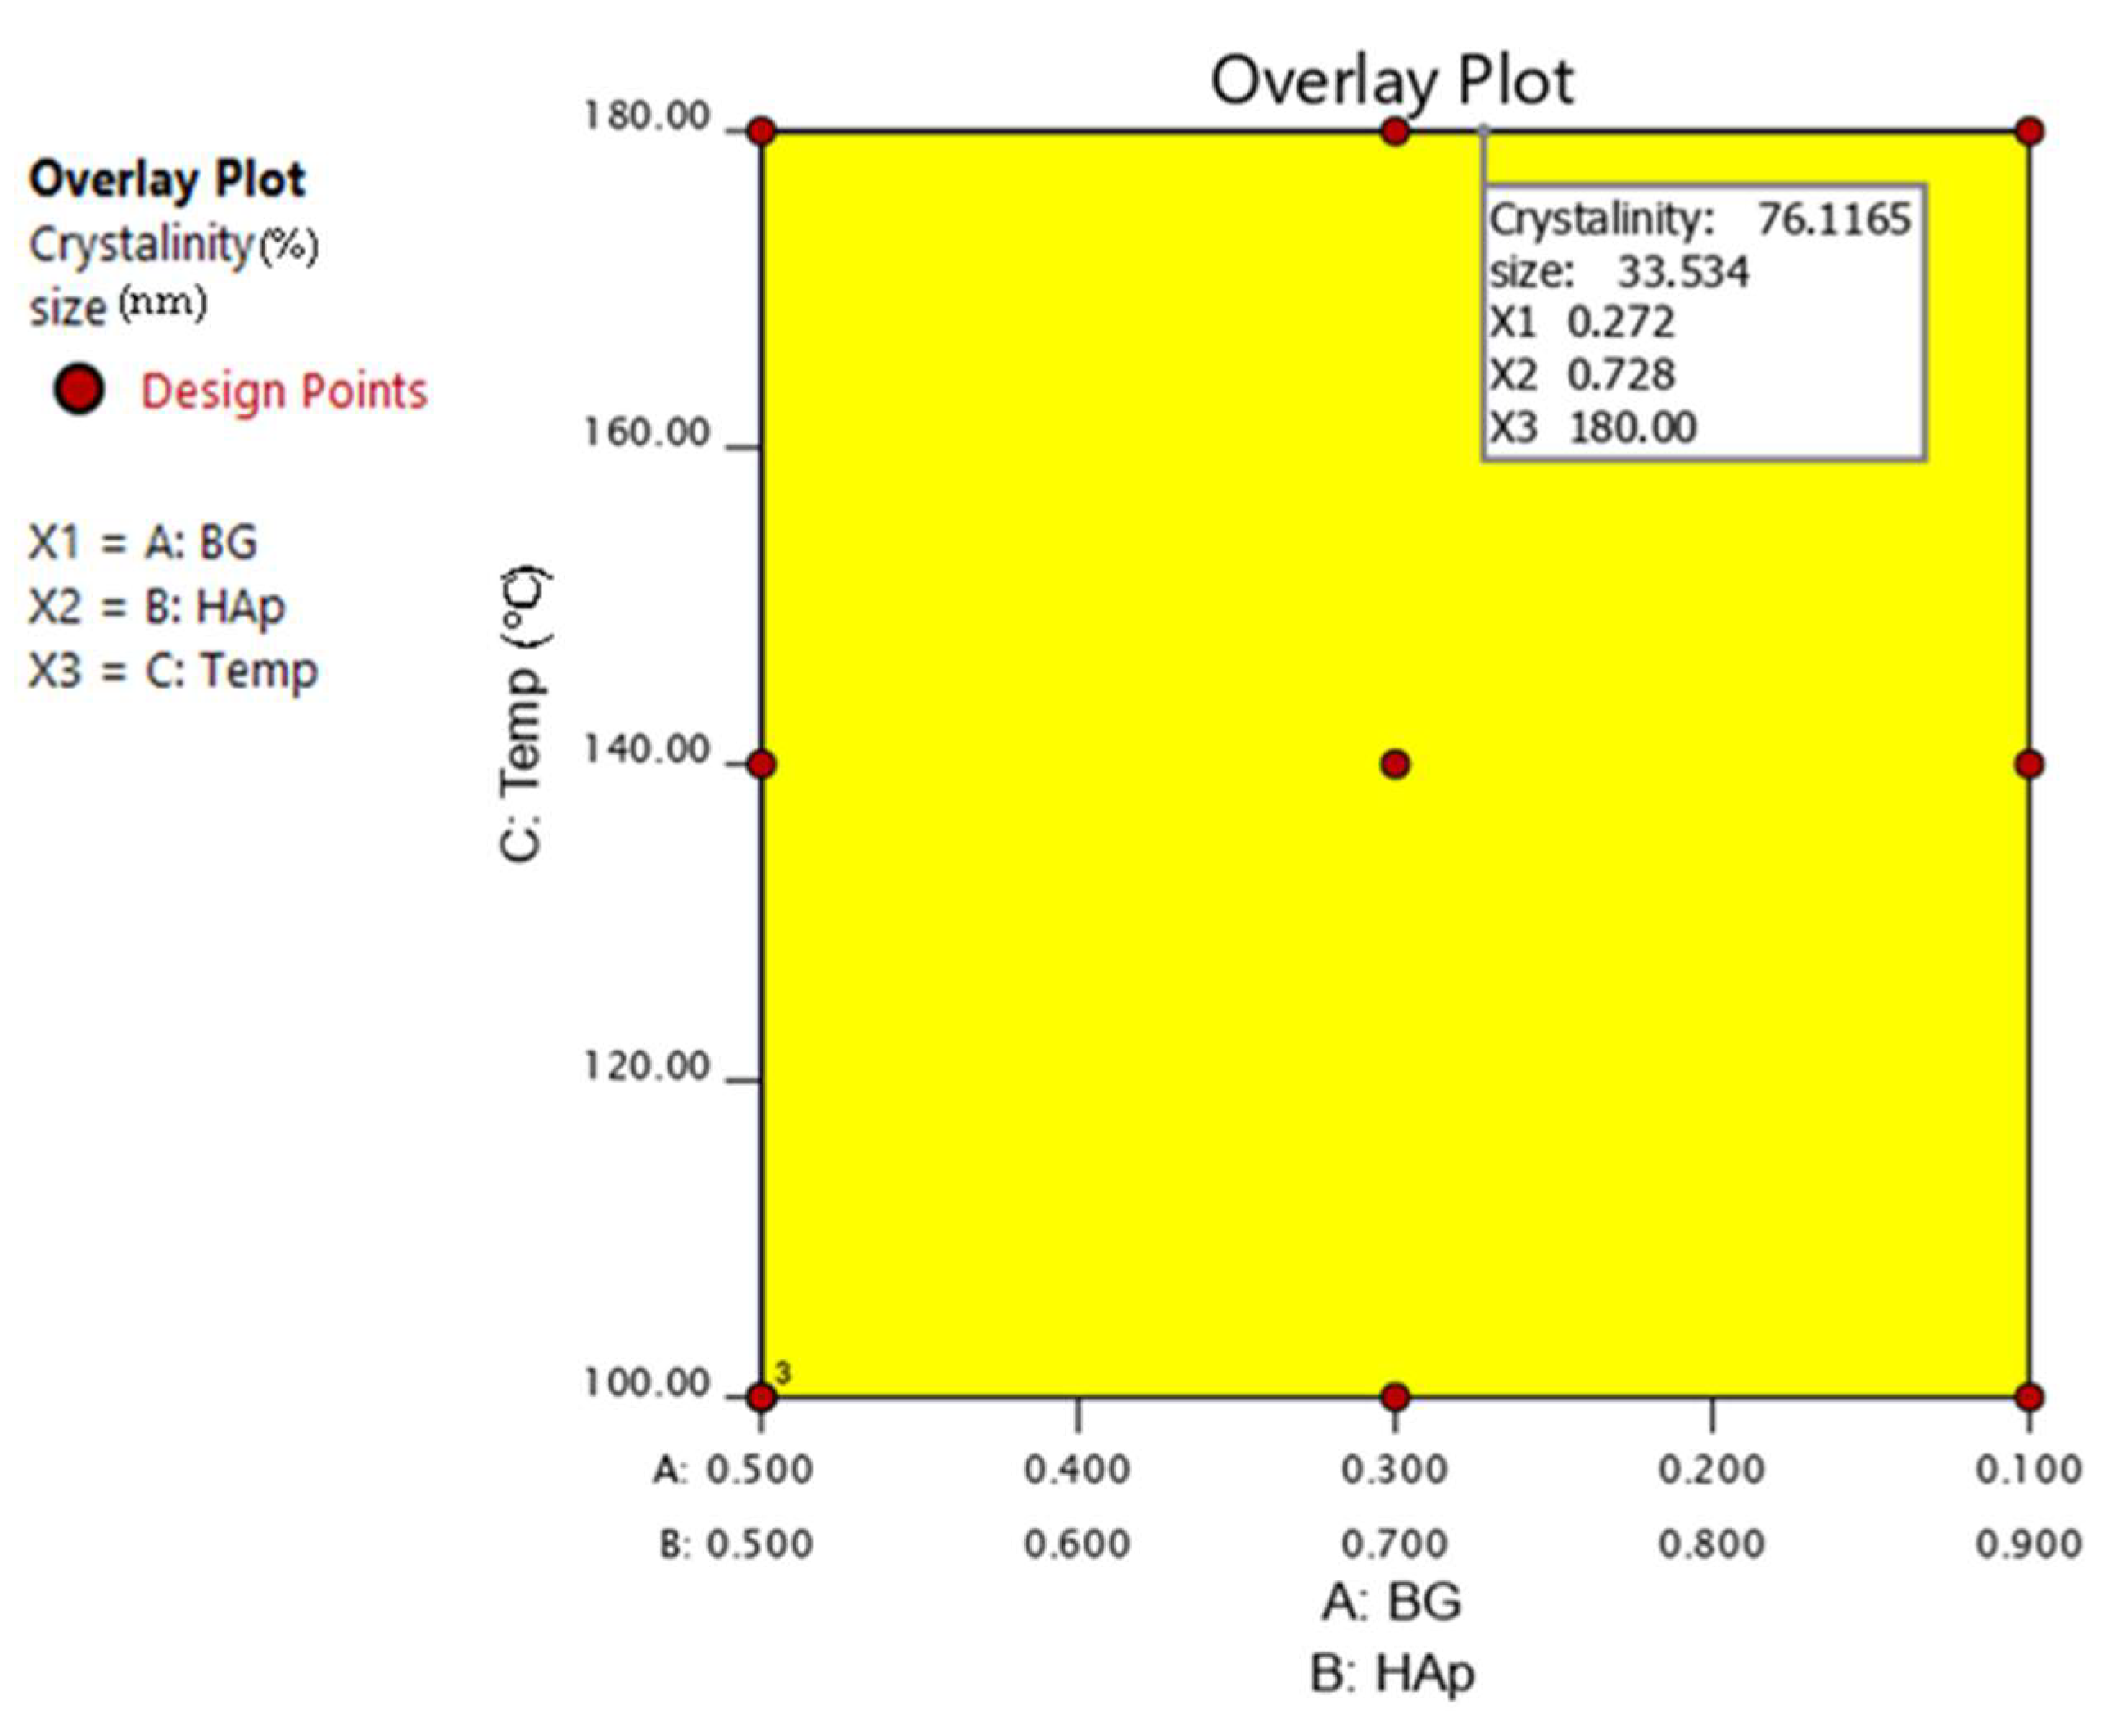
Combined Mixture–Process Design of DOE
- Determining the proper formulation for mixed components with mixed design.
- Optimization of effective process parameters.
3. Results and Discussion
3.1. XRD Analysis
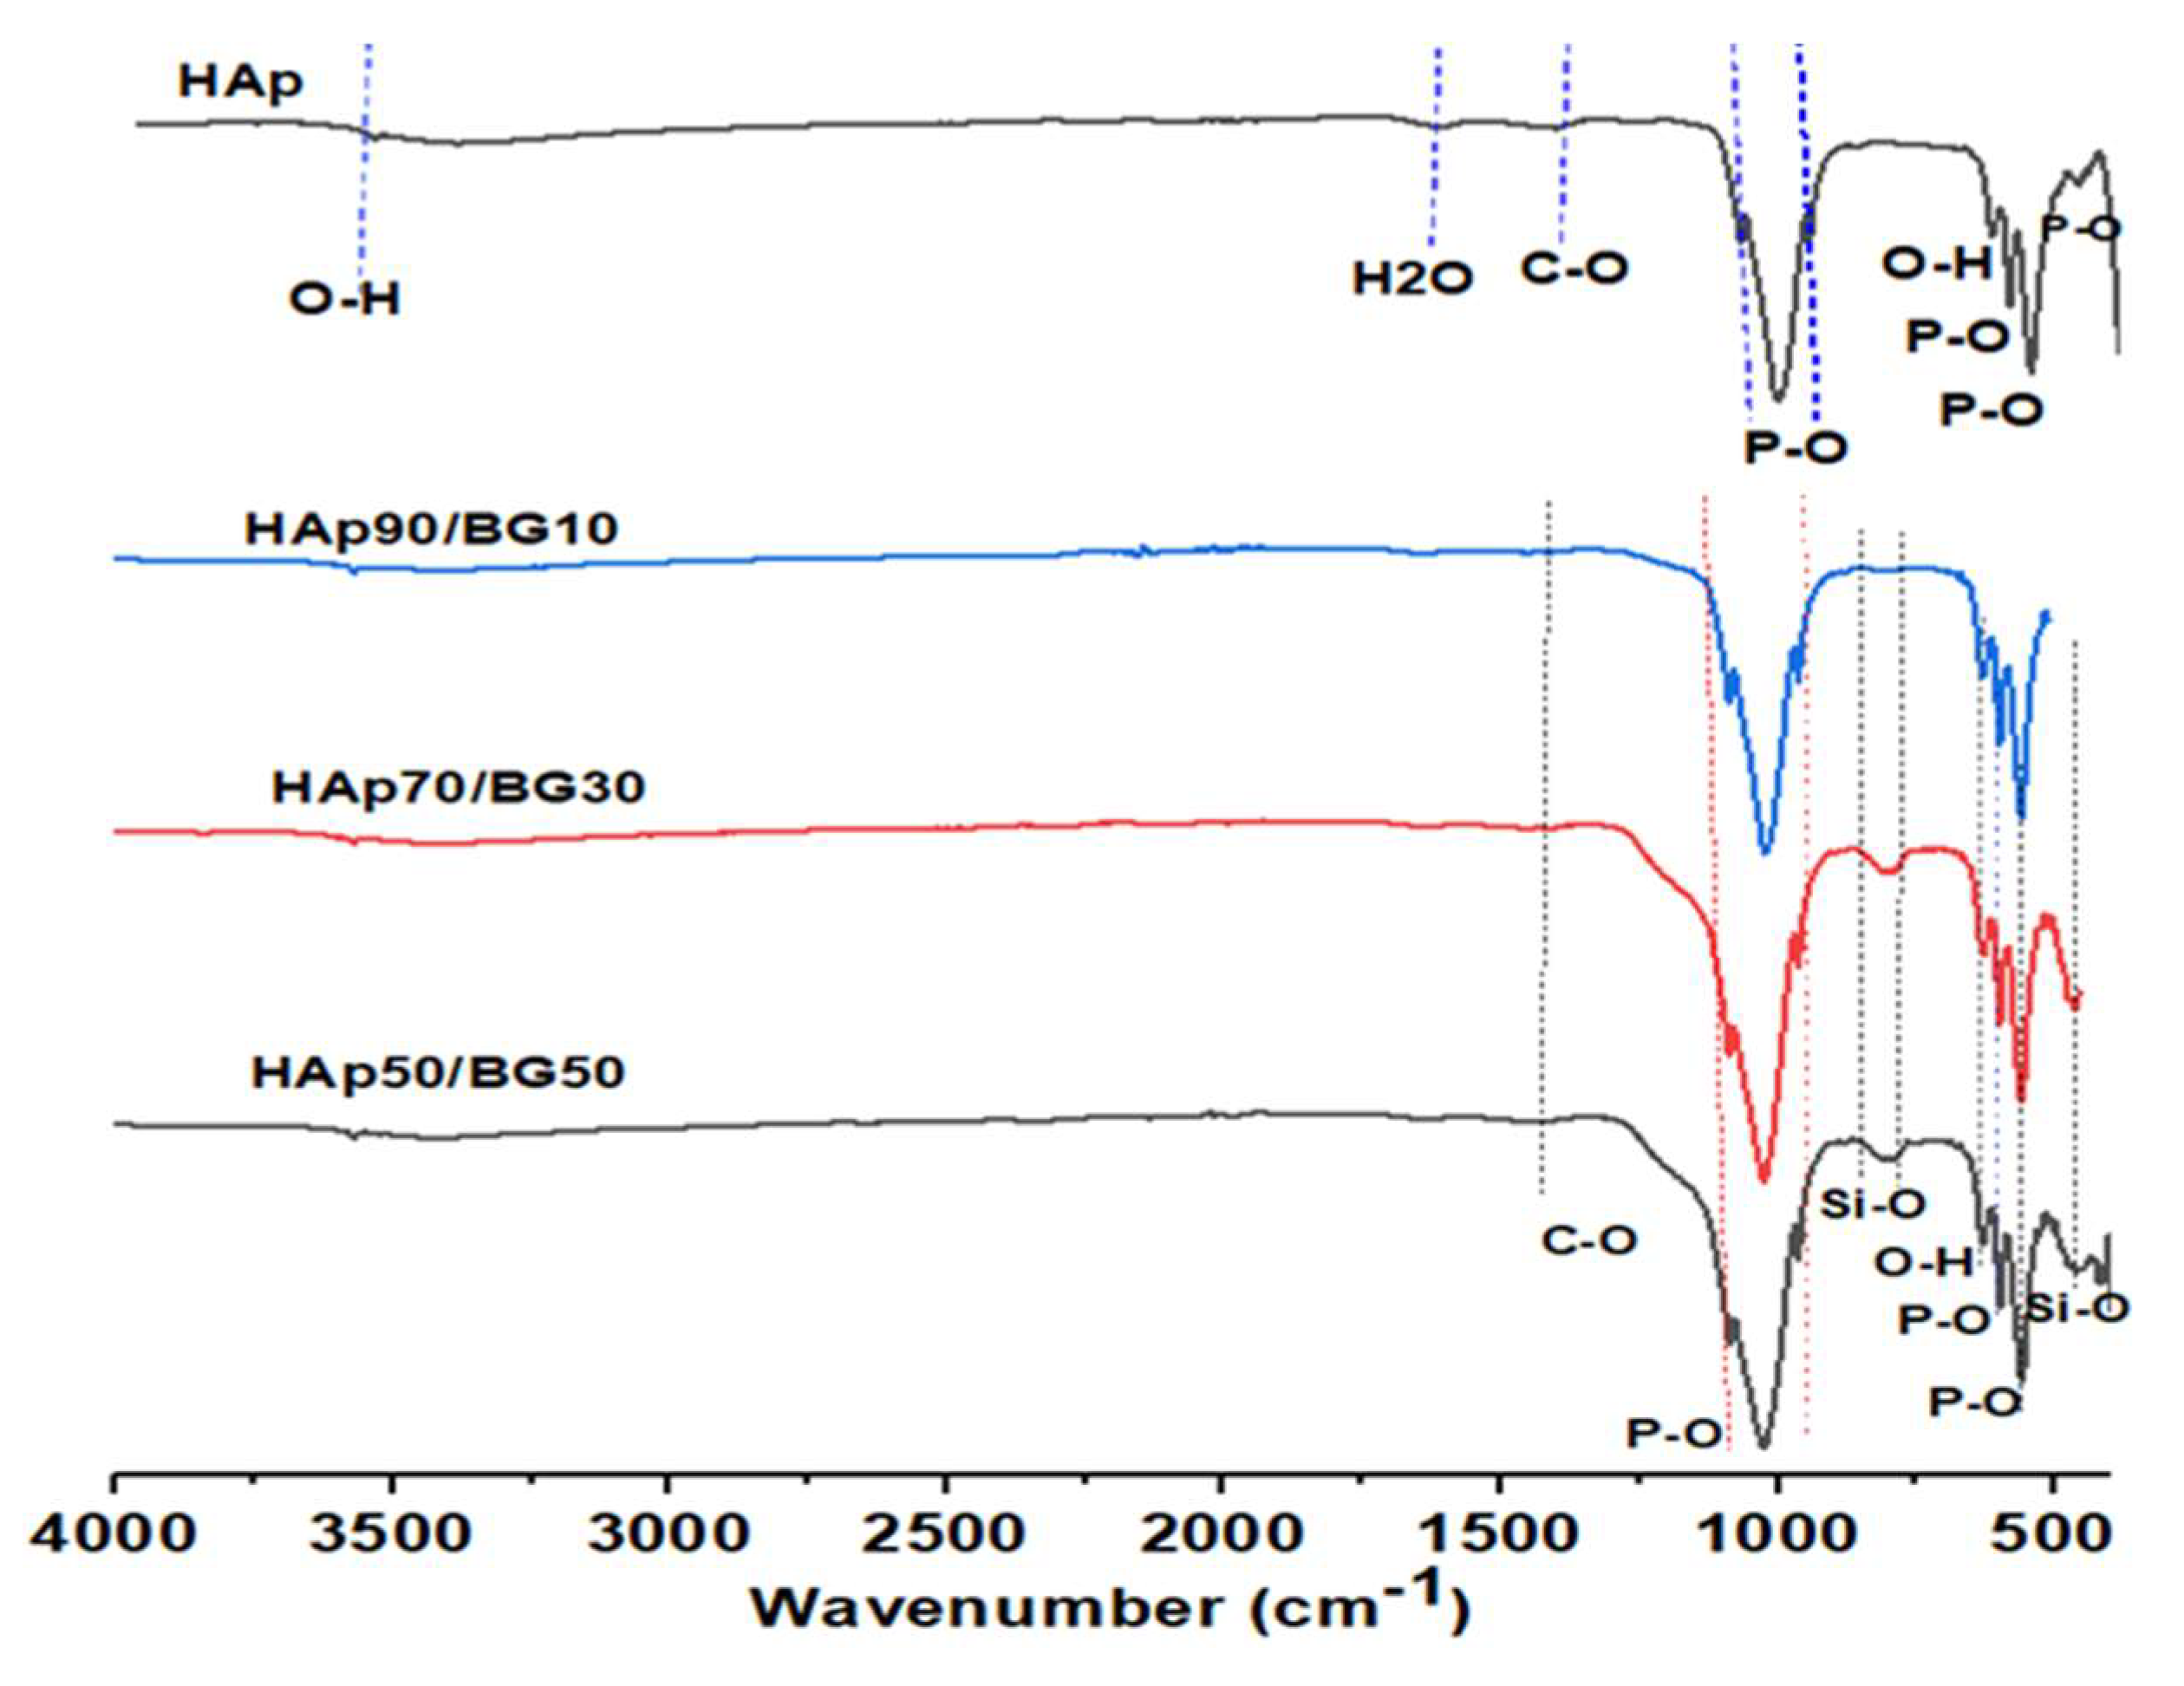
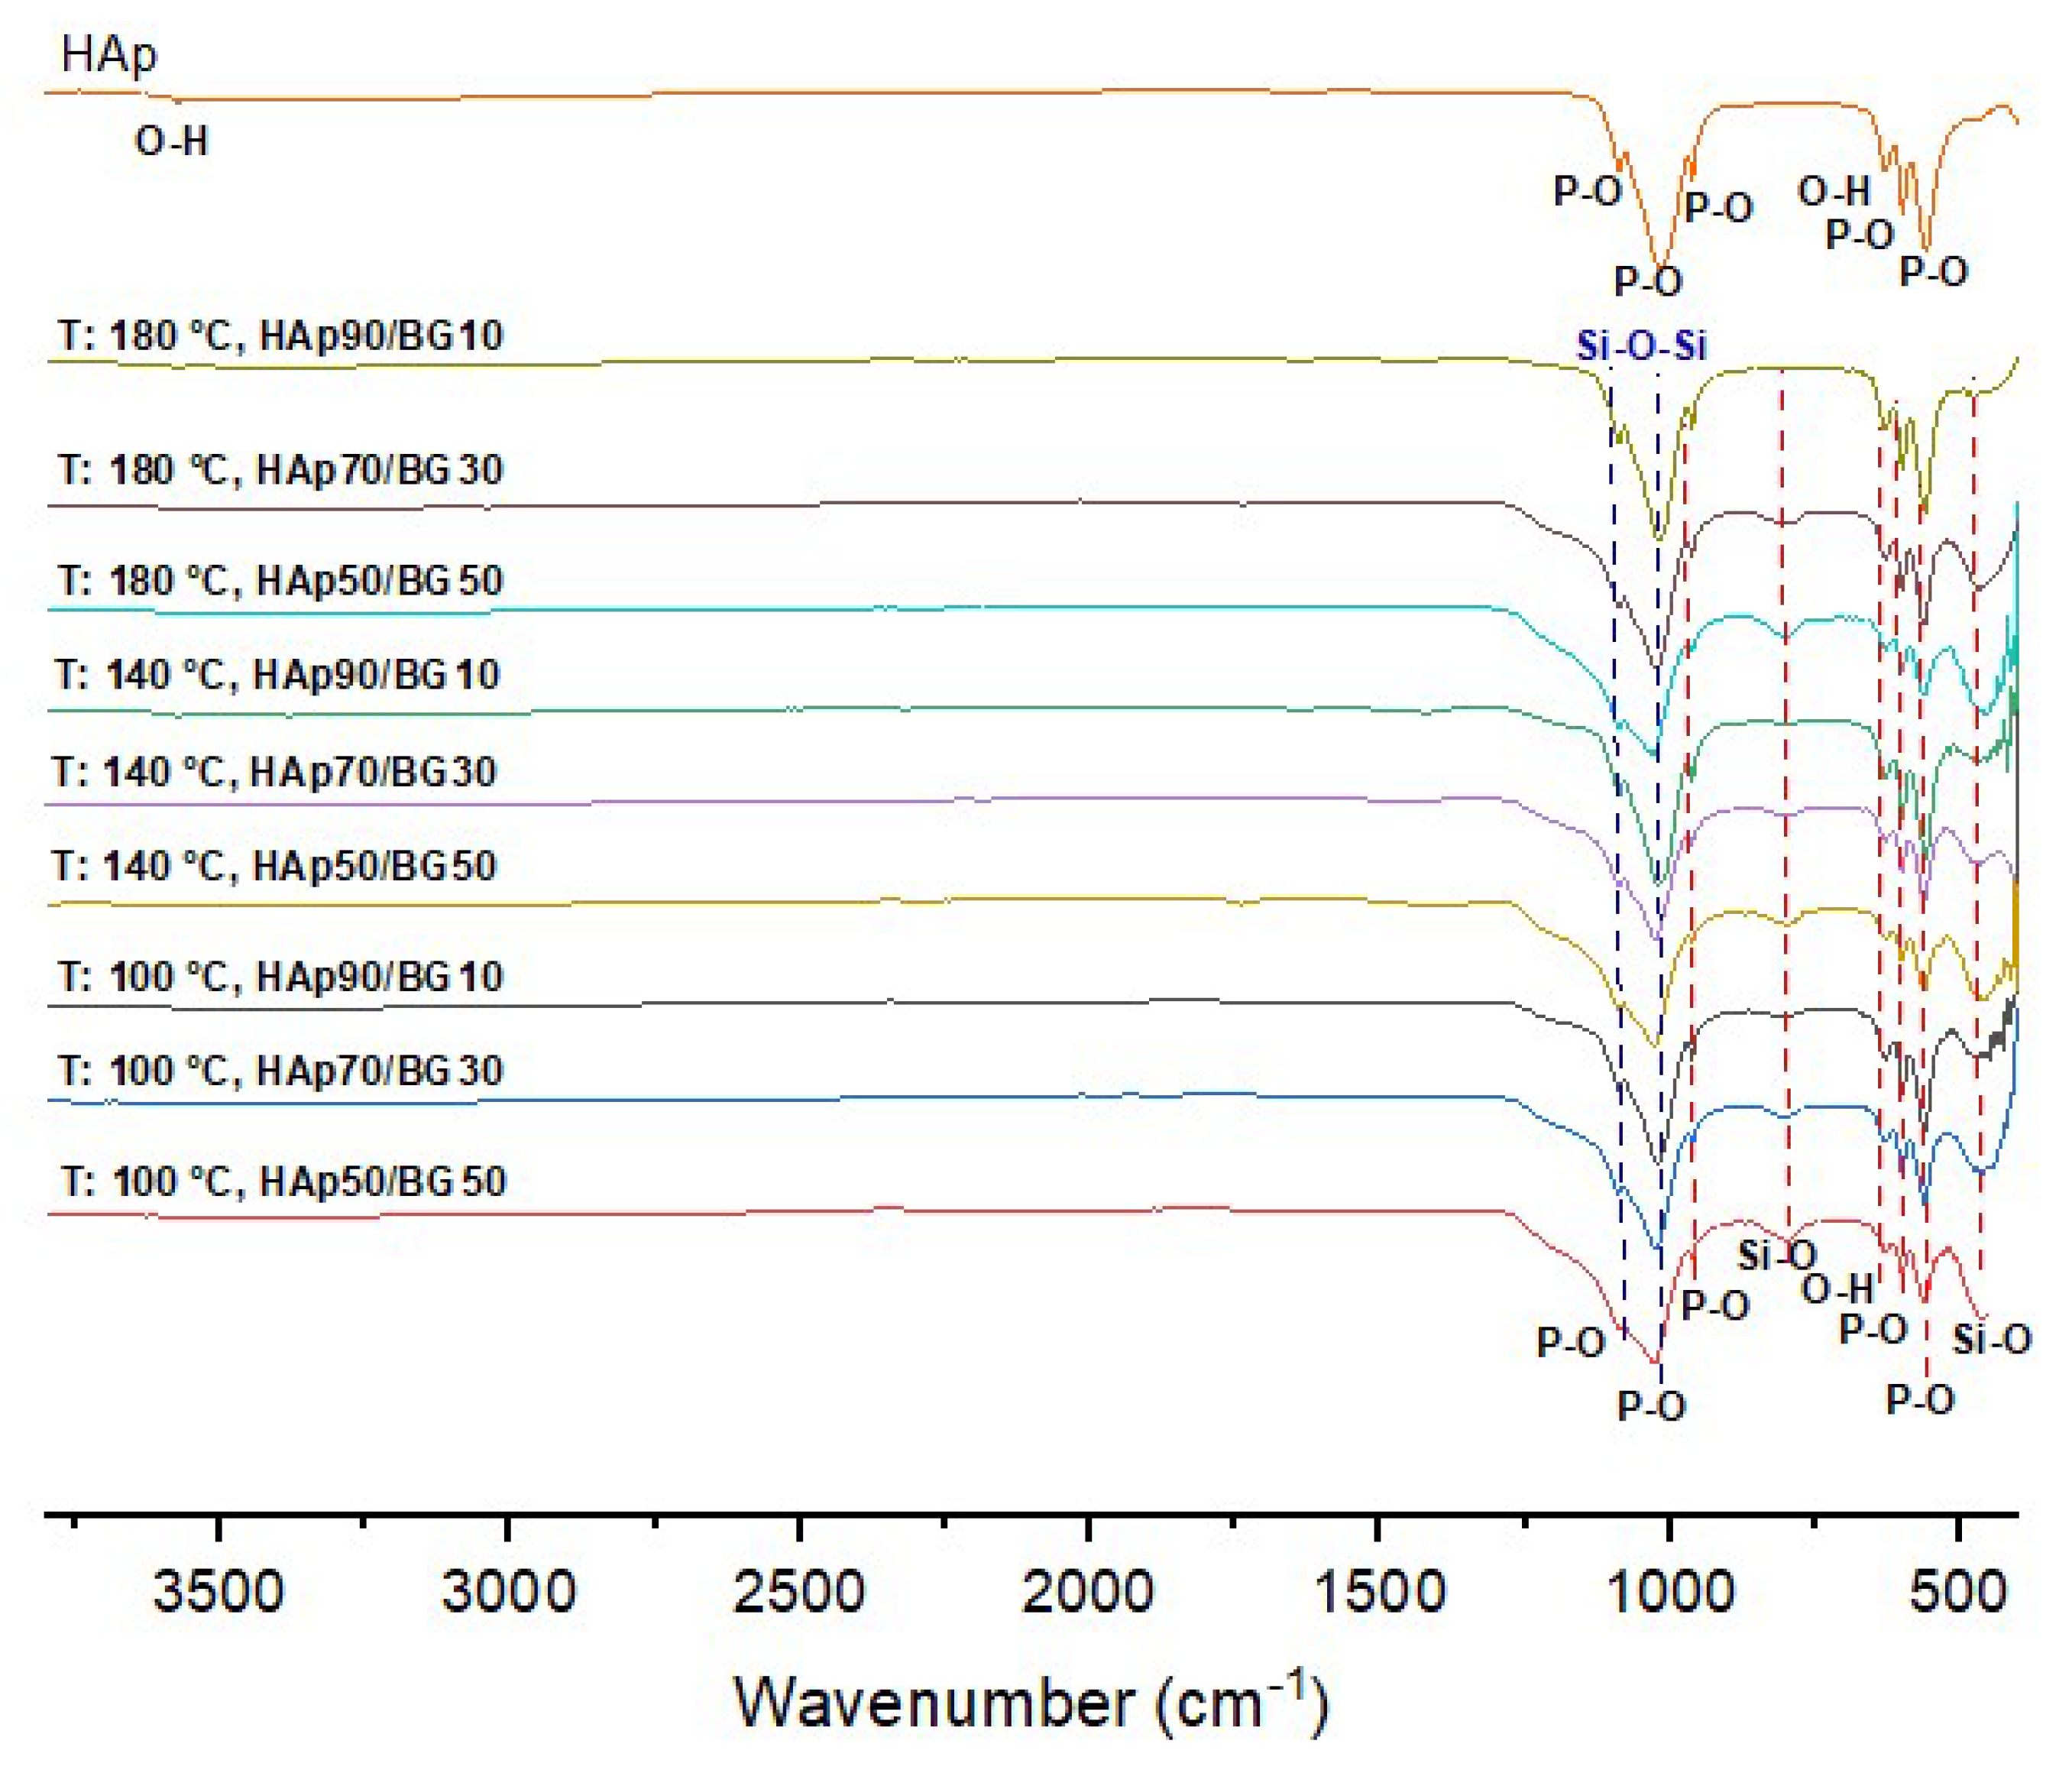
3.2. FTIR Analysis
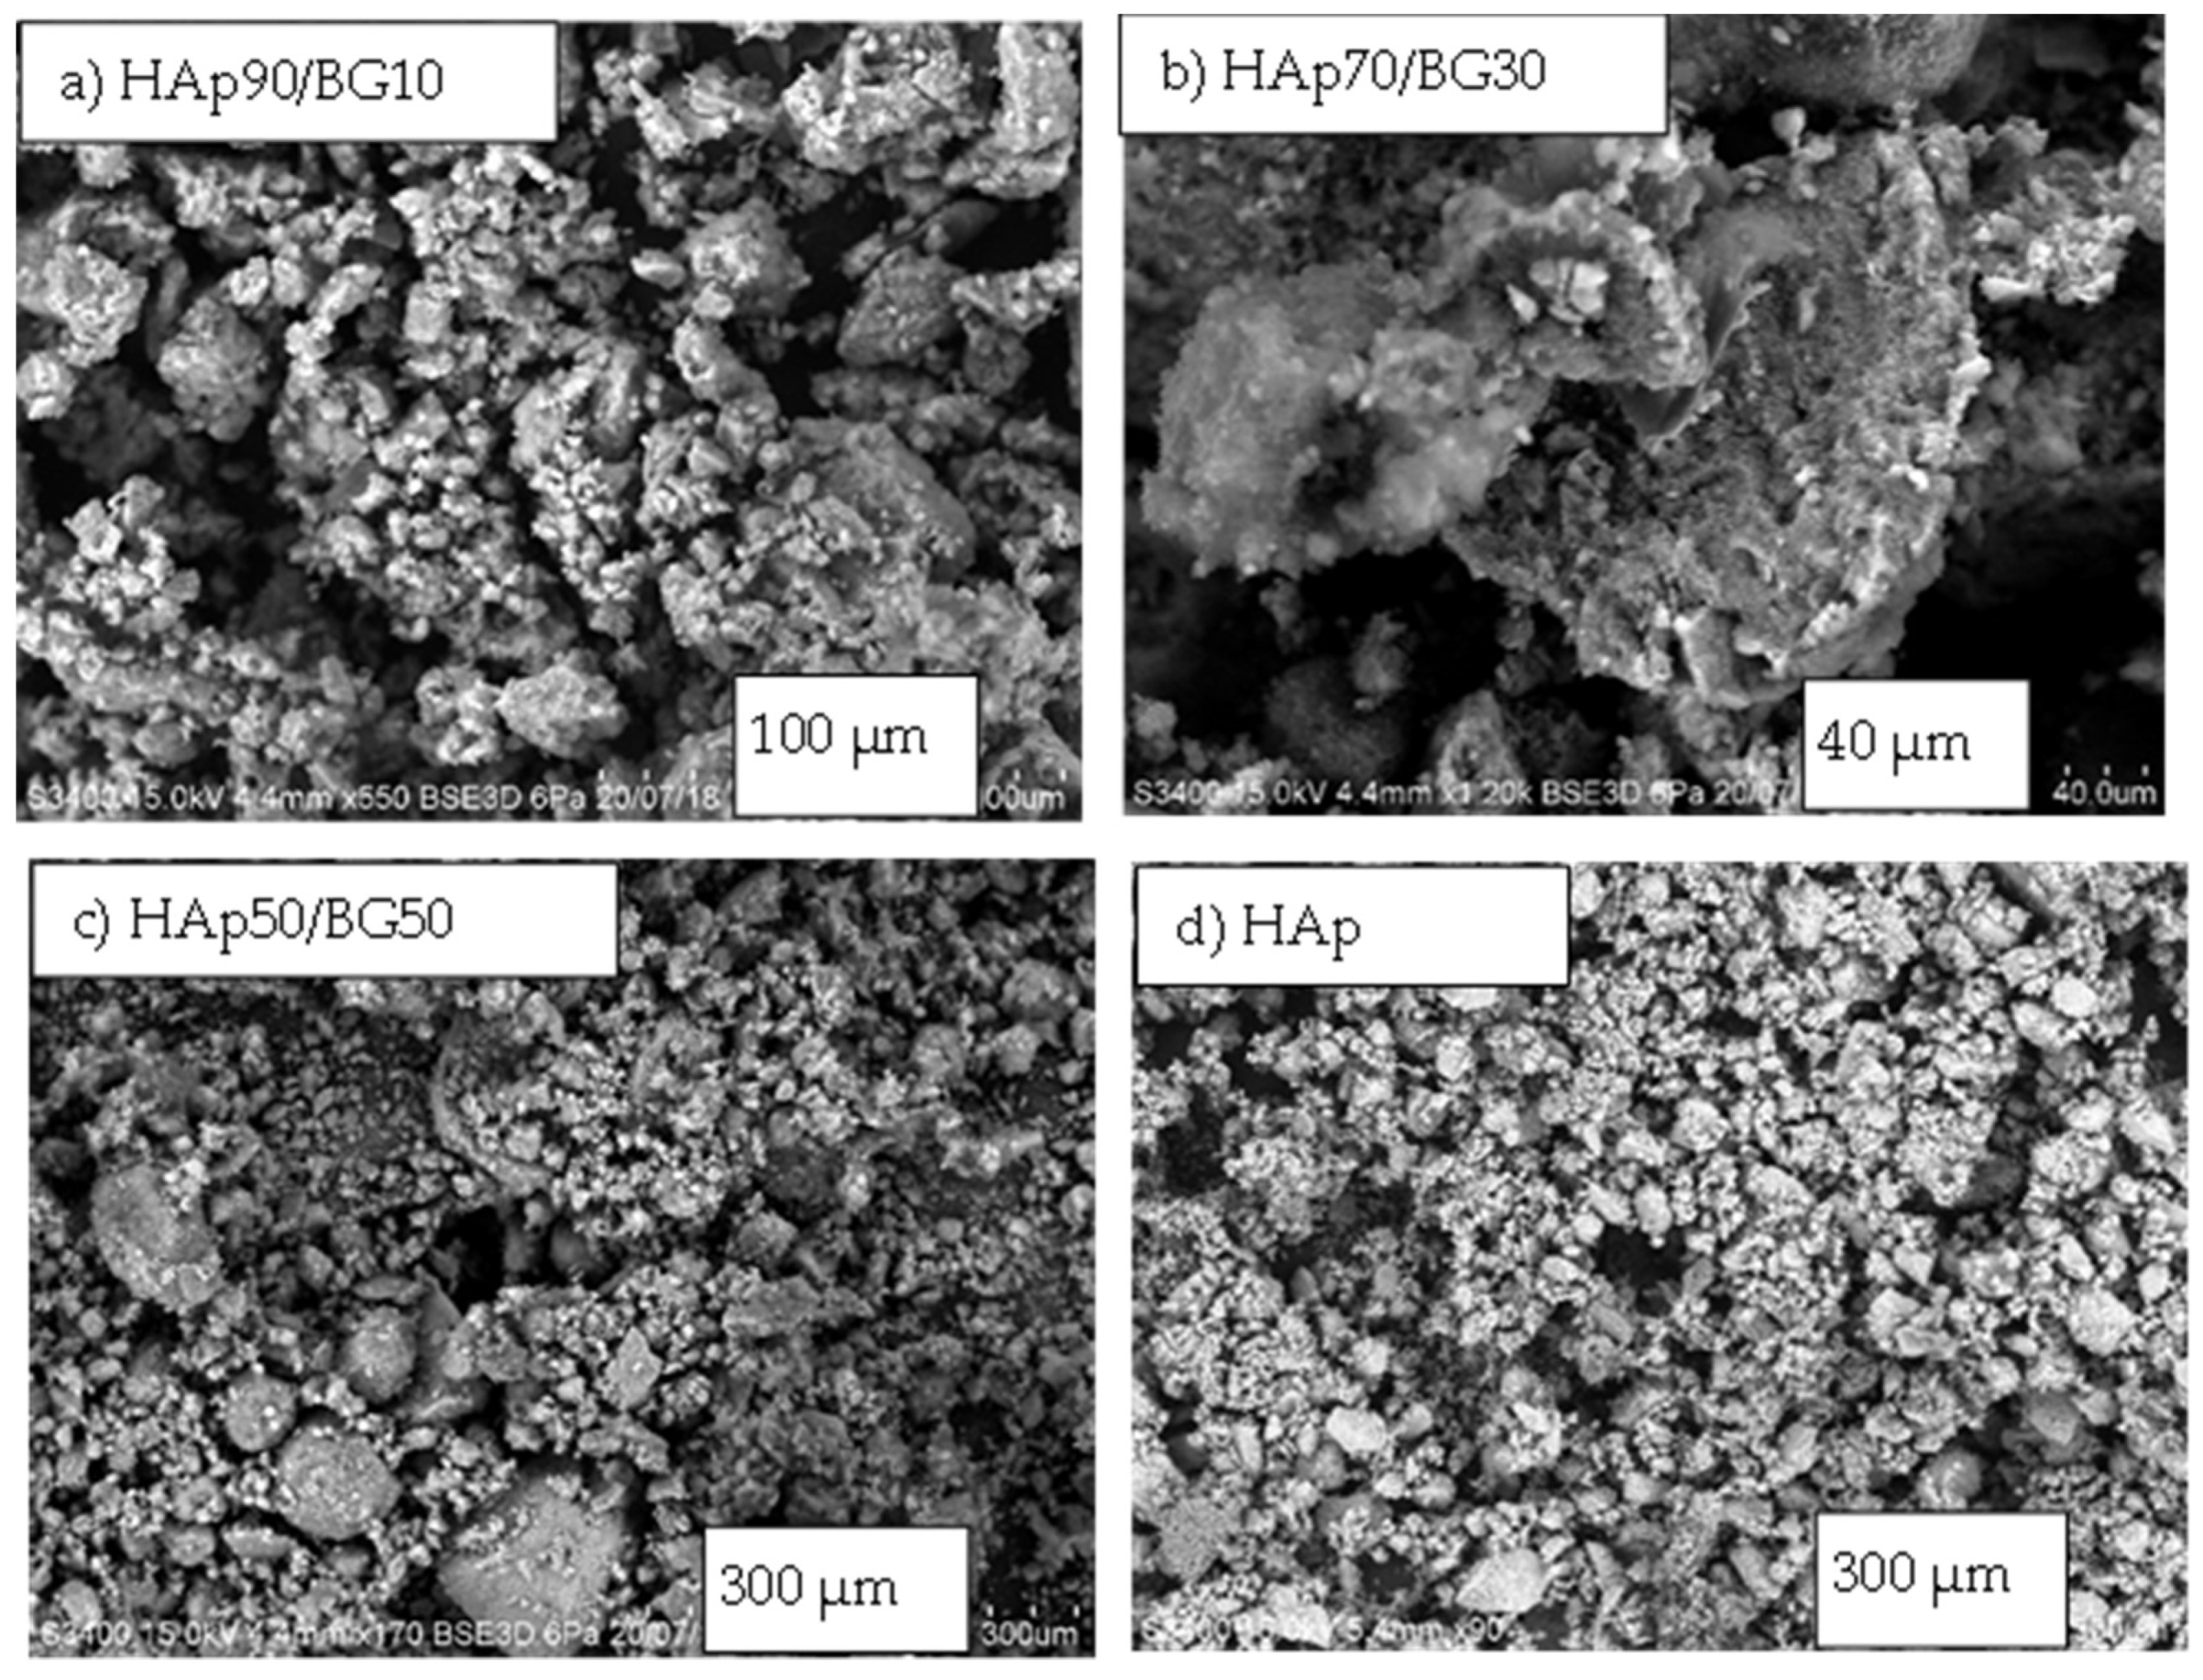
3.3. SEM and EDX Analsis
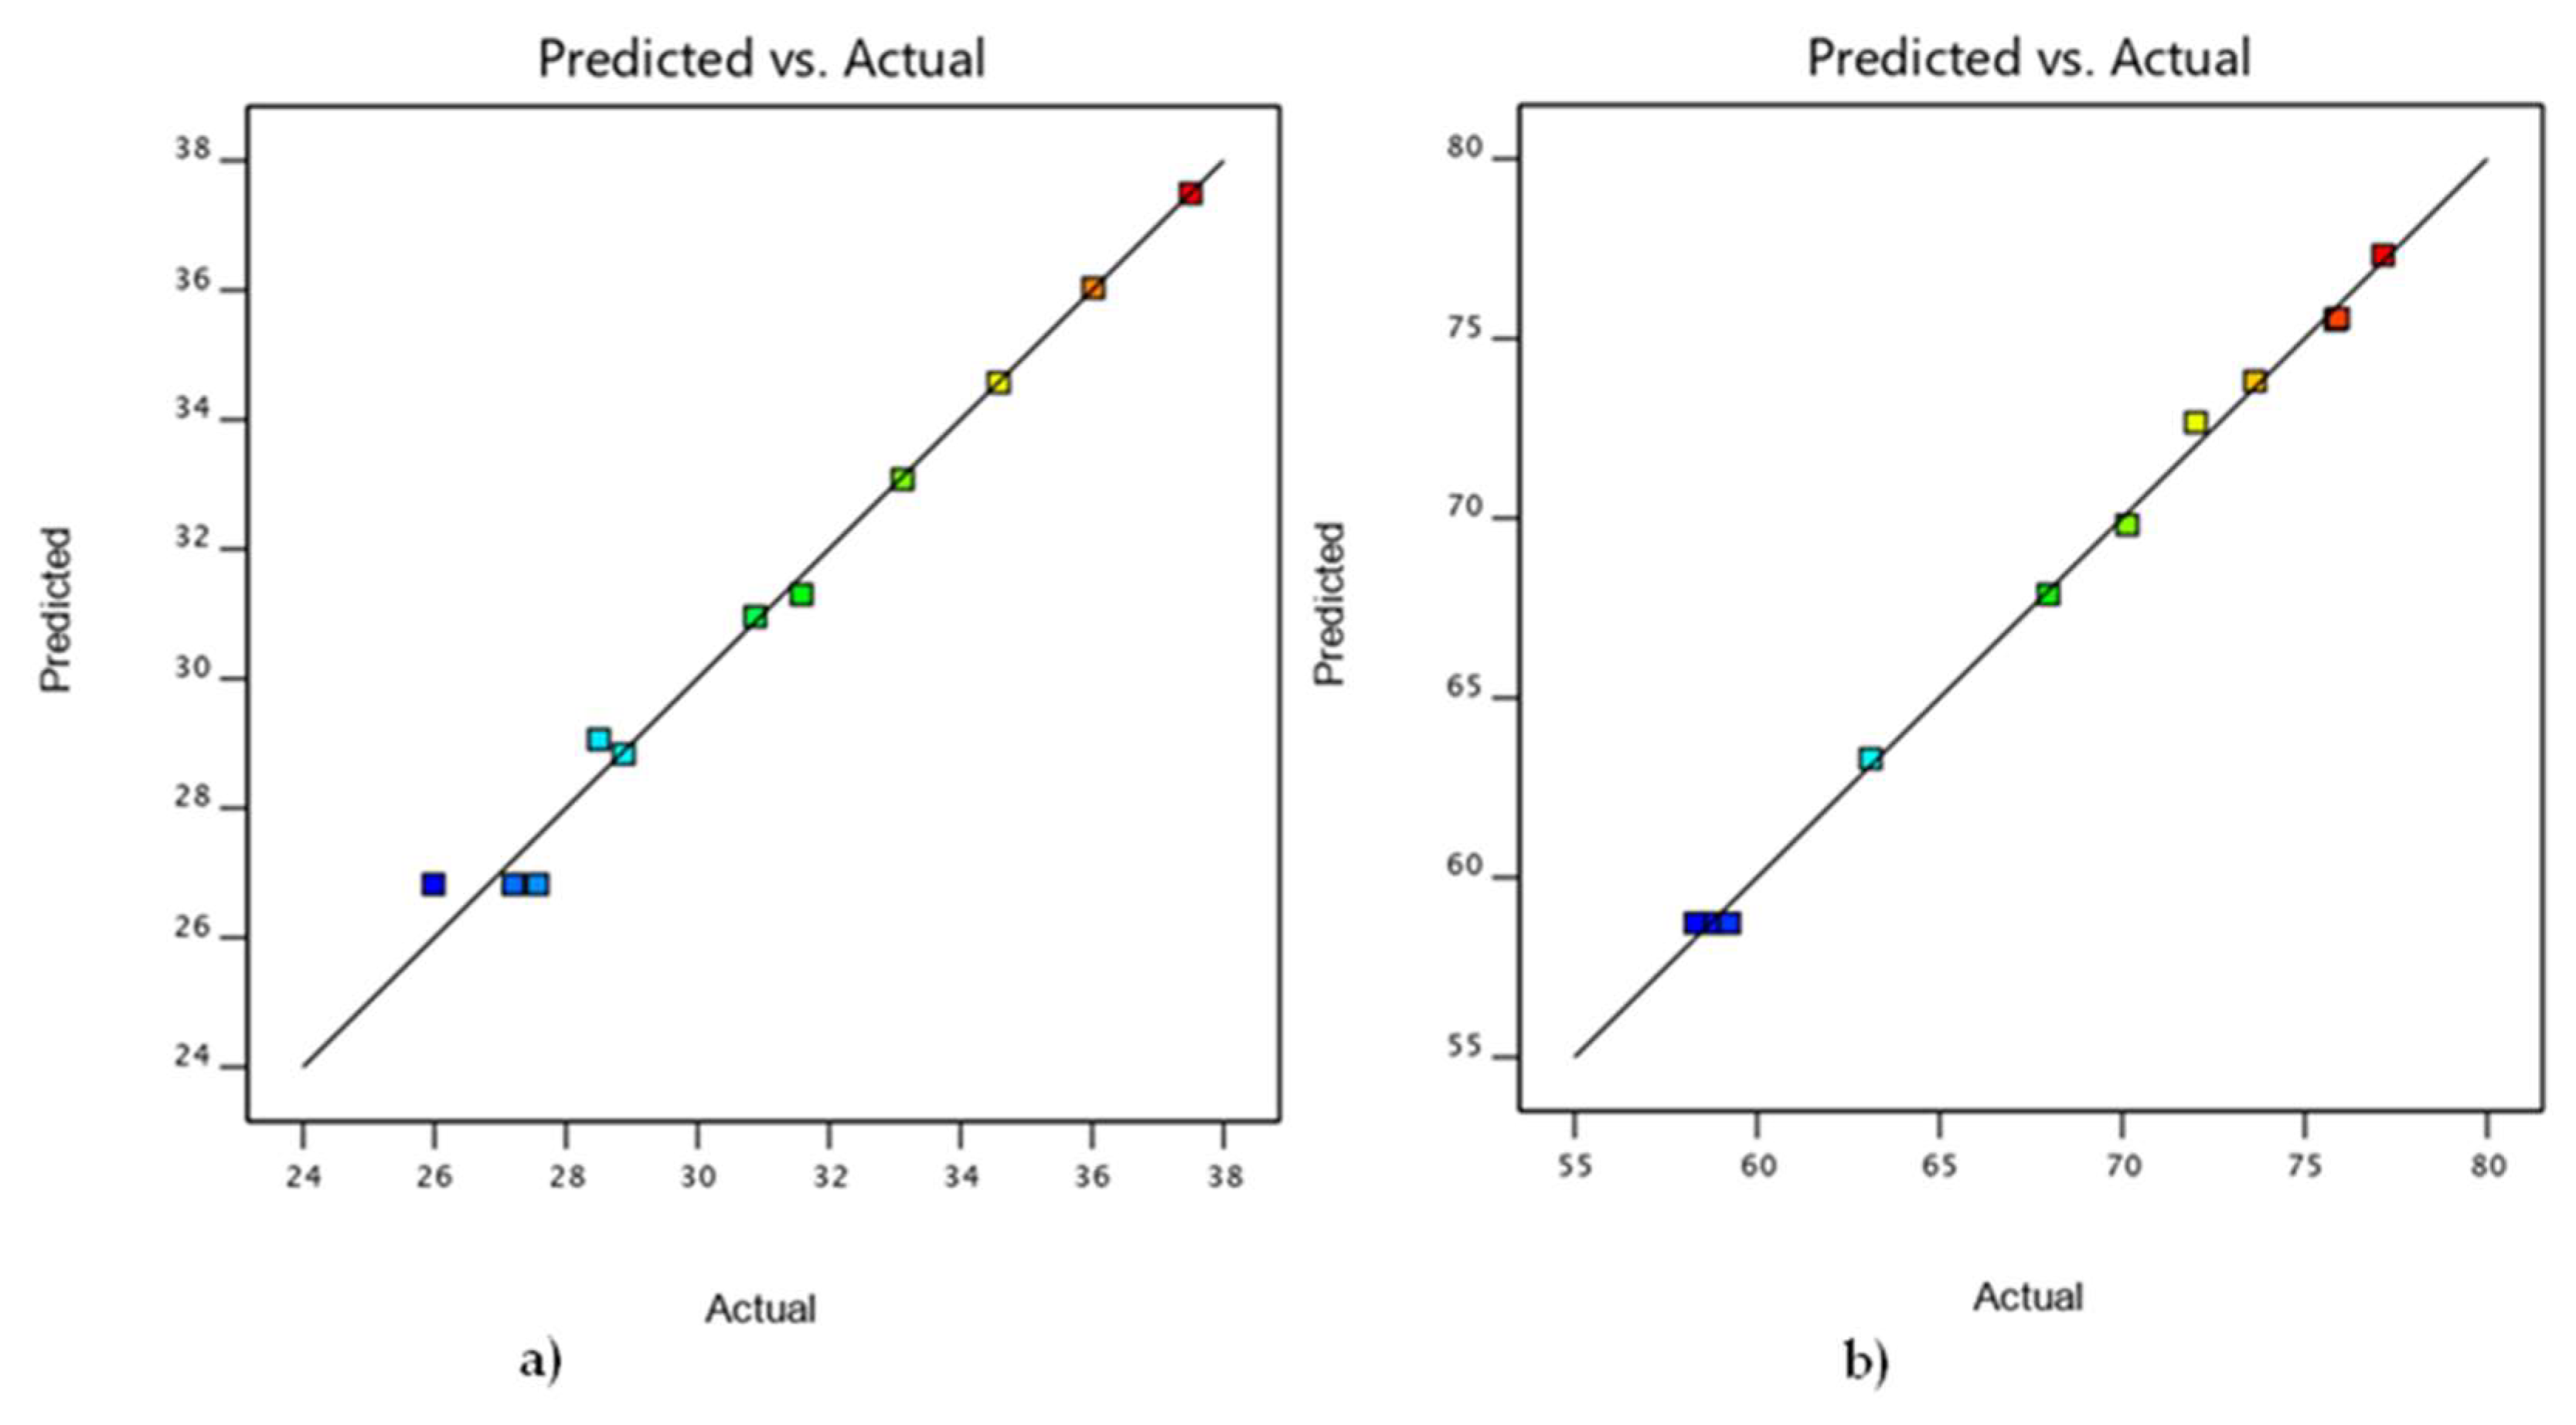
3.4. Comparison of DOE and Experimental Results
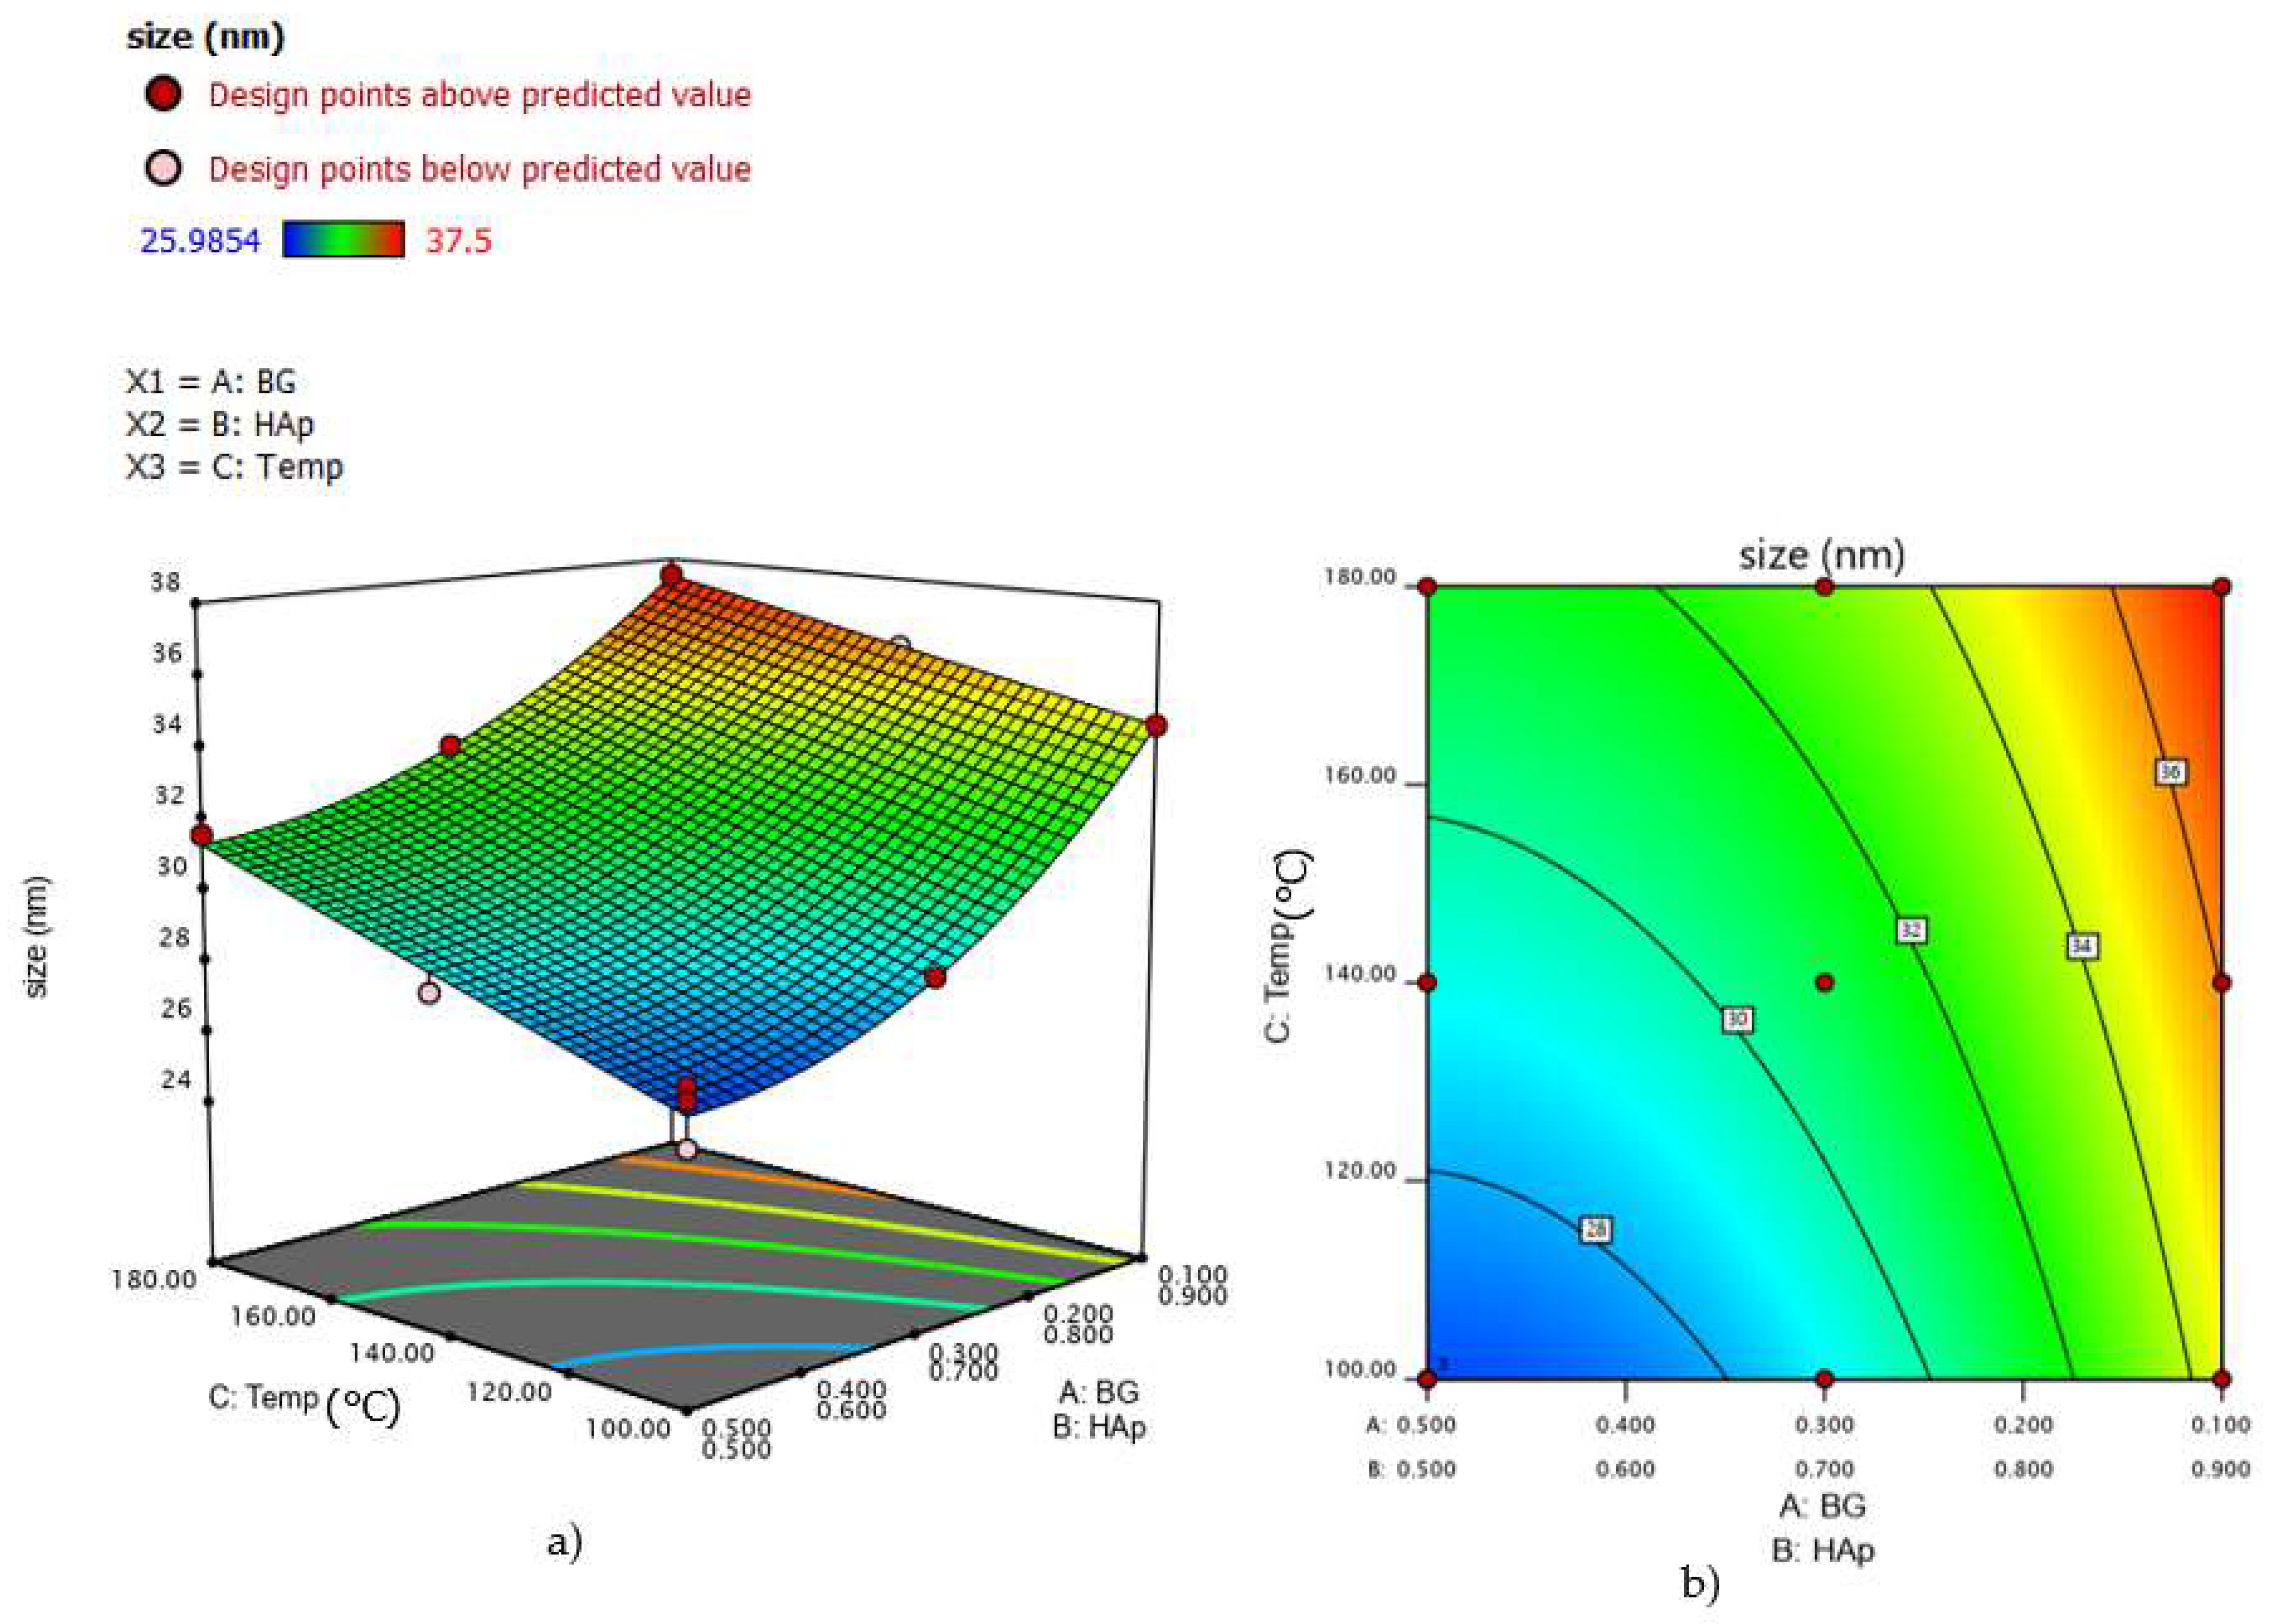
3.5. Analysis of Variance for HAp Crystal Size in HAp/BG Composite Nanopowder
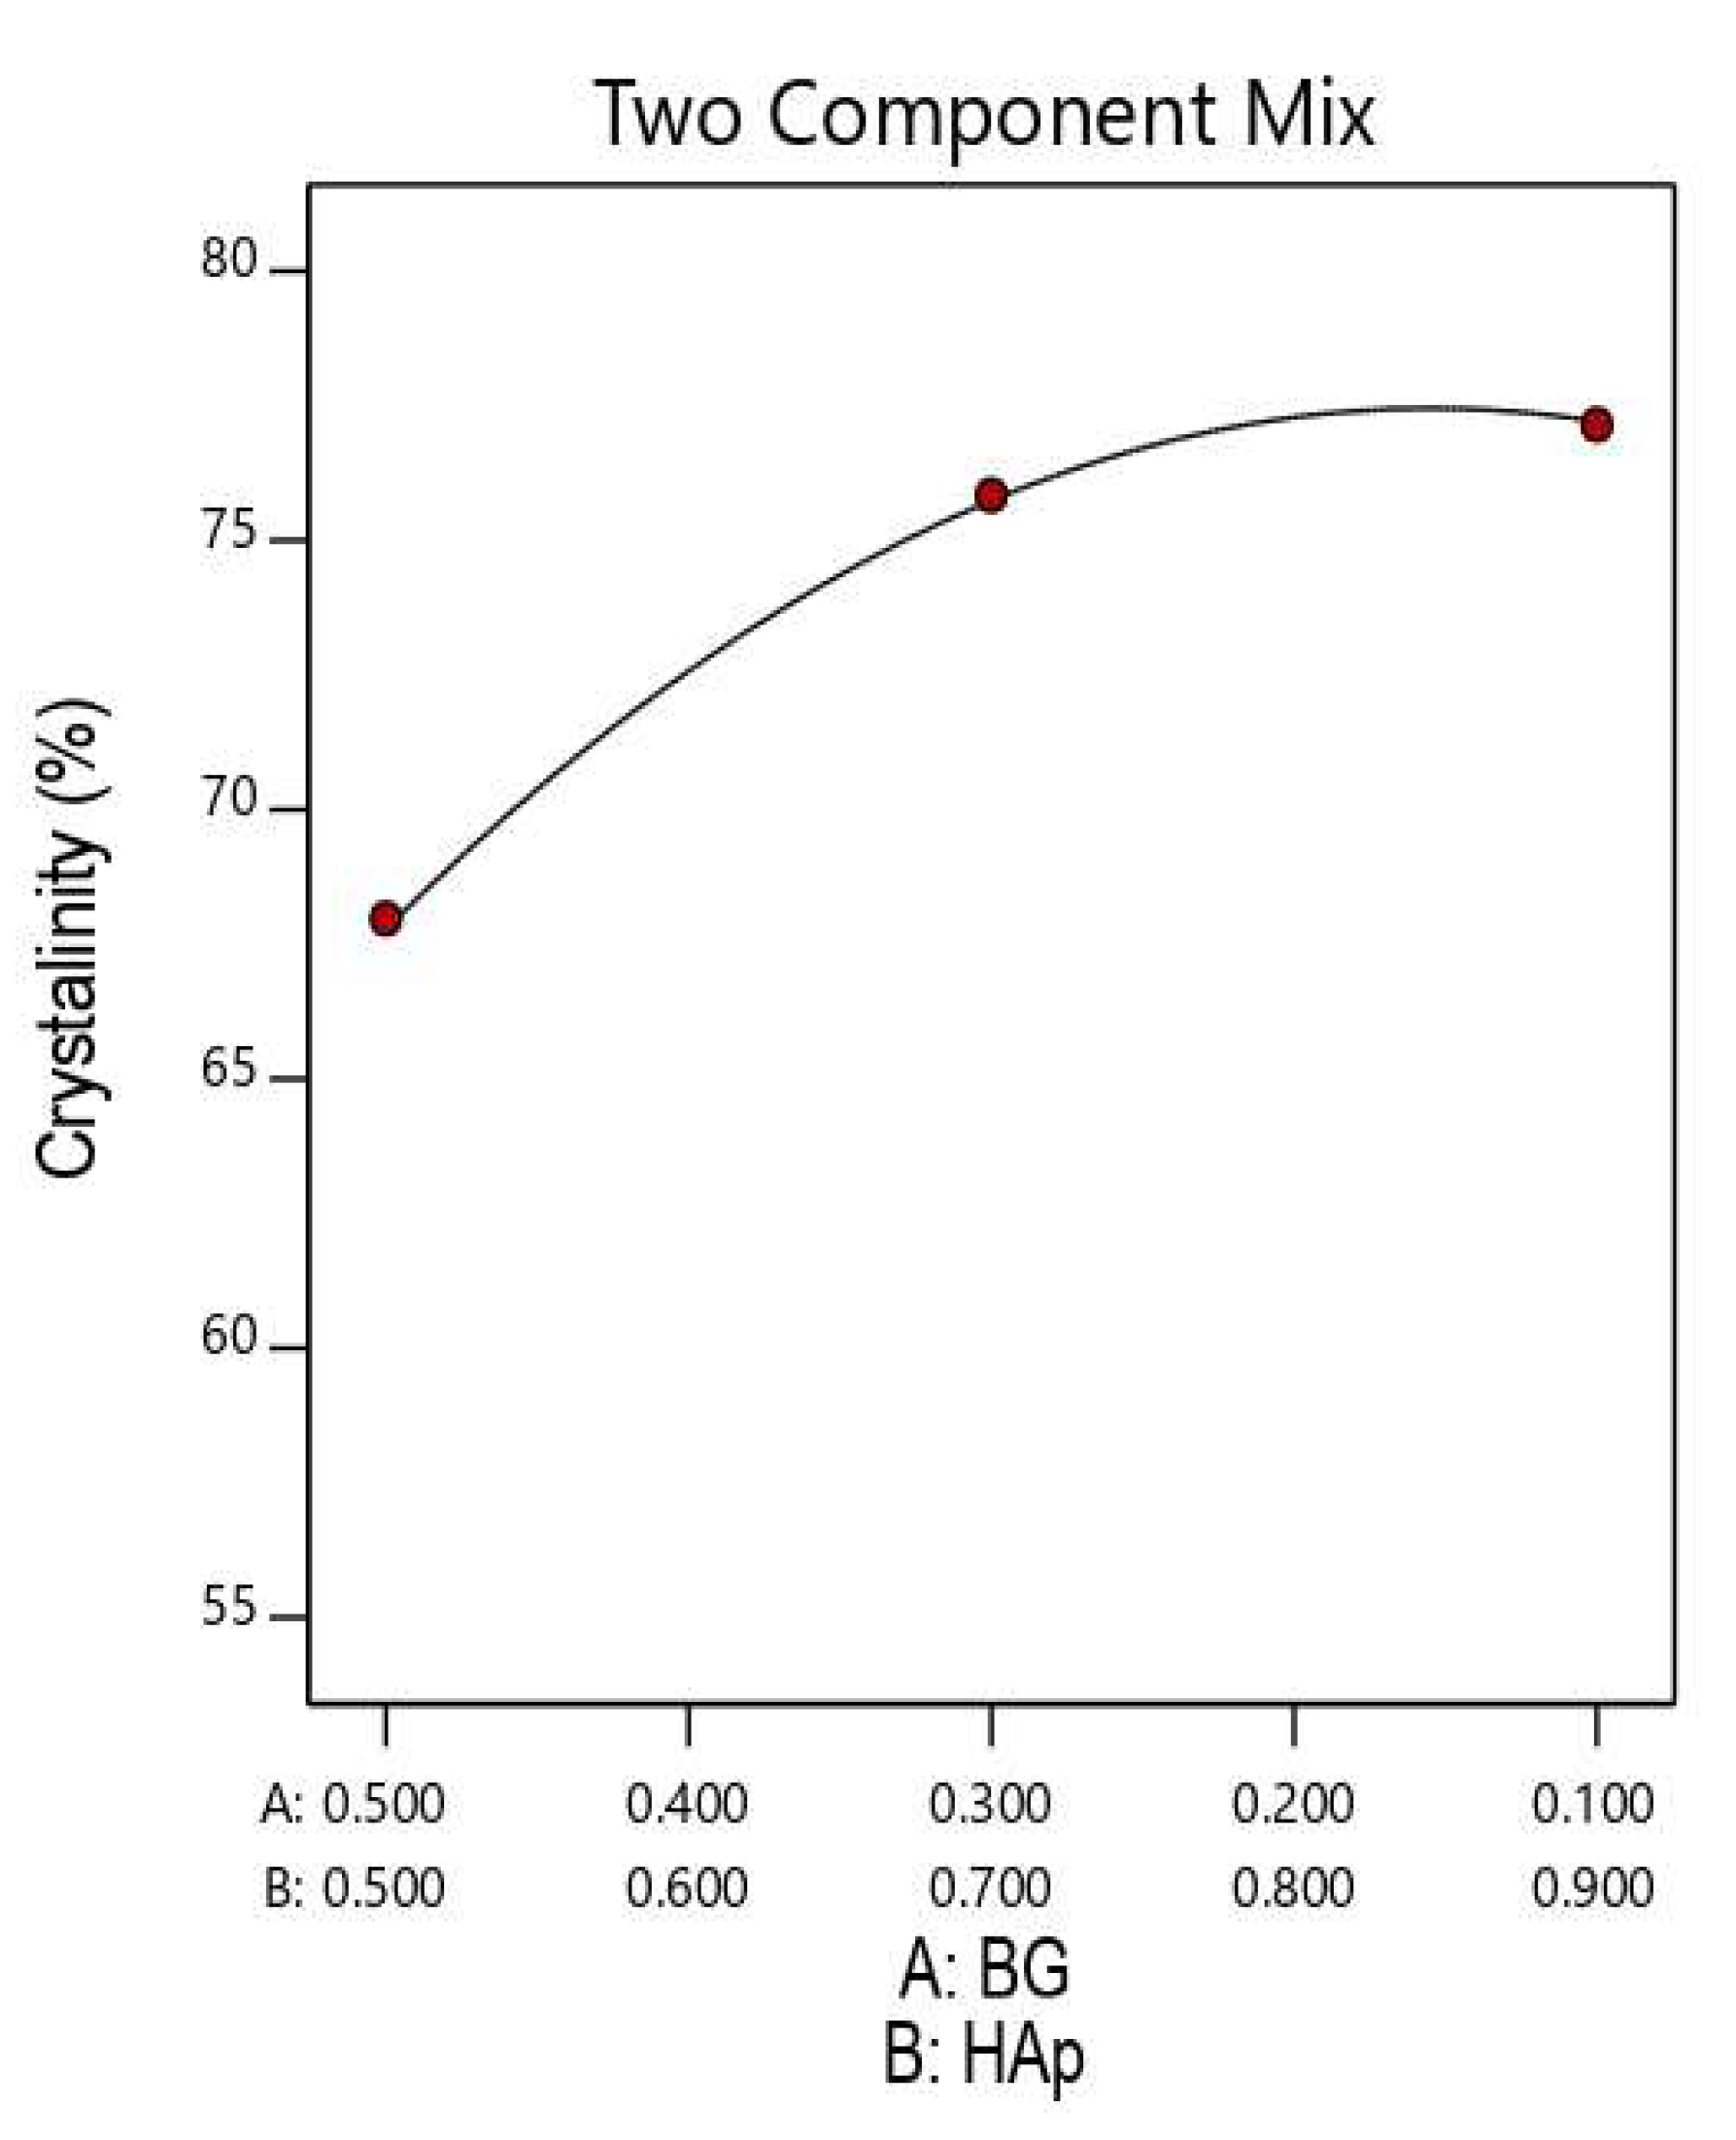
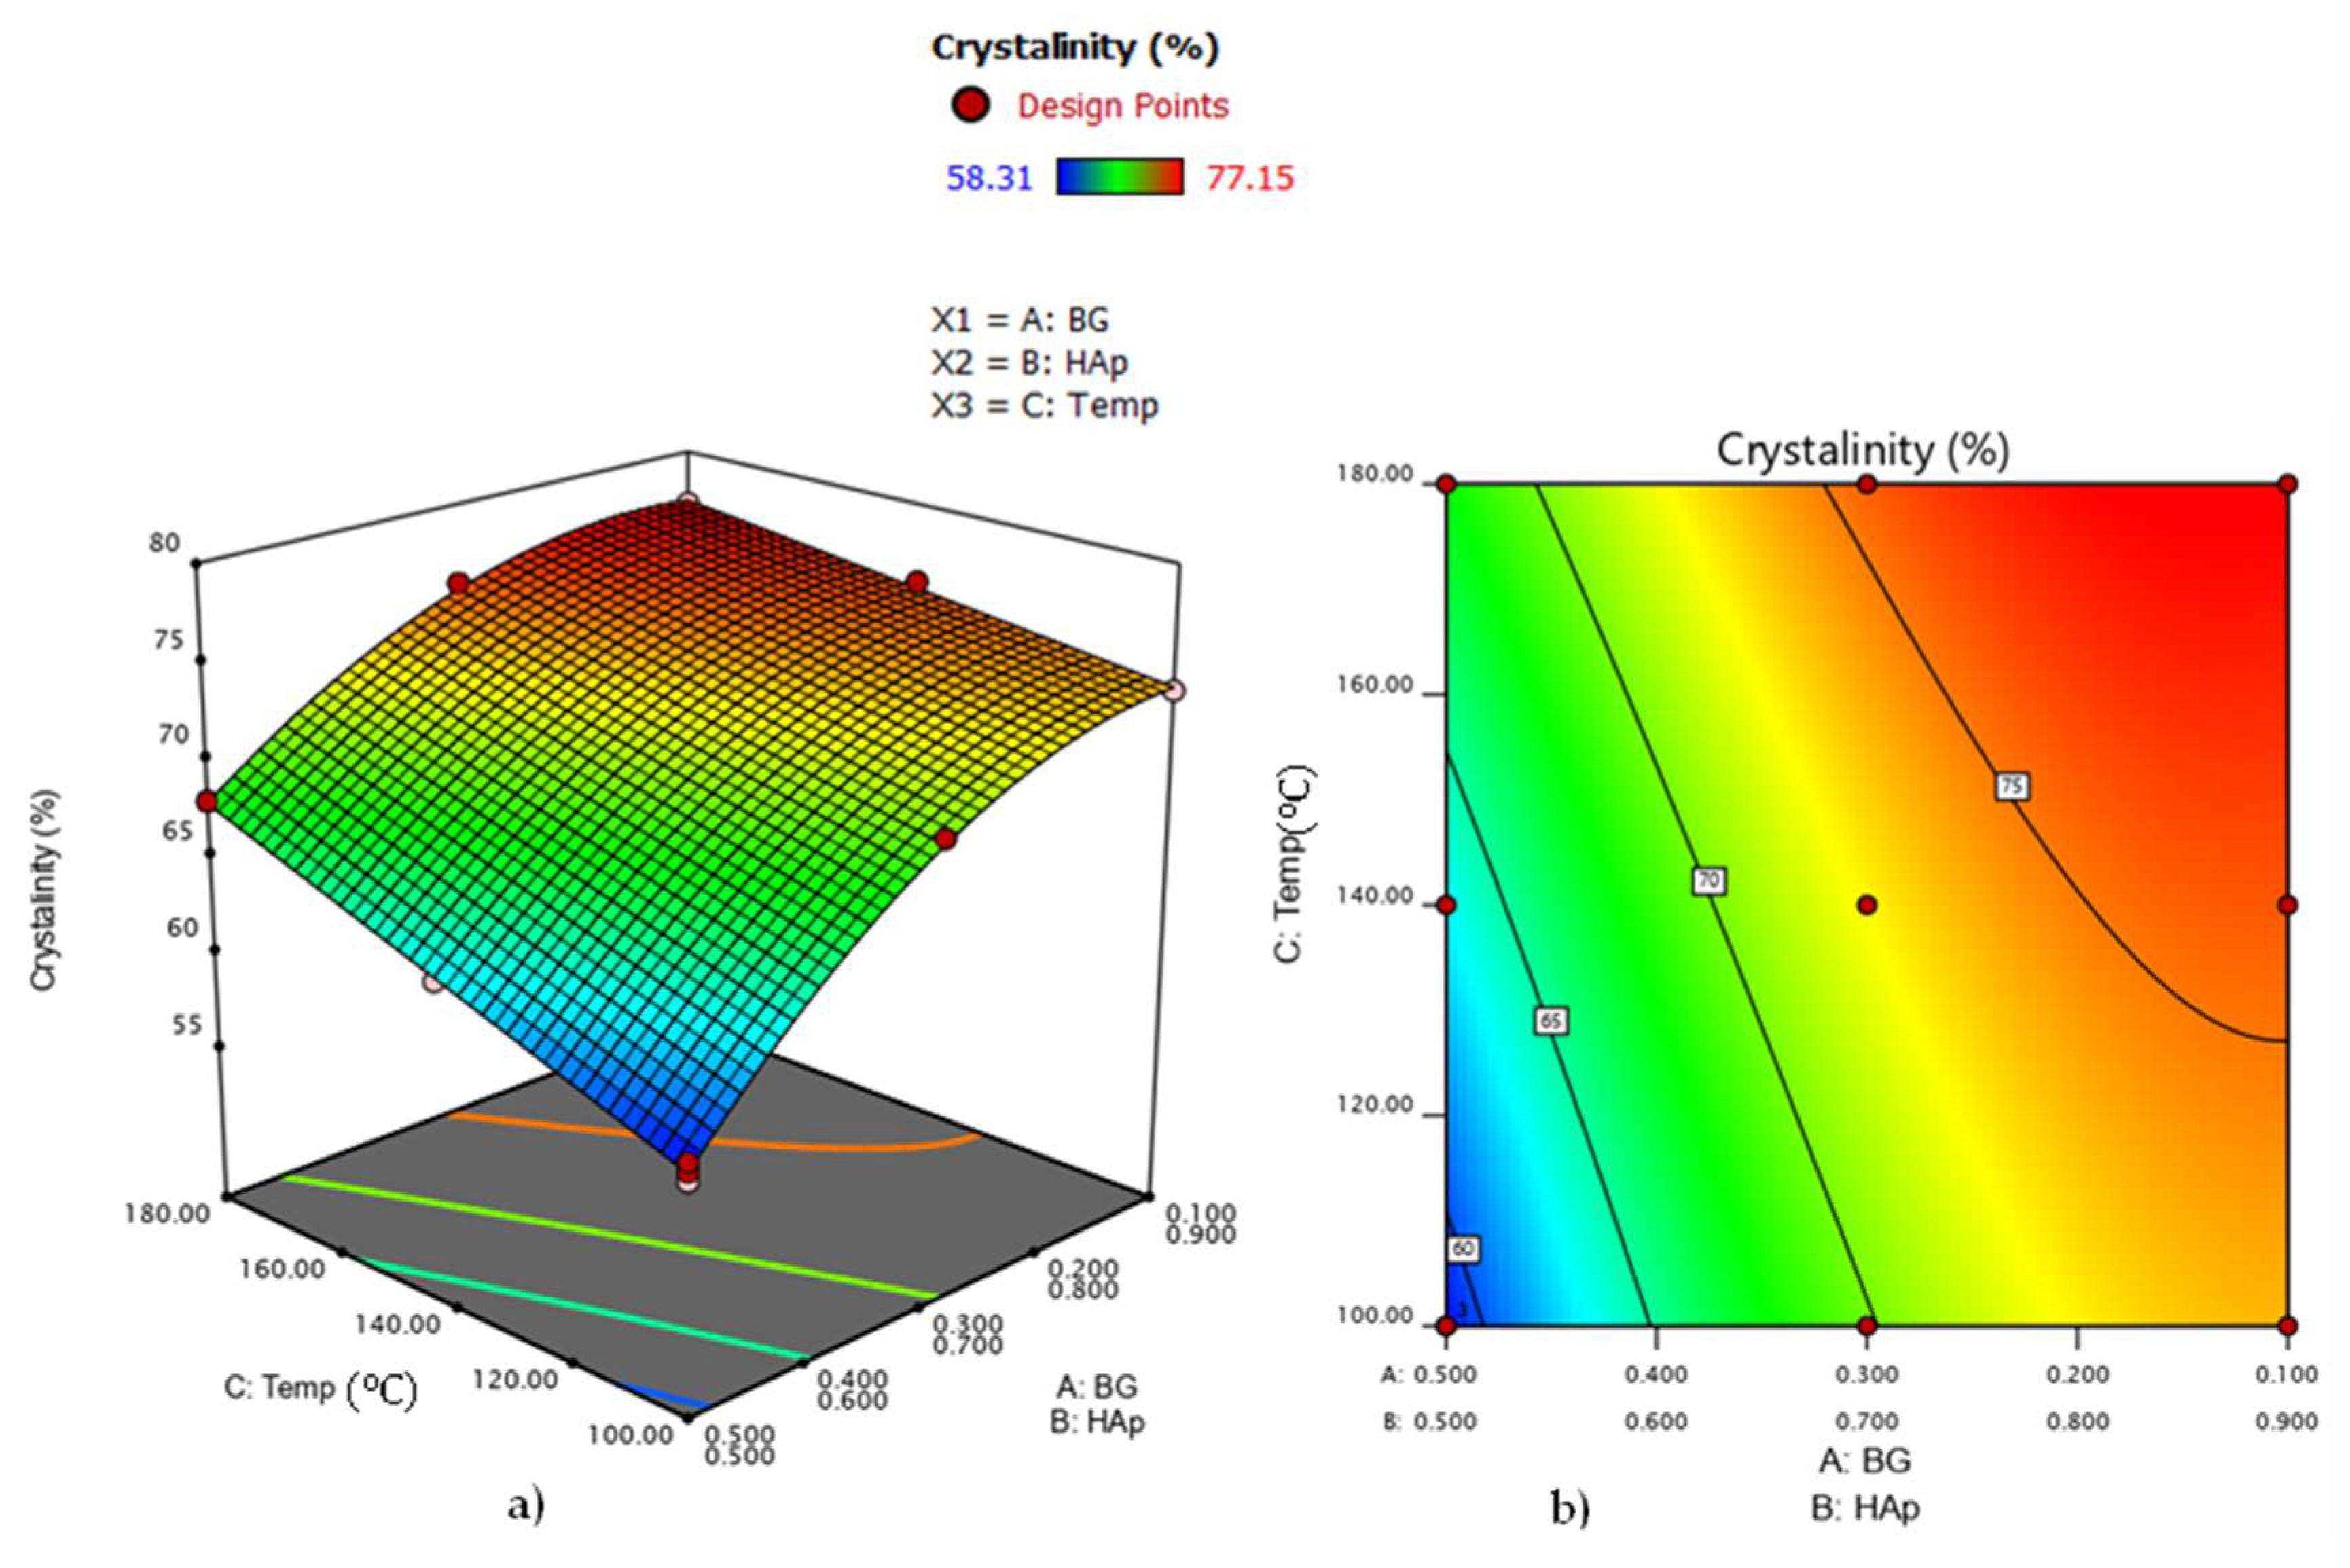
3.6. Analysis of Variance for HAp Crystallinity in HAp/BG Composite Nanopowder
3.7. In Vitro Behavior of Samples in Simulated Body Fluid (SBF)
4. Conclusions
Author Contributions
Funding
Institutional Review Board Statement
Informed Consent Statement
Data Availability Statement
Acknowledgments
Conflicts of Interest
References
- Dorozhkin, S.V. Nanosized and nanocrystalline calcium orthophosphates. Acta Biomater. 2010, 6, 715–734. [Google Scholar] [CrossRef] [PubMed]
- Sadat-Shojai, M. Preparation of hydroxyapatite nanoparticles: Comparison between hydrothermal and solvo-treatment processes and colloidal stability of produced nanoparticles in a dilute experimental dental adhesive. J. Iran. Chem. Soc. 2009, 6, 386–392. [Google Scholar] [CrossRef]
- Wang, C.; Duan, Y.; Markovic, B.; Barbara, J.; Howlett, C.R.; Zhang, X.; Zreiqat, H. Phenotypic expression of bone-related genes in osteoblasts grown on calcium phosphate ceramics with different phase compositions. Biomaterials 2004, 25, 2507–2514. [Google Scholar] [CrossRef] [PubMed]
- Saeri, M.; Afshar, A.; Ghorbani, M.; Ehsani, N.; Sorrell, C.C. The wet precipitation process of hydroxyapatite. Mater. Lett. 2003, 57, 4064–4069. [Google Scholar] [CrossRef]
- Yuncao, L.; Bozhang, C.; Hung, J. Synthesis of HP nanoparticles in ultrasonic precipitation. Ceram. Intern. 2005, 31, 1041–1044. [Google Scholar]
- Furko, M.; Balázsi, K.; Balázsi, C. Comparative study on preparation and characterization of bioactive coatings for biomedical applications—A review on recent patents and literature. Rev. Adv. Mater. Sci. 2017, 48, 25–51. [Google Scholar]
- Sadat-Shojai, M.; Khorasani, M.T.; Dinpanah-Khoshdargi, E.; Jamshidi, A. Synthesis methods for nanosized hydroxyapatite with diverse structures. Acta Biomater. 2013, 9, 7591–7621. [Google Scholar] [CrossRef]
- Cai, Y.; Liu, Y.; Yan, W.; Hu, Q.; Tao, J.; Zhang, M.; Shi, Z.; Tang, R. Role of hydroxyapatite nanoparticle size in bone cell proliferation. J. Mater. Chem. 2007, 17, 3780–3787. [Google Scholar] [CrossRef]
- Hu, Q.; Tan, Z.; Liu, Y.; Tao, J.; Cai, Y.; Zhang, M.; Pan, H.; Xu, X.; Tang, R. Effect of crystallinity of calcium phosphate nanoparticles on adhesion, proliferation, and differentiation of bone marrow mesenchymal stem cells. J. Mater. Chem. 2007, 17, 4690–4698. [Google Scholar] [CrossRef]
- Karadjian, M.; Essers, C.; Tsitlakidis, S.; Reible, B.; Moghaddam, A.; Boccaccini, A.R.; Westhauser, F. Biological properties of calcium phosphate bioactive glass composite bone substitutes: Current experimental evidence. Int. J. Mol. Sci. 2019, 20, 305. [Google Scholar] [CrossRef] [Green Version]
- Padilla, S.; Roman, J.; Sánchez-Salcedo, S.; Vallet-Regi, M. Hydroxyapatite/SiO2–CaO–P2O5 glass materials: In vitro bioactivity and biocompatibility. Acta Biomater. 2006, 2, 331–342. [Google Scholar] [CrossRef] [PubMed]
- Boccaccini, A.R.; Ma, P.X.; Liverani, L. Tissue Engineering Using Ceramics and Polymers; Woodhead Publishing: Sawston, UK, 2021. [Google Scholar]
- Hench, L.L. The story of Bioglass®. J. Mater. Sci. Mater. Med. 2006, 17, 967–978. [Google Scholar] [CrossRef] [PubMed]
- Valerio, P.; Pereira, M.; Goes, A.M.; Leite, M. The effect of ionic products from bioactive glass dissolution on osteoblast proliferation and collagen production. Biomaterials 2004, 25, 2941–2948. [Google Scholar] [CrossRef] [PubMed]
- Nwabueze, T.U. Basic steps in adapting response surface methodology as mathematical modelling for bioprocess optimisation in the food systems. Int. J. Food Sci. Technol. 2010, 45, 1768–1776. [Google Scholar] [CrossRef]
- Ebrahimi, S.; Nasri, C.S.S.M.; Bin Arshad, S.E. Hydrothermal synthesis of hydroxyapatite powders using Response Surface Methodology (RSM). PLoS ONE 2021, 16, e0251009. [Google Scholar] [CrossRef]
- Ebrahimi, S.; Hanim, Y.U.; Sipaut, C.S.; Jan, N.B.A.; Arshad, S.E.; How, S.E. Fabrication of Hydroxyapatite with Bioglass Nanocomposite for Human Wharton’s-Jelly-Derived Mesenchymal Stem Cell Growing Substrate. Int. J. Mol. Sci. 2021, 22, 9637. [Google Scholar] [CrossRef]
- Ahmed, Y.; El-Sheikh, S.M.; I Zaki, Z. Changes in hydroxyapatite powder properties via heat treatment. Bull. Mater. Sci. 2015, 38, 1807–1819. [Google Scholar] [CrossRef] [Green Version]
- Poinern, G.E.; Brundavanam, R.K.; Mondinos, N.; Jiang, Z.-T. Synthesis and characterisation of nanohydroxyapatite using an ultrasound assisted method. Ultrason. Sonochemistry 2009, 16, 469–474. [Google Scholar] [CrossRef] [Green Version]
- Kotian, R.; Rao, P.P.; Madhyastha, P. X-ray diffraction analysis of hydroxyapatite-coated in different plasma gas atmosphere on Ti and Ti-6Al-4V. Eur. J. Dent. 2017, 11, 438–446. [Google Scholar] [CrossRef] [Green Version]
- Kepa, K.; Coleman, R.; Grøndahl, L. In vitro mineralization of functional polymers. Biosurface Biotribol. 2015, 1, 214–227. [Google Scholar] [CrossRef] [Green Version]
- Kokubo, T.; Ito, S.; Huang, Z.T.; Hayashi, T.; Sakka, S.; Kitsugi, T.; Yamamuro, T. Ca, P-rich layer formed on high-strength bioactive glass-ceramic A-W. J. Biomed. Mater. Res. 1990, 24, 331–343. [Google Scholar] [CrossRef] [PubMed]
- Eriksson, L.; Johansson, E.; Wikström, C. Mixture design—design generation, PLS analysis, and model usage. Chemom. Intell. Lab. Syst. 1998, 43, 1–24. [Google Scholar] [CrossRef]
- Niedz, R.P.; Evens, T.J. Design of experiments (DOE)—history, concepts, and relevance to in vitro culture. Vitr. Cell. Dev. Biol. Plant 2016, 52, 547–562. [Google Scholar] [CrossRef]
- Anderson, M.J.; Whitcomb, P.J. Designing experiments that combine mixture components with process factors. Chem. Eng. Prog. 2000, 96, 27–32. [Google Scholar]
- Yadav, S.; Singh, P.; Pyare, R. Synthesis, characterization, mechanical and biological properties of biocomposite based on zirconia containing 1393 bioactive glass with hydroxyapatite. Ceram. Int. 2020, 46, 10442–10451. [Google Scholar] [CrossRef]
- Latifi, S.M.; Fathi, M.; Varshosaz, J.; Ghochaghi, N. Mechanisms controlling ca ion release from sol-gel derived in situ apatite-silica nanocomposite powder. Ceram. Silik. 2015, 59, 64–69. [Google Scholar]
- Ravarian, R.; Moztarzadeh, F.; Hashjin, M.S.; Rabiee, S.; Khoshakhlagh, P.; Tahriri, M. Synthesis, characterization and bioactivity investigation of bioglass/hydroxyapatite composite. Ceram. Int. 2010, 36, 291–297. [Google Scholar] [CrossRef]
- Bellucci, D.; Desogus, L.; Montinaro, S.; Orrù, R.; Cao, G.; Cannillo, V. Innovative hydroxyapatite/bioactive glass composites processed by spark plasma sintering for bone tissue repair. J. Eur. Ceram. Soc. 2017, 37, 1723–1733. [Google Scholar] [CrossRef] [Green Version]
- Bellucci, D.; Sola, A.; Anesi, A.; Salvatori, R.; Chiarini, L.; Cannillo, V. Bioactive glass/hydroxyapatite composites: Mechanical properties and biological evaluation. Mater. Sci. Eng. C 2015, 51, 196–205. [Google Scholar] [CrossRef]
- Ashuri, M.; Moztarzadeh, F.; Nezafati, N.; Ansari Hamedani, A.; Tahriri, M.R. Synthesis and evaluation of mechanical properties of hydroxyapatite/sol-gel derived bioactive glass particles composites. J. Adv. Mater. Eng. 2012, 31, 57–72. [Google Scholar]
- Zarifah, N.A.; Matori, K.A.; Sidek, H.A.A.; Wahab, Z.A.; Salleh, M.A.M.; Zainuddin, N.; Khiri, M.Z.A.; Farhana, N.S.; Omar, N.A.S. Effect of hydroxyapatite reinforced with 45S5 glass on physical, structural and mechanical properties. Procedia Chemistry. 2016, 19, 30–37. [Google Scholar] [CrossRef] [Green Version]
- Kapoor, S.; Batra, U. Preparation and bioactivity evaluation of bone like hydroxyapatite-bioglass composite. Int. J. Chem. Biol. Eng. 2010, 3, 24–28. [Google Scholar]
- Tang, X.L.; Xiao, X.F.; Liu, R.F. Structural characterization of silicon-substituted hydroxyapatite synthesized by a hydrothermal method. Mater. Lett. 2005, 59, 3841–3846. [Google Scholar] [CrossRef]
- Fathi, M.; Mohammadi, A.D. Preparation and characterization of sol–gel bioactive glass coating for improvement of biocompatibility of human body implant. Mater. Sci. Eng. A 2008, 474, 128–133. [Google Scholar] [CrossRef]
- Taherian, M.; Rojaee, R.; Fathi, M.; Tamizifar, M. Effect of different sol-gel synthesis processes on microstructural and morphological characteristics of hydroxyapatite-bioactive glass composite nanopowders. J. Adv. Ceram. 2014, 3, 207–214. [Google Scholar] [CrossRef] [Green Version]
- Aminian, A.; Solati-Hashjin, M.; Samadikuchaksaraei, A.; Bakhshi, F.; Gorjipour, F.; Farzadi, A.; Moztarzadeh, F.; Schmücker, M. Synthesis of silicon-substituted hydroxyapatite by a hydrothermal method with two different phosphorous sources. Ceram. Int. 2011, 37, 1219–1229. [Google Scholar] [CrossRef]
- Liang, W.; Niu, Y.; Ge, S.; Song, S.; Su, J.; Luo, Z. Effects of hydrothermal treatment on the properties of nanoapatite crystals. Int. J. Nanomed. 2012, 7, 5151. [Google Scholar]
- Nagata, F.; Yamauchi, Y.; Tomita, M.; Kato, K. Hydrothermal synthesis of hydroxyapatite nanoparticles and their protein adsorption behavior. J. Ceram. Soc. Jpn. 2013, 121, 797–801. [Google Scholar] [CrossRef] [Green Version]
- Bui, V.X.; Vo, M.Q.; Nguyen, T.A.; Bui, H.T. Investigation of Bioactive Glass-Ceramic 60SiO2-30CaO-10P2O5 Prepared by Hydrothermal Method. Adv. Mater. Sci. Eng. 2019, 2019, 1528326. [Google Scholar]
- Mondal, S.; Hoang, G.; Manivasagan, P.; Moorthy, M.S.; Nguyen, T.P.; Phan, T.T.V.; Kim, H.H.; Kim, M.H.; Nam, S.Y.; Oh, J. Nano-hydroxyapatite bioactive glass composite scaffold with enhanced mechanical and biological performance for tissue engineering application. Ceram. Int. 2018, 44, 15735–15746. [Google Scholar] [CrossRef]
- Gibson, I.; Best, S.; Bonfield, W. Chemical characterization of silicon-substituted hydroxyapatite. Journal of Biomedical Materials Research: An Official Journal of The Society for Biomaterials. Jpn. Soc. Biomater. Aust. Soc. Biomater. 1999, 44, 422–428. [Google Scholar]
- El Yacoubi, A.; Massit, A.; Fathi, M.; EL Idrissi, B.C.; Yamni, K. Characterization of silicon-substituted hydroxyapatite powders synthesized by a wet precipitation method. IOSR J. Appl. Chem. 2014, 7, 24–29. [Google Scholar]
- Taheriana, M.; Tamizifara, M.; Fathib, M.; Maleki Ghalehc, H. Modified sol-gel method for synthesis of hydroxyapatite-bioglass nanocomposite. In Proceedings of the 4th International Conference on Nanostructures (ICNS4), Institute for Nanoscience & Nanotechnology (INST), Sharif University of Technology, Tehran, Iran, 12–14 March 2012. [Google Scholar]
- Sebdani, M.M.; Fathi, M. Preparation and characterization of hydroxyapatite–forsterite–bioactive glass nanocomposite coatings for biomedical applications. Ceram. Int. 2012, 38, 1325–1330. [Google Scholar] [CrossRef]
- Bang, L.; Long, B.; Othman, R. Carbonate hydroxyapatite and silicon-substituted carbonate hydroxyapatite: Synthesis, mechanical properties, and solubility evaluations. Sci. World J. 2014, 2014, 969876. [Google Scholar] [CrossRef]
- ChittaranjanDas, V. Response surface methodology and desirability approach to optimize EDM parameters. Int. J. Hybrid Inf. Technol. 2016, 9, 393–406. [Google Scholar]
- Garcia, C.; Ceré, S.; Durán, A. Bioactive coatings prepared by sol–gel on stainless steel 316L. J. Non-Cryst. Solids 2004, 348, 218–224. [Google Scholar] [CrossRef]
- Kim, S.; Lee, J.H.; Kim, Y.T.; Riu, D.H.; Jung, S.J.; Lee, Y.J.; Chung, S.C.; Kim, Y.H. Synthesis of Si, Mg substituted hydroxyapatites and their sintering behaviors. Biomaterials 2003, 24, 1389–1398. [Google Scholar] [CrossRef]
- Botelho, C.; Lopes, M.A.; Gibson, I.R.; Best, S.M.; Santos, J.D. Structural analysis of Si-substituted hydroxyapatite: Zeta potential and X-ray photoelectron spectroscopy. J. Mater. Sci. Mater. Med. 2002, 13, 1123–1127. [Google Scholar] [CrossRef]


| Component | Name | Low | High |
|---|---|---|---|
| A | BG * | 10 | 50 |
| B | HAp | 50 | 90 |
| Factor | Name | Level 1 | Level 2 |
|---|---|---|---|
| C | Temperature | 100 | 180 |
| Run | Component 1 A: BG | Component 2 B: HAp | Factor C: Temp |
|---|---|---|---|
| 1 | 10 | 90 | 140 |
| 2 | 50 | 50 | 100 |
| 3 | 50 | 50 | 180 |
| 4 | 30 | 70 | 140 |
| 5 | 50 | 50 | 100 |
| 6 | 50 | 50 | 140 |
| 7 | 50 | 50 | 100 |
| 8 | 10 | 90 | 100 |
| 9 | 30 | 70 | 100 |
| 10 | 30 | 70 | 180 |
| 11 | 10 | 90 | 180 |
| Samples | Component 1 | Component 2 | Process Factor | Responses | |
|---|---|---|---|---|---|
| A: BG | B: HAp | Temperature | Crystallinity | Crystal Size | |
| wt % | wt % | °C | % | nm | |
| 1 | 10 | 90 | 180 °C | 77.15 | 37.5 |
| 2 | 30 | 70 | 180 °C | 75.84 | 33.12 |
| 3 | 50 | 50 | 180 °C | 67.98 | 31.58 |
| 4 | 10 | 90 | 140 °C | 75.91 | 36.02 |
| 5 | 30 | 70 | 140 °C | 72.02 | 30.87 |
| 6 | 50 | 50 | 140 °C | 63.11 | 28.50 |
| 7 | 10 | 90 | 100 °C | 73.46 | 34.58 |
| 8 | 30 | 70 | 100 °C | 70.14 | 28.87 |
| 9 | 50 | 50 | 100 °C | 58.31 | 27.2 |
| - | Component 1 | Component 2 | Responses |
|---|---|---|---|
| Samples | A: BG | B: HAp | Ca/P |
| wt % | wt % | % | |
| 1 | 10 | 90 | 1.69 |
| 2 | 30 | 70 | 1.71 |
| 3 | 50 | 50 | 1.87 |
| - | Component 1 | Component 2 | Factor 3 | Response 1 | Response 2 | ||
|---|---|---|---|---|---|---|---|
| Run | A:BG | B: HAp | C: Temp | Crystal Size (nm) | Crystallinity (%) | ||
| Actual | Predicted | Actual | Predicted | ||||
| 1 | 10 | 90 | 140.00 | 36.02 | 36.03 | 75.91 | 75.57 |
| 2 | 50 | 50 | 100.00 | 27.2 | 26.82 | 58.31 | 58.73 |
| 3 | 50 | 50 | 180.00 | 31.58 | 31.30 | 67.98 | 67.88 |
| 4 | 30 | 70 | 140.00 | 30.8759 | 30.96 | 72.02 | 72.67 |
| 5 | 50 | 50 | 100.00 | 25.9854 | 26.82 | 59.24 | 58.73 |
| 6 | 50 | 50 | 140.00 | 28.501 | 29.06 | 63.11 | 63.31 |
| 7 | 50 | 50 | 100.00 | 27.5647 | 26.82 | 58.75 | 58.73 |
| 8 | 10 | 90 | 100.00 | 34.58 | 34.57 | 73.64 | 73.81 |
| 9 | 30 | 70 | 100.00 | 28.8754 | 28.84 | 70.14 | 69.82 |
| 10 | 30 | 70 | 180.00 | 33.1183 | 33.08 | 75.84 | 75.52 |
| 11 | 10 | 90 | 180.00 | 37.5 | 37.49 | 77.15 | 77.32 |
| Source | Sum of Squares | df | Mean Square | F-Value | p-Value | |
|---|---|---|---|---|---|---|
| Model | 145.40 | 5 | 29.08 | 80.94 | < 0.0001 | significant |
| Linear Mixture | 113.30 | 1 | 113.30 | 315.36 | < 0.0001 | - |
| AB | 5.28 | 1 | 5.28 | 14.70 | 0.00122 | - |
| AC | 4.26 | 1 | 4.26 | 11.87 | 0.00183 | - |
| BC | 16.03 | 1 | 16.03 | 44.62 | 0.0011 | - |
| ABC | 0.1055 | 1 | 0.1055 | 0.2936 | 0.6112 | - |
| Residual | 1.80 | 5 | 0.3593 | - | - | - |
| Lack of Fit | 0.429 | 3 | 0.143 | 0.209 | 0.8833 | not significant |
| Pure Error | 1.37 | 2 | 0.6837 | - | - | - |
| Cor Total | 147.19 | 10 | - | - | - | - |
| Source | Sum of Squares | df | Mean Square | F-Value | p-Value | |
| Model | 537.60 | 5 | 107.52 | 417.08 | < 0.0001 | significant |
| Linear Mixture | 411.45 | 1 | 411.45 | 1596.07 | < 0.0001 | - |
| AB | 21.77 | 1 | 21.77 | 84.44 | 0.0003 | - |
| AC | 6.16 | 1 | 6.16 | 23.90 | 0.0045 | - |
| BC | 66.94 | 1 | 66.94 | 259.67 | 0.0001 | - |
| ABC | 0.1406 | 1 | 0.1406 | 0.5452 | 0.4934 | - |
| Residual | 1.29 | 5 | 0.2578 | - | ||
| Lack of Fit | 0.856 | 3 | 0.2854 | 1.32 | 0.4587 | not significant |
| Pure Error | 0.4329 | 2 | 0.2164 | - | - | - |
| Cor Total | 538.89 | 10 | - | - | - | - |
Publisher’s Note: MDPI stays neutral with regard to jurisdictional claims in published maps and institutional affiliations. |
© 2022 by the authors. Licensee MDPI, Basel, Switzerland. This article is an open access article distributed under the terms and conditions of the Creative Commons Attribution (CC BY) license (https://creativecommons.org/licenses/by/4.0/).
Share and Cite
Ebrahimi, S.; Sipaut, C.S. Synthesis of Hydroxyapatite/Bioglass Composite Nanopowder Using Design of Experiments. Nanomaterials 2022, 12, 2264. https://doi.org/10.3390/nano12132264
Ebrahimi S, Sipaut CS. Synthesis of Hydroxyapatite/Bioglass Composite Nanopowder Using Design of Experiments. Nanomaterials. 2022; 12(13):2264. https://doi.org/10.3390/nano12132264
Chicago/Turabian StyleEbrahimi, Shamsi, and Coswald Stephen Sipaut. 2022. "Synthesis of Hydroxyapatite/Bioglass Composite Nanopowder Using Design of Experiments" Nanomaterials 12, no. 13: 2264. https://doi.org/10.3390/nano12132264
APA StyleEbrahimi, S., & Sipaut, C. S. (2022). Synthesis of Hydroxyapatite/Bioglass Composite Nanopowder Using Design of Experiments. Nanomaterials, 12(13), 2264. https://doi.org/10.3390/nano12132264