Article

Fabrication of an Efficient N, S Co-Doped WO3 Operated in Wide-Range of Visible-Light for Photoelectrochemical Water Oxidation

1
School of Material Science and Engineering, North Minzu University, Yinchuan 750021, China
2
Chemical Science and Engineering College, North Minzu University, Yinchuan 750021, China
3
International Scientific & Technological Cooperation Base of Industrial Waste Recycling and Advanced Materials, Yinchuan 750021, China
*
Authors to whom correspondence should be addressed.
Nanomaterials 2022, 12(12), 2079; https://doi.org/10.3390/nano12122079
Submission received: 18 May 2022 / Revised: 10 June 2022 / Accepted: 10 June 2022 / Published: 16 June 2022
(This article belongs to the Special Issue Advanced Functional Nanocomposites for Water Purification)

Abstract

:
In this work, a highly efficient wide-visible-light-driven photoanode, namely, nitrogen and sulfur co-doped tungsten trioxide (S-N-WO3), was synthesized using tungstic acid (H2WO4) as W source and ammonium sulfide ((NH4)2S), which functioned simultaneously as a sulfur source and as a nitrogen source for the co-doping of nitrogen and sulfur. The EDS and XPS results indicated that the controllable formation of either N-doped WO3 (N-WO3) or S-N-WO3 by changing the nW:n(NH4)2S ratio below or above 1:5. Both N and S contents increased when increasing the nW:n(NH4)2S ratio from 1:0 to 1:15 and thereafter decreased up to 1:25. The UV-visible diffuse reflectance spectra (DRS) of S-N-WO3 exhibited a significant redshift of the absorption edge with new shoulders appearing at 470–650 nm, which became more intense as the nW:n(NH4)2S ratio increased from 1:5 and then decreased up to 1:25, with the maximum at 1:15. The values of nW:n(NH4)2S ratio dependence is consistent with the cases of the S and N contents. This suggests that S and N co-doped into the WO3 lattice are responsible for the considerable redshift in the absorption edge, with a new shoulder appearing at 470–650 nm owing to the intrabandgap formation above the valence band (VB) edge and a dopant energy level below the conduction band (CB) of WO3. Therefore, benefiting from the S and N co-doping, the S-N-WO3 photoanode generated a photoanodic current under visible light irradiation below 580 nm due to the photoelectrochemical (PEC) water oxidation, compared with pure WO3 doing so below 470 nm.

1. Introduction

The development and utilization of hydrogen energy is considered to be one of the significant ways to resolve the energy crisis and environmental pollution [1,2,3].
At present, there are many strategies to produce hydrogen by solar energy, including electrolytic and solar thermal water splitting, PEC water splitting, and so on [4]. Among them, PEC water splitting could directly convert abundant solar energy into clean hydrogen energy. Therefore, it is regarded as one of promising ways and has attracted considerable attention since the TiO2 photoanode was first reported by Honda and Fujishima [5,6,7,8,9,10]. However, the half-reaction of PEC water oxidation on photoanode is considered to be a key process to affect the efficiency of fuel generation due to the difficult kinetic nature. Moreover, the bandgap of TiO2 is too wide (3.0–3.2 eV) to respond to the visible light of sun spectrum, being consequently responsible for low efficiency in the utilization of solar light. So, it is of great importance to develop a stable and robust semiconductor photoanode with narrow bandgaps to enhance the absorption of solar light.
So far, intensive research has focused on the development of efficient semiconductor photoanodes, such as WO3 [8,11,12,13,14,15], α-Fe2O3 [9,16,17,18,19], ZnO [20,21], Cu2O [22,23], and Ta3N5 [24,25,26] for PEC water oxidation.
Since WO3 was reported as a PEC photoanode by Hodes in 1976 [27], it has attracted immense attention because of its visible light response (bandgap, Eg = 2.6–2.8 eV), strong absorption within the solar spectrum and good photochemical stability under acidic conditions. However, as the WO3 photoanode cannot respond to visible light above 460 nm, its solar spectrum utilization is still low. Taking this disadvantage into account, enhancing the light absorption at longer wavelengths is the key to improving the solar energy conversion efficiency of the WO3 photoanode. Therefore, extension of light absorption to longer wavelengths by bandgap engineering of WO3 is an important and interesting research subject in the related field.
Doping WO3 with transition metals (Ti, Fe, Co, Ni, Cu, Zn) [28,29] and other metals (Mo, Dy, Te, Ta, V, Yb, Ce) [30,31,32,33,34,35,36] was reported to improve not only the light absorption at longer wavelengths but also the PEC performance. Unfortunately, the PEC performance of WO3 photoanodes doping with metallic dopants decreases with increasing doping concentration and can be even lower than pure WO3 owning to recombination center generation.
In recent years, the research mostly focused on single doping WO3 with selective nonmetallic elements (C, N, S) [37,38,39,40], as well as molecules (N2, Xe and CO) [41,42,43] to enhance the light absorption. However, attention has scarcely been focused on the multielement co-doped WO3 yet so far. We noted that co-doped with two or more nonmetallic elements was widely reported in TiO2 systems [44,45,46,47,48,49,50], where the photocatalytic activities of TiO2 were further improved compared to single doping due to their excellent visible light photocatalysis caused by the narrowed bandgap. This indicated that nonmetallic element co-doped TiO2 could enhance the visible light, but also reduce the recombination rate of photo-induced electron-hole pairs. WO3 exhibits property similar to that of TiO2 because the VB of WO3 and TiO2 are mainly composed of O 2p orbitals. It is confirmed that the effective nonmetallic doping induces hybridization of the outer orbitals of the doped elements and the VB of TiO2 to form a new energy level at the top of the VB and reduce the bandgap of TiO2. This suggests that co-doping of WO3 with two or more nonmetallic elements is a promising route to improve the absorption efficiency of WO3.
Herein, we reported the first simultaneous synthesis of S-N-WO3 using (NH4)2S as N and S atom source. In this strategy, S-N-WO3 exhibited a narrower energy bandgap compared with the pure one. It is attributed to the delocalization of the N 2p orbit with the O 2p orbit after doping of N. Furthermore, S-N-WO3 extended its optical response range to longer wavelength visible light because of the fact that 3s (S6+) orbitals can be delocalized with W 5d and O 2p orbitals to form a new intermediate level above the VB top. Therefore, the absorption threshold of S-N-WO3 can be lowered by co-doping with the S and N elements. Based on this transition, the performance of S-N-WO3 for PEC water oxidation is superior to that of pure WO3.

2. Materials and Methods

2.1. Materials

Tungstic acid (H2WO4), Marpolose (60MP-50), and Polyethylene glycol (PEG, molecular weight = 2000) were purchased from Aladdin’s Reagent (Shanghai Aladdin Bio-Chem Technology Co., Ltd, Shanghai, China) and (NH4)2S was purchased from Macklin Reagent (Shanghai Macklin Biochemical Co.,Ltd., Shanghai, China). A Fluorine-doped tin oxide (FTO)-coated glass substrate was obtained from Dalian HeptaChroma Co., Ltd. (Dalian, China); Millipore water (DIRECT-Q 3UV, Merck Ltd., Shanghai, China) was used for all the experiments. All other chemicals were of analytical grade, and they were used as received, unless mentioned otherwise.

2.2. Synthesis of S-N-WO3

A total of 1.36 mL (NH4)2S (20.0 mmol) were drop by drop added to 1.0 g H2WO4 (4.0 mmol) under vigorous stirring at room temperature to form blue solution with molar ratio (nW:n(NH4)2S) of H2WO4 and (NH4)2S of 1:5–25. After continuous stirring for 15 min, the solvent was slowly evaporated to yield a (NH4)2S-derived precursor. The (NH4)2S-derived precursor powders were calcined at 450 °C (1 °C min−1) for 1.5 h in flowing O2 to obtain different WO3 samples, which are denoted as WO3–5, WO3–10, WO3–15, WO3–20, and WO3–25, respectively. A pure WO3 sample denoted as WO3–0 was prepared in the same manner without addition of (NH4)2S.

2.3. Fabrication of Electrodes

In a typical procedure, an (NH4)2S-derived precursor powder (800 mg), PEG (400 mg), and Marpolose (80 mg) were mixed in water (0.6 mL) under slow stirring for 4 h to form a smooth paste without bubbles. The resulting paste was squeezed on a clean FTO glass substrate by a doctor-blade coater and dried at 80 °C for 15 min. After repeating the procedure two times, the electrodes were calcined at 450 °C in O2 flow for 1.5 h to give different WO3 electrodes. The pure WO3 electrode was fabricated by the same method using a precursor prepared without addition of (NH4)2S.

2.4. Measurement

Powder X-ray diffraction (XRD) were measured by a Shimadzu XRD-6000 diffractometer (Shimadzu International Trade (Shanghai) Co., Ltd., Shanghai, China) using monochromated Cu Kα (λ = 1.54 Å) radiation. The energy-dispersive X-ray spectroscopic (EDS) data were taken using an electron probe microanalysis (JED-2300, JEOL, Tokyo, Japan) operated at an accelerating voltage of 10 kV. Raman spectra were taken using a Raman microspectroscopic apparatus (Horiba-Jobin-Yvon LabRAM HR, Paris, France). The XPS spectra were recorded using a Thermo Fisher Scientific ESCALAB Xi+ instrument (Thermo Fisher Scientific (China) Co., Ltd., Shanghai, China) and calibrated in reference to C 1 s peak fixed at 284.2 eV. UV-visible diffuse reflectance spectra (DRS) were recorded on a spectrophotometer (Shimadzu UV-2700, Shimadzu International Trade (Shanghai) Co., Ltd., Shanghai, China).
All PEC measurements were examined in a two-compartment PEC cell separated by a Nafion membrane using an electrochemical analyzer (Shanghai Chenhua Instrument Co., Ltd., Shanghai, China, CHI660E). A three-electrode system was employed using different WO3 electrodes and Ag/AgCl electrodes in one cell as the working and reference electrodes, respectively, and a Pt wire—in the other cell as the counter electrode. The linear sweep voltammograms (LSV) were measured at a scan rate of 5 mV s−1. Light (λ > 450 nm, 100 mW cm−2) was irradiated from the backside of the working electrode using a 500 W xenon lamp with a UV-cut filter (λ > 450 nm). The output of light intensity was calibrated as 100 mW cm−2 using a spectroradiometer (USR-40, Ushio Shanghai Inc., Shanghai, China). Photoelectrocatalysis was conducted under potentiostatic conditions at 0.5 V at 25 °C with illumination of light (λ > 450 nm, 100 mW cm−2) for 1 h. All the PEC experiments were carried out under argon atmosphere in an aqueous 0.1 M phosphate buffer solution (pH 6.0). The amounts of H2 and O2 evolved were determined from the analysis of the gas phase of counter and working electrode compartments, respectively, using gas chromatography (Shimadzu GC-8A with a TCD detector and molecular sieve 5 A column and Ar carrier gas). A monochromic light with 10 nm bandwidth was provided by a 500 W xenon lamp using a monochromator for incident photon-to-current conversion efficiency (IPCE) measurements.

3. Results

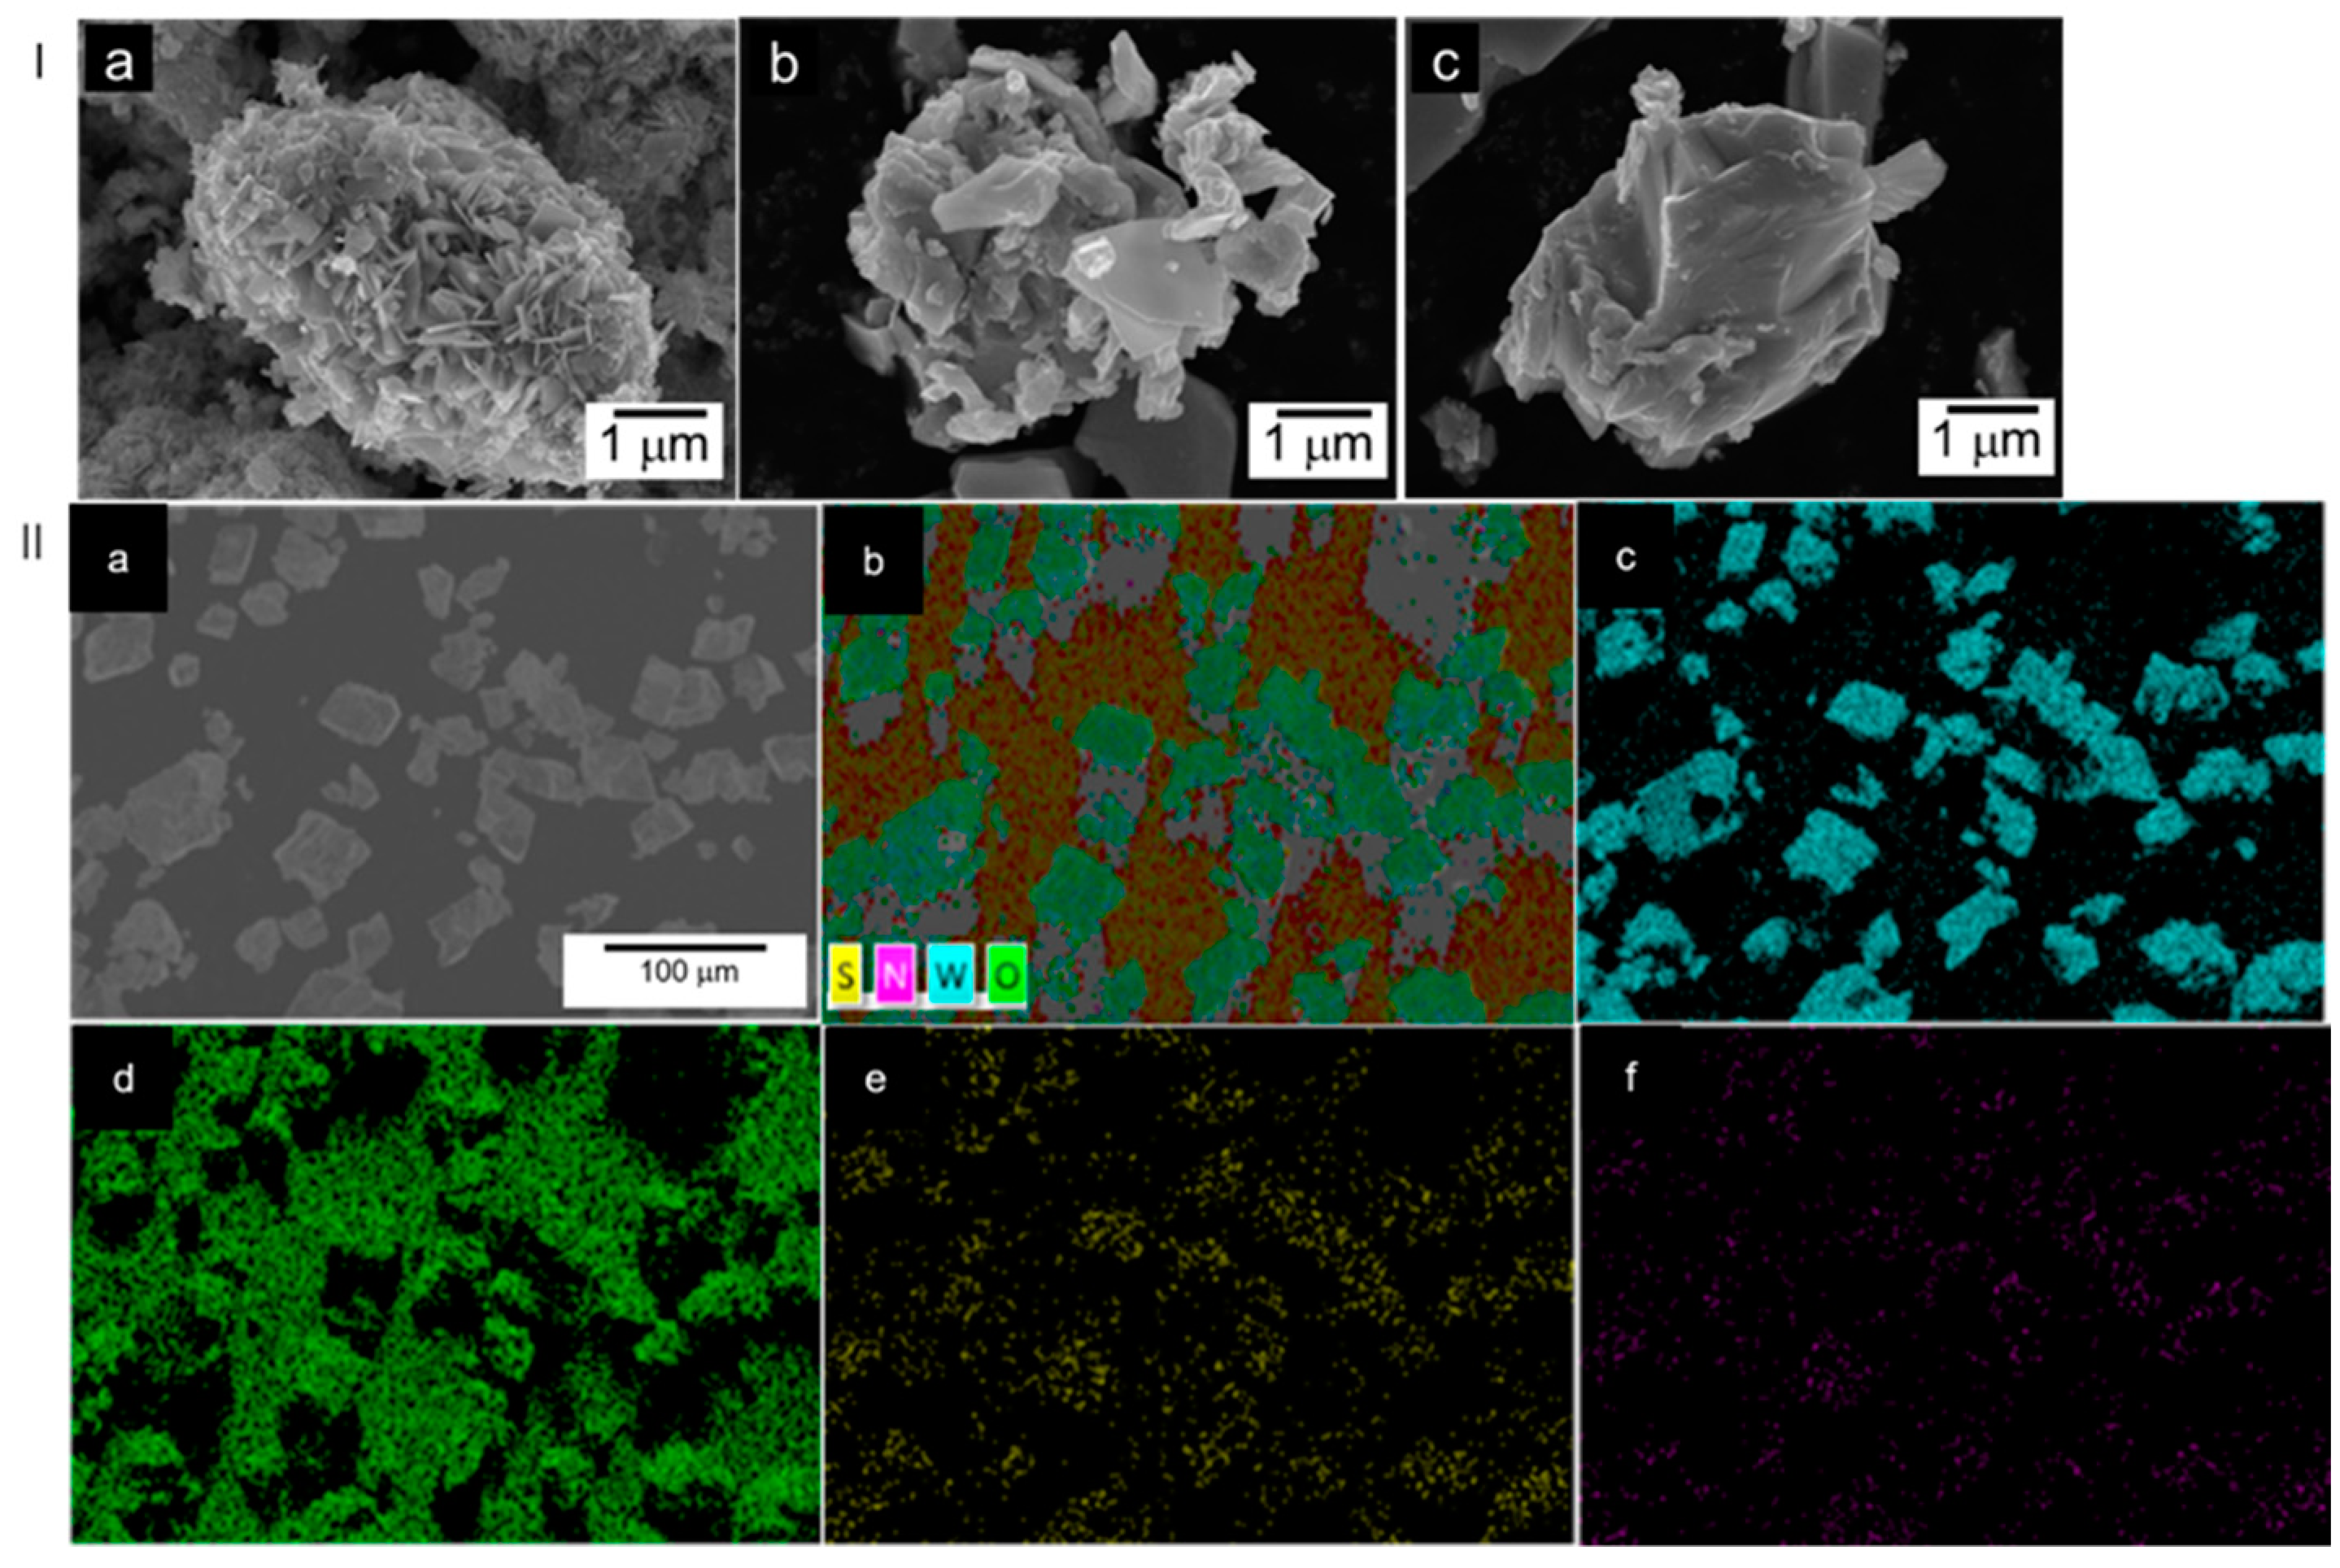
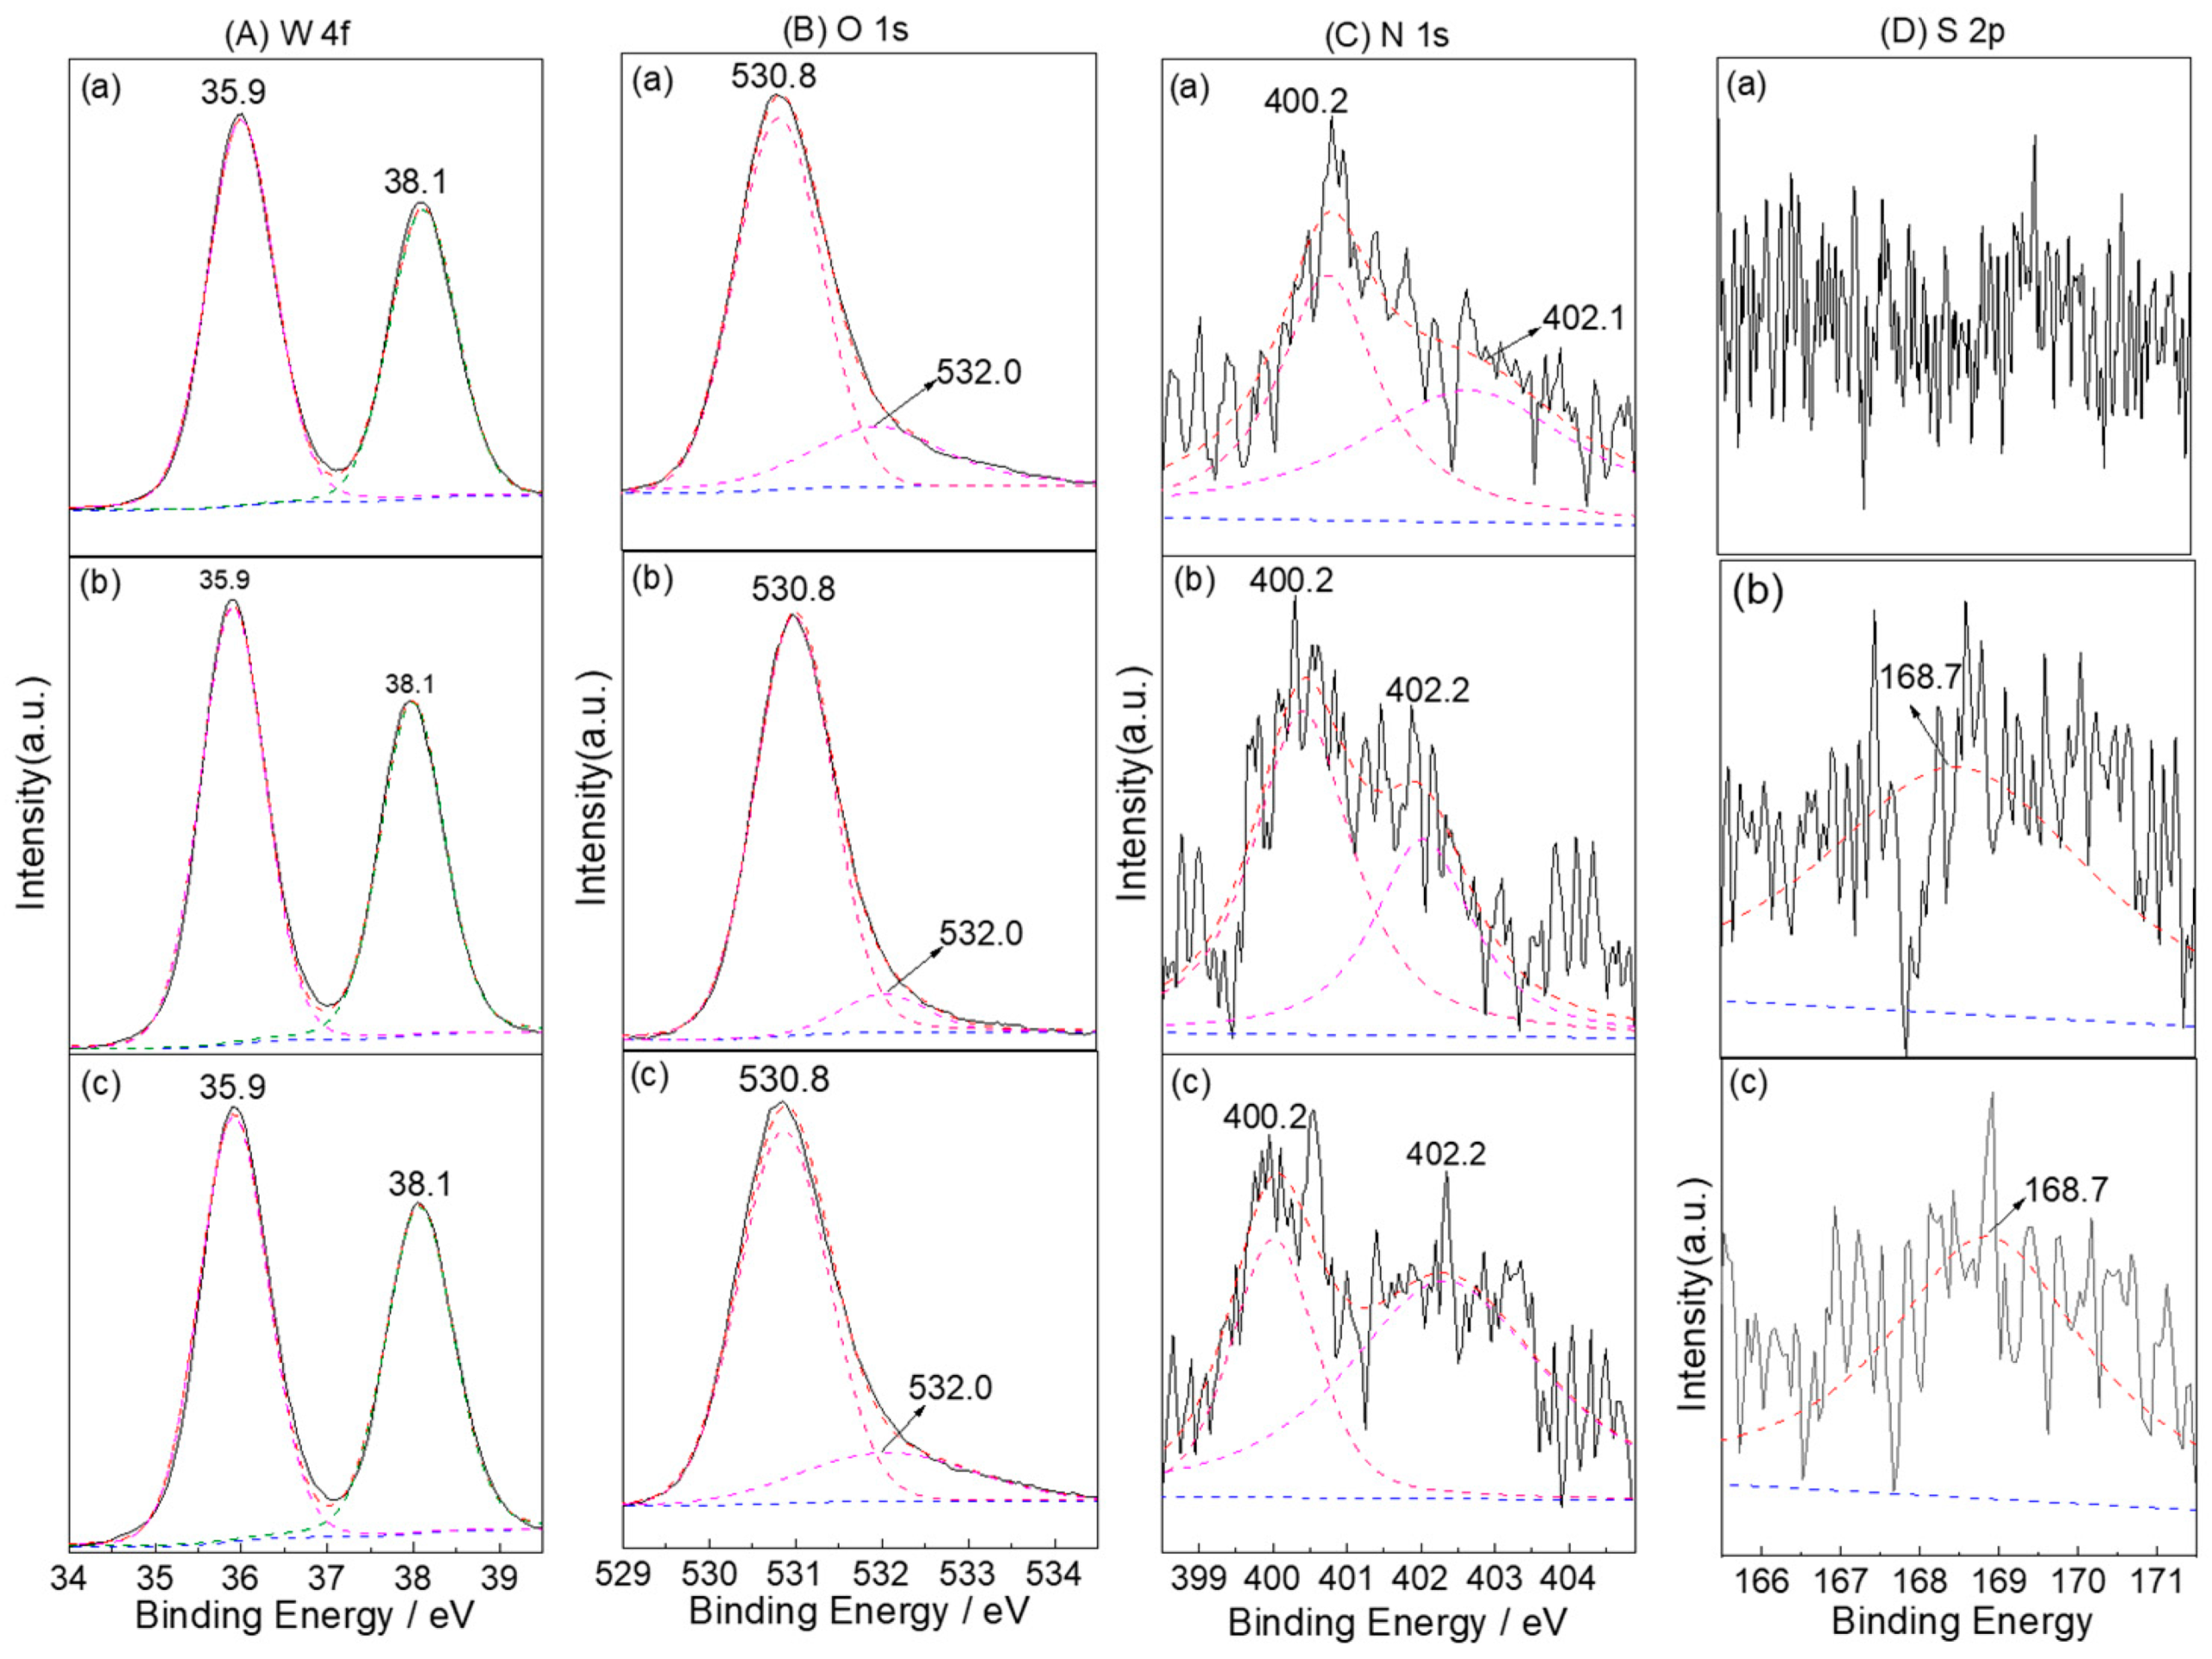
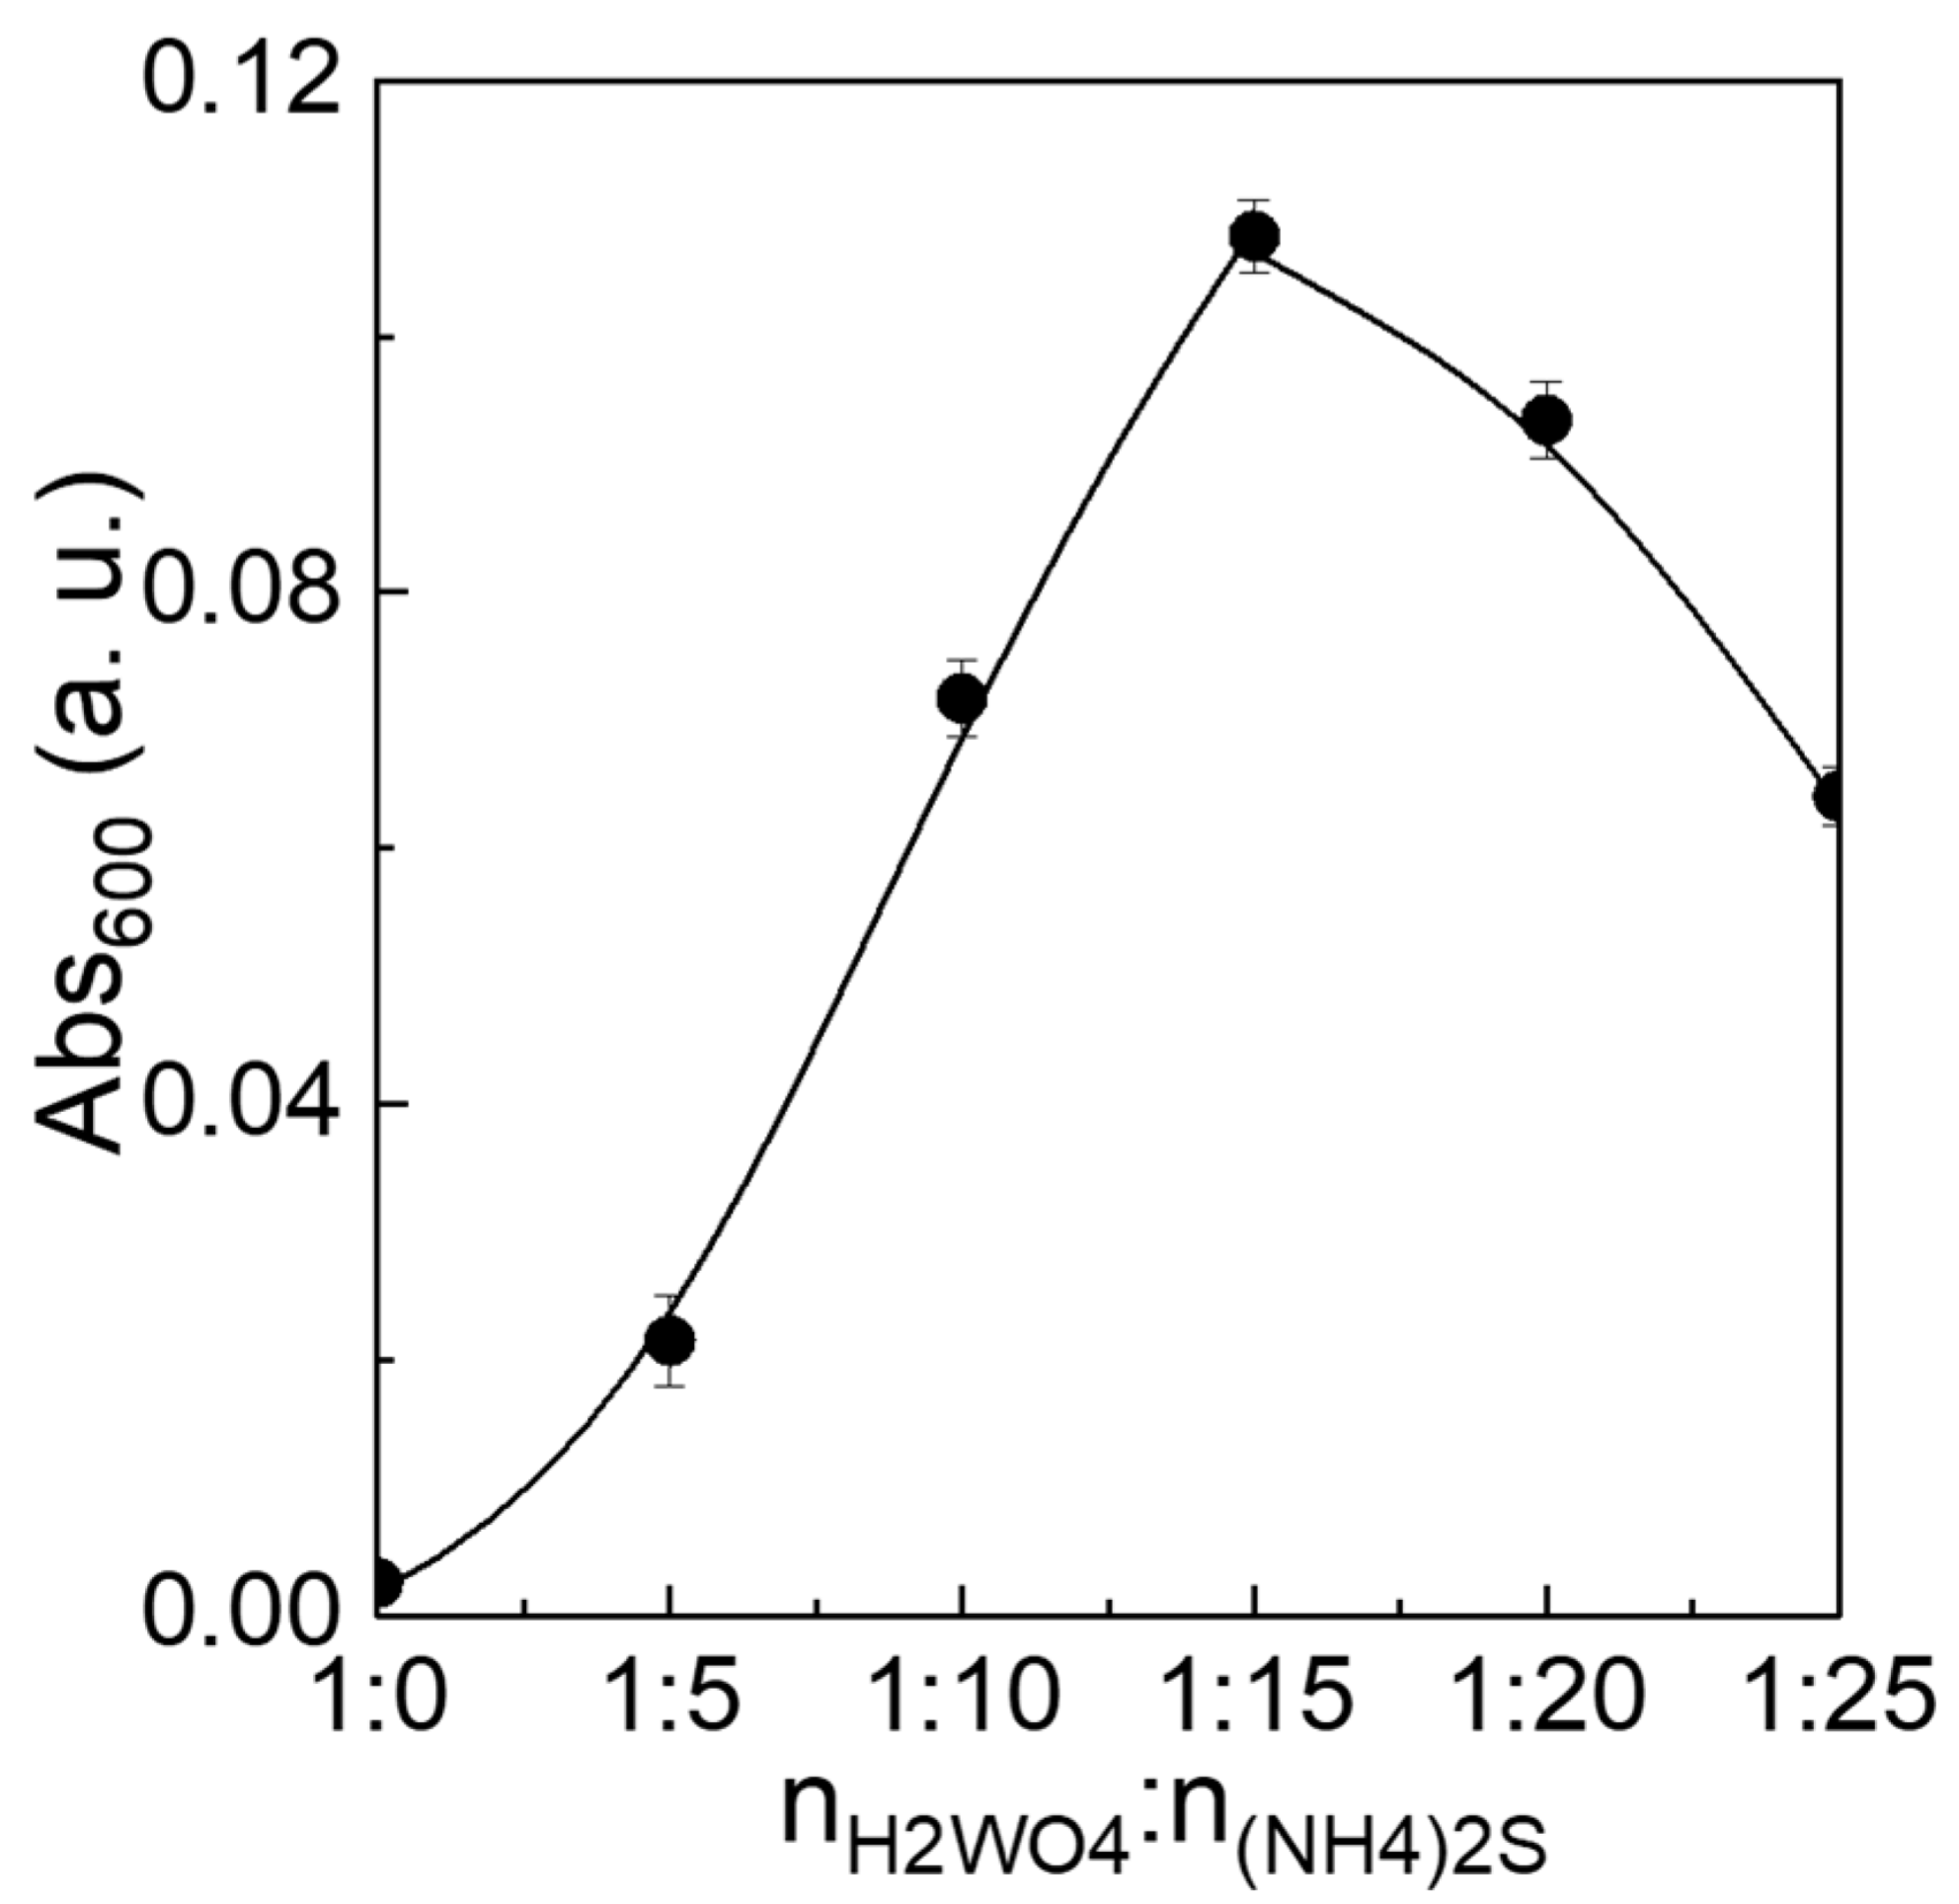
3.1. Characterization Structure of S-N-WO3

The phase composition of the WO3 samples calcined at 450 °C were ascertained by XRD (Figure 1A) and Raman (Figure 1B) measurements. In Figure 1A, it can be clearly observed that all of the samples exhibited the relatively weak peaks at 14.0°, 28.1°, and 36.8° corresponding to (100), (200), and (202) planes, respectively, which can be assigned to a hexagonal WO3 crystalline phase (PDF # 01-085-2459) [41]. Alongside the hexagonal peaks, the main peaks at 23.1°, 23.7°, 24.3°, 26.6°, 28.7°, 29.1°, 33.3°, 33.8°, and 41.3° for a monoclinic WO3 crystalline phase (PDF # 01-083-0950) [15], consisting of the (002), (020), (200), (120), (112), (022), (202), (220), and (222) plane, respectively. Especially, it can be seen that the crystallinity of S-N-WO3 samples decreases with an increasing nW:n(NH4)2S ratio over 1:15, suggesting that the crystalline structure of S-N-WO3 samples can be strongly affected by the addition of (NH4)2S.
Raman spectra of the WO3 samples exhibited the characteristic peaks of the monoclinic WO3 at 135.2 cm−1 (lattice vibration), 272.5 cm−1 (δ (O-W-O) deformation vibration), 711.1 cm−1 and 807.6 cm−1 (ν (O-W-O) stretching vibration) in the 100~1000 cm−1. Meanwhile, the characteristic peaks for the hexagonal WO3 at 260.2 cm−1 and 309.3 cm−1 (δ (O-W-O) deformation vibration), 649.7 cm−1 and 821.6 cm−1 (ν (O-W-O) stretching vibration) were observed. The Raman analysis also shows the tendency of Raman peaks broadening due to overdoping from the nW:n(NH4)2S ratio of 1:15, which is in agreement with the XRD results.
As shown in Figure 2I, it can be clearly observed that the morphologies of WO3−5 and WO3−15 samples (Figure 2Ib,c) are different from that of WO3−0 (Figure 2Ia) composed of nanosheet of ca. 5 μm. It also should be noted that the particles showed the trend of agglomeration with increasing addition of (NH4)2S. For the WO3−5 sample (Figure 2Ib), it mainly consisted of microparticles of about 0.7–1.8 μm, while the WO3−15 sample (Figure 2Ic) was uniformly made up of blocklike particles of about 5.2 μm in size. EDX analyses were taken to confirm the presence of S and N elements. The elemental maps of the EDX for the WO3−15 sample are shown in Figure 2II, where the uniform distribution of W and O (Figure 2IIc,d) are confirmed. While the signals of both S and N can be clearly detected on the same structural portion, no other impurity elements were observed in the samples. However, both N and S mappings exhibited higher distribution due to the presence of higher contents in the WO3−15 sample. The atom number ratios of W/N as well as W/S were calculated from EDS data to exhibit that it increases with an increase in the nW:n(NH4)2S ratio from 1:0 to 1:15 and thereafter decreased above 1:15 (Figure S1 and Table 1).
The chemical composition and valence states of different WO3 samples were investigated through XPS. The spectra were calibrated with the C 1s peak as reference. As shown in Figure S2, the XPS survey spectrum of WO3-0 depicts that no other impurity signals, besides the C 1s line, were detected and only W and O. The high-resolution XPS spectrum of W 4f exhibited two peaks at 37.7 eV and 35.5 eV associated with the spin-orbit doublet of W 4f7/2 and W 4f5/2, respectively, for a W6+ state in WO3 [11,51]. The apparent peaks at 531.0 eV and 530.2 eV in the XPS spectrum of O 1s can be assigned to the H2O and W-O species, respectively [52,53]. The XPS spectra of W 4f doublet for WO3−5, WO3−10, and WO3−15 samples are shown in Figure 3A. Three of the samples exhibited two characteristic peaks at 38.1 eV and 35.9 eV corresponding to 4f5/2 and W 4f7/2 components of the WO3 lattice similar to WO3−0. The components with binding energies 530.8 and 532.0 eV in the high-resolution O 1s spectra (Figure 3B) are correspondent to the W-O and hydrocarbonate species, respectively. The XPS spectrum in an N 1S region of 399–404 eV (Figure 3C) exhibited two peaks at 400.2 eV and 402.2 eV, as obtained by two-bands deconvolution. The former one is ascribed to the binding energies of W-O-N, and the latter one is attributed to surface adsorbed (NOx, NH3) and/or nitrogen trapped in the surface layers as γ-N2 [38,54,55,56]. Considering that no peaks that correspond to W2N or WN were observed in the XRD patterns, we confirmed the substitution of O in WO3 by N element and the formation of W-O-N banding. In the high-resolution XPS spectra, the S 2p (Figure 3D) peak at 168.7 eV was observed for WO3−15 (no signals for the two other samples), and it is assigned to the S 2p orbits in the +6 oxidation state [40,57]. The formation of W-S bonding instead of W-O bonding can be confirmed by the following two reasons: (1) the binding energy of 168.7 eV for W-S is different from that of 169.9 eV for the SO42−, (2) S2− doping may only occur with difficulty because the S2− radius (1.70 Å) is significantly larger than O2− (1.22 Å). Generally, the larger the ionic radius is, the doping would be more difficult to occur due to higher formation energy. Therefore, the replacement of W6+ by S6+ is more favorable than replacing O2− with S2−. Furthermore, the XPS results also demonstrate that the S-N-WO3 could be formed when the nW:n(NH4)2S ratio was over 1:5. Compared to that of the WO3−0, the positive shifts of 0.4 eV and 0.8 eV for W 4f and O 1s can be seen, which is attributed to the electron transfer from the dopant energy level to the CB of WO3. It is considered that this transfer can be benefitial to improving the optical properties of WO3.
To further reveal the mechanism of S and N co-doped WO3, it is necessary to discuss the influence of the nW:n(NH4)2S ratio on the content of each element into the WO3 lattice (Figure 4). The contents of (a) O, (b) W, (c) N, and (d) S were calculated from XPS data (Figure 3 and Table 1). For WO3−0, the atom percent of W and O were 14.99% ± 1.2 and 44.82% ± 0.3, respectively. For WO3−5, no S element was doped into the WO3 lattice, only N element (1.64% ± 0.15). Compared to WO3−0, almost no change was observed for the W content (14.97% ± 1.0), but a decreasing trend was seen for the O (43.89% ± 0.8) content. As increasing the ratios from 1:5 to 1:15, the N content increased from 1.64% ± 0.15 to 5.82% ± 0.12, but the O content decreased from 40.4% ± 0.7 to 37.37 ± 0.8. It suggests that the higher nW:n(NH4)2S ratios could lead to more oxygen defects due to N doping. Special attention should be paid to the change trend of W content, which decreased with the appearance of the S element from 1:10 (12.7% ± 0.7) due to the substitution of W6+ by S6+. The significantly higher contents for both N (5.82% ± 0.12) and S (5.85% ± 0.18) were obtained at 1:15 than at other ratios. Such high N and S contents can improve the absorption of visible light to further narrow the bandgap of WO3. Thereafter, the increase of atom percent for W and O and decrease for S and N was observed at higher nW:n(NH4)2S ratios, and it may correspond to limitations in the substitution capacity of the WO3 lattice.

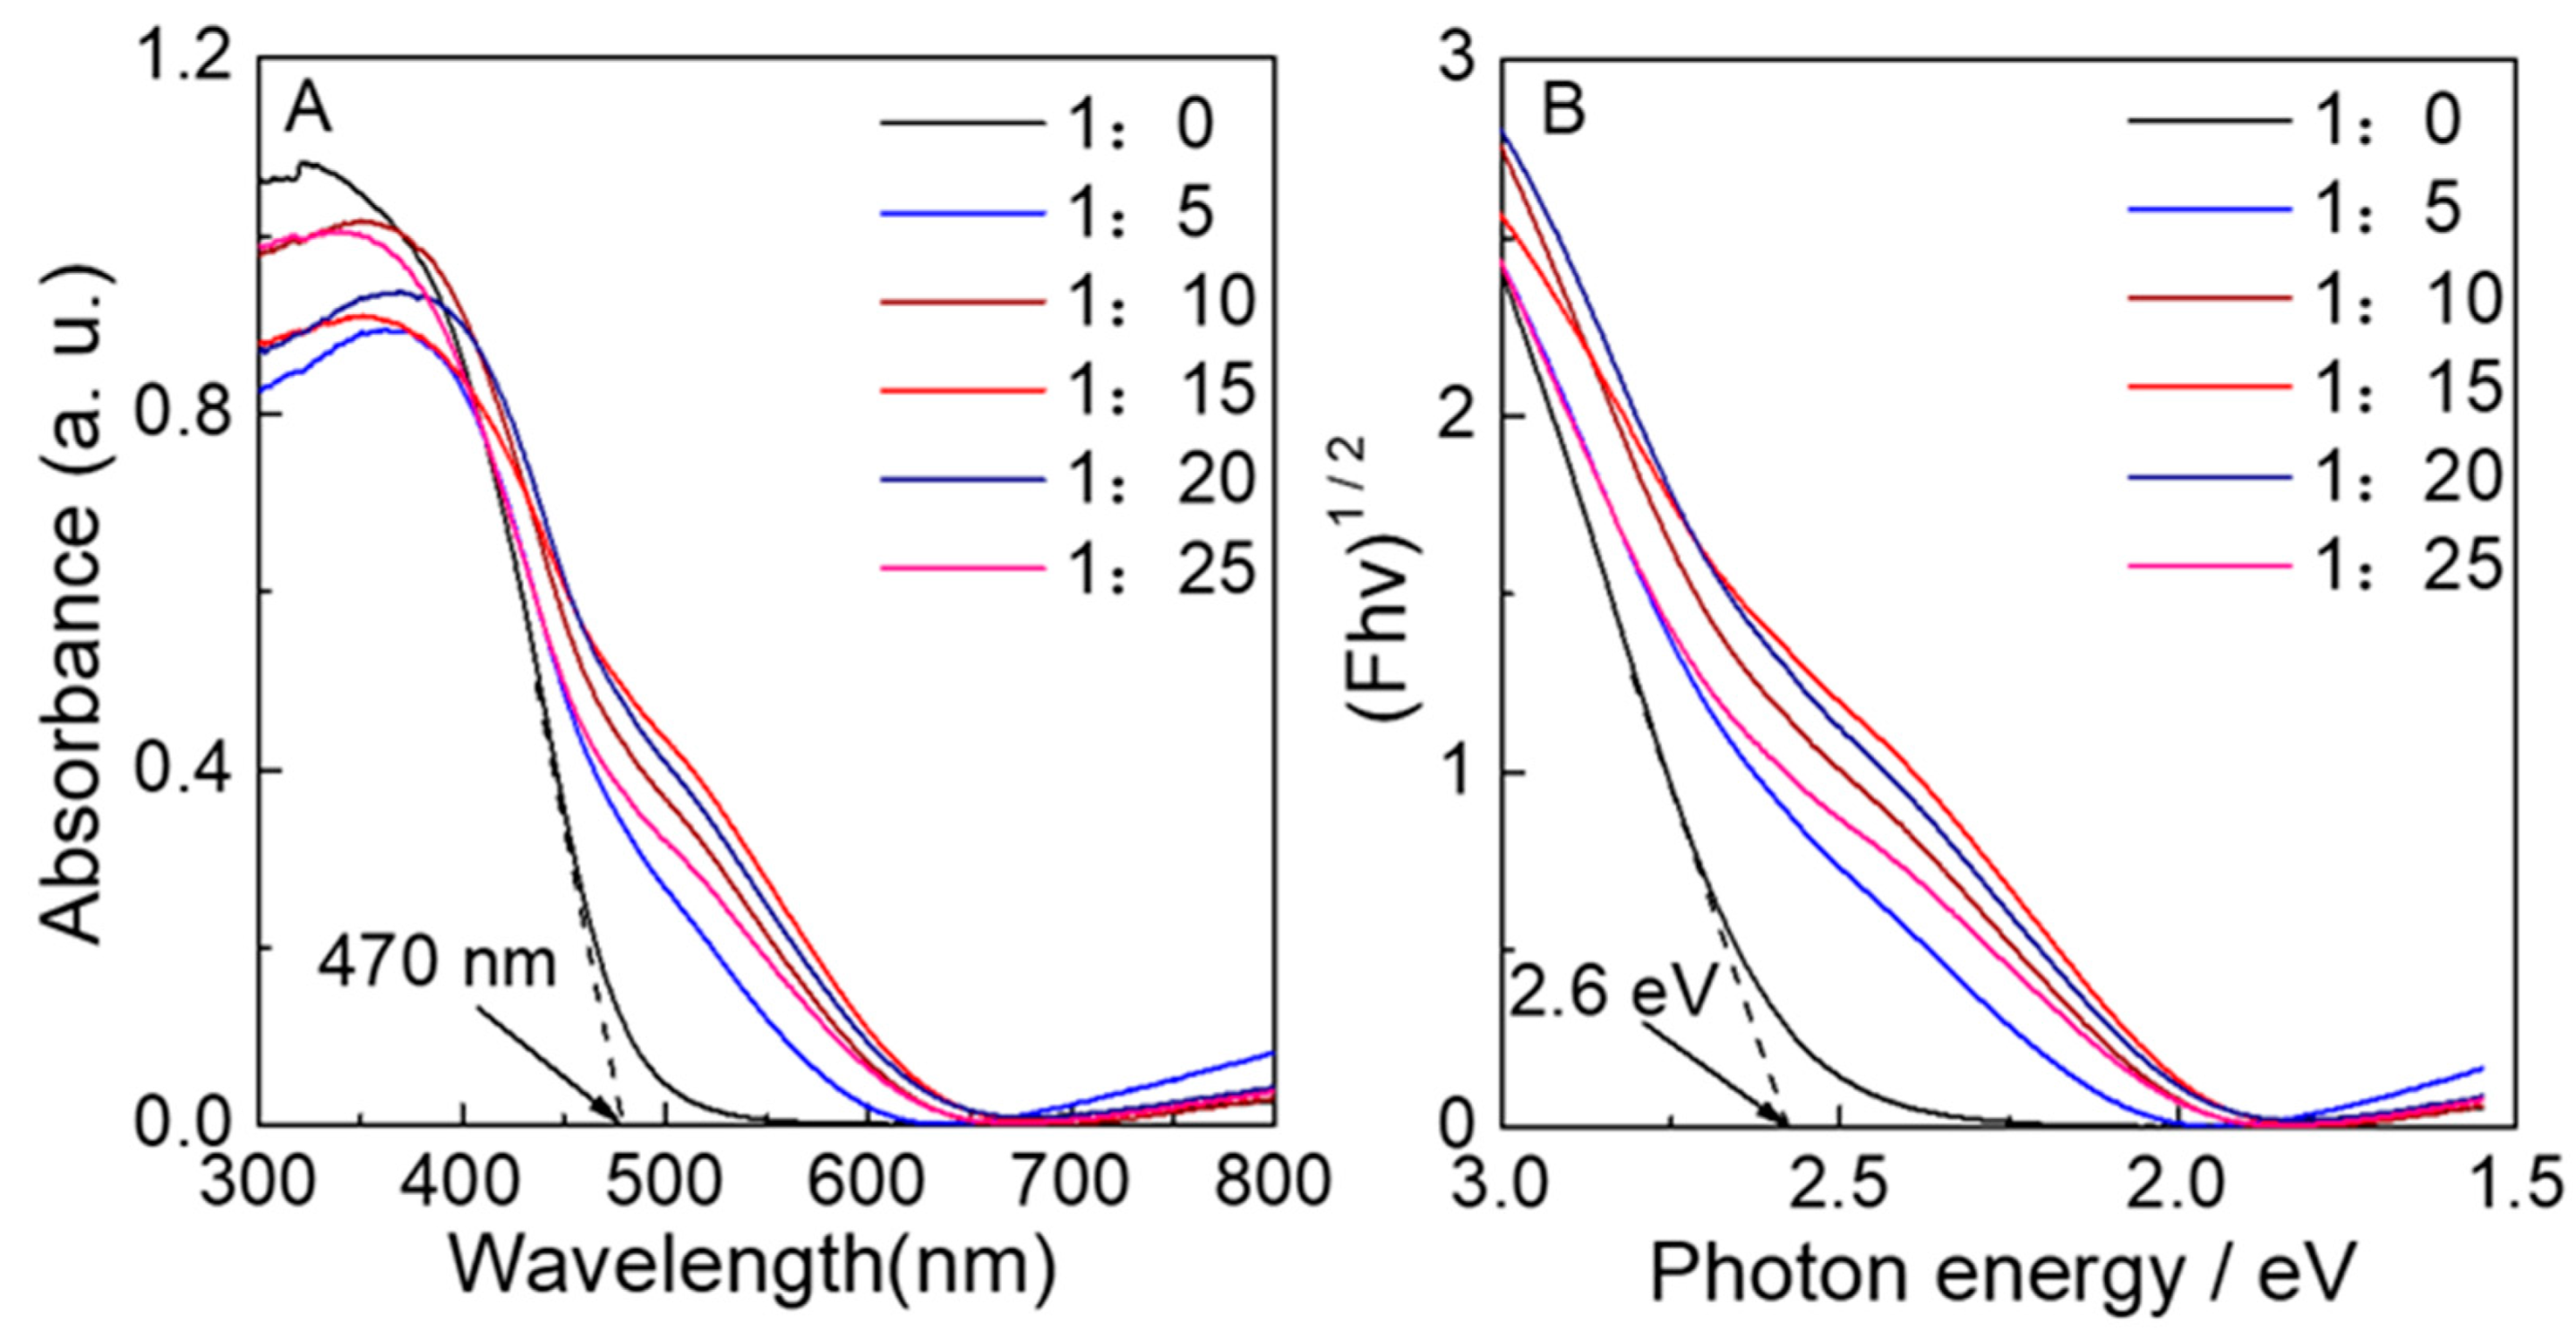
3.2. The Optical Properties of S-N-WO3

The DRS and the corresponding Tauc plots for the WO3 samples with changes in the ratio of nW:n(NH4)2S are exhibited in Figure 5. As shown in Figure 5A, the WO3-0 can only absorb light below 470 nm. However, a significant redshift in the absorption edge with new shoulders appearing at 470–650 nm can be seen in N-doped WO3 or the S-N co-doped one. It was found that the absorption properties increased when increasing the ratio of nW:n(NH4)2S below 1:15, and then they decreased when further increasing the addition of (NH4)2S. Absorption above 700 nm was observed for S-N-WO3 samples due to the formation of lattice defects caused by doping, in contrast to the negligible absorption for neat WO3. Furthermore, Tauc plots based on DRS data are shown in Figure 5B. The bandgap was determined by this technique in different materials [58,59,60]. It was reported that WO3 has an indirect optical bandgap. The Tauc plots for WO3−0 provided the absorption energy of 2.64 eV, which is in agreement with the bandgap energy of WO3 reported previously [11]. The Tauc plots for S-N-WO3 samples exhibited two different slopes due to the appearance of the new shoulders. Therefore, the estimated band energies for S-N-WO3 samples were obtained from the slopes, as displayed in Table 1. For WO3−5, the bandgap was reduced because a new intermediate N 2p orbital could be formed between the CB and the VB owing to N doping. It was observed that, in WO3 co-doped with S and N, the bandgap further decreased due to the formation of an intrabandgap above the VB edge and a dopant energy level below the CB of WO3.
Figure 6 is the relation between the absorbance value at 600 nm (Abs600). The Abs600 value is a measure of the increase/decrease of the shoulders at 470–650 nm. Compared with WO3−0, the Abs600 increased from 0.02 to 0.11 with an increase in the ratio of nW:n(NH4)2S from 1:5 to 1:15, and, thereafter, decreased over 1:15 to 0.06 at 1:25. The dependency of Abs600 on the nW:n(NH4)2S ratio agrees to the cases of the N and S content (Figure S1), indicating that the longer wavelength absorption due to the shoulders can be attributed to doping of N and S into a WO3 lattice.

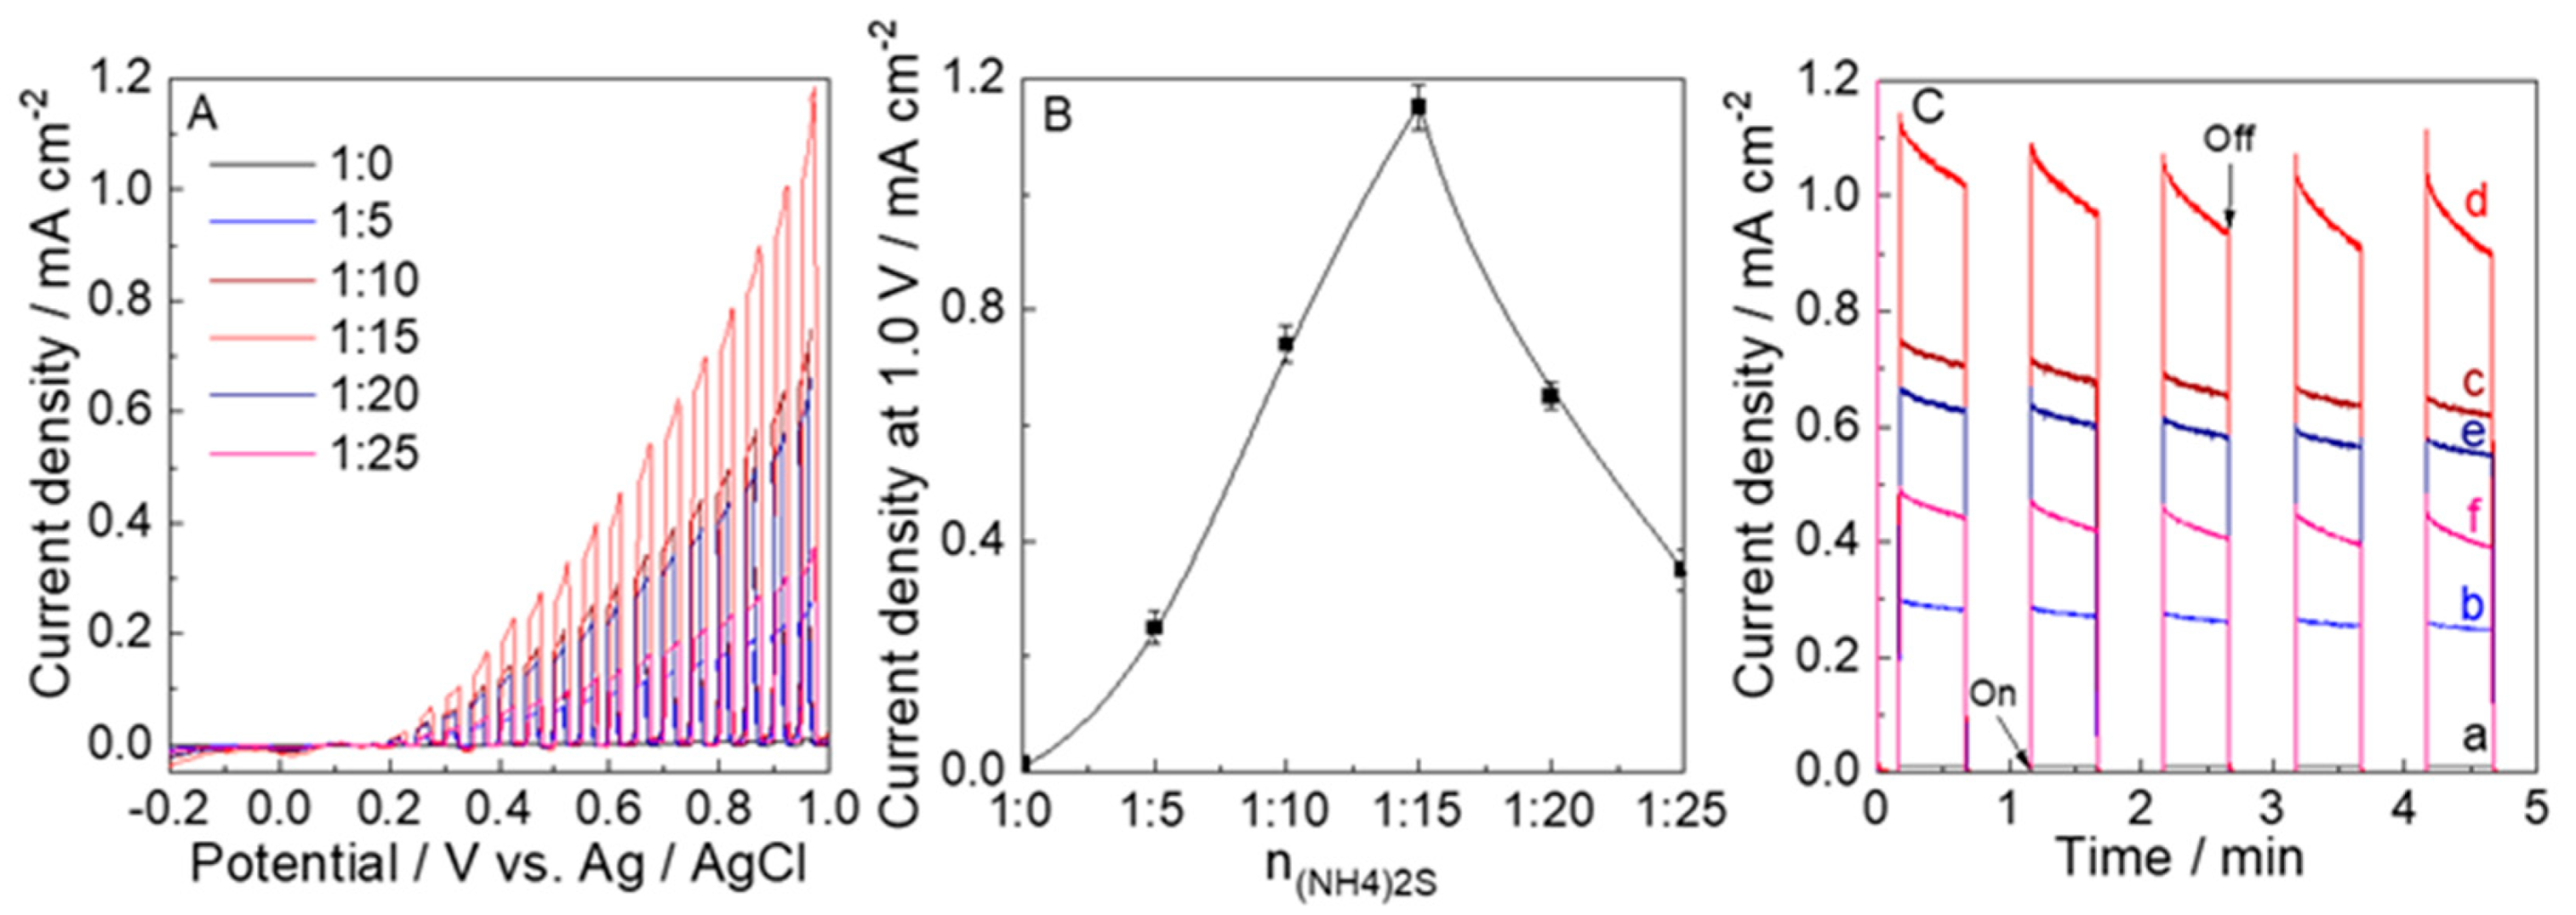
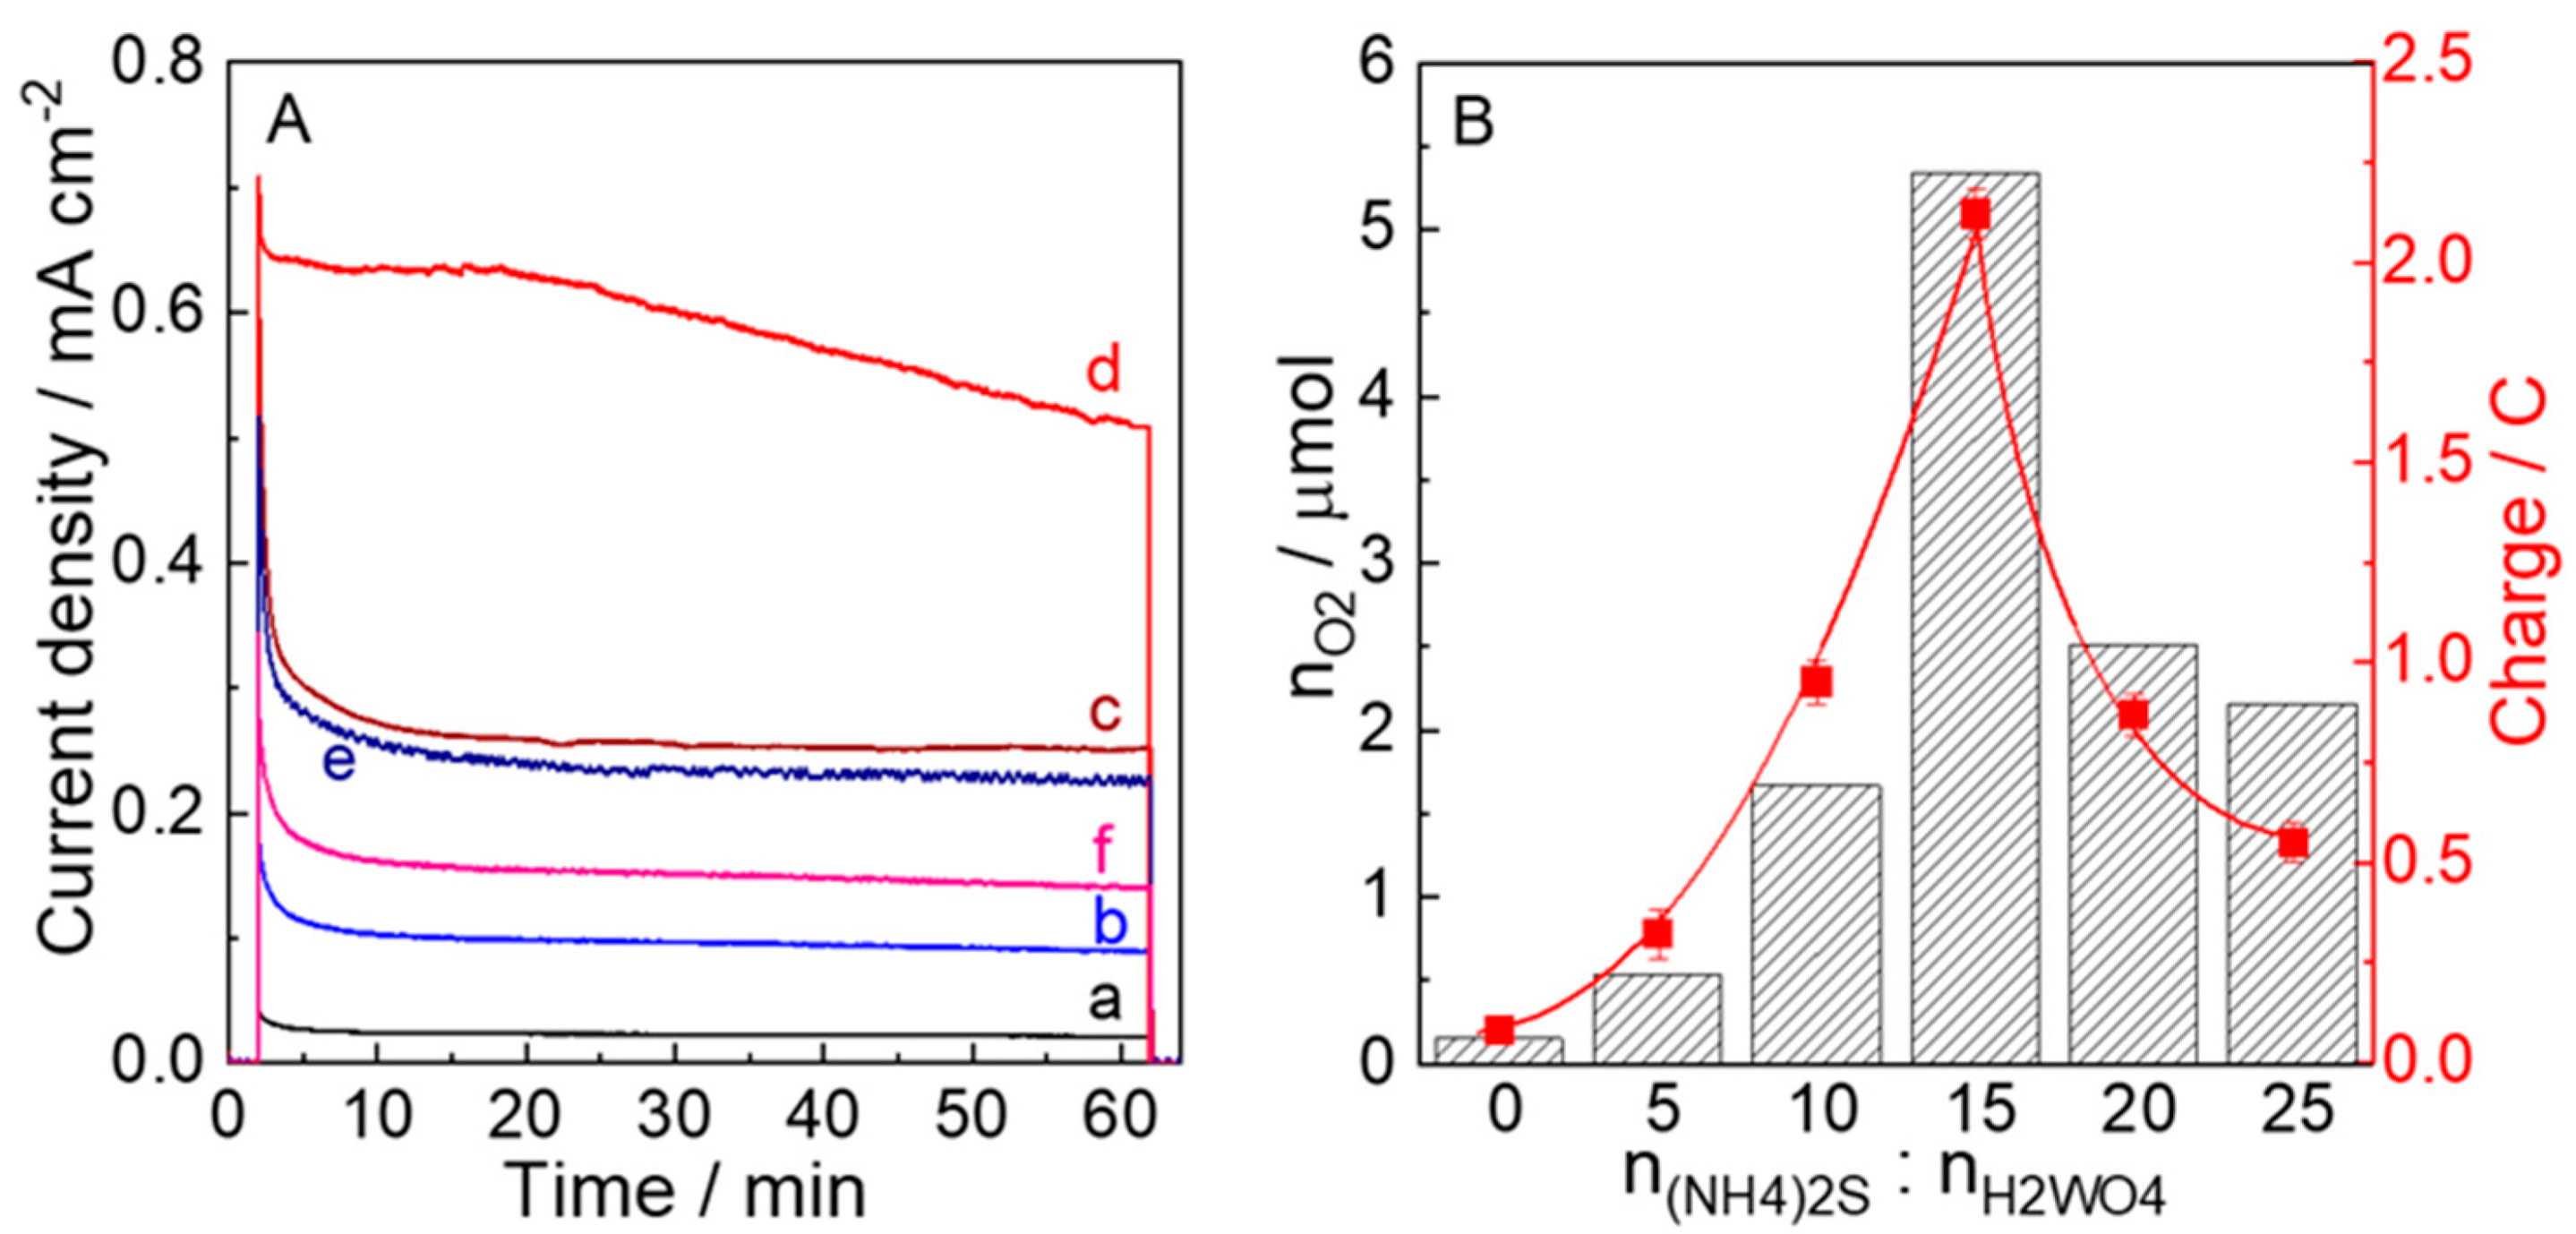
3.3. Photoelectrocatalytic Properties

The LSVs for these electrodes calcined at 450 °C were measured with chopped visible light irradiation to study their PEC water oxidation performance. The photoanodic currents of these electrodes were observed above 0.1 V vs. Ag/AgCl due to water oxidation. The photocurrent of 1.15 mA cm−2 at 1.0 V for WO3−15 was the highest in comparison to other samples. Moreover, as shown in Figure 7B, the dependency of the photocurrent at 1.0 V on the nW:n(NH4)2S ratio for each electrode is in agreement with the N and S contents. Figure 7C exhibits that the photocurrent at 0.68 V vs. Ag/AgCl (1.23 V vs. RHE) under visible-light irradiation chopped was stable during PEC water oxidation (5 min) for these electrodes. The photocurrent of the WO3−15 electrode (1.0 mA cm−2) was higher than those of the WO3−0, WO3−5, WO3−10, WO3−20, and WO3−25 by a factor of 83 (0.012 mA cm−2), 3.6 (0.28 mA cm−2), 1.4 (0.71 mA cm−2), 1.6 (0.62 mA cm−2), and 2.3 (0.44 mA cm−2), respectively.
Photoelectrocatalysis was conducted under the visible light irradiation (λ > 450 nm, 100 mW cm−2) at potentiostatic conditions of 0.5 V vs. Ag/AgCl (1.05 V vs. RHE) in a 0.1 M phosphate buffer (pH 6.0) for 1 h using electrodes calcined at 450 °C (Figure 8A). A higher photoanodic current due to water oxidation was observed for the WO3−15 electrode. Compared with the electrodes prepared at other nW:n(NH4)2S ratios, the highest charge amount passed and the amount (nO2) of O2 evolved during the 1 h photoelectrocatalysis for WO3−15 were 2.12 C and 5.36 mmol (98% Faradaic efficiency), respectively (Figure 8B and Table S2). These results clearly prove that the doping of S and N enhances the PEC performance of WO3−15 in application to water oxidation.
The action spectra of IPCE for these electrodes are shown in Figure 9. In Figure 9A, for WO3−0, the photocurrent was not observed above 470 nm, which is consistent with the bandgap energy of WO3. For the WO3−5 electrode, the onset wavelength for photocurrent generation was at least 520 nm, which, due to N doping, is significantly longer than that of WO3−0. The energy of the onset wavelength for WO3−5 (520 nm, 2.38 eV) was lower than the main bandgap excitation for WO3−5 (2.43 eV). This suggests that the photocurrent was generated based on the bandgap excitation, and the bandgap excitation occurs through collateral excitation from intermediate N 2p orbital to CB for the WO3−5 electrode. The onset wavelengths for WO3−10, WO3−15, WO3−20, and WO3−25, due to the S and N co-doping, are considerably shifted to the wavelengths (580 nm) longer than that of single N-doped WO3−5. However, for all of S-N-WO3 electrodes, the photocurrent at longer wavelengths longer than 580 nm could not be detected due to the limited current detection level of the employed apparatus. For the electrodes prepared at different nW:n(NH4)2S ratios, the IPCE values at 450 nm (IPCE450) are shown in Figure 9B; the IPCE450 for WO3−5 electrode (0.63%) was 4.2 times higher than that of WO3−0 (0.15%), basically due to the formation of the formation of N doping. It precipitously increased at the ratios of 1:5 to 1:15, indicating that S and N co-doping plays a positive role in not only the increase in the onset wavelength but also in the increase in the IPCE450. The maximum IPCE450 of WO3−15 (5.81%) was obtained, which was 9.2 times higher compared to that of the WO3−5 electrode due to co-doping by S and N. It is suggested that the highest contents of S and N into WO3 lattice can effectively increase the electron transport rate and further inhibit recombination of electron-hole pairs in the film. When increasing the nW:n(NH4)2S ratios, the IPCE450 for WO3−20 and WO3−25 reduced to 1.99% and 1.46%, respectively. However, they were still higher than that of the WO3−5 electrode. The relationship between IPCE450 and nW:n(NH4)2S ratio is consistent with the Abs600 value in DRS data (Figure 6), indicating that the S and N co-doping is responsible for the lengthening of the onset wavelength for PEC water oxidation.

4. Conclusions

Nitrogen and sulfur co-doped crystalline WO3 was synthesized by thermal decomposition of (NH4)2S-derived precursor, in which (NH4)2S acted as a sulfur source, as well as the nitrogen source for doping. The addition of (NH4)2S has an effect on the physiochemical properties, and the performance of PEC water oxidation of the WO3-0 and S-N-WO3 electrodes was investigated to characterize the co-doping of S and N into the WO3 lattice and reveal the mechanism of superior performance for PEC water oxidation using the S-N-WO3 photoanode. S-N-WO3 exhibited the optimum nW:n(NH4)2S ratio at 1:15 for the high concentration of both S and N elements. The S and N co-doping is responsible for the significant redshift in the absorption edge, with a new shoulder appearing at 470–650 nm compared to that of WO3−0. The S-N-WO3 photoanode is able to utilize visible light at wavelengths below 580 nm for PEC water oxidation, in contrast to the WO3−0 photoanode being able to work below 470 nm. The IPCE (5.81%) at 450 nm for S-N-WO3 photoanode calcined at 450 °C was higher than that (0.15%) for WO3−0 by 38.7 times due to the co-doping of S and N. The S-N-WO3 photoanode is expected to be applied for PEC water splitting cell as an artificial photocatalyst to improve the solar energy conversion efficiency.

Supplementary Materials

The following supporting information can be downloaded at: https://www.mdpi.com/article/10.3390/nano12122079/s1, Figure S1: (A) Relationship between the relative contents of N, S and nW:n(NH4)2S ratio; Figure S2: (A) the XPS survey spectrum and (B) XPS spectra in (A) W 4f, (B) O 2p regions for WO3−0; Table S1: Atomic percent of surface W, O, N, and S estimated by XPS; Table S2: Summary of PEC water oxidation in a 0.1 M phosphate buffer solution (pH 6.0) for 1 h using different WO3 electrodes calcined at 450 °C.

Author Contributions

Conceptualization, D.L., F.W. and F.H. (Fei Han); methodology, H.S. and F.H. (Fenglan Han); investigation and data curation, Z.C.; formal analysis, C.G.; supervision, D.L.; writing—original draft preparation, D.L.; writing—review and editing, D.L. All authors have read and agreed to the published version of the manuscript.

Funding

This project was supported by the Natural Science Foundation of Ningxia Province, grant number 2021AAC03170; 2022AAC03218; Scientific Research Project of Ningxia Colleges and Universities, grant number NGY2018-153. The Fundamental Research Funds for the Central Universities, North Minzu University (2020xyzc106).

Acknowledgments

The authors are grateful for the support of the Natural Science Foundation of Ningxia Province (Grant No. 2021AAC03170; 2022AAC03217), Scientific Research Project of Ningxia Colleges and Universities (Grant No. NGY2018-153).

Conflicts of Interest

The authors declare no conflict of interest.

References

  1. Wang, Y.; Tian, W.; Chen, C.; Xu, W.; Li, L. Tungsten Trioxide Nanostructures for Photoelectrochemical Water Splitting: Material Engineering and Charge Carrier Dynamic Manipulation. Adv. Func. Mater. 2019, 29, 1809036. [Google Scholar] [CrossRef]
  2. Cook, T.R.; Dogutan, D.K.; Reece, S.Y.; Surendranath, Y.; Nocera, D.G. Solar Energy Supply and Storage for the Legacy and Non Legacy Worlds. Chem. Rev. 2010, 110, 6474–6502. [Google Scholar] [CrossRef] [PubMed]
  3. Dahl, S.; Chorkendorff, I. Towards Practical Implementation. Nat. Mater. 2012, 11, 100–101. [Google Scholar] [CrossRef] [PubMed]
  4. Wan, L.; Shi, C.W.; Zong-Bao, Y.U.; Hong-Da, W.U.; Xiao, W.; Geng, Z.X.; Ren, T.Q.; Han, Q.; Yang, Z.X. Preparation of WS2/C Composite Material and Its Electrocatalytic Hydrogen Evolution Performance. J. Fuel Chem. Technol. 2021, 49, 1362–1370. [Google Scholar] [CrossRef]
  5. Fujishima, A.; Honda, K. Electrochemical Photolysis of Water at a Semiconductor Electrode. Nature 1972, 238, 37–38. [Google Scholar] [CrossRef]
  6. Digdaya, I.A.; Adhyaksa, G.W.P.; Trześniewski, B.J.; Garnett, E.C.; Smith, W.A. Interfacial Engineering of Metal-Insulator-Semiconductor Junctions for Efficient and Stable Photoelectrochemical Water Oxidation. Nat. Commun. 2017, 8, 15968–15975. [Google Scholar] [CrossRef]
  7. Ding, Q.; Gou, L.; Wei, D.; Xu, D.; Fan, W.; Shi, W. Metal-Organic Framework Derived Co3O4/TiO2 Heterostructure Nanoarrays for Promote Photoelectrochemical Water Splitting. Int. J. Hydrogen Energy 2021, 46, 24965–24976. [Google Scholar] [CrossRef]
  8. Wang, N.; Wang, D.G.; Li, M.R.; Shi, J.Y.; Li, C. Photoelectrochemical Water Oxidation on Photoanodes Fabricated with Hexagonal Nanoflower and Nanoblock WO3. Nanocsale 2014, 6, 2061–2066. [Google Scholar] [CrossRef]
  9. Dotan, H.; Sivula, K.; Grätzel, M.; Rothschild, A.; Warren, S.C. Probing the Photoelectrochemical Properties of Hematite (α-Fe2O3) Electrodes Using Hydrogen Peroxide as a Hole Scavenger. Energy Environ. Sci. 2011, 4, 958–964. [Google Scholar] [CrossRef]
  10. Higashi, M.; Domen, K.; Abe, R. Fabrication of an Efficient BaTaO2N Photoanode Harvesting a Wide Range of Visible Light for Water Splitting. J. Am. Chem. Soc. 2013, 135, 10238–10241. [Google Scholar] [CrossRef]
  11. Li, D.; Takeuchi, R.; Chandra, D.; Saito, K.; Yui, T.; Yagi, M. Visible Light-Driven Water Oxidation on an In Situ N2-intercalated WO3 Nanorod Photoanode Synthesized by a Dual-Functional Structure-Directing Agent. ChemSusChem 2018, 11, 1151–1156. [Google Scholar] [CrossRef] [PubMed]
  12. Chandra, D.; Saito, K.; Yui, T.; Yagi, M. Crystallization of Tungsten Trioxide Having Small Mesopores: Highly Efficient Photoanode for Visible-Light-Driven Water Oxidation. Angew. Chem. Int. Ed. 2013, 52, 12606–12609. [Google Scholar] [CrossRef] [PubMed]
  13. Su, J.; Guo, L.; Bao, N.; Grimes, C.A. Nanostructured WO3/BiVO4 Heterojunction Films for Efficient Photoelectrochemical Water Splitting. Nano Lett. 2011, 11, 1928–1933. [Google Scholar] [CrossRef] [PubMed]
  14. Kim, J.K.; Shin, K.; Cho, S.M.; Lee, T.-W.; Park, J.H. Synthesis of Transparent Mesoporous Tungsten Trioxide Films with Enhanced Photoelectro-Chemical Response: Application to Unassisted Solar Water Splitting. Energy Environ. Sci. 2011, 4, 1465–1470. [Google Scholar] [CrossRef] [Green Version]
  15. Santato, C.; Ulmann, M.; Augustynski, J. Photoelectrochemical Properties of Nanostructured Tungsten Trioxide Films. J. Phys. Chem. B 2001, 105, 936–940. [Google Scholar] [CrossRef]
  16. Hisatomi, T.; Dotan, H.; Stefik, M.; Sivula, K.; Rothschild, A.; Grätzel, M.; Mathews, N. Enhancement in the Performance of Ultrathin Hematite Photoanode for Water Splitting by an Oxide Underlayer. Adv. Mater. 2012, 24, 2699–2702. [Google Scholar] [CrossRef] [PubMed]
  17. Kay, A.; Cesar, I.; Grätzel, M. New Benchmark for Water Photooxidation by Nanostructured α-Fe2O3 Films. J. Am. Chem. Soc. 2006, 128, 15714–15721. [Google Scholar] [CrossRef] [PubMed]
  18. Carroll, G.M.; Zhong, D.K.; Gamelin, D.R. Mechanistic Insights into Solar Water Oxidation by Cobalt-Phosphate-Modified α-Fe2O3 Photoanodes. Energy Environ. Sci. 2015, 8, 577–584. [Google Scholar] [CrossRef]
  19. Zhang, R.; Fang, Y.; Chen, T.; Qu, F.; Liu, Z.; Du, G.; Asiri, A.M.; Gao, T.; Sun, X. Enhanced Photoelectrochemical Water Oxidation Performance of Fe2O3 Nanorods Array by S Doping. ACS Sustain. Chem. Eng. 2017, 5, 7502–7506. [Google Scholar] [CrossRef]
  20. Chandraiahgari, C.R.; De Bellis, G.; Ballirano, P.; Balijepalli, S.K.; Kaciulis, S.; Caneve, L.; Sarto, F.; Sarto, M.S. Synthesis and Characterization of ZnO Nanorods with a Narrow Size Distribution. RSC Adv. 2015, 5, 49861–49870. [Google Scholar] [CrossRef] [Green Version]
  21. Sharma, V.; Dakshinamurthy, A.C.; Pandey, B.; Roy, S.C.; Sudakar, C. Highly Efficient Photoelectrochemical ZnO and TiO2 Nanorod/Sb2S3 Heterostructured Photoanodes through One Step Thermolysis of Sb-MPA Complex. Sol. Energy 2021, 225, 333–343. [Google Scholar] [CrossRef]
  22. Paracchino, A.; Laporte, V.; Sivula, K.; Graetzel, M.; Thimsen, E. Highly Active Oxide Photocathode for Photoelectrochemical Water Reduction. Nat. Mater. 2011, 10, 456–461. [Google Scholar] [CrossRef] [PubMed]
  23. Zhang, Z.; Wang, P. Highly Stable Copper Oxide Composite as an Effective Photocathode for Water Splitting via a Facile Electrochemical Synthesis Strategy. J. Mater. Chem. 2012, 22, 2456–2464. [Google Scholar] [CrossRef]
  24. Xiao, Y.; Feng, C.; Fu, J.; Wang, F.; Li, C.; Kunzelmann, V.F.; Jiang, C.-M.; Nakabayashi, M.; Shibata, N.; Sharp, I.D.; et al. Band Structure Engineering and Defect Control of ta3n5 for Efficient Photoelectrochemical Water Oxidation. Nat. Catal. 2020, 3, 932–940. [Google Scholar] [CrossRef]
  25. Feng, X.; LaTempa, T.J.; Basham, J.I.; Mor, G.K.; Varghese, O.K.; Grimes, C.A. Ta3N5 Nanotube Arrays for Visible Light Water Photoelectrolysis. Nano Lett. 2010, 10, 948–952. [Google Scholar] [CrossRef]
  26. Zhen, C.; Wang, L.; Liu, G.; Lu, G.Q.; Cheng, H.-M. Template-Free Synthesis of Ta3N5 Nanorod Arrays for Efficient Photoelectrochemical Water Splitting. Chem. Commun. 2013, 49, 3019–3021. [Google Scholar] [CrossRef]
  27. Hodes, G.; Cahen, D.; Manassen, J. Tungsten Trioxide as a Photoanode for a Photoelectrochemical Cell (PEC). Nature 1976, 260, 312–313. [Google Scholar] [CrossRef]
  28. Radecka, M.; Sobas, P.; Wierzbicka, M.; Rekas, M. Photoelectrochemical Properties of Undoped and Ti-Doped WO3. Phys. B 2005, 364, 85–92. [Google Scholar] [CrossRef]
  29. Hameed, A.; Gondal, M.A.; Yamani, Z.H. Effect of Transition Metal Doping on Photocatalytic Activity of WO3 for Water Splitting under Laser Illumination: Role of 3d-Orbitals. Catal. Commun. 2004, 5, 715–719. [Google Scholar] [CrossRef]
  30. Bär, M.; Weinhardt, L.; Marsen, B.; Cole, B.; Gaillard, N.; Miller, E.; Heske, C. Mo Incorporation in WO3 Thin Film Photoanodes: Tailoring the Electronic Structure for Photoelectrochemical Hydrogen Production. Appl. Phys. Lett. 2010, 96, 032107–032109. [Google Scholar] [CrossRef]
  31. Liu, H.; Peng, T.; Ke, D.; Peng, Z.; Yan, C. Preparation and Photocatalytic Activity of Dysprosium Doped Tungsten Trioxide Nanoparticles. Mater. Chem. Phys. 2007, 104, 377–383. [Google Scholar] [CrossRef]
  32. Yang, B.; Luca, V. Enhanced Long-Wavelength Transient Photoresponsiveness of WO3 Induced by Tellurium Doping. Chem. Commun. 2008, 32, 4454–4456. [Google Scholar] [CrossRef] [PubMed]
  33. Enesca, A.; Duta, A.; Schoonman, J. Influence of Tantalum Dopant Ions (Ta5+) on the Efficiency of the Tungsten Trioxide Photoelectrode. Phys. Status Solidi A 2008, 205, 2038–2041. [Google Scholar] [CrossRef]
  34. Muthu Karuppasamy, K.; Subrahmanyam, A. Results on the Electrochromic and Photocatalytic Properties of Vanadium Doped Tungsten Oxide Thin Films Prepared by Reactive DC Magnetron Sputtering Technique. J. Phys. D Appl. Phys. 2008, 41, 035302. [Google Scholar] [CrossRef]
  35. Liew, S.L.; Zhang, Z.; Goh, T.W.G.; Subramanian, G.S.; Seng, H.L.D.; Hor, T.S.A.; Luo, H.K.; Chi, D.Z. Yb-doped WO3 Photocatalysts for Water Oxidation with Visible Light. Int. J. Hydrogen Energy 2014, 39, 4291–4298. [Google Scholar] [CrossRef]
  36. Chang, X.; Sun, S.; Zhou, Y.; Dong, L.; Yin, Y. Solvothermal Synthesis of Ce-Doped Tungsten Oxide Nanostructures as Visible-Light-Driven Photocatalysts. Nanotechnology 2011, 22, 265603. [Google Scholar] [CrossRef]
  37. Sun, Y.; Murphy, C.J.; Reyes-Gil, K.R.; Reyes-Garcia, E.A.; Thornton, J.M.; Morris, N.A.; Raftery, D. Photoelectrochemical and Structural Characterization of Carbon-Doped WO3 Films Prepared via Spray Pyrolysis. Int. J. Hydrogen Energy 2009, 34, 8476–8484. [Google Scholar] [CrossRef]
  38. Liu, Y.; Li, Y.; Li, W.; Han, S.; Liu, C. Photoelectrochemical Properties and Photocatalytic Activity of Nitrogen-Doped Nanoporous WO3 Photoelectrodes under Visible Light. Appl. Surf. Sci. 2012, 258, 5038–5045. [Google Scholar] [CrossRef]
  39. Cole, B.; Marsen, B.; Miller, E.; Yan, Y.; To, B.; Jones, K.; Al-Jassim, M. Evaluation of Nitrogen Doping of Tungsten Oxide for Photoelectrochemical Water Splitting. J. Phys. Chem. C 2008, 112, 5213–5220. [Google Scholar] [CrossRef]
  40. Li, W.; Li, J.; Wang, X.; Chen, Q. Preparation and Water-Splitting Photocatalytic Behavior of S-Doped WO3. Appl. Surf. Sci. 2012, 263, 157–162. [Google Scholar] [CrossRef]
  41. Mi, Q.; Ping, Y.; Li, Y.; Cao, B.; Brunschwig, B.S.; Khalifah, P.G.; Galli, G.A.; Gray, H.B.; Lewis, N.S. Thermally Stable N2-Intercalated WO3 Photoanodes for Water Oxidation. J. Am. Chem. Soc. 2012, 134, 18318–18324. [Google Scholar] [CrossRef] [PubMed] [Green Version]
  42. Li, D.; Chandra, D.; Takeuchi, R.; Togashi, T.; Kurihara, M.; Saito, K.; Yui, T.; Yagi, M. Dual-Functional Surfactant-Templated Strategy for Synthesis of an In Situ N2-Intercalated Mesoporous WO3 Photoanode for Efficient Visible-Light-Driven Water Oxidation. Chem. Eur. J. 2017, 23, 6596–6604. [Google Scholar] [CrossRef] [PubMed]
  43. Ping, Y.; Li, Y.; Gygi, F.; Galli, G. Tungsten Oxide Clathrates for Water Oxidation: A First Principles Study. Chem. Mater. 2012, 24, 4252–4260. [Google Scholar] [CrossRef]
  44. Wang, F.; Ma, Z.; Ban, P.; Xu, X. C, N and S Codoped Rutile TiO2 Nanorods for Enhanced Visible-Light Photocatalytic Activity. Mater. Lett. 2017, 195, 143–146. [Google Scholar] [CrossRef]
  45. In, S.; Orlov, A.; Berg, R.; García, F.; Pedrosa-Jimenez, S.; Tikhov, M.S.; Wright, D.S.; Lambert, R.M. Effective Visible Light-Activated B-Doped and B,N-Codoped TiO2 Photocatalysts. J. Am. Chem. Soc. 2007, 129, 13790–13791. [Google Scholar] [CrossRef] [PubMed]
  46. Trevisan, V.; Olivo, A.; Pinna, F.; Signoretto, M.; Vindigni, F.; Cerrato, G.; Bianchi, C.L. C-N/TiO2 Photocatalysts: Effect of Co-doping on the Catalytic Performance under Visible Light. Appl. Catal. B Environ. 2014, 160–161, 152–160. [Google Scholar] [CrossRef]
  47. Huerta-Flores, A.M.; Chávez-Angulo, G.; Carrasco-Jaim, O.A.; Torres-Martínez, L.M.; Garza-Navarro, M.A. Enhanced Photoelectrochemical Water Splitting on Heterostructured α-Fe2O3-TiO2:X (X = Co, Cu, Bi) Photoanodes: Role of Metal Doping on Charge Carrier Dynamics Improvement. J. Photoch. Photobio A 2021, 410, 113077–113089. [Google Scholar] [CrossRef]
  48. Yu, J.; Zhou, M.; Cheng, B.; Zhao, X. Preparation, Characterization and Photocatalytic Activity of In Situ N, S-Codoped TiO2 Powders. J. Mol. Catal. A Chem. 2006, 246, 176–184. [Google Scholar] [CrossRef]
  49. Li, D.; Haneda, H.; Hishita, S.; Ohashi, N. Visible-Light-Driven N−F−Codoped TiO2 Photocatalysts. 2. Optical Characterization, Photocatalysis, and Potential Application to Air Purification. Chem. Mater. 2005, 17, 2596–2602. [Google Scholar] [CrossRef]
  50. Xu, J.-H.; Li, J.; Dai, W.-L.; Cao, Y.; Li, H.; Fan, K. Simple Fabrication of Twist-Like Helix N, S-Codoped Titania Photocatalyst with Visible-Light Response. Appl. Catal. B Environ. 2008, 79, 72–80. [Google Scholar] [CrossRef]
  51. Garavand, N.T.; Mahdavi, S.M.; Irajizad, A.; Ahadi, K. Synthesis of Sodium Tungsten Oxide Nano-Thick Plates. Mater. Lett. 2012, 82, 214–216. [Google Scholar] [CrossRef]
  52. Shpak, A.P.; Korduban, A.M.; Medvedskij, M.M.; Kandyba, V.O. XPS Studies of Active Elements Surface of Gas Sensors Based on WO3−x Nanoparticles. J. Electron. Spectrosc. 2007, 156–158, 172–175. [Google Scholar] [CrossRef]
  53. Huirache-Acuña, R.; Paraguay-Delgado, F.; Albiter, M.A.; Lara-Romero, J.; Martínez-Sánchez, R. Synthesis and Characterization of WO3 Nanostructures Prepared by an Aged-Hydrothermal Method. Mater. Charact. 2009, 60, 932–937. [Google Scholar] [CrossRef]
  54. Yang, X.; Wolcott, A.; Wang, G.; Sobo, A.; Fitzmorris, R.C.; Qian, F.; Zhang, J.Z.; Li, Y. Nitrogen-Doped ZnO Nanowire Arrays for Photoelectrochemical Water Splitting. Nano Lett. 2009, 9, 2331–2336. [Google Scholar] [CrossRef] [PubMed]
  55. Ghicov, A.; Macak, J.M.; Tsuchiya, H.; Kunze, J.; Haeublein, V.; Frey, L.; Schmuki, P. Ion Implantation and Annealing for an Efficient N-Doping of TiO2 Nanotubes. Nano Lett. 2006, 6, 1080–1082. [Google Scholar] [CrossRef]
  56. Asahi, R.T.; Morikawa, T.; Ohwaki, T.; Aoki, K.; Taga, Y. Visible-Light Photocatalysis in Nitrogen-Doped Titanium Oxides. Science 2001, 293, 269–271. [Google Scholar] [CrossRef] [PubMed]
  57. Yang, G.; Yan, Z.; Xiao, T. Low-Temperature Solvothermal Synthesis of Visible-Light-Responsive S-Doped TiO2 Nanocrystal. Appl. Surf. Sci. 2012, 258, 4016–4022. [Google Scholar] [CrossRef]
  58. Atuchin, V.V.; Isaenko, L.I.; Kesler, V.G.; Lin, Z.S.; Molokeev, M.S.; Yelisseyev, A.P.; Zhurkov, S.A. Exploration on Anion Ordering, Optical Properties and Electronic Structure in K3WO3F3 Elpasolite. J. Solid State Chem. 2012, 187, 159–164. [Google Scholar] [CrossRef]
  59. Ji, H.; Huang, Z.; Xia, Z.; Molokeev, M.S.; Jiang, X.; Lin, Z.; Atuchin, V.V. Comparative Investigations of the Crystal Structure and Photoluminescence Property of Eulytite-Type Ba3Eu(PO4)3 and Sr3Eu(PO4)3. Dalton Trans. 2015, 44, 7679–7686. [Google Scholar] [CrossRef]
  60. Ramana, C.V.; Carbajal-Franco, G.; Vemuri, R.S.; Troitskaia, I.B.; Gromilov, S.A.; Atuchin, V.V. Optical Properties and Thermal Stability of Germanium Oxide (GeO2) Nanocrystals with α-Quartz Structure. Mater. Sci. Eng. B 2010, 174, 279–284. [Google Scholar] [CrossRef]
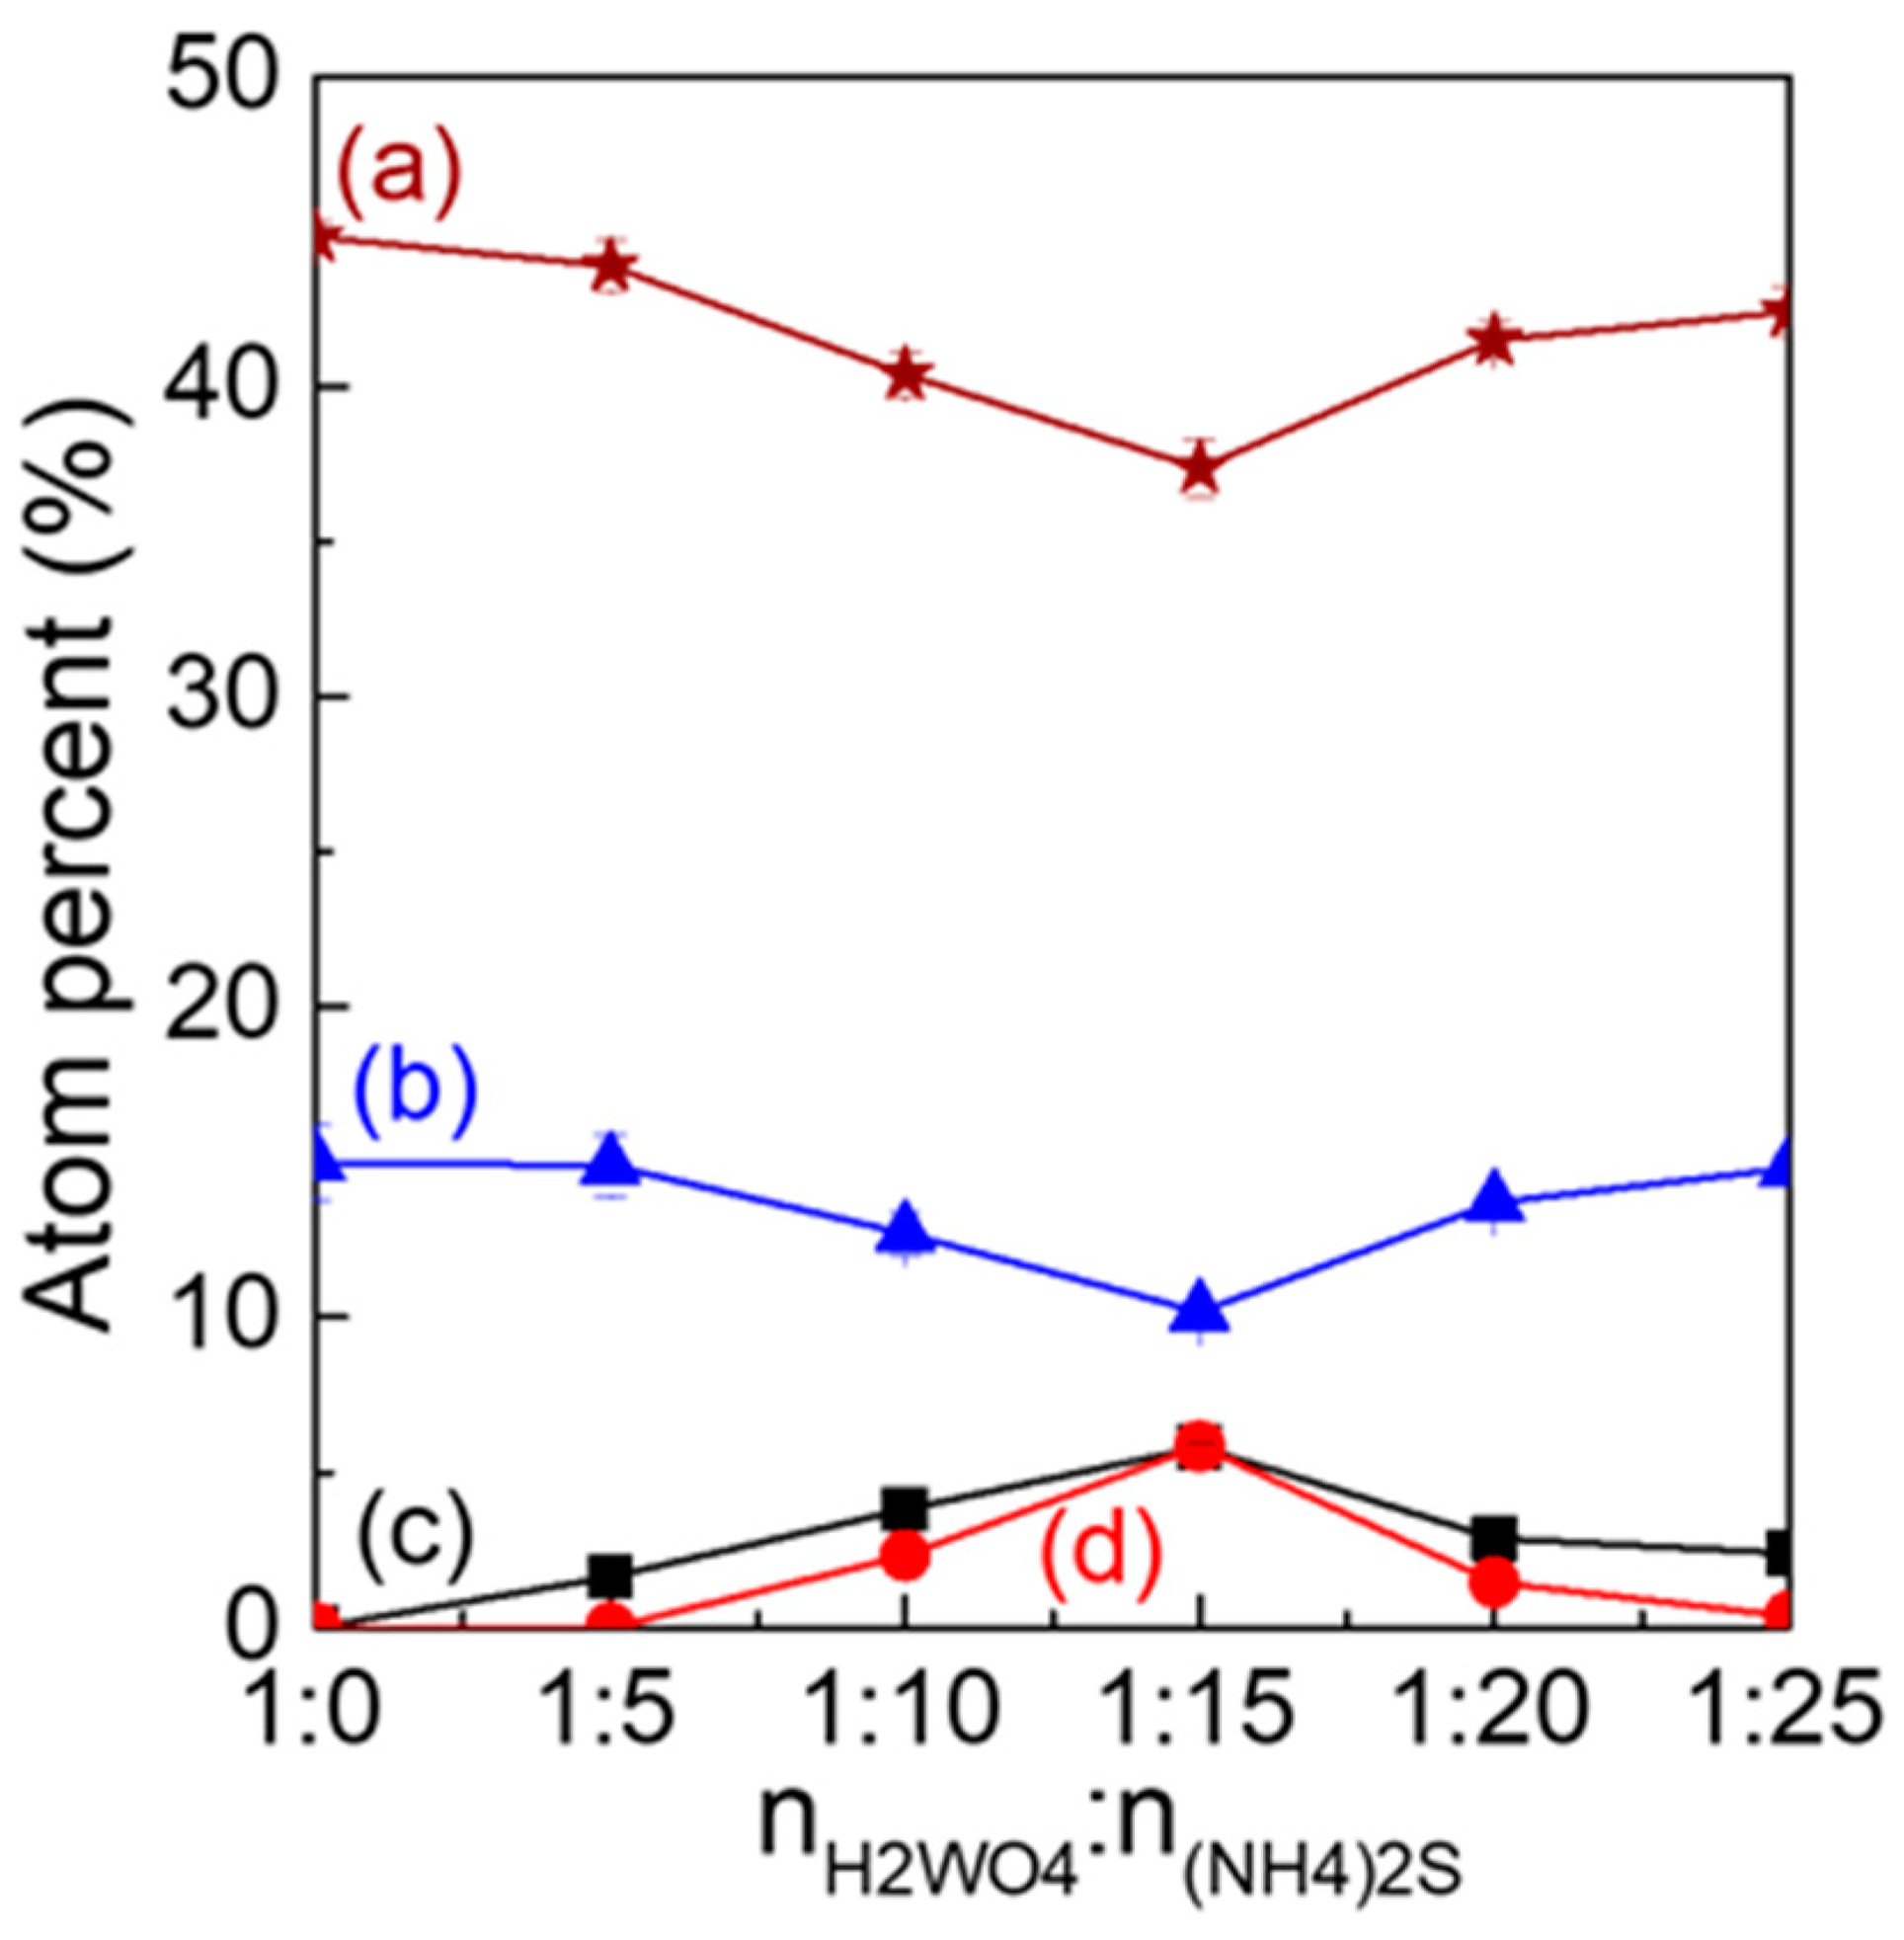
Figure 1. (A) XRD patterns and (B) Raman spectra of (a) WO3−0, (b) WO3−5, (c) WO3−10, (d) WO3−15, (e) WO3−20, and (f) WO3−25.
Nanomaterials 12 02079 g001
Figure 2. (I). SEM images of (a) WO3−0, (b) WO3−5, and (c) WO3−15 samples, respectively; (II) (a) SEM_EDX elements distribution mapping images of the WO3−15; (b) W, O, S, N layered, (c) W, (d) O, (e) S, and (f) N, respectively.
Nanomaterials 12 02079 g002
Figure 3. XPS spectra of (a) WO3−5, (b) WO3−10, and (c) WO3−15 in (A) W 4f, (B) O 2p, (C) N 1s, and (D) S 2p regions.
Nanomaterials 12 02079 g003
Figure 4. Plots of the contents of (a) O, (b) W, (c) N, and (d) S versus the addition of (NH4)2S.
Nanomaterials 12 02079 g004
Figure 5. (A) UV-Visible DRS and (B) Tauc plots based on UV-Visible DRS of (black) WO3−0, (blue) WO3−5, (wine) WO3−10, (red) WO3−15, (navy) WO3−20, and (pink) WO3−25.
Nanomaterials 12 02079 g005
Figure 6. The absorbance values at 600 nm for the synthesized materials (WO3−0, WO3−5, WO3−10, WO3−15, WO3−20, and WO3−25).
Nanomaterials 12 02079 g006
Figure 7. (A) Linear sweep voltammograms (LSV), (B) the plots of photocurrent density versus the addition of (NH4)2S, and (C) time course of the photocurrent at 0.68 V vs. Ag/AgCl (1.23 V vs. RHE) of the (a) WO3−0, (b) WO3−5, (c) WO3−10, (d) WO3−15, (e) WO3−20, and (f) WO3−25 electrodes with visible-light irradiation chopped in a 0.1 M phosphate buffer solution of pH 6.0 with visible-light irradiation (λ > 450 nm, 100 mW cm−2).
Nanomaterials 12 02079 g007
Figure 8. (A) Photocurrent density versus time profiles during PEC water oxidation in a 0.1 m phosphate buffer solution of pH 6.0 at 0.68 V vs. Ag/AgCl (1.23 V vs. RHE) and (B) O2 evolution amounts (nO2) and charge amounts during the 1 h photoelectrocatalysis upon visible-light irradiation (λ > 450 nm, 100 mWcm−2) using (a) WO3−0, (b) WO3−5, (c) WO3−10, (d) WO3−15, (e) WO3−20, and (f) WO3−25 electrodes.
Nanomaterials 12 02079 g008
Figure 9. (A) Action spectra of IPCE of the (black) WO3−0, (blue) WO3−5, (wine) WO3−10, (red) WO3−15, (navy) WO3−20, and (pink) WO3−25 electrodes. (B) Plots of IPCE values at 450 nm versus the nW:n(NH4)2S ratio for the synthesized materials (WO3−0, WO3−5, WO3−10, WO3−15, WO3−20, and WO3−25).
Nanomaterials 12 02079 g009
Table 1. Summary of physicochemical properties of various WO3 samples.
SamplesnH2WO4:n(NH4)2SMolar Ratio of nN:nW (a)Molar Ratio of nS:nW (b)Absorption
Energies (c)
(eV)
WO3−01:01:01:02.64, -
WO3−51:50.19:11:02.44, 2.10
WO3−101:100.57:10.05:12.37, 2.02
WO3−151:151.64:10.19:12.16, 1.95
WO3−201:200.31:10.07:12.34, 1.97
WO3−251:250.28:10.04:12.39, 1.98
(a),(b) The local content of N and S contents were provided from EDS measurement. (c) The transition energies were given by Tauc plots of the samples based on DRS measurement.
Publisher’s Note: MDPI stays neutral with regard to jurisdictional claims in published maps and institutional affiliations.

