
Multifunctional Hybrid MoS2-PEGylated/Au Nanostructures with Potential Theranostic Applications in Biomedicine

 , , , , and
Abstract
:
1. Introduction
2. Materials and Methods
2.1. Materials
2.1.1. Reagents
2.1.2. Cell Lines and Reagents
2.2. Methods
2.2.1. MoS2-PEG Synthesis
2.2.2. Au Nanoparticles Production
2.2.3. MoS2-PEG/Au Synthesis
2.2.4. Sample Preparation for Electrical Measurements
2.2.5. Cellular Viability Based on Resazurin Reduction Assay
2.2.6. Hoechst Nuclear Staining Assay
2.2.7. Characterization
3. Results and Discussion
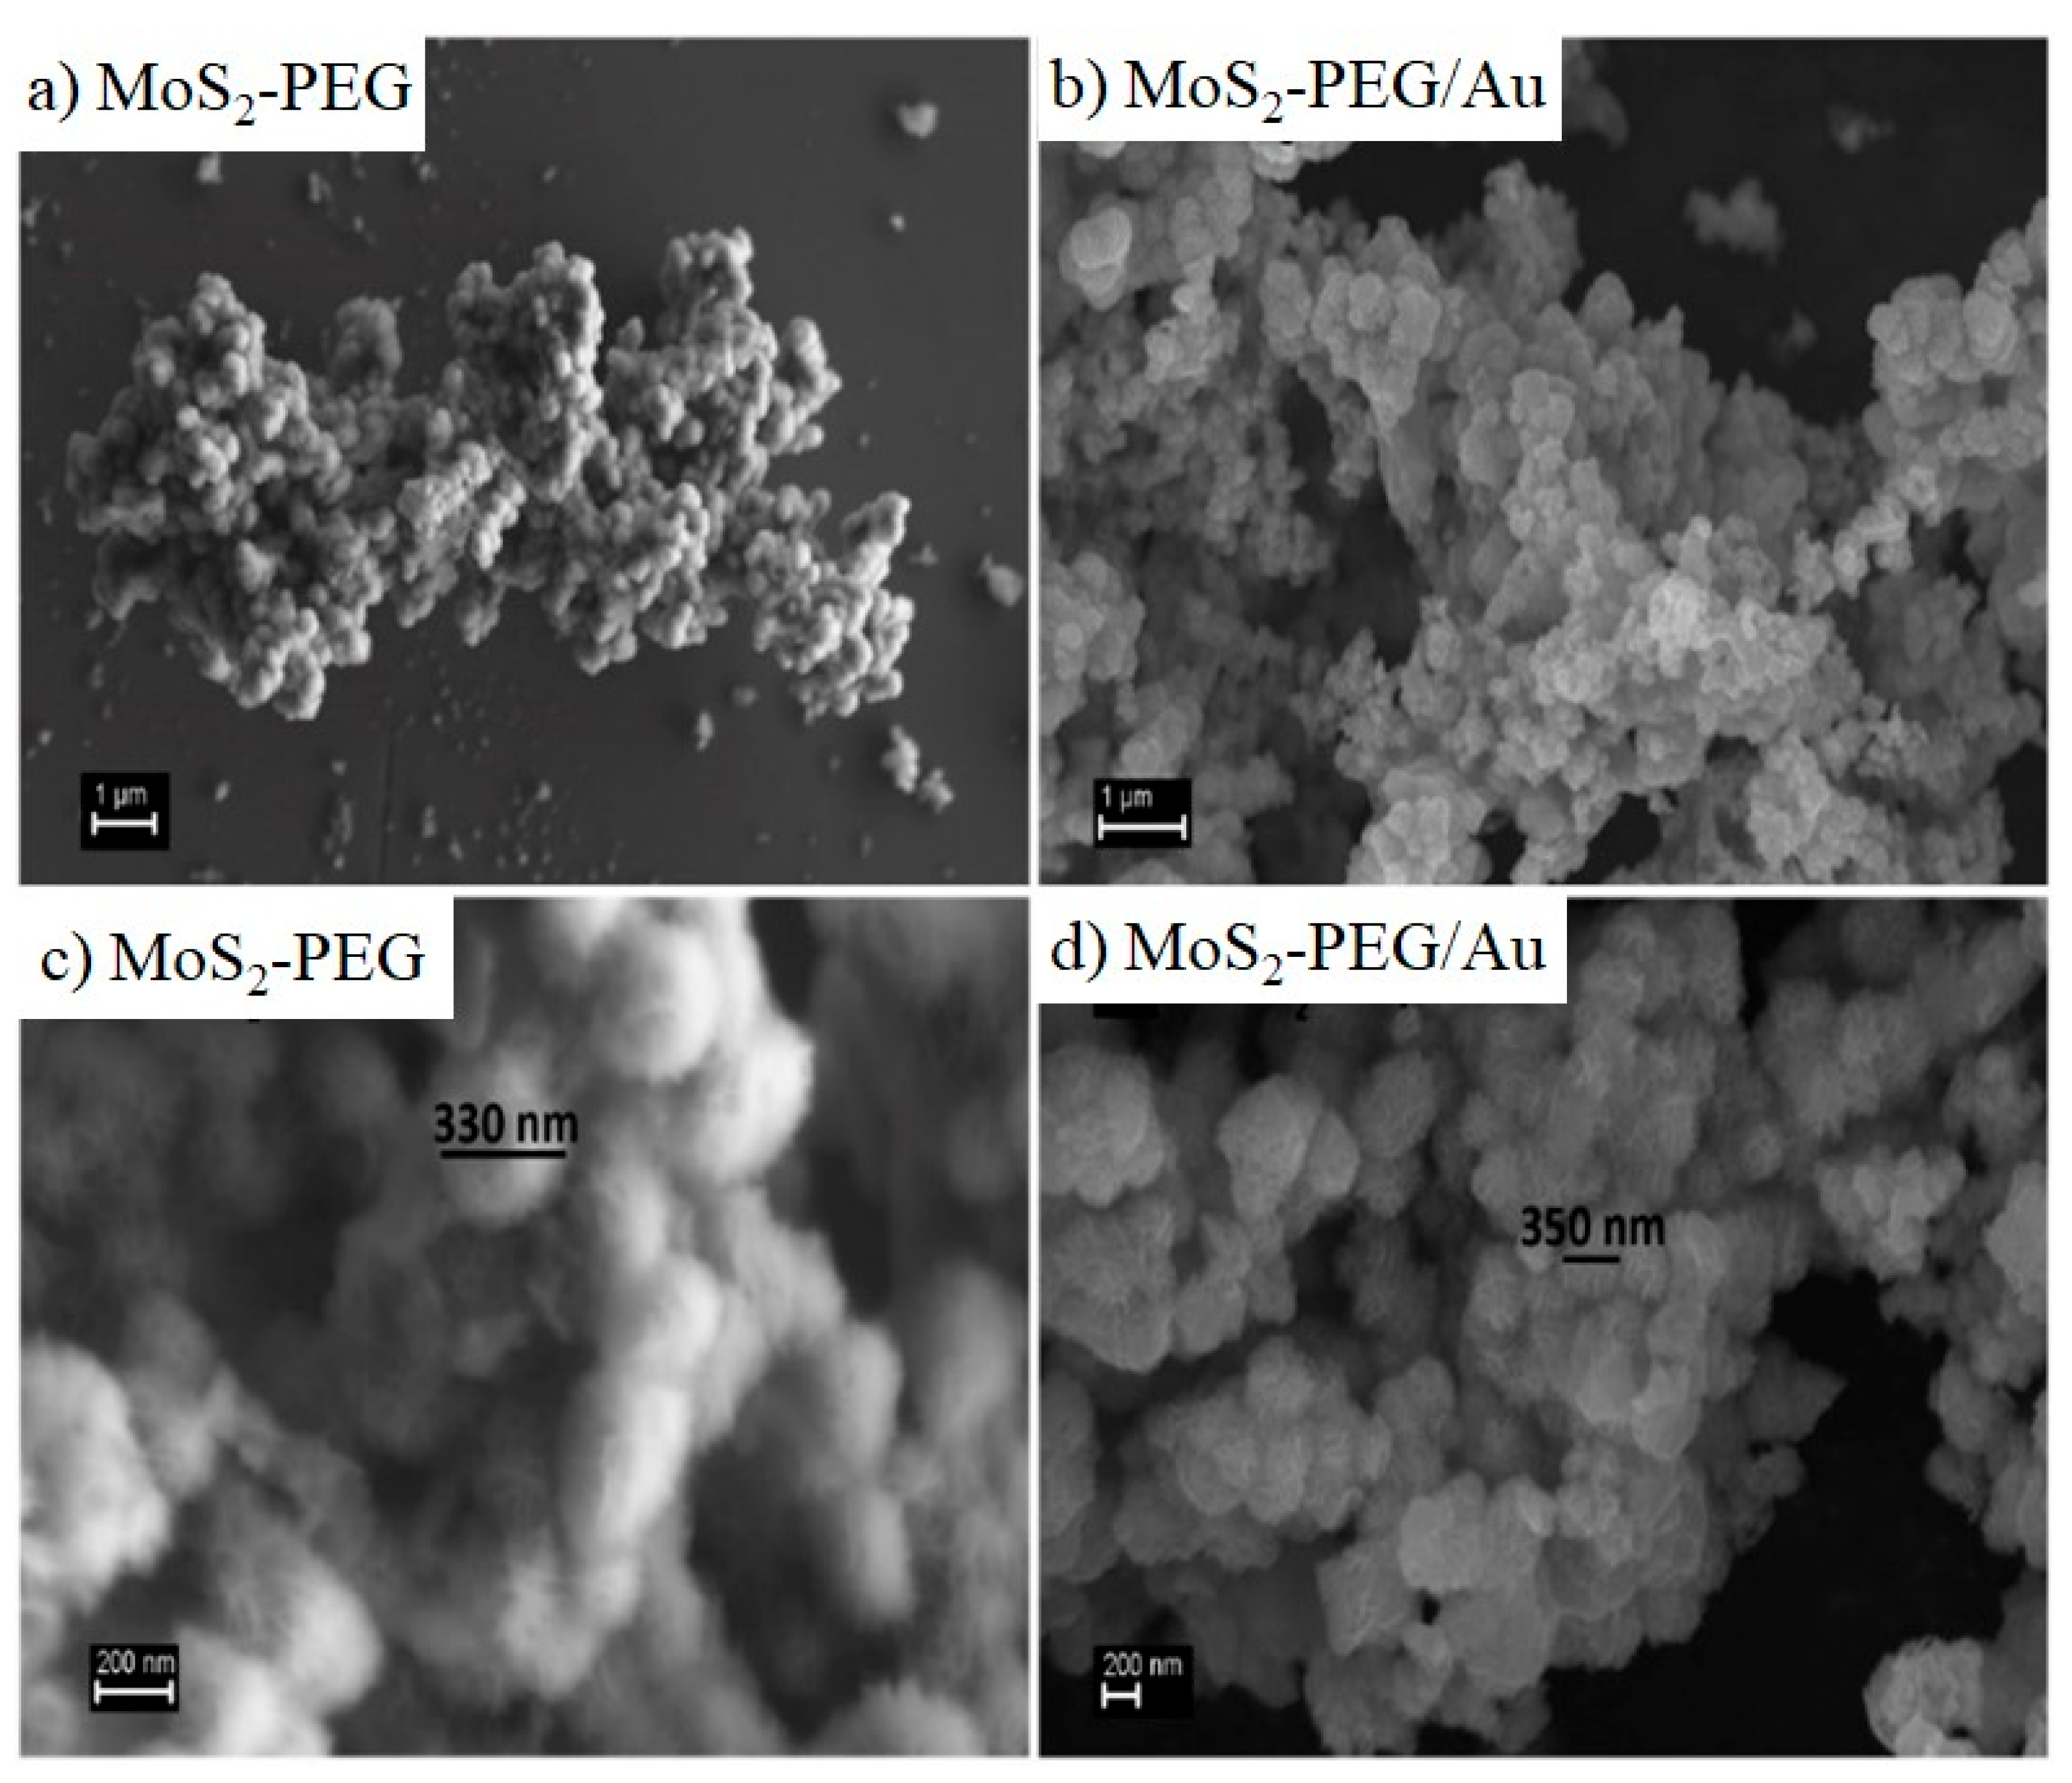
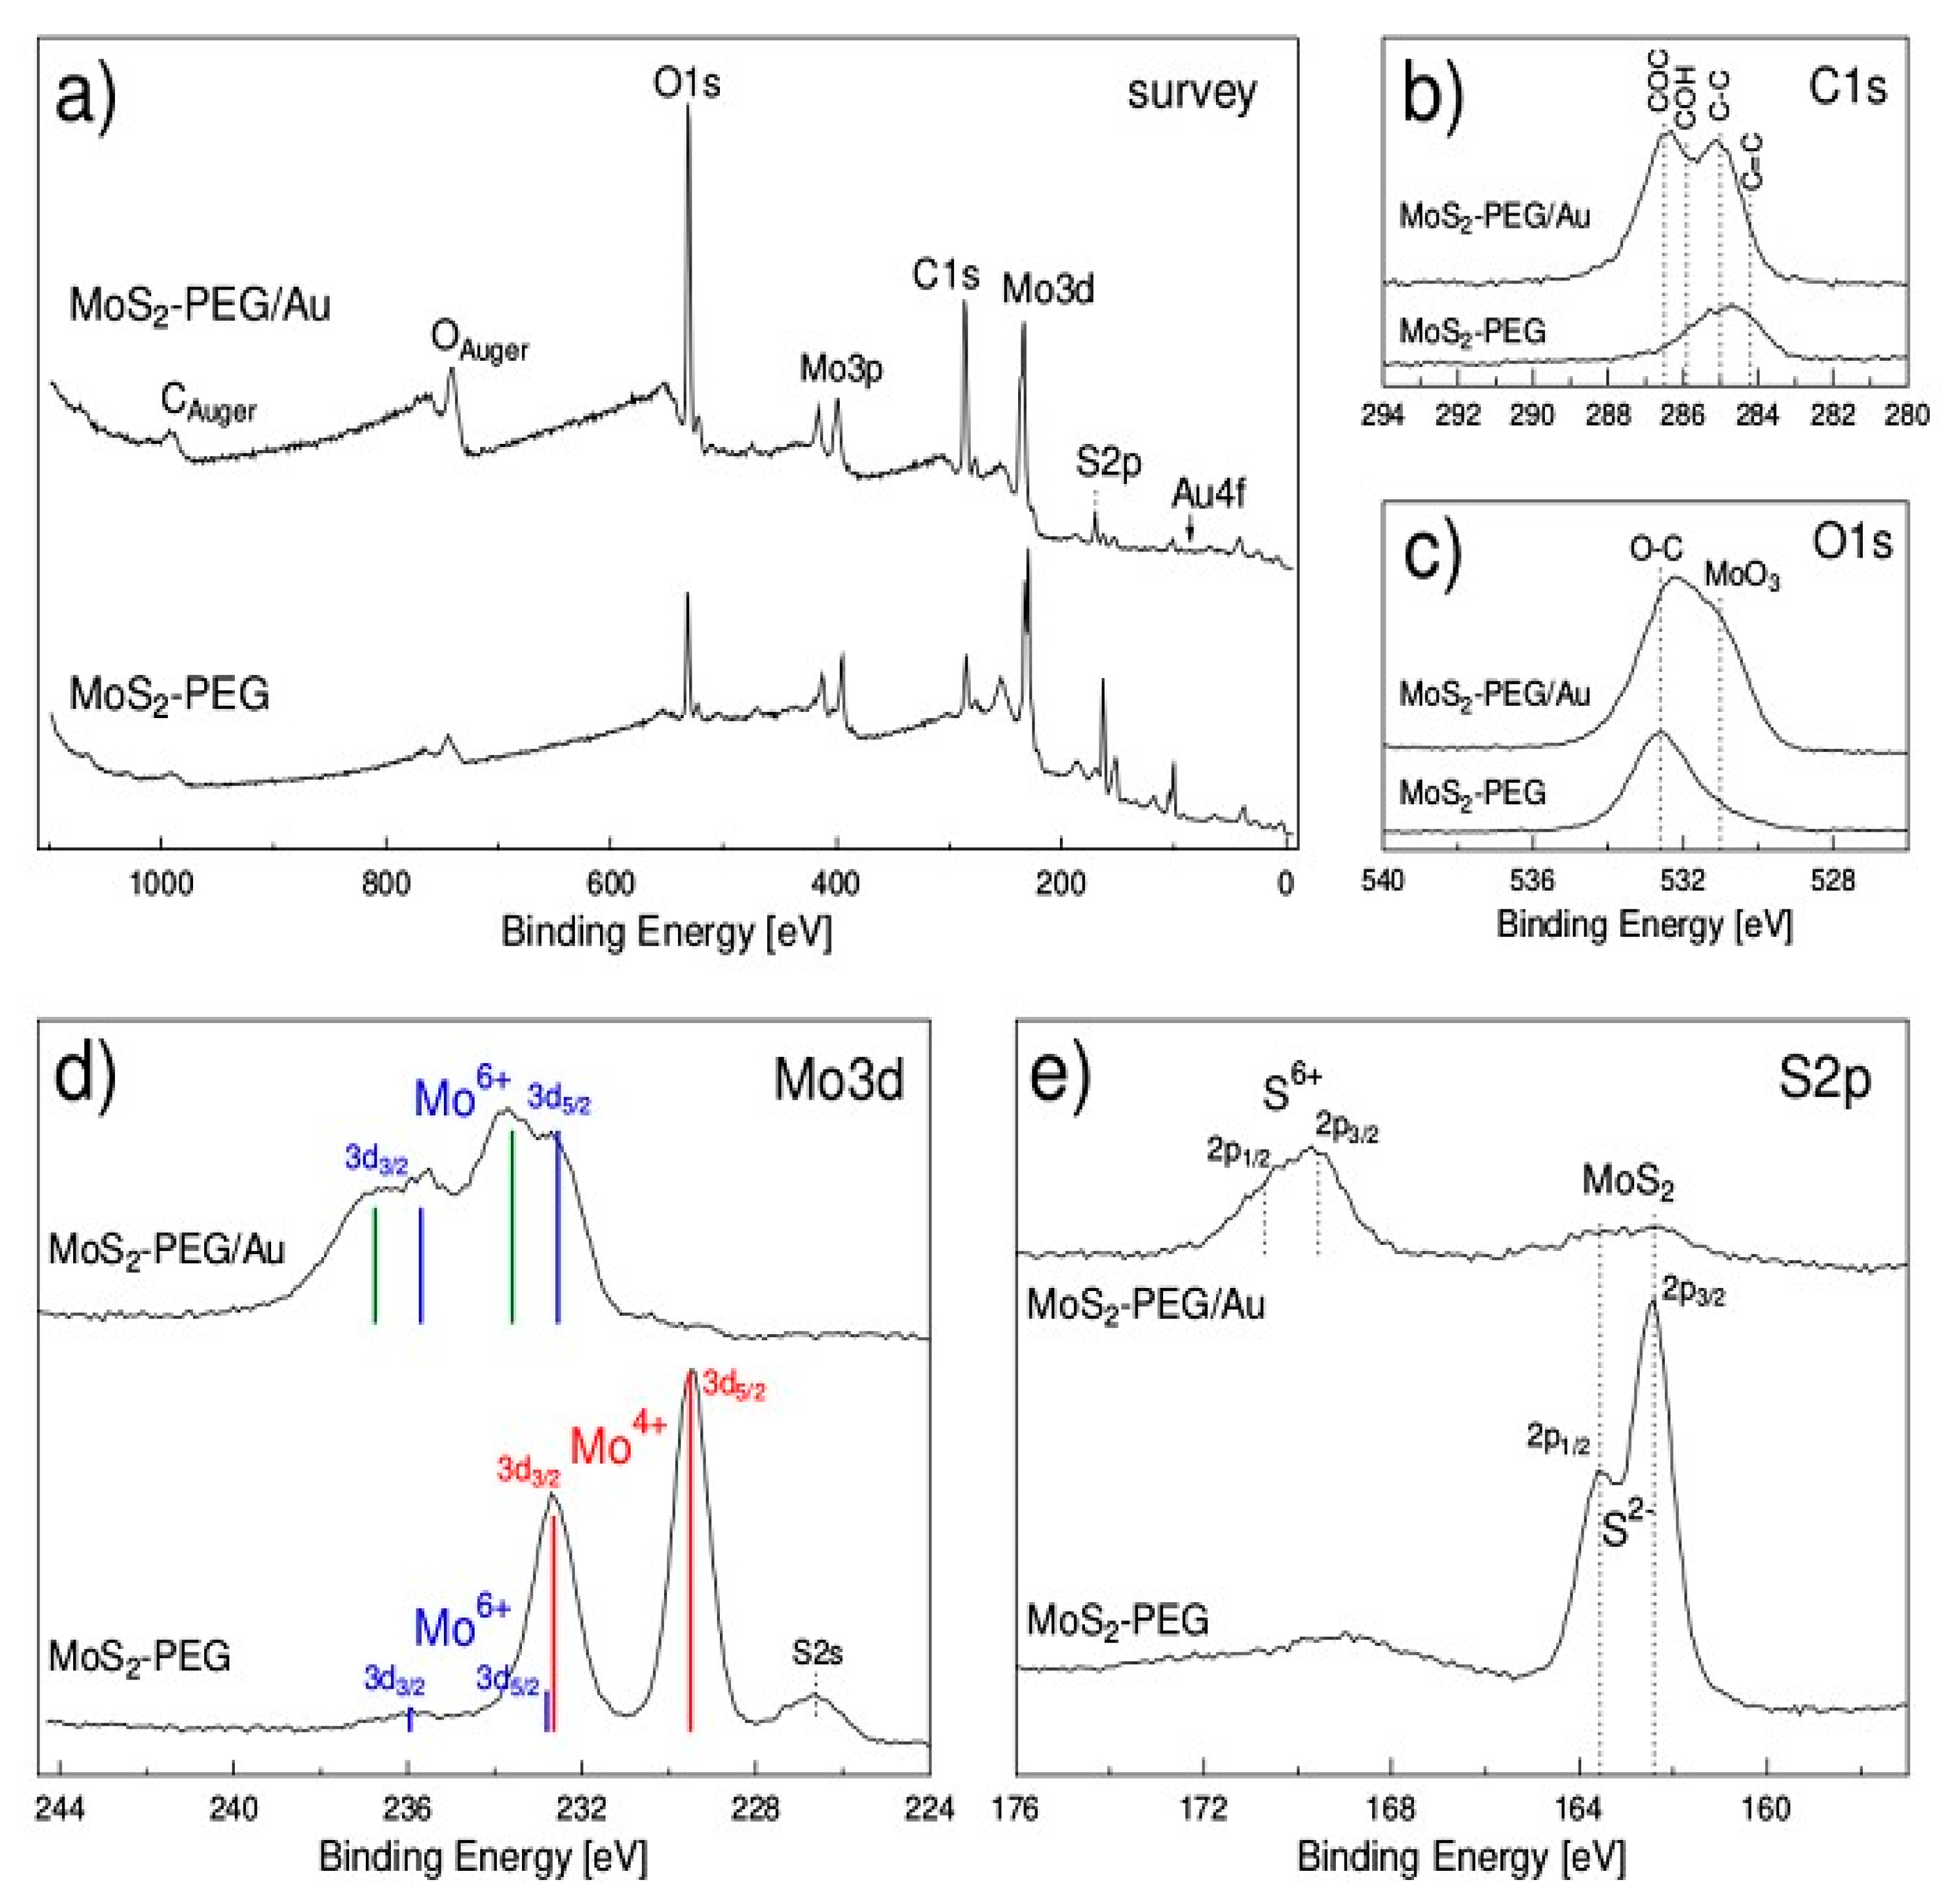
Characterization of Flower-Like MoS2-PEG/Au
4. Conclusions
Supplementary Materials
Author Contributions
Funding
Institutional Review Board Statement
Informed Consent Statement
Data Availability Statement
Acknowledgments
Conflicts of Interest
References
- Silva, W.M.; Ribeiro, H.; Taha-Tijerina, J.J. Potential Production of Theranostic Boron Nitride Nanotubes (64Cu-BNNTs) Radiolabeled by Neutron Capture. Nanomaterials 2021, 11, 2907. [Google Scholar] [CrossRef] [PubMed]
- Yoon, J.; Lim, J.; Shin, M.; Lee, S.-N.; Choi, J.-W. Graphene/MoS2 Nanohybrid for Biosensors. Materials 2021, 14, 518. [Google Scholar] [CrossRef] [PubMed]
- Wong, B.S.; Yoong, S.L.; Jagusiak, A.; Panczyk, T.; Ho, H.K.; Ang, W.H.; Pastorin, G. Carbon Nanotubes for Delivery of Small Molecule Drugs. Adv. Drug Deliv. Rev. 2013, 65, 1964–2015. [Google Scholar] [CrossRef] [PubMed]
- Kim, N.Y.; Blake, S.; De, D.; Ouyang, J.; Shi, J.; Kong, N. Two-Dimensional Nanosheet-Based Photonic Nanomedicine for Combined Gene and Photothermal Therapy. Front. Pharmacol. 2020, 10, 1–14. [Google Scholar] [CrossRef]
- Ma, B.; Bianco, A. Recent Advances in 2D Material-Mediated Immuno-Combined Cancer Therapy. Small 2021, 17, 2102557. [Google Scholar] [CrossRef]
- de Melo-Diogo, D.; Pais-Silva, C.; Dias, D.R.; Moreira, A.F.; Correia, I.J. Strategies to Improve Cancer Photothermal Therapy Mediated by Nanomaterials. Adv. Healthc. Mater. 2017, 6, 1700073. [Google Scholar] [CrossRef]
- Jain, P.K.; El-Sayed, I.H.; El-Sayed, M.A. Au Nanoparticles Target Cancer. Nano Today 2007, 2, 18–29. [Google Scholar] [CrossRef]
- Tian, B.; Wang, C.; Zhang, S.; Feng, L.; Liu, Z. Photothermally Enhanced Photodynamic Therapy Delivered by Nano-Graphene Oxide. ACS Nano 2011, 5, 7000–7009. [Google Scholar] [CrossRef]
- Robinson, J.T.; Tabakman, S.M.; Liang, Y.; Wang, H.; Sanchez Casalongue, H.; Vinh, D.; Dai, H. Ultrasmall Reduced Graphene Oxide with High Near-Infrared Absorbance for Photothermal Therapy. J. Am. Chem. Soc. 2011, 133, 6825–6831. [Google Scholar] [CrossRef]
- Li, L.; Li, J.; Shi, Y.; Du, P.; Zhang, Z.; Liu, T.; Zhang, R.; Liu, Z. On-Demand Biodegradable Boron Nitride Nanoparticles for Treating Triple Negative Breast Cancer with Boron Neutron Capture Therapy. ACS Nano 2019, 13, 13843–13852. [Google Scholar] [CrossRef]
- Qian, X.; Gu, Z.; Chen, Y. Two-Dimensional Black Phosphorus Nanosheets for Theranostic Nanomedicine. Mater. Horiz. 2017, 4, 800–816. [Google Scholar] [CrossRef]
- Cheng, L.; Liu, J.; Gu, X.; Gong, H.; Shi, X.; Liu, T.; Wang, C.; Wang, X.; Liu, G.; Xing, H.; et al. PEGylated WS2 Nanosheets as a Multifunctional Theranostic Agent for in Vivo Dual-Modal CT/Photoacoustic Imaging Guided Photothermal Therapy. Adv. Mater. 2014, 26, 1886–1893. [Google Scholar] [CrossRef]
- Wang, J.; Sui, L.; Huang, J.; Miao, L.; Nie, Y.; Wang, K.; Yang, Z.; Huang, Q.; Gong, X.; Nan, Y.; et al. MoS2-Based Nanostructures for Cancer Diagnosis and Therapy. Bioact. Mater. 2021, 6, 4209–4242. [Google Scholar] [CrossRef]
- Lu, J.; Chen, M.; Dong, L.; Cai, L.; Zhao, M.; Wang, Q.; Li, J. Molybdenum Disulfide Nanosheets: From Exfoliation Preparation to Biosensing and Cancer Therapy Applications. Colloids Surf. B Biointerfaces 2020, 194, 111162. [Google Scholar] [CrossRef]
- Xu, M.; Zhang, K.; Liu, Y.; Wang, J.; Wang, K.; Zhang, Y. Multifunctional MoS2 Nanosheets with Au NPs Grown in Situ for Synergistic Chemo-Photothermal Therapy. Colloids Surf. B Biointerfaces 2019, 184, 110551. [Google Scholar] [CrossRef]
- Feng, W.; Chen, L.; Qin, M.; Zhou, X.; Zhang, Q.; Miao, Y.; Qiu, K.; Zhang, Y.; He, C. Flower-like PEGylated MoS2 Nanoflakes for near-Infrared Photothermal Cancer Therapy. Sci. Rep. 2015, 5, 17422. [Google Scholar] [CrossRef] [Green Version]
- Wang, X.; Chang, J.; Wu, C. MoS2-Based Biomaterials for Cancer Therapy. In Biomaterials in Translational Medicine; Elsevier: Amsterdam, The Netherlands, 2019; pp. 141–161. ISBN 9780128134771. [Google Scholar]
- Ribeiro, H.; Trigueiro, J.P.C.; Silva, W.M.; Woellner, C.F.; Owuor, P.S.; Cristian Chipara, A.; Lopes, M.C.; Tiwary, C.S.; Pedrotti, J.J.; Villegas Salvatierra, R.; et al. Hybrid MoS2/h-BN Nanofillers As Synergic Heat Dissipation and Reinforcement Additives in Epoxy Nanostructures. ACS Appl. Mater. Interfaces 2019, 11, 24485–24492. [Google Scholar] [CrossRef]
- Ribeiro, H.; Trigueiro, J.P.C.; Owuor, P.S.; Machado, L.D.; Woellner, C.F.; Pedrotti, J.J.; Jaques, Y.M.; Kosolwattana, S.; Chipara, A.; Silva, W.M.; et al. Hybrid 2D Nanostructures for Mechanical Reinforcement and Thermal Conductivity Enhancement in Polymer Composites. Compos. Sci. Technol. 2018, 159, 103–110. [Google Scholar] [CrossRef]
- Appel, J.H.; Li, D.O.; Podlevsky, J.D.; Debnath, A.; Green, A.A.; Wang, Q.H.; Chae, J. Low Cytotoxicity and Genotoxicity of Two-Dimensional MoS2 and WS2. ACS Biomater. Sci. Eng. 2016, 2, 361–367. [Google Scholar] [CrossRef]
- Wang, S.; Li, K.; Chen, Y.; Chen, H.; Ma, M.; Feng, J.; Zhao, Q.; Shi, J. Biocompatible PEGylated MoS2 Nanosheets: Controllable Bottom-up Synthesis and Highly Efficient Photothermal Regression of Tumor. Biomaterials 2015, 39, 206–217. [Google Scholar] [CrossRef]
- Wang, P.; Wang, H.; Zhao, X.; Li, L.; Chen, M.; Cheng, J.; Liu, J.; Li, X. Antibacterial Activity and Cytotoxicity of Novel Silkworm-like Nisin@PEGylated MoS2. Colloids Surf. B Biointerfaces 2019, 183, 110491. [Google Scholar] [CrossRef]
- Liu, T.; Wang, C.; Cui, W.; Gong, H.; Liang, C.; Shi, X.; Li, Z.; Sun, B.; Liu, Z. Combined Photothermal and Photodynamic Therapy Delivered by PEGylated MoS2 Nanosheets. Nanoscale 2014, 6, 11219–11225. [Google Scholar] [CrossRef]
- Wang, J.; Wu, X.; Shen, P.; Wang, J.; Shen, Y.; Shen, Y.; Webster, T.J.; Deng, J. Applications of Inorganic Nanomaterials in Photothermal Therapy Based on Combinational Cancer Treatment. Int. J. Nanomed. 2020, 15, 1903–1914. [Google Scholar] [CrossRef] [Green Version]
- Xu, J.; Gulzar, A.; Liu, Y.; Bi, H.; Gai, S.; Liu, B.; Yang, D.; He, F.; Yang, P. Integration of IR-808 Sensitized Upconversion Nanostructure and MoS2 Nanosheet for 808 Nm NIR Light Triggered Phototherapy and Bioimaging. Small 2017, 13, 1701841. [Google Scholar] [CrossRef]
- Yadav, V.; Roy, S.; Singh, P.; Khan, Z.; Jaiswal, A. 2D MoS2-Based Nanomaterials for Therapeutic, Bioimaging, and Biosensing Applications. Small 2019, 15, 1803706. [Google Scholar] [CrossRef] [Green Version]
- Xie, W.; Gao, Q.; Wang, D.; Guo, Z.; Gao, F.; Wang, X.; Cai, Q.; Feng, S.; Fan, H.; Sun, X.; et al. Doxorubicin-Loaded Fe3O4@MoS2-PEG-2DG Nanocubes as a Theranostic Platform for Magnetic Resonance Imaging-Guided Chemo-Photothermal Therapy of Breast Cancer. Nano Res. 2018, 11, 2470–2487. [Google Scholar] [CrossRef]
- Shi, J.; Zhang, H.; Chen, Z.; Xu, L.; Zhang, Z. A Multi-Functional Nanoplatform for Efficacy Tumor Theranostic Applications. Asian J. Pharm. Sci. 2017, 12, 235–249. [Google Scholar] [CrossRef]
- Reis, D.S.; de Oliveira, V.L.; Silva, M.L.; Paniago, R.M.; Ladeira, L.O.; Andrade, L.M. Gold Nanoparticles Enhance Fluorescence Signals by Flow Cytometry at Low Antibody Concentrations. J. Mater. Chem. B 2021, 9, 1414–1423. [Google Scholar] [CrossRef] [PubMed]
- Liu, L.; Wang, J.; Tan, X.; Pang, X.; You, Q.; Sun, Q.; Tan, F.; Li, N. Photosensitizer Loaded PEG-MoS2-Au Hybrids for CT/NIRF Imaging-Guided Stepwise Photothermal and Photodynamic Therapy. J. Mater. Chem. B 2017, 5, 2286–2296. [Google Scholar] [CrossRef]
- Liu, M.; Zhu, H.; Wang, Y.; Sevencan, C.; Li, B.L. Functionalized MoS2-Based Nanomaterials for Cancer Phototherapy and Other Biomedical Applications. ACS Mater. Lett. 2021, 3, 462–496. [Google Scholar] [CrossRef]
- Zhang, H.; Fan, T.; Chen, W.; Li, Y.; Wang, B. Recent Advances of Two-Dimensional Materials in Smart Drug Delivery Nano-Systems. Bioact. Mater. 2020, 5, 1071–1086. [Google Scholar] [CrossRef] [PubMed]
- Meireles, I.B.D.C.J.; Cipreste, M.F.; Gastelois, P.L.; Macedo, W.A.D.A.; Gomes, D.A.; de Sousa, E.M.B. Synthesis and Characterization of Gold Nanorods Coated by Mesoporous Silica MCM-41 as a Platform for Bioapplication in Photohyperthermia. Nanotechnology 2021, 32, 505720. [Google Scholar] [CrossRef] [PubMed]
- Kumari, S.; Gusain, R.; Kumar, N.; Khatri, O.P. PEG-Mediated Hydrothermal Synthesis of Hierarchical Microspheres of MoS2 Nanosheets and Their Potential for Lubrication Application. J. Ind. Eng. Chem. 2016, 42, 87–94. [Google Scholar] [CrossRef]
- Lalithambika, K.C.; Shanmugapriya, K.; Sriram, S. Photocatalytic Activity of MoS2 Nanoparticles: An Experimental and DFT Analysis. Appl. Phys. A 2019, 125, 817. [Google Scholar] [CrossRef]
- Viet Long, N.; Ohtaki, M.; Yuasa, M.; Yoshida, S.; Kuragaki, T.; Minh Thi, C.; Nogami, M. Synthesis and Self-Assembly of Gold Nanoparticles by Chemically Modified Polyol Methods under Experimental Control. J. Nanomater. 2013, 2013, 793125. [Google Scholar] [CrossRef]
- Maugé, F.; Lamotte, J.; Nesterenko, N.S.; Manoilova, O.; Tsyganenko, A.A. FT-IR Study of Surface Properties of Unsupported MoS2. Catal. Today 2001, 70, 271–284. [Google Scholar] [CrossRef]
- Perumal Veeramalai, C.; Li, F.; Xu, H.; Kim, T.W.; Guo, T. One Pot Hydrothermal Synthesis of Graphene like MoS2 Nanosheets for Application in High Performance Lithium Ion Batteries. RSC Adv. 2015, 5, 57666–57670. [Google Scholar] [CrossRef]
- Ali, G.A.M.; Thalji, M.R.; Soh, W.C.; Algarni, H.; Chong, K.F. One-Step Electrochemical Synthesis of MoS2/Graphene Composite for Supercapacitor Application. J. Solid State Electrochem. 2020, 24, 25–34. [Google Scholar] [CrossRef]
- Liu, T.; Wang, C.; Gu, X.; Gong, H.; Cheng, L.; Shi, X.; Feng, L.; Sun, B.; Liu, Z. Drug Delivery with PEGylated MoS2 Nano-Sheets for Combined Photothermal and Chemotherapy of Cancer. Adv. Mater. 2014, 26, 3433–3440. [Google Scholar] [CrossRef]
- Chen, J.; Xu, Z.; Hu, Y.; Yi, M. PEG-assisted Solvothermal Synthesis of MoS2 Nanosheets with Enhanced Tribological Property. Lubr. Sci. 2020, 32, 273–282. [Google Scholar] [CrossRef]
- Sagitova, E.A.; Prokhorov, K.A.; Nikolaeva, G.Y.; Baimova, A.V.; Pashinin, P.P.; Yarysheva, A.Y.; Mendeleev, D.I. Raman Analysis of Polyethylene Glycols and Polyethylene Oxides. J. Phys. Conf. Ser. 2018, 999, 012002. [Google Scholar] [CrossRef]
- Wang, T.; Liu, W.; Tian, J. Preparation and Characterization of Gold/Poly(Vinyl Alcohol)/MoS2 Intercalation Nanostructure. J. Mater. Sci. Mater. Electron. 2004, 15, 435–438. [Google Scholar] [CrossRef]
- Dinç, C.Ö.; Güner, A. Solid-State Characterization of Poly(Ethylene Glycol) Samples Prepared by Solvent Cast Technique. Bulg. Chem. Commun. 2017, 49, 14–20. [Google Scholar]
- Socrates, G. Infrared and Raman Characteristic Group Frequencies: Tables and Charts, 3rd ed.; John Wiley & Sons Ltd.: London, UK, 2001; ISBN 978-0-470-09307-8. [Google Scholar]
- León, A.; Reuquen, P.; Garín, C.; Segura, R.; Vargas, P.; Zapata, P.; Orihuela, P. FTIR and Raman Characterization of TiO2 Nanoparticles Coated with Polyethylene Glycol as Carrier for 2-Methoxyestradiol. Appl. Sci. 2017, 7, 49. [Google Scholar] [CrossRef]
- Constantinescu, M.; Dumitrache, L.; Constantinescu, D.; Anghel, E.M.; Popa, V.T.; Stoica, A.; Olteanu, M. Latent Heat Nano Composite Building Materials. Eur. Polym. J. 2010, 46, 2247–2254. [Google Scholar] [CrossRef]
- Kozielski, M.; Mühle, M.; Błaszczak, Z. The Raman Scattering Study of Selected Polyoxyethyleneglycols. J. Mol. Liq. 2004, 111, 1–5. [Google Scholar] [CrossRef]
- Ntakadzeni, M.; Anku, W.W.; Kumar, N.; Govender, P.P.; Reddy, L. PEGylated MoS2 Nanosheets: A Dual Functional Photocatalyst for Photodegradation of Organic Dyes and Photoreduction of Chromium from Aqueous Solution. Bull. Chem. React. Eng. Catal. 2019, 14, 142. [Google Scholar] [CrossRef] [Green Version]
- Tiwari, N. Study of Adsorption Behavior of Aminothiophenols on Gold Nanorods Using Surface-Enhanced Raman Spectroscopy. J. Nanophotonics 2011, 5, 053513. [Google Scholar] [CrossRef]
- López, G.P.; Castner, D.G.; Ratner, B.D. XPS O 1s Binding Energies for Polymers Containing Hydroxyl, Ether, Ketone and Ester Groups. Surf. Interface Anal. 1991, 17, 267–272. [Google Scholar] [CrossRef]
- Syari’ati, A.; Kumar, S.; Zahid, A.; Ali El Yumin, A.; Ye, J.; Rudolf, P. Photoemission Spectroscopy Study of Structural Defects in Molybdenum Disulfide (MoS2) Grown by Chemical Vapor Deposition (CVD). Chem. Commun. 2019, 55, 10384–10387. [Google Scholar] [CrossRef] [Green Version]
- Wang, R.; Chen, C.; Zheng, Y.; Wang, H.; Liu, J.-W.; Yu, S.-H. Structure–Property Relationship of Assembled Nanowire Materials. Mater. Chem. Front. 2020, 4, 2881–2903. [Google Scholar] [CrossRef]
- Polyakov, A.Y.; Yadgarov, L.; Popovitz-Biro, R.; Lebedev, V.A.; Pinkas, I.; Rosentsveig, R.; Feldman, Y.; Goldt, A.E.; Goodilin, E.A.; Tenne, R. Decoration of WS2 Nanotubes and Fullerene-Like MoS2 with Gold Nanoparticles. J. Phys. Chem. C 2014, 118, 2161–2169. [Google Scholar] [CrossRef]
- Vinita; Nirala, N.R.; Prakash, R. One Step Synthesis of AuNPs@MoS2-QDs Composite as a Robust Peroxidase-Mimetic for Instant Unaided Eye Detection of Glucose in Serum, Saliva and Tear. Sens. Actuators B Chem. 2018, 263, 109–119. [Google Scholar] [CrossRef]
- Wang, R.; Li, Q.; Cheng, L.; Li, H.; Wang, B.; Zhao, X.S.; Guo, P. Electrochemical Properties of Manganese Ferrite-Based Supercapacitors in Aqueous Electrolyte: The Effect of Ionic Radius. Colloids Surf. A Physicochem. Eng. Asp. 2014, 457, 94–99. [Google Scholar] [CrossRef] [Green Version]
- Liu, T.; Wang, K.; Chen, Y.; Zhao, S.; Han, Y. Dominant Role of Wettability in Improving the Specific Capacitance. Green Energy Environ. 2019, 4, 171–179. [Google Scholar] [CrossRef]
- Taberna, P.L.; Portet, C.; Simon, P. Electrode Surface Treatment and Electrochemical Impedance Spectroscopy Study on Carbon/Carbon Supercapacitors. Appl. Phys. A 2006, 82, 639–646. [Google Scholar] [CrossRef]
- Yamada, Y.; Sasaki, T.; Tatsuda, N.; Weingarth, D.; Yano, K.; Kötz, R. A Novel Model Electrode for Investigating Ion Transport inside Pores in an Electrical Double-Layer Capacitor: Monodispered Microporous Starburst Carbon Spheres. Electrochim. Acta 2012, 81, 138–148. [Google Scholar] [CrossRef]
- Versiani, A.F.; Andrade, L.M.; Martins, E.M.N.; Scalzo, S.; Geraldo, J.M.; Chaves, C.R.; Ferreira, D.C.; Ladeira, M.; Guatimosim, S.; Ladeira, L.O.; et al. Gold Nanoparticles and Their Applications in Biomedicine. Future Virol. 2016, 11, 293–309. [Google Scholar] [CrossRef]
- Andrade, L.M.; Martins, E.M.N.; Versiani, A.F.; Reis, D.S.; da Fonseca, F.G.; Souza, I.P.d.; Paniago, R.M.; Pereira-Maia, E.; Ladeira, L.O. The Physicochemical and Biological Characterization of a 24-Month-Stored Nanocomplex Based on Gold Nanoparticles Conjugated with Cetuximab Demonstrated Long-Term Stability, EGFR Affinity and Cancer Cell Death Due to Apoptosis. Mater. Sci. Eng. C 2020, 107, 110203. [Google Scholar] [CrossRef]
- Steckiewicz, K.P.; Barcinska, E.; Malankowska, A.; Zauszkiewicz–Pawlak, A.; Nowaczyk, G.; Zaleska-Medynska, A.; Inkielewicz-Stepniak, I. Impact of Gold Nanoparticles Shape on Their Cytotoxicity against Human Osteoblast and Osteosarcoma in in Vitro Model. Evaluation of the Safety of Use and Anti-Cancer Potential. J. Mater. Sci. Mater. Med. 2019, 30, 22. [Google Scholar] [CrossRef] [Green Version]
- Kooij, E.S.; Ahmed, W.; Hellenthal, C.; Zandvliet, H.J.W.; Poelsema, B. From Nanorods to Nanostars: Tuning the Optical Properties of Gold Nanoparticles. Colloids Surf. A Physicochem. Eng. Asp. 2012, 413, 231–238. [Google Scholar] [CrossRef]
- Zhong, X.; Chai, Y.-Q.; Yuan, R. A Novel Strategy for Synthesis of Hollow Gold Nanosphere and Its Application in Electrogenerated Chemiluminescence Glucose Biosensor. Talanta 2014, 128, 9–14. [Google Scholar] [CrossRef] [PubMed]
- Pedrotti, J.J.; Angnes, L.; Gutz, I.G.R. Miniaturized Reference Electrodes with Microporous Polymer Junctions. Electroanalysis 1996, 8, 673–675. [Google Scholar] [CrossRef]


| Samples | ||
|---|---|---|
| Electrical Parameters | MoS2-PEG | MoS2-PEG/Au |
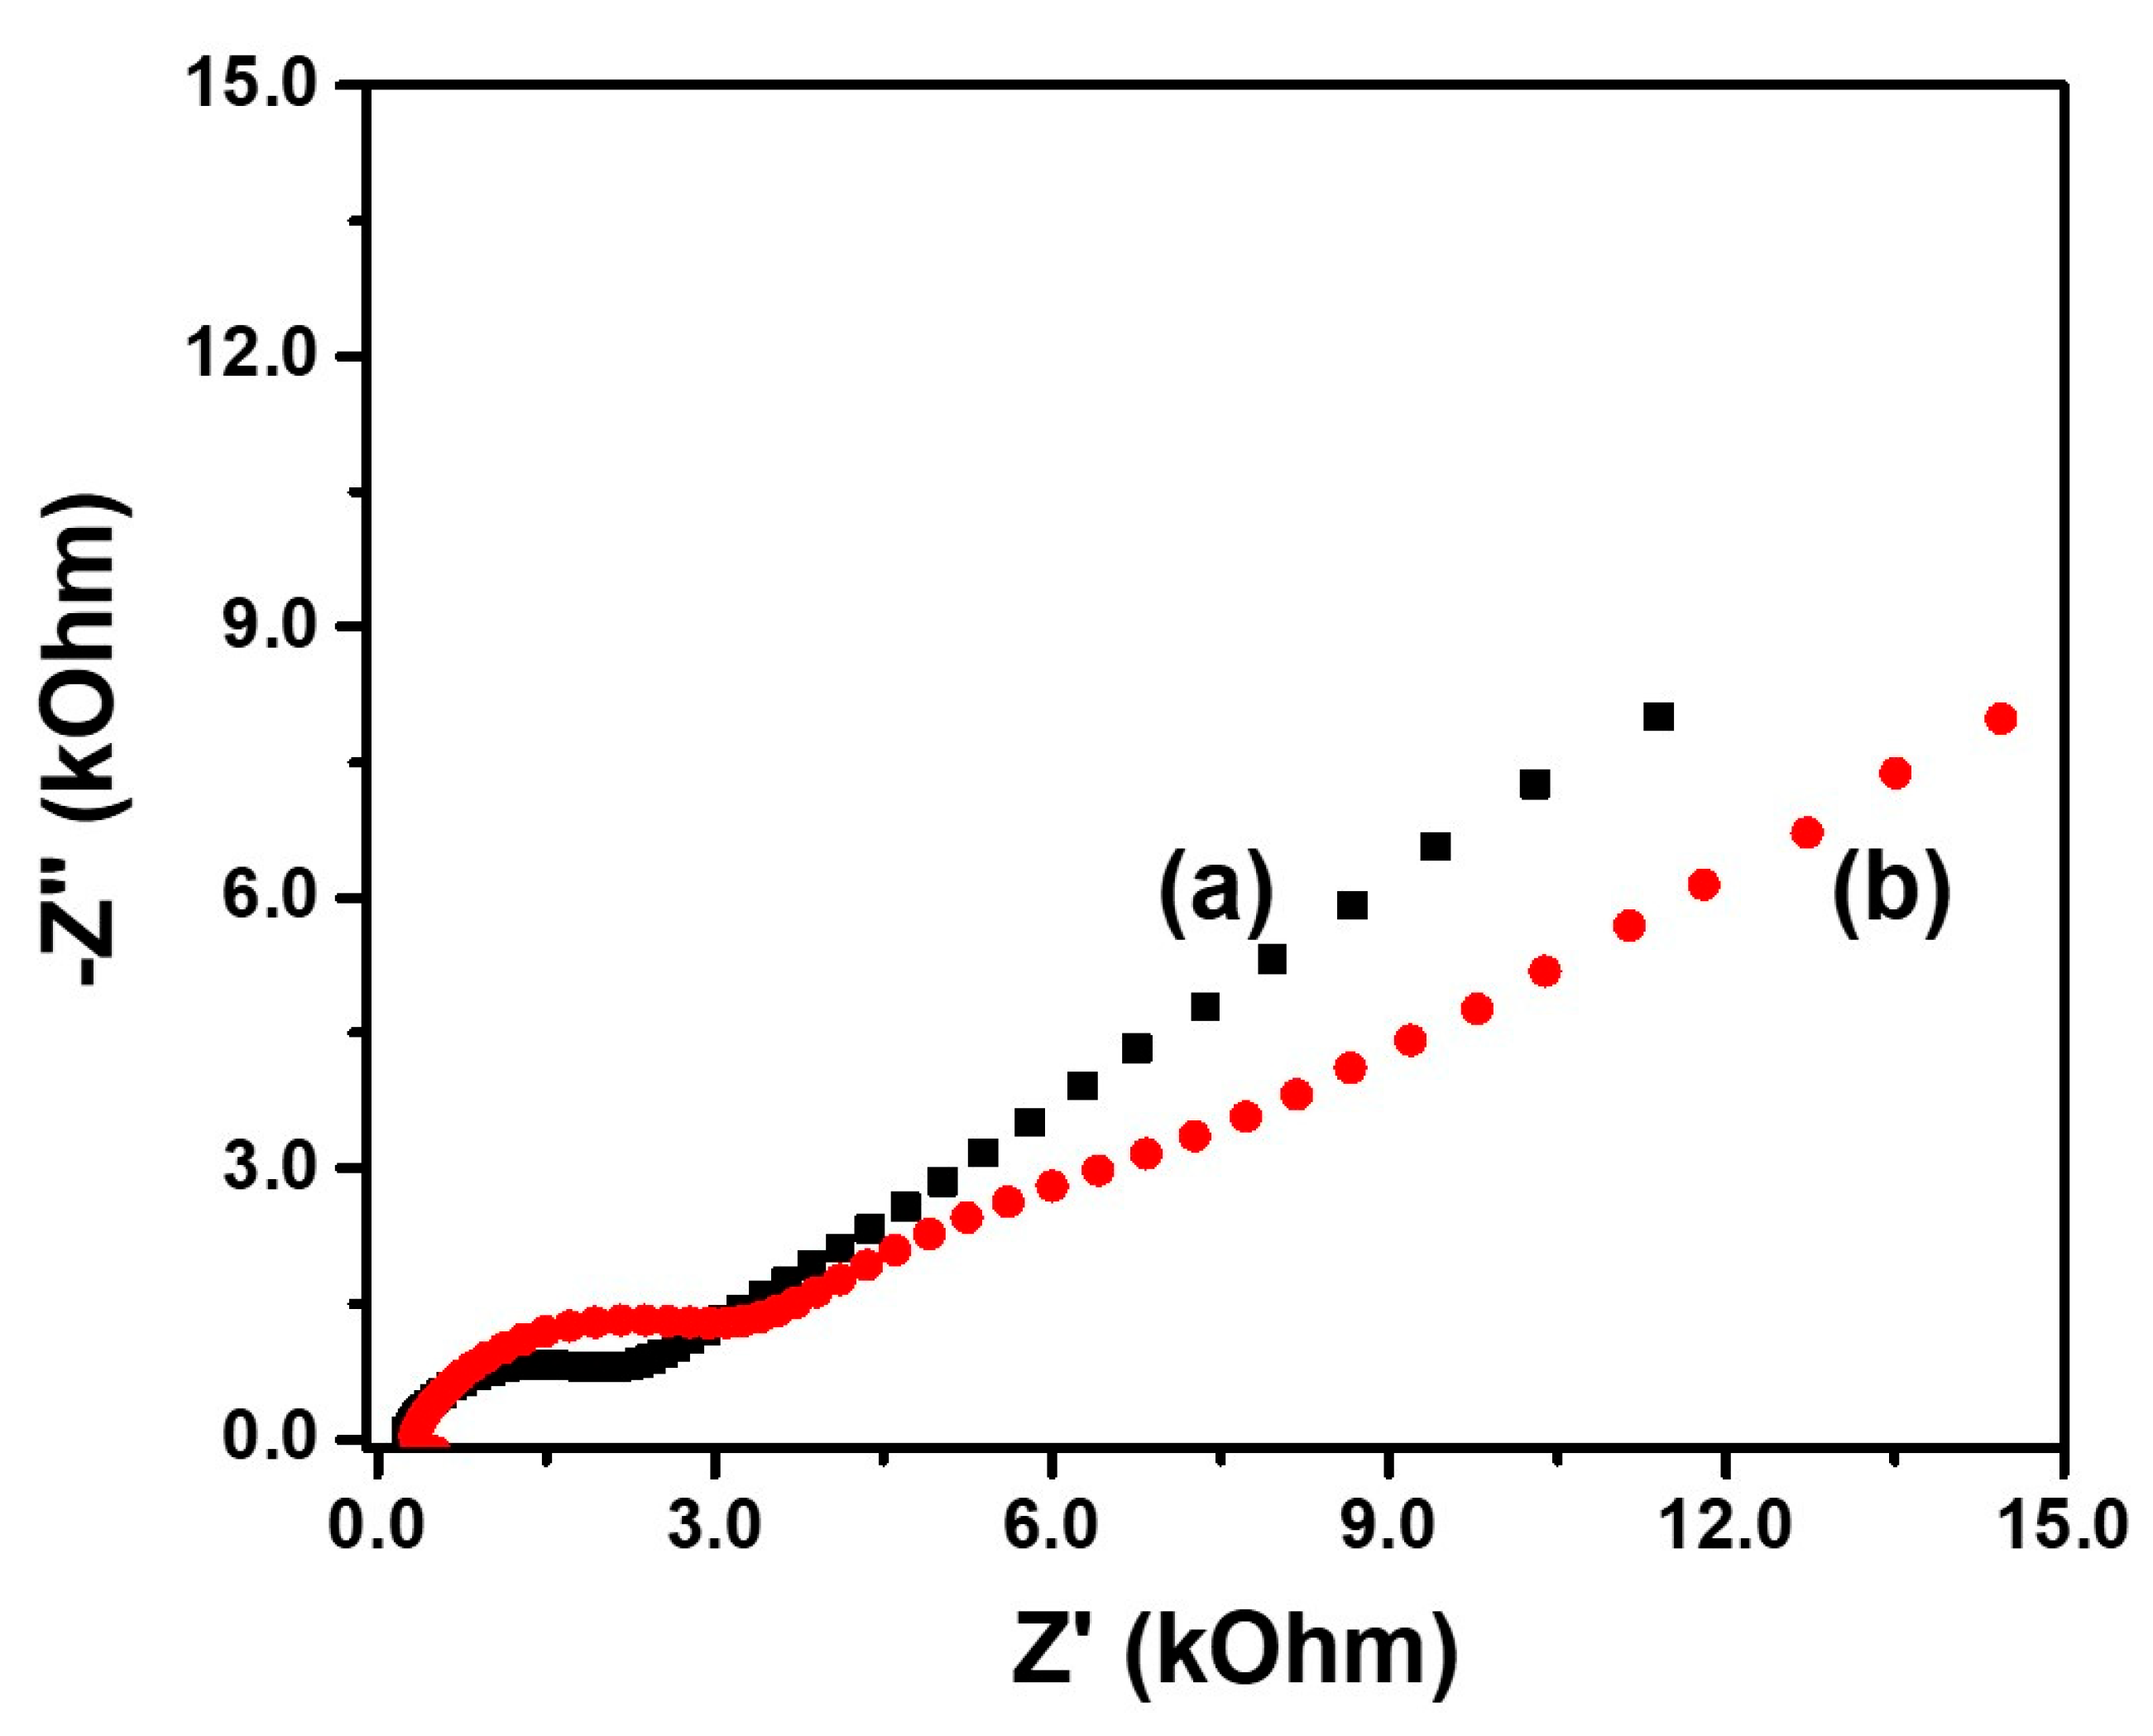
| Sheet resistance (kΩ sq−1) | 671.4 | 218.1 |
| Resistivity (Ω m) | 1342.7 | 436.2 |
| Conductivity (10−6 S cm−1) | 7.4 | 22.9 |
| Materials | Contact Angle (°) |
|---|---|
| Graphite (substrate) | 58.1 ± 3.9 |
| MoS2-PEG | 30.7 ± 3.4 |
| MoS2-PEG/Au | 37.1 ± 2.1 |
Publisher’s Note: MDPI stays neutral with regard to jurisdictional claims in published maps and institutional affiliations. |
© 2022 by the authors. Licensee MDPI, Basel, Switzerland. This article is an open access article distributed under the terms and conditions of the Creative Commons Attribution (CC BY) license (https://creativecommons.org/licenses/by/4.0/).
Share and Cite
Malagrino, T.R.S.; Godoy, A.P.; Barbosa, J.M.; Lima, A.G.T.; Sousa, N.C.O.; Pedrotti, J.J.; Garcia, P.S.; Paniago, R.M.; Andrade, L.M.; Domingues, S.H.; et al. Multifunctional Hybrid MoS2-PEGylated/Au Nanostructures with Potential Theranostic Applications in Biomedicine. Nanomaterials 2022, 12, 2053. https://doi.org/10.3390/nano12122053
Malagrino TRS, Godoy AP, Barbosa JM, Lima AGT, Sousa NCO, Pedrotti JJ, Garcia PS, Paniago RM, Andrade LM, Domingues SH, et al. Multifunctional Hybrid MoS2-PEGylated/Au Nanostructures with Potential Theranostic Applications in Biomedicine. Nanomaterials. 2022; 12(12):2053. https://doi.org/10.3390/nano12122053
Chicago/Turabian StyleMalagrino, Thiago R. S., Anna P. Godoy, Juliano M. Barbosa, Abner G. T. Lima, Nei C. O. Sousa, Jairo J. Pedrotti, Pamela S. Garcia, Roberto M. Paniago, Lídia M. Andrade, Sergio H. Domingues, and et al. 2022. "Multifunctional Hybrid MoS2-PEGylated/Au Nanostructures with Potential Theranostic Applications in Biomedicine" Nanomaterials 12, no. 12: 2053. https://doi.org/10.3390/nano12122053
APA StyleMalagrino, T. R. S., Godoy, A. P., Barbosa, J. M., Lima, A. G. T., Sousa, N. C. O., Pedrotti, J. J., Garcia, P. S., Paniago, R. M., Andrade, L. M., Domingues, S. H., Silva, W. M., Ribeiro, H., & Taha-Tijerina, J. (2022). Multifunctional Hybrid MoS2-PEGylated/Au Nanostructures with Potential Theranostic Applications in Biomedicine. Nanomaterials, 12(12), 2053. https://doi.org/10.3390/nano12122053