Article

Ratiometric Upconversion Temperature Sensor Based on Cellulose Fibers Modified with Yttrium Fluoride Nanoparticles

by
Małgorzata Skwierczyńska
1,*,
Natalia Stopikowska
1,
Piotr Kulpiński
2,
Magdalena Kłonowska
3,
Stefan Lis
1 and
Marcin Runowski
1,4
1
Department of Rare Earths, Faculty of Chemistry, Adam Mickiewicz University, Uniwersytetu Poznańskiego 8, 61-614 Poznań, Poland
2
Department of Mechanical Engineering, Informatics and Chemistry of Polymer Materials, Faculty of Material Technologies and Textile Design, Lodz University of Technology, Żeromskiego 116, 90-924 Łódź, Poland
3
Department of Knitting Technology and Textile Machines, Faculty of Material Technologies and Textile Design, Lodz University of Technology, Żeromskiego 116, 90-924 Łódź, Poland
4
Departamento de Física, IMN and IUdEA, Universidad de La Laguna, Apdo. Correos 456, E-38200 La Laguna, Spain
*
Author to whom correspondence should be addressed.
Nanomaterials 2022, 12(11), 1926; https://doi.org/10.3390/nano12111926
Submission received: 13 May 2022 / Revised: 26 May 2022 / Accepted: 2 June 2022 / Published: 4 June 2022
(This article belongs to the Section Nanoelectronics, Nanosensors and Devices)

Abstract

:
In this study, an optical thermometer based on regenerated cellulose fibers modified with YF3: 20% Yb3+, 2% Er3+ nanoparticles was developed. The presented sensor was fabricated by introducing YF3 nanoparticles into cellulose fibers during their formation by the so-called Lyocell process using N-methylmorpholine N-oxide as a direct solvent of cellulose. Under near-infrared excitation, the applied nanoparticles exhibited thermosensitive upconversion emission, which originated from the thermally coupled levels of Er3+ ions. The combination of cellulose fibers with upconversion nanoparticles resulted in a flexible thermometer that is resistant to environmental and electromagnetic interferences and allows precise and repeatable temperature measurements in the range of 298–362 K. The obtained fibers were used to produce a fabric that was successfully applied to determine human skin temperature, demonstrating its application potential in the field of wearable health monitoring devices and providing a promising alternative to thermometers based on conductive materials that are sensitive to electromagnetic fields.

1. Introduction

Flexible sensors have recently attracted the interest of researchers, especially in the area of wearable devices, due to their ability to be conformed, bent, or rolled into the desired shapes, which greatly reduces the size of the device and makes mass production more economical. Sensors based on cellulose, which is a well-known natural biopolymer, are of particular interest [1,2,3,4,5]. The main advantages of cellulose are its availability, biodegradability, and low price [4,5,6,7,8]. Another merit of cellulose is that it is relatively easy to process and has a high modification potential, allowing cellulose and its derivatives (film, fibers, or papers) to be endowed with new features (e.g., antibacterial, catalytic conductive, luminescent, plasmonic) [9,10,11,12]. This type of modified cellulosic material can be successfully used for the production of flexible wearable sensors for human health monitoring devices, as they combine the characteristics of the modifier with the flexibility, air, and moisture permeability of cellulose, which ensure high comfort of use of the sensor. Furthermore, cellulose (in the form of regenerated fibers) is one of the basic materials used in the textile industry, which significantly increases the applicability of cellulose-based sensors in wearable health monitoring devices.
One of the most important physiological parameters where monitoring is essential in wearable health monitoring devices is temperature [6,13]. Conventional methods of temperature determination such as volume expansion thermometers, thermocouples, or thermistors are often insufficient, because there is a need for fast, remote, and real-time measurements that provide high spatial and temperature resolution [6,14,15]. Additionally, in many cases (for example, in magnetic resonance imaging (MRI)), any electromagnetic interferences (EMI) or galvanic connections are highly undesirable, and thus other nonelectrical methods of temperature measurement are sought [6,16,17,18]. Therefore, optical temperature sensors (e.g., based on fiber Bragg gratings, interferometers, thermography, Raman scattering, or luminescence) have become increasingly popular in the past few years because they meet the above requirements for temperature measurement [16,17,18,19,20,21].
There are a vast number of articles on flexible sensors based on cellulose and conductive materials (metal nanoparticles, carbon nanotubes, graphene oxide, or polypyrrole) used for temperature determination [4,5,22]; however, they show disadvantages that are characteristic of the electronic thermometers mentioned earlier. Therefore, developing a cellulose-based sensor that exploits optical phenomena to determine temperature remains an urgent and challenging task. This type of thermometer, due to its small size, light weight, flexibility, resistance to EMI, and electrical safety has the potential to be used in the design of wearable devices for human health monitoring.
Among the various optical methods used to determine temperature, luminescence thermometry appears to be a very promising alternative [23,24,25,26,27,28]. Temperature sensors based on the phenomenon of luminescence exploit temperature-induced changes in the spectroscopic properties of phosphors, for instance: changes in the intensity or width of emission bands, the appearance of new bands in the emission spectrum, shortening of emission lifetimes, changes in the luminescence (fluorescence) intensity ratio—LIR (FIR) of two bands, spectral shifts in absorption/emission bands, and different efficiency of energy and charge transfer processes [23,24]. One of the key advantages of luminescence-based methods is their resistance to the aforementioned EMI, as they rely on measuring the emission spectrum of a previously excited sample rather than measuring the conductivity (or resistivity) of the material [29,30]. Typically, luminescence-based temperature sensors use the LIR method for temperature determination [24,25]. These luminescent thermometers can be classified according to different standards, such as the energy conversion path (down-conversion or up-conversion), size (nano or micro), type of dopant ions (lanthanides or d-block metal ions), or number of emission centers (single or dual emission centers). Very popular types of LIR-based thermometers are those based on lanthanide ions (especially single-emission-centers type), due to their narrow emission bands derived from 4f-4f transitions and their high luminescence efficiency over a wide temperature range [31]. Changes in the emission spectrum of lanthanide ions with increasing temperature are, among others, associated with the thermally coupled levels (TCLs) of lanthanide ions (e.g., Pr3+, Nd3+, Ho3+, Er3+, Tm3+) with an energy difference in the range 200 ≤ ΔE ≤ 2000 cm−1 [23,32,33,34]. Due to the thermalization processes, some TCLs related to 4f-4f radiative transitions are thermally populated (or depopulated), which results in an increase (or decrease) in their intensity. The obtained intensities of the populated (depopulated) radiative transitions are used to calculate the LIR of the emission bands corresponding to these transitions. As the temperature is determined based on the ratio of the intensity of the emission bands, this method is highly robust to environmental interferences such as fluctuations in pumping intensity or spectrum loss [35]. However, to the best of our knowledge, there are no studies showing that a cellulose-based sensor using luminescent thermometry to determine temperature can be used in the area of health monitoring devices. Therefore, in this research, we focus on the development of a new-generation innovative flexible optical temperature sensor based on regenerated cellulose fibers.
The research carried out in this work allowed us to verify the research hypotheses concerning: (i) modification of cellulose fibers with appropriate luminescence upconversion nanoparticles (NPs) in order to obtain an optical sensor using the luminescence intensity ratio method to determine the temperature; (ii) demonstrating that the optical sensor based on cellulose composite fibers with upconversion NPs has a higher sensitivity and better temperature resolution than other types of cellulose-based temperature sensors presented in the literature so far, and is resistant to EMI; (iii) showing that the obtained cellulose-based composite fibers can be used to produce a wearable sensor to monitor the temperature of the human body.
To prove the validity of these hypotheses, cellulose fibers were prepared according to the dry–wet spinning process, which allows the incorporation of NPs of the modifier into the internal structure of cellulose fibers. This ensures the durability of the prepared fibers during washing, as shown in our previous research [10]. Yttrium fluoride NPs doped with 20% (molar ratio) ytterbium and 2% erbium (YF3: 20% Yb3+, 2% Er3+) were used as thermosensitive upconversion NPs that show bright green emission in near-infrared (NIR) laser excitation. The selection of the YF3: Yb3+, Er3+ system was motivated by two factors: (i) YF3 was chosen as the host matrix, because it shows a low phonon energy (~350 cm−1) and wide band gap, which limits multiphonon-quenching processes, which are undesirable in luminescent systems [36,37,38,39]; (ii) Er3+ ions were selected as activator ions due to their intense green emissions and appropriate energy gap (800 cm−1) between two TCLs, while Yb3+ ions were used as sensitizer ions, due to their high absorption cross-section in the NIR range (in contrast to Er3+ ions) and good match of energy levels with Er3+ ions, which ensure efficient energy transfer upconversion (ETU) processes [36,38]. Upconverting NPs were responsible for providing a remote ratiometric temperature reading, while the cellulose fiber served as a flexible platform for these NPs. Then, the influence of the temperature in the range of 298–358 K (25–85 °C) on the spectroscopic properties (including the luminescence intensity ratio (LIR), relative sensitivity, and temperature resolution) of the obtained composite fibers was investigated. Moreover, the resulting composite fibers were processed into a knitted fabric that was tested for use as a wearable temperature sensor.

2. Materials and Methods

2.1. Materials

Rare-earth (RE) oxides (RE = Y3+, Yb3+, and Er3+) (99.99%, Stanford Materials, Stanford, CA, USA) were dissolved separately in nitric acid (HNO3; 65%, ultrapure, POCh. S.A., Gliwice, Poland) to synthesize corresponding RE nitrates. Afterward, the excess of acid was removed by evaporation. Ammonium fluoride (NH4F; ≥98 pure p.a., POCh. S.A., GliwicePoland) and PEG 6000 (Sigma-Aldrich, Darmstadt, Germany) were used as received, without further purification. Deionized water was used in all experiments. PLACETAE pulp (polymerization degree D P ¯ = 1250, 96.8 wt.% of α cellulose from Rayonier (Wildlight, FL, USA) and a 50% aqueous solution of N-methylmorpholine N-oxide-NMMO (from Huntsman Holland BV, Rotterdam, The Netherlands) were used to prepare cellulose solution. Propyl ester of gallic acid-Tenox PG® (purchased from Aldrich, Gillingham, Dorset, UK) was used as an antioxidant to stabilize the molecular weight.

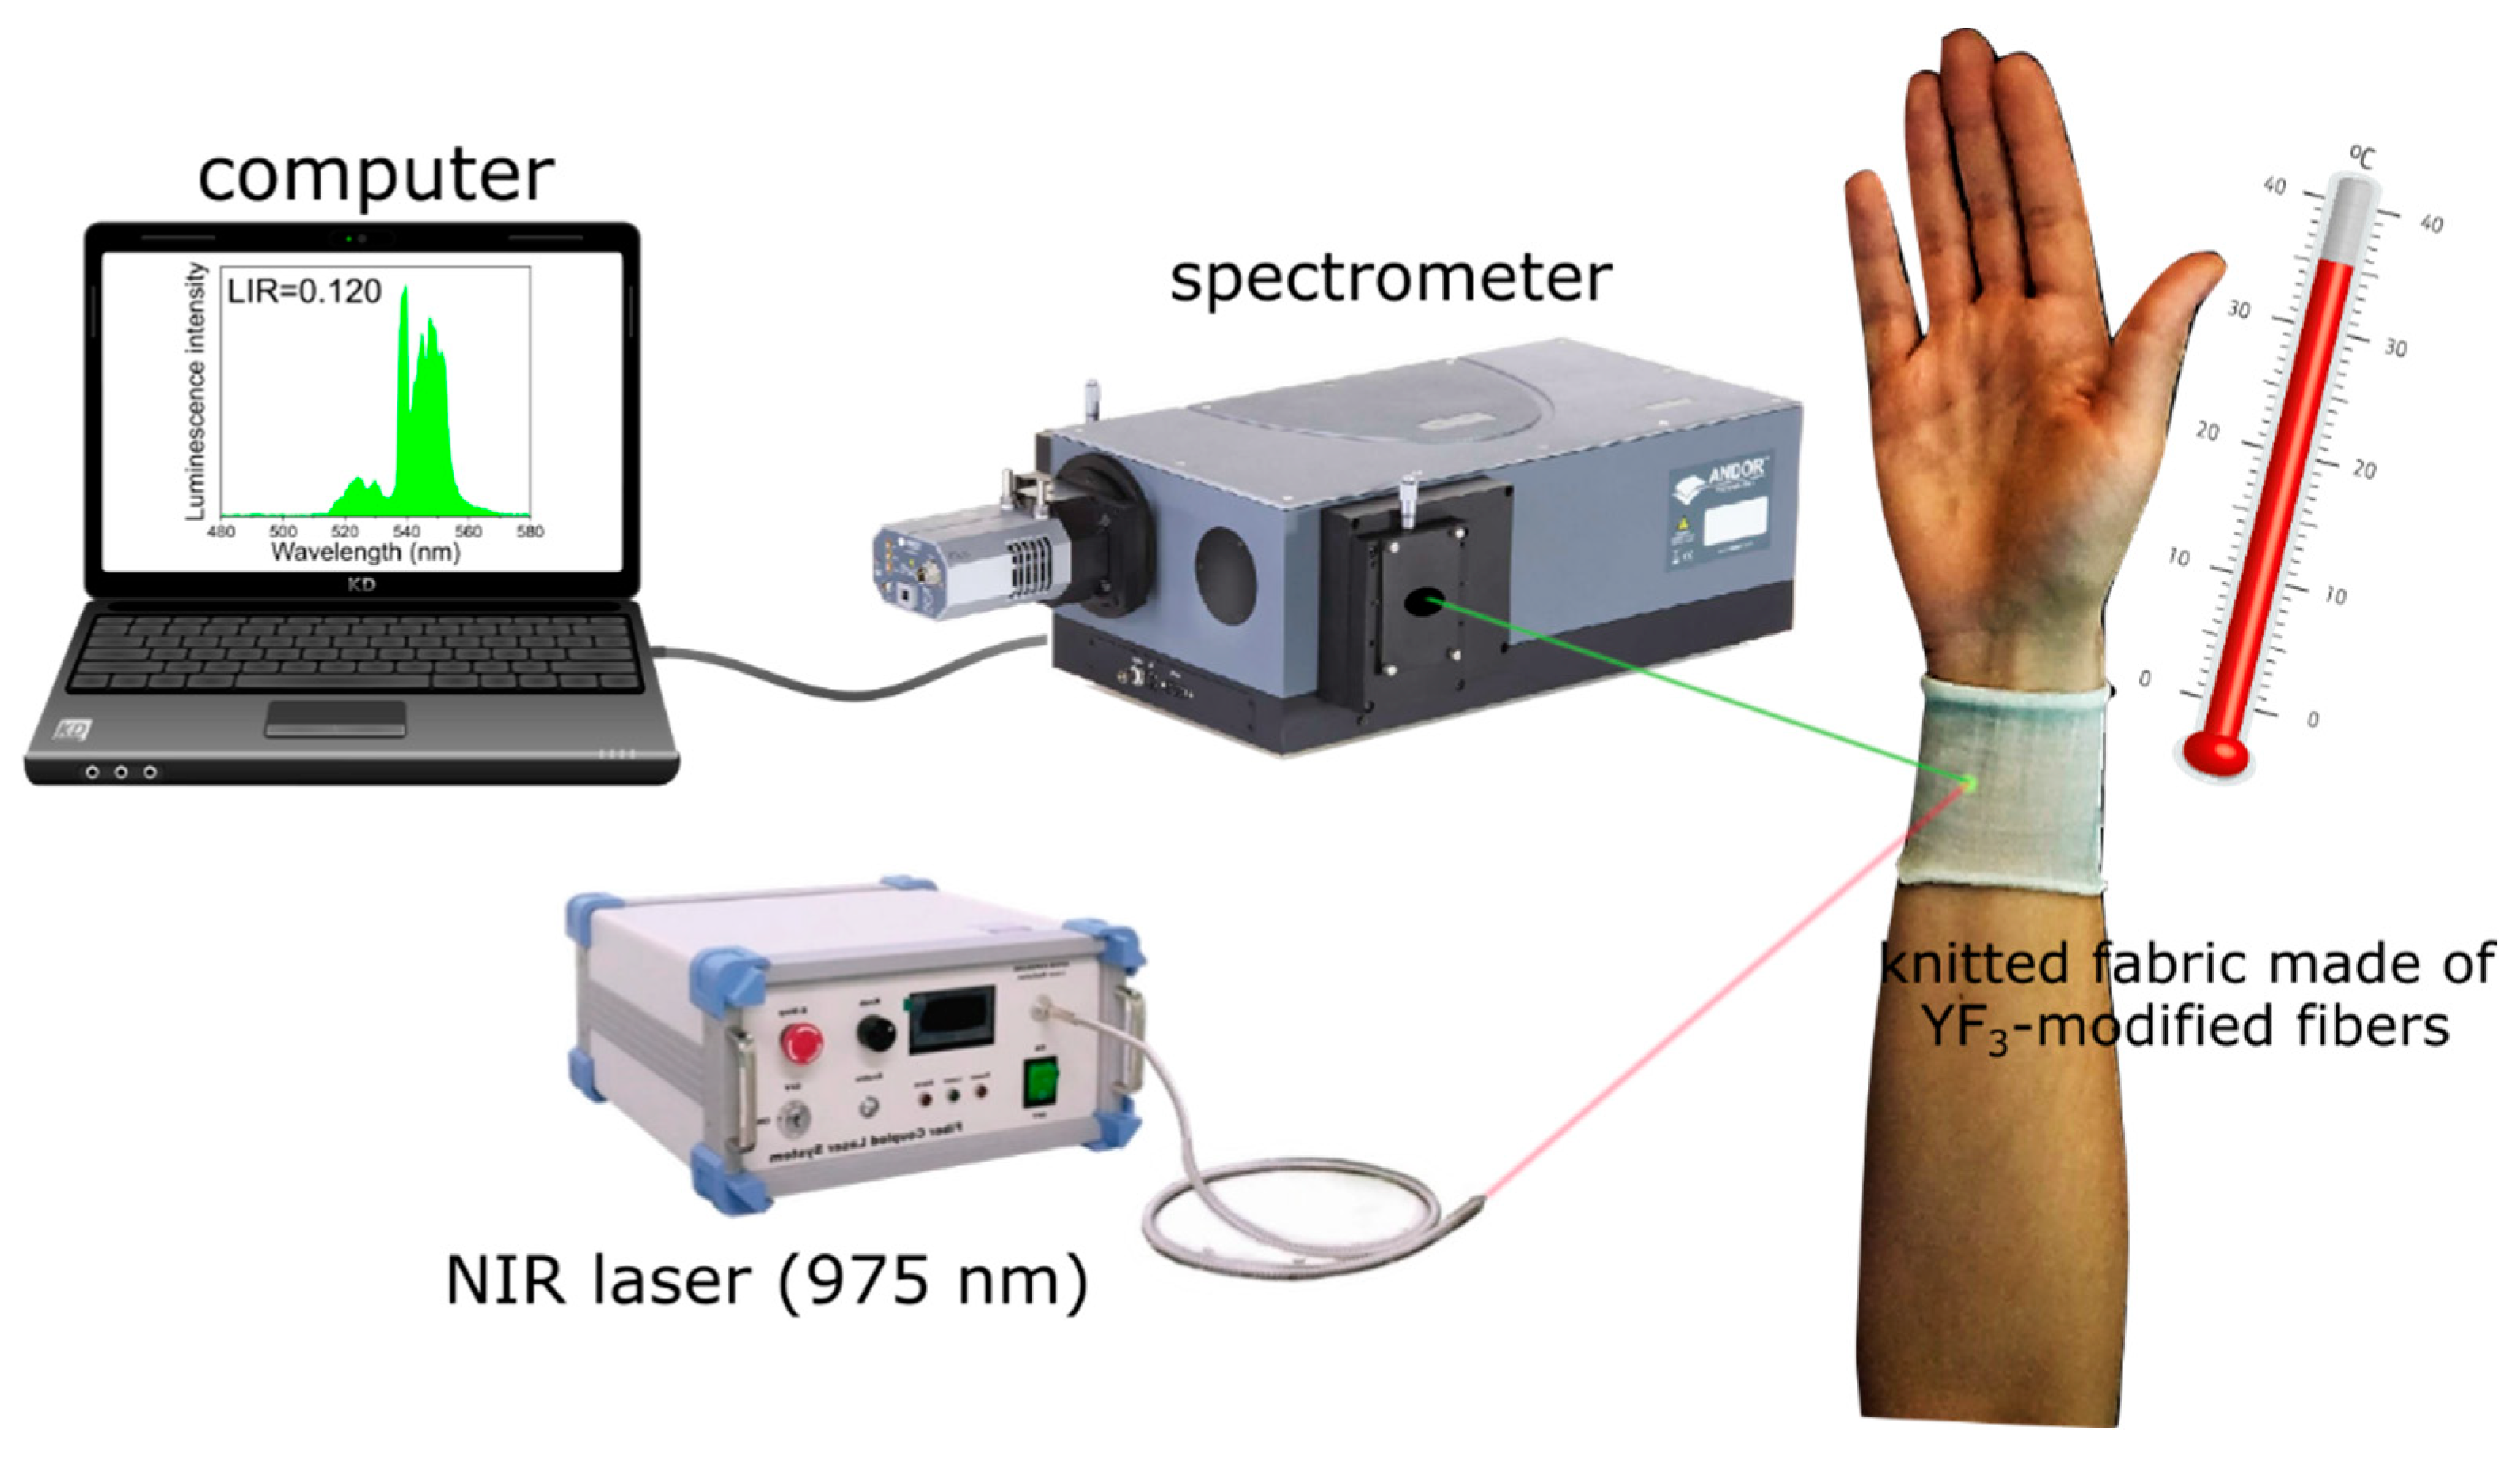
2.2. Instrumentations

The cellulose solution was made using a laboratory-scale IKAVISC kneader type MKD 0.6-H60 (Monachium, Germany). The fibers were spun using the dry–wet spinning method on a laboratory-scale piston-spinning device with a spinneret equipped with 18 orifices of 0.4 mm diameter. The powder X-ray diffraction pattern (XRD) was measured with a Bruker AXS D8 Advance diffractometer (Billerica, MA, USA) in Bragg–Brentano geometry, using Cu Kα1 radiation (λ = 1.5406 Å). Transmission electron microscopy (TEM) observations were carried using a Hitachi HT7700 microscope (Tokyo, Japan), applying an acceleration voltage of 100 kV. The FEI Quanta 250 FEG scanning electron microscope equipped with an EDAX detector was used to acquire scanning electron microscopy and EDX images. The mechanical properties of the fibers were measured using a Zwick Z2.5/TN1S tensile testing machine (Ulm, Germany), according to PN-EN ISO 5079:1999. The linear density of the fibers was measured in accordance with PN-EN ISO 1973:1995. The knitted fabric was made on a circular machine characterized by the following technical parameters: cylinder diameter = 4 inches, needle gauge = E14, number of needles = 169. For the knitted fabric produced as part of this work, the following parameters were determined: the number of wales and courses per unit of length according to the standard EN 14971:2006, thickness according to the standard EN ISO 5084:1996, and mass per unit area according to the standard PN-P-04613:1997. The content of the modifier in the cellulose fibers was analyzed by an inductively coupled plasma optical emission spectrometer (ICP-OES Spectro Blue TI, Kleve, Germany). Emission spectra were collected with an Andor Shamrock 500i spectrometer (Belfast, UK) connected to the Peltier-cooled Andor Indus (silicon) CCD camera. The sample was excited by the use of a fiber-coupled, solid-state diode-pumped (SSDP) laser FC-975-2W (CNI, Changchun,, China). In the case of measurements involving YF3-modified fibers, the laser beam was focused to about a 0.5 mm spot size and the applied power was adjusted to 0.70 W, which corresponds to a power density of about 360 W/cm2. Before acquiring the thermometric experiments, a sufficiently low power of the laser was adjusted to avoid an uncontrolled increase in temperature of the sample, by heating the material with a focused laser beam (the effect of laser-induced heating does not occur when the band intensity ratio associated with the Er3+ thermalized levels remains constant). In the case of measurement performed with the use of knitted fabric, the laser beam was focused to an approximately 4 mm size beam spot, and the applied power was adjusted to 0.5 W, which corresponds to a power density of about 4 W/cm2. The power density in the applied range (from ~4 to 360 W/cm2) enables measurements without heating of the sample and does not influence the temperature sensitivity of the thermometer (because the laser power does not influence the LIR of the bands that are associated with TCLs [27]).

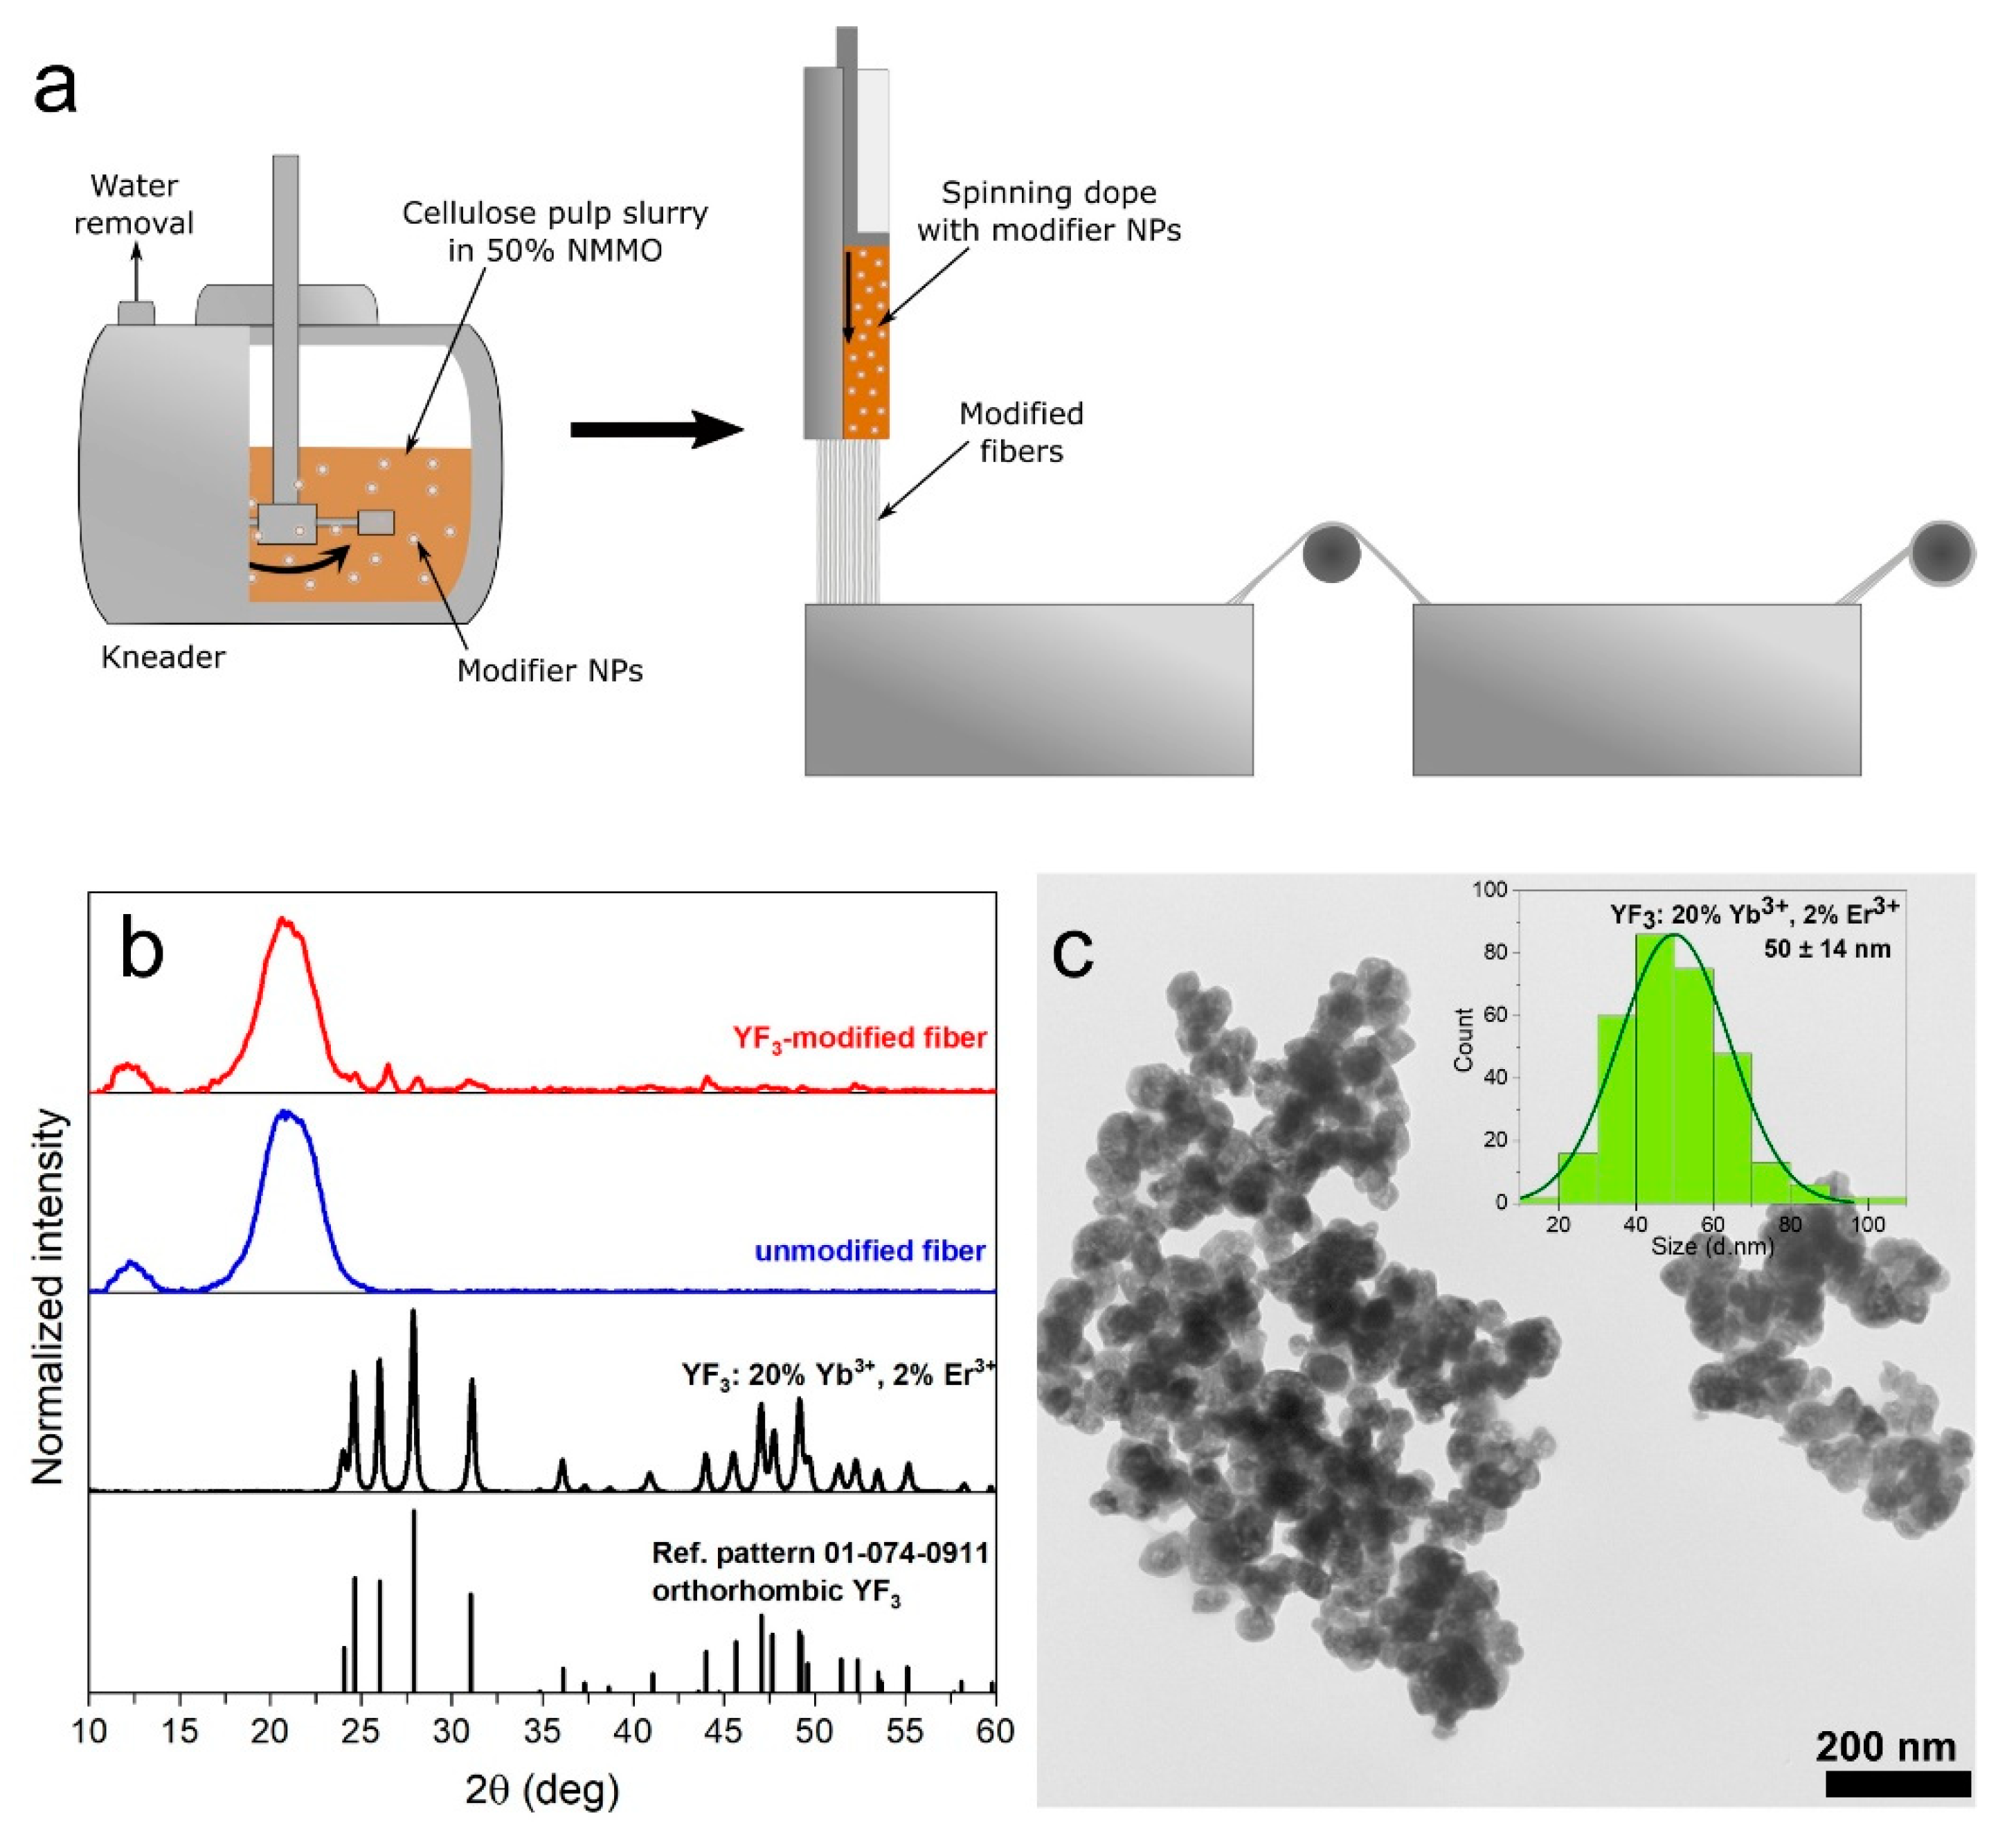
2.3. Synthesis of Upconversion Modifier

YF3 NPs doped with 20 mol% Yb3+ and 2 mol% Er3+ were synthesized following our previously reported procedure [27]. To prepare 0.5 g of product, 4.75 mL of 0.5 M YCl3 and 1.22 mL of 0.5 M YbCl3 were mixed with 1.22 mL of 0.05 M ErCl3 aqueous solutions and filled up to 25 mL with water. Next, 25 mL of ethanol was added to the solution of RE3+ ions and 0.3 g of PEG 6000 (anti-agglomeration agent,) was dissolved in the as-obtained solution. The solution containing the source of fluoride ions was obtained by dissolving 1.5035 g of NH4F (50% molar excess) and 0.25 g of PEG 6000 in 25 mL of water and ethanol in a 12.5/12.5 solvent system. Both solutions were heated up to 323 K. Afterward, the RE3+ solution was added drop by drop to continuously stir and heat the solution of NH4F to precipitate the lanthanide salt. After the addition, the solutions were stirred for 1 h at 323 K. The pH of the final mixture was adjusted to 2. The as-prepared transparent solution was transferred into a 50 mL Teflon-lined vessel and hydrothermally treated for 16 h at 453 K. After completion of the reaction, the resulting white precipitate was purified by centrifugation and rinsed several times with water and ethanol. The final product (YF3: Yb3+, Er3+) was dried overnight in an oven (358 K), and after that, the sample was ground in an agate mortar. In the next step, it was calcined in a furnace for 4 h at 573 K, in order to improve the crystallinity and luminescence of the material. The sample was then ground again in an agate mortar and dispersed in water.

2.4. Preparation of Cellulose Fibers

A cellulose solution (spinning dope) was prepared by mixing cellulose pulp, aqueous solution of NMMO, antioxidant, and the upconversion modifier in a kneader equipped with a heating system. An aqueous colloidal solution of YF3: 20% Yb3+, 2% Er3+ was added to reach a concentration of about 3.5 wt.% in the final (dry) cellulose fibers. The cellulose was dissolved under low-pressure (≈20 hPa), at temperature not exceeding 115 °C (388 K). During the process, water was removed until its contents in the mixture did not exceed 14 wt.%. The obtained amber-like colored spinning dope was placed into a cylinder (pre-heated to a temperature not exceeding 115 °C (388 K)) and pressed through nozzle holes and the air gap, and it was finally immersed in an aqueous solidifying bath at 20 °C (293 K). The fibers were spun at a take-up speed of 50 m/min, washed, and dried at room temperature. A scheme of the formation of modified cellulose fibers is shown in Figure 1a. The obtained fibers (yarn) were used to produce a single jersey knitted fabric. The stitch of the knitted fabric is shown in Figure S1.

3. Results

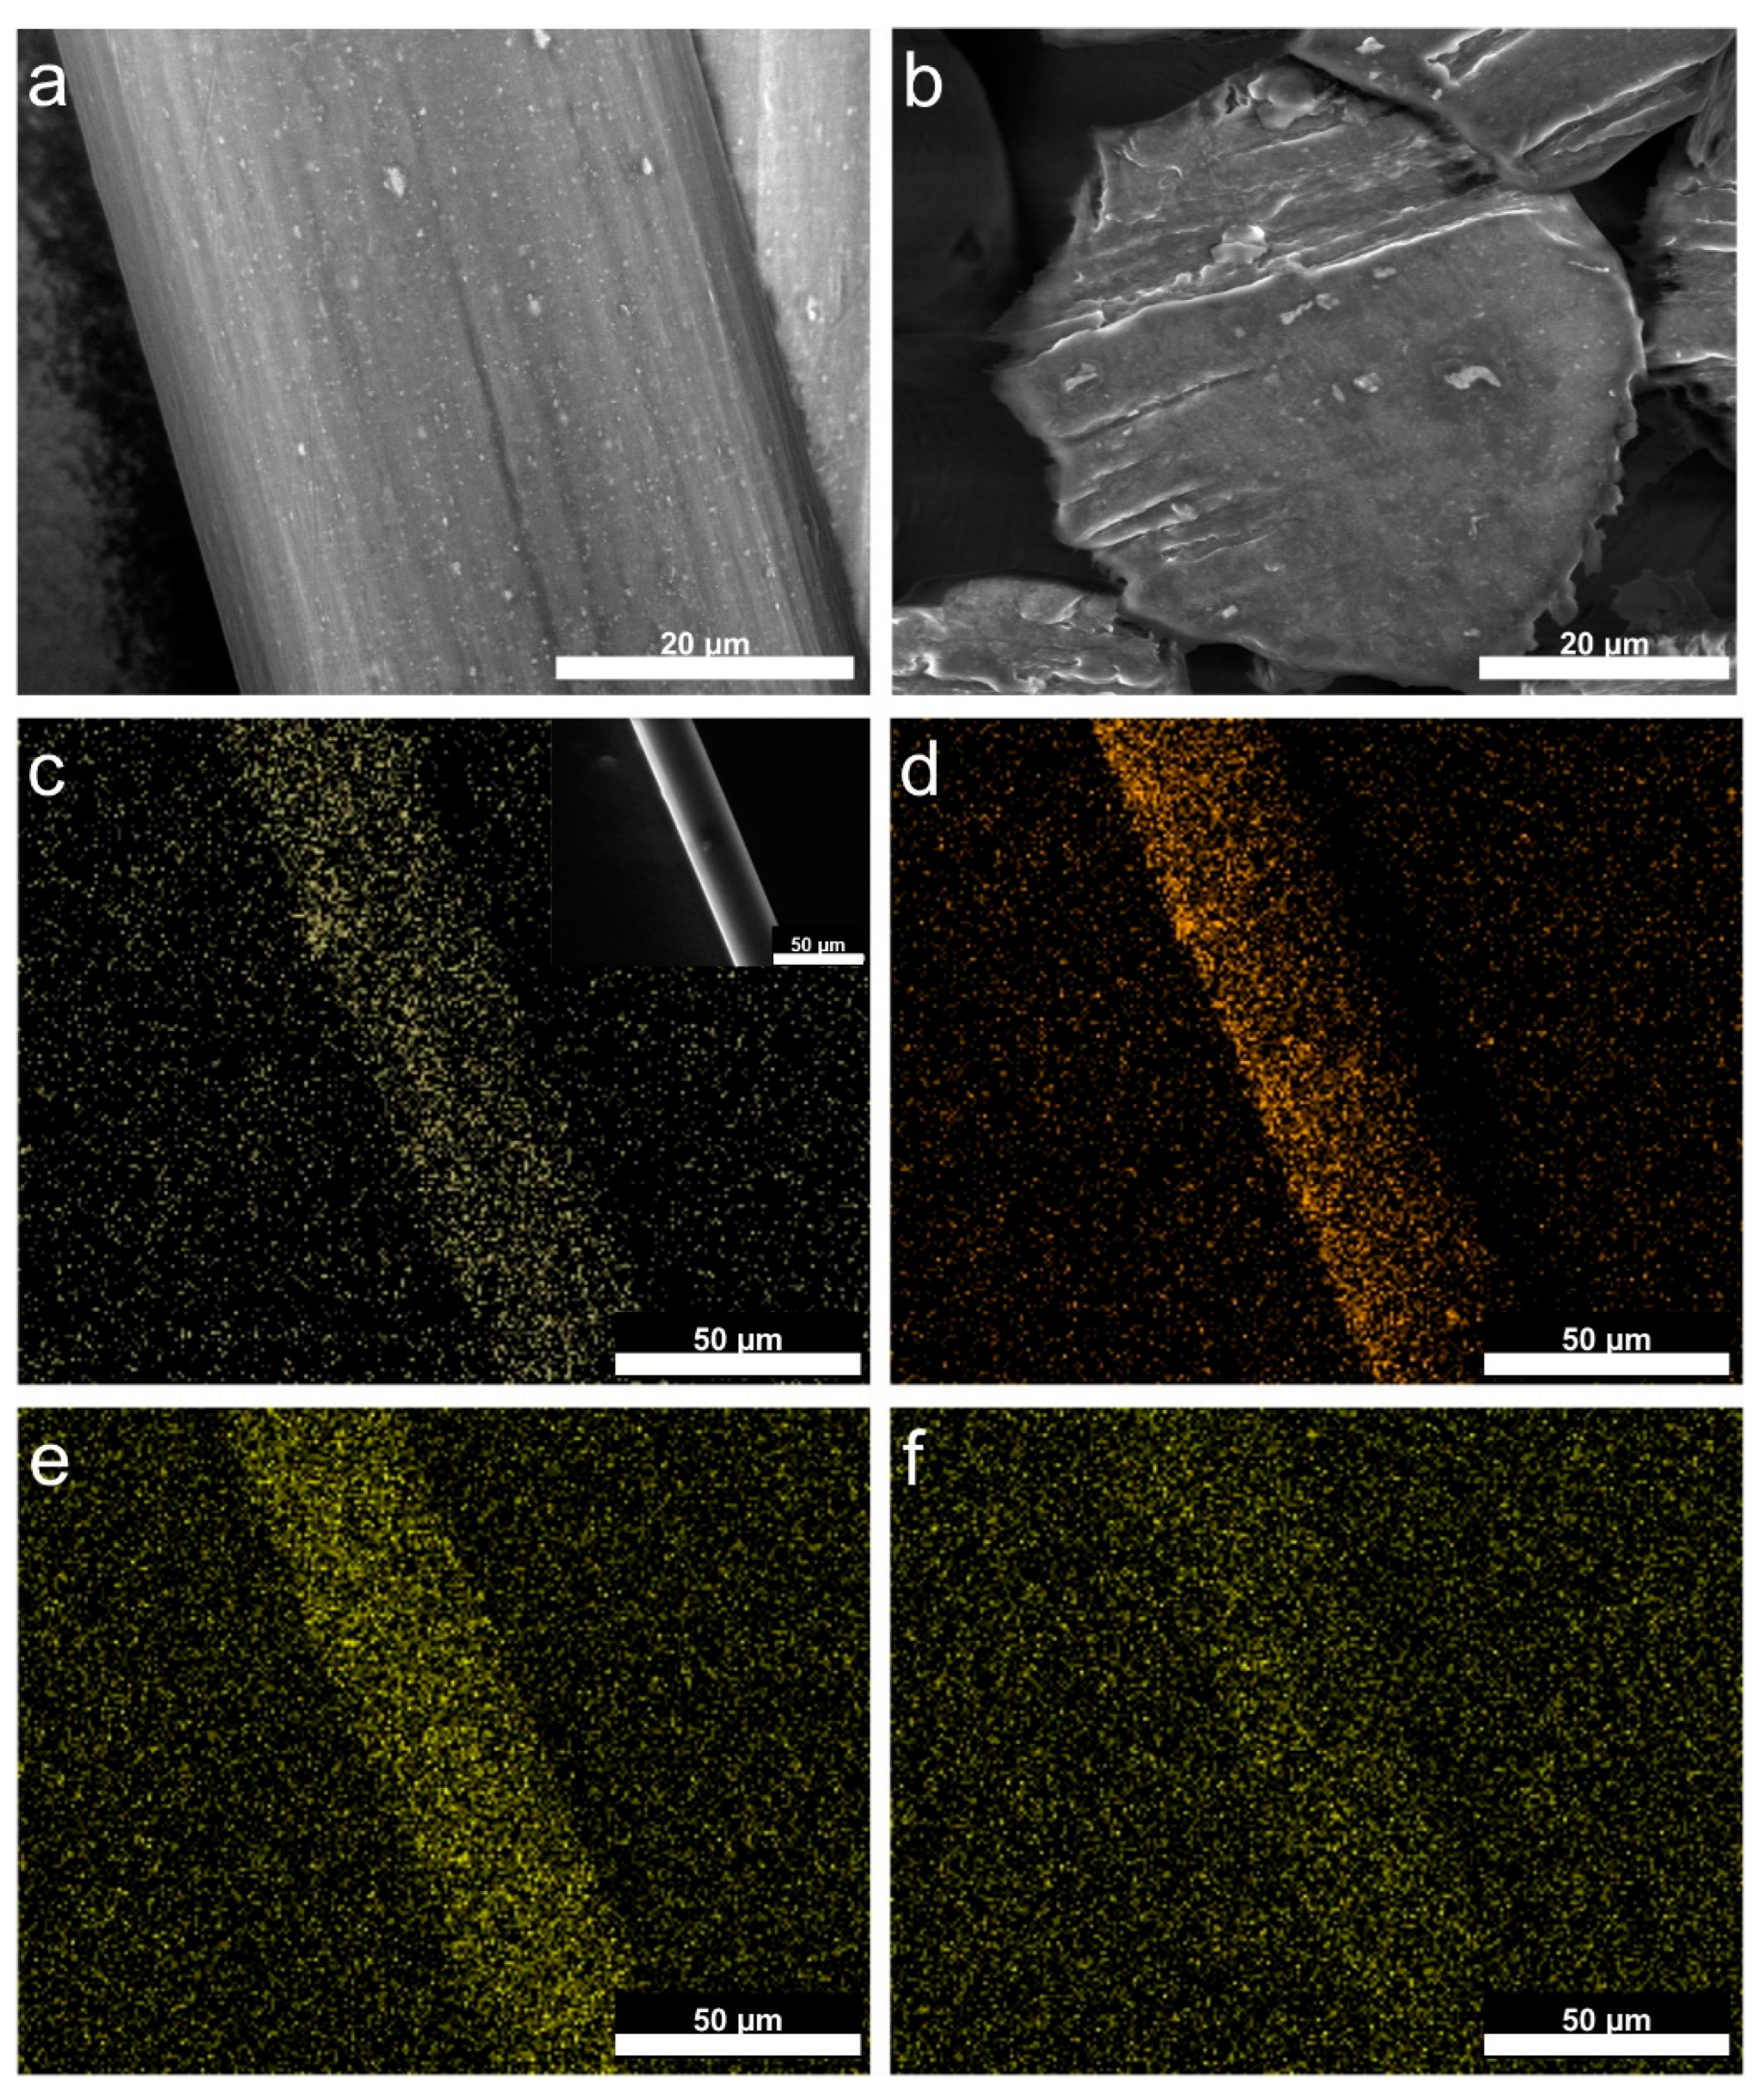
3.1. Structure and Morphology

The synthesized YF3 NPs working as a modifier of the fibers show a pure orthorhombic structure matching the reference pattern no. 01-074-0911 from the International Center for Diffraction Data (Figure 1b). The absence of additional XRD lines indicates a pure structure without any impurities. The observed broadening of the reflexes of YF3 results from the nanocrystallinity of the obtained particles. The XRD pattern of the modified fibers also confirms the presence of YF3 in the fibers matrix. The very low intensity of reflexes associated with YF3 in the cellulose matrix is due to the low content of the modifier NPs in the fibers (≈3.5 wt.%). An additional small peak at 2θ values of ~12.3° and an intense broad peak at 2θ~20.3° observed in the XRD of modified fibers correspond to the (hkl 110) and (020) planes of cellulose II [40,41,42].
According to the TEM analysis (Figure 1c), the modifier NPs are in the form of nearly spherical, agglomerated nanoparticles. The average grain size of YF3 NPs, calculated based on TEM images, is 50 ± 14 nm (Figure 1c inset). DLS measurements show that the hydrodynamic diameter of YF3 NPs (in the form of an aqueous colloid) is in the size range 100–220 nm (Figure S2, ESI†). These two analyses show that YF3 NPs are present in water as agglomerates of approximately 2–5 NPs, which indicates that they are suitable for modifying cellulose fibers (as their size is far below the diameter of the fibers).
Such a morphology of the obtained NPs ensures their homogenous distribution within the cellulose matrix, which is confirmed by SEM measurements. The SEM images presented in Figure 2a,b show that YF3 NPs (white spots) are uniformly distributed on the surface and in the volume of the fibers, and they do not destroy the final form of the fiber. SEM-EDX mapping (Figure 2c–f) and EDX spectra (Figure S3, ESI†) further prove the presence of elements occurring in the modifier (Y, F, Yb, and Er) within the polymer matrix. These results indicate that YF3 NPs are suitable for the modification of cellulose fibers from a technological point of view.

3.2. Mechanical Properties

In addition, the mechanical properties of YF3-modified fibers (linear density, elastic modulus, tenacity, and elongation at break) are determined and compared with those of unmodified fibers to evaluate the effect of NPs on fiber performance. The results presented in Table 1 show that the tenacity and elongation at break of the YF3-modified fibers are slightly reduced, which may stem from the partial loss of elasticity caused by the presence of the inorganic modifier. This is plausibly associated with an increase in the elastic modulus and a decrease in elongation at break. As expected, the linear density increases with the addition of YF3 NPs. It should be emphasized, however, that despite the partial weakening of the mechanical performance of the YF3-modified fibers, they are still strong enough to be processed into a knitted fabric. Furthermore, the basic structural and physical parameters of the obtained knitted fabric are determined and presented in Table S1, (see ESI†).

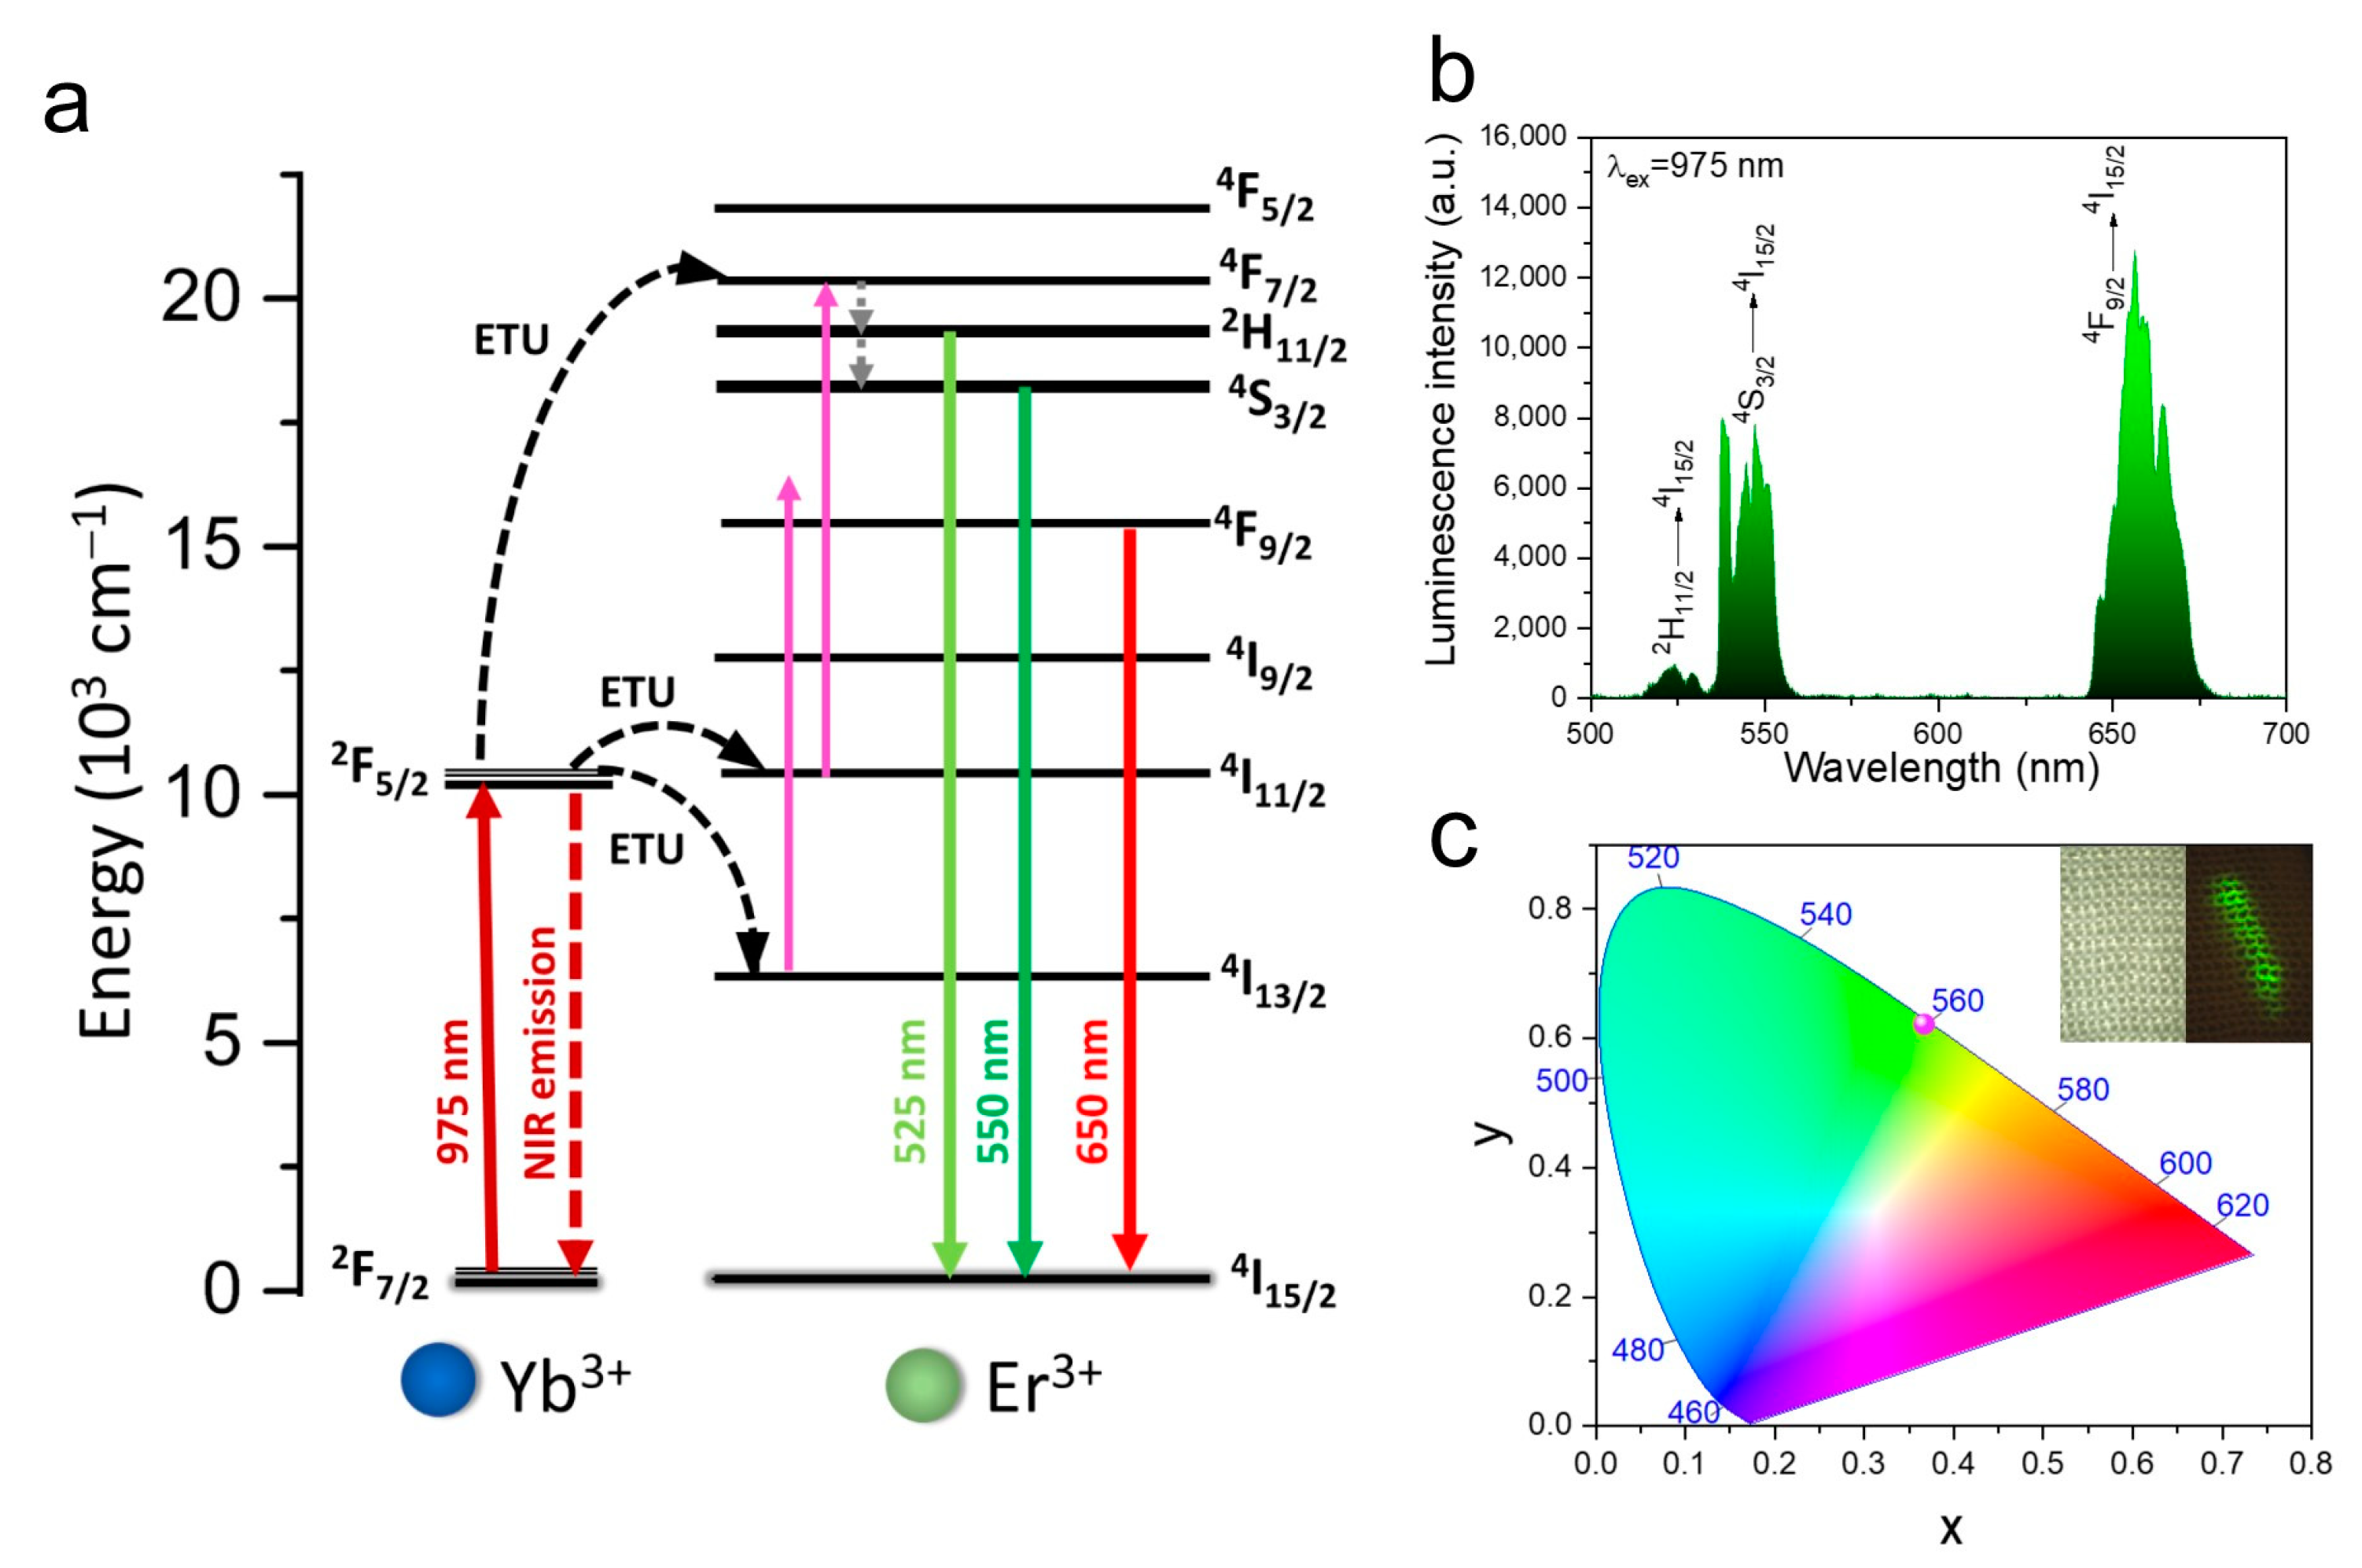
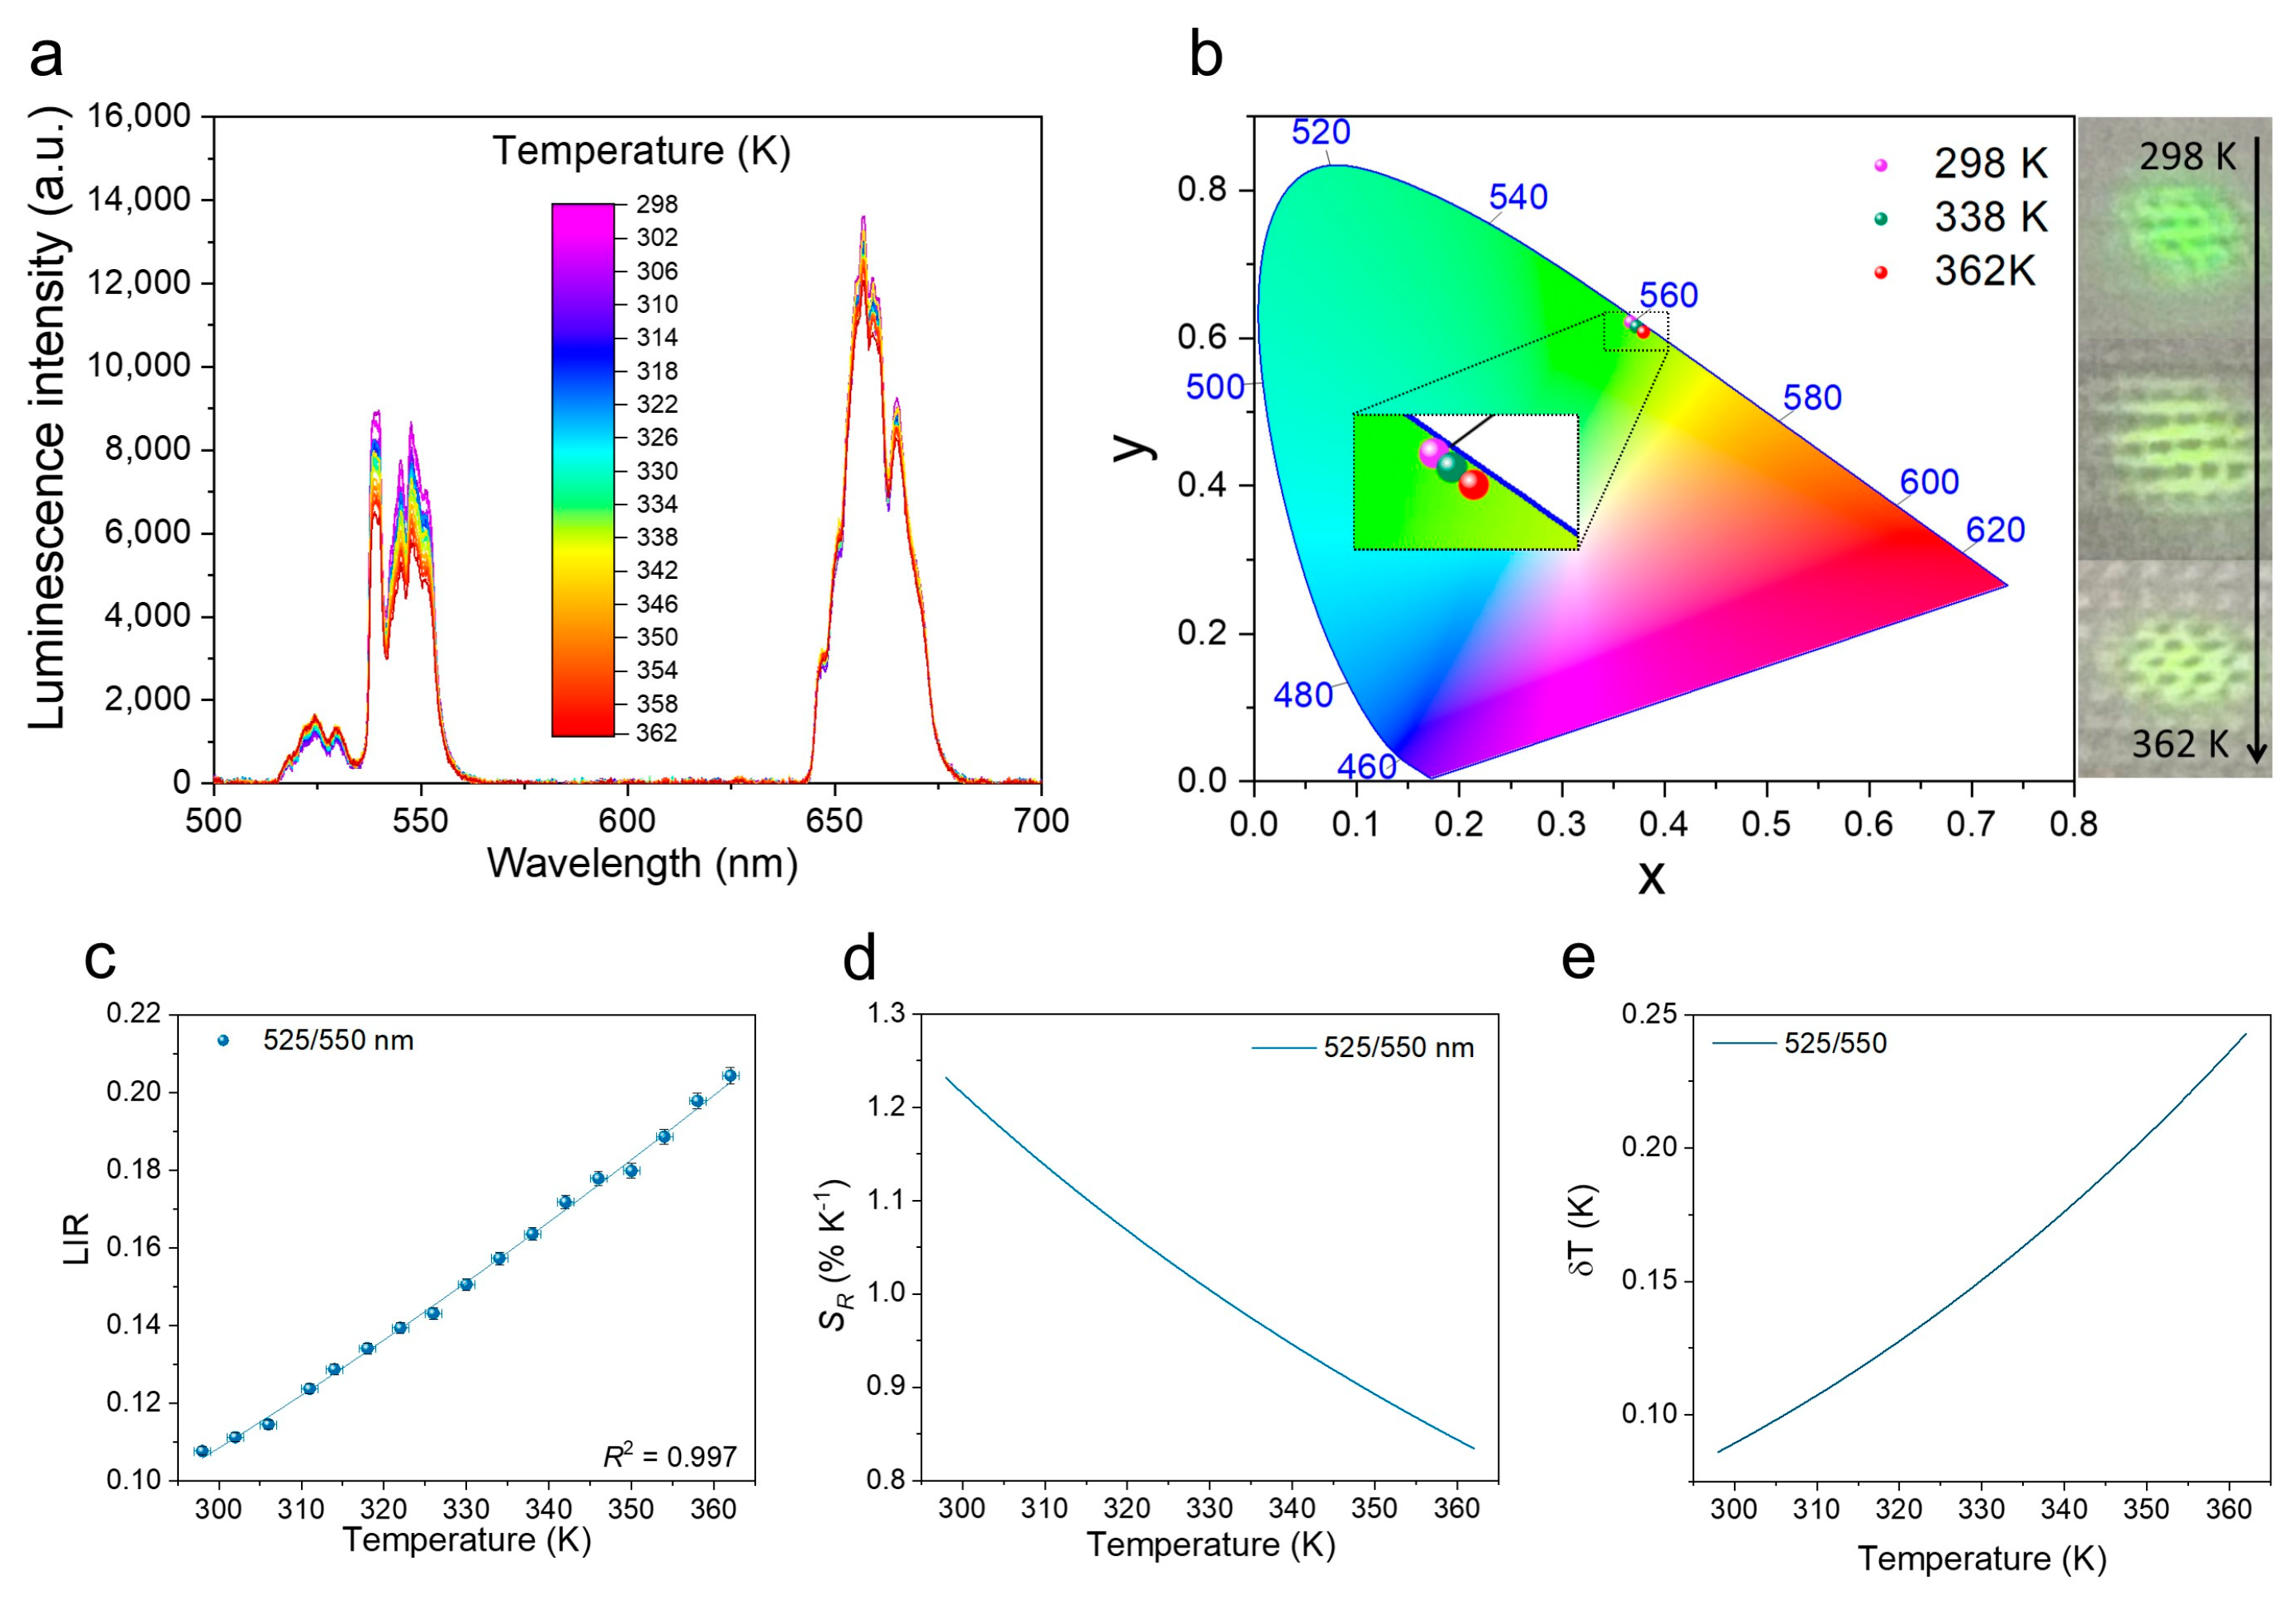
3.3. Luminescence Properties

The spectroscopic properties of the fibers modified with YF3: Yb3+, Er3+ NPs are analyzed based on the upconversion (UC) emission spectra, recorded at λex = 975 nm. In this system, Yb3+ ions act as sensitizers (light-harvesting ions), which absorb near-infrared (NIR) energy and transfer it to the nearest emitting Er3+ activator ions via the energy transfer upconversion (ETU) mechanism (Figure 3a). The emission spectra of the modified fibers shown in Figure 3b consist of three characteristic, narrow bands from Er3+ associated with their 4f-4f radiative transitions, i.e., 2H11/24I15/2 (525 nm), 4S3/24I15/2 (550 nm), and 4F9/24I15/2 (650 nm). The effective color of the luminescence of the YF3-modified fibers is determined using the chromaticity coordinates (CIE 1931) calculated based on the recorded emission spectra and it is established as greenish (Figure 3c). This result is consistent with the bright green emission of a knitted fabric (made of YF3-modified fibers) excited by NIR irradiation observed with the naked eye (inset of the Figure 3c).
In order to investigate the thermometric properties of the obtained fibers, their upconversion emission spectra are measured as a function of temperature, in the range of ≈300–360 K (λex = 975 nm). Figure 4a clearly shows that as the temperature increases, the intensity of the band located around 525 nm (Er3+: 2H11/24I15/2) increases and, at the same time, the intensity of the band located around 550 nm (Er3+: 4S3/24I15/2) decreases significantly. This effect is due to the fact that these two transitions originate from the thermally coupled levels (TCLs) of Er3+ (2H11/2 and 4S3/2) with an energy difference of ΔE = 865 cm−1 (derived from the spectrum). In other words, with increasing temperature, the electrons from the lower-energy level (4S3/2) are transferred to the higher energy level (2H11/2), thus increasing the population of this level. Due to this, the intensity of the band associated with the higher energy level (2H11/2) increases with temperature. Thermalization processes induced by the increase in the temperature cause a change in the relative intensity of the 2H11/24I15/2 and 4S3/24I15/2 transitions, according to the Boltzmann distribution:
LIR = I 2 I 1 = B e x p ( Δ E k B T ) ,
where LIR is the luminescence intensity ratio; I2 and I1 refer to the integrated intensity of higher-energy (525 nm) and lower-energy (550 nm) bands, respectively; ∆E is the energy difference between the centroids of these two TCLs (the determined ΔE value from fitting is 756 cm−1, which is similar to the value determined from the spectra); kB is the Boltzmann constant; T is absolute temperature; and B is a coefficient depending on the degeneracy of states, the rates of total spontaneous emission, the transition’s branching ratio with respect to the ground state, and the transition’s angular frequency [23,43]. Please note that to determine the band intensity ratio and ΔE values, the emission spectra are converted to an energy scale (eV) via the Jacobian transformation [44,45]. However, for the readers’ convenience, all spectra in the manuscript are presented on the wavelength scale. As shown in Figure 4b, with the increase in the temperature from 298 to 362 K, there is a yellow shift in the emission color of the YF3-modified fibers (and thus the knitted fabric made of them).
The LIR values calculated using Equation (1) are correlated with temperature, showing a perfect fit, R2 > 0.99 (Figure 4c). However, to evaluate the performance of the obtained fibers as an optical thermometer, it is necessary to calculate their relative temperature sensitivity (Sr). Please note that this parameter is independent of the nature of the thermometer and the experimental setup and allows quantitative comparison of the performance of different optical thermometers. Sr expresses the relative change in the ratio of the band intensity per 1 K change in absolute temperature. Sr is defined as:
S r = 100 % × 1 LIR d LIR d T ,
Based on the fitted LIR values and Equation (2), the Sr values of YF3-modified fibers as a function of temperature are determined. Sr values are strongly dependent on the temperature and decrease with the temperature for the 525/550 nm band ratio from 1.23% K−1 (at 298 K) to 0.83% K−1 (at 362 K). It should be emphasized that this is one of the highest Sr values (around 300 K) for the Er3+: 525/550 nm band ratio [46].
Additionally, the temperature uncertainties (ΔT; temperature resolutions) are determined based on Equation (3), i.e.,
δ T = 1 S r δ LIR LIR ,
where δLIR is the uncertainty in the determination of the luminescence intensity ratio. The calculated resolution of the optical temperature determination for the Er3+ 525/550 nm band intensity ratio at 298 K is about 0.09 K and increases to 0.24 K at 362 K. The calculated Sr and ΔT as a function of temperature, together with the corresponding LIR values, are presented in Figure 4c–e.
Furthermore, a thermal cycling of YF3-modified fibers is carried out (Figure S4) to verify the applicability and reliability of the developed fiber-thermometer. The LIR values change reversibly with temperature, confirming the thermal stability of the obtained fibers, and proving that they retain their thermometric properties after multiple heating–cooling cycles. Please note that we do not observe any changes in the signal intensities after the performance of thermometric measurements and the performed cycling. Good thermal stability of the prepared materials is ensured by the combination of YF3 (stable up to 500 °C [47,48]) with regenerated cellulose fibers (stable up to 300 °C [49,50]), which are stable much above the operating temperature range.
In order to demonstrate the potential use of modified fibers as a wearable temperature sensor, a knitted fabric made of these fibers is used to determine the temperature of human skin. The measurement is carried out on the inner side of the volunteer’s forearm wrapped in the knitted fabric (Figure 5). Based on the obtained LIR value (LIR = 0.120), the forearm skin temperature is measured to be 35.3 °C, which is consistent with the temperature measured with a traditional thermometer. Please note that temperature of the forearm skin is lower than the axillary (underarm) or oral temperature (~36.6 °C) [51]. It should be emphasized that, in this case, the applied laser power density is significantly lower than in the case of the YF3-modified fibers, which proves that it is possible to obtain reliable results even with the use of such low laser power densities, which is a very important factor in the case of real applications, e.g., biological or industrial processes, where the use of high-power lasers is usual.
Table 2 compares various examples of cellulose-based temperature sensors in terms of their performance with the optical sensor proposed in this work. The developed YF3-modified cellulose fibers exhibit various advantages, such as higher relative sensitivity and better temperature resolution. Moreover, the sensor presented in this research is resistant to EMI, unlike resistive or capacitive-type sensors.

4. Conclusions

In summary, we designed a flexible optical temperature sensor based on regenerated cellulose fibers, modified with upconversion NPs. The performed studies proved its effectiveness in use and confirmed the validity of our research hypotheses. Namely, incorporation of YF3: 20% Yb3+, 2% Er3+ upconversion NPs (optimal composition) into cellulose fibers assured a thermally sensitive emission under NIR excitation, while cellulose fibers served as a flexible carrier for upconversion NPs. The temperature measurement was based on the determination of the ratio of the intensity of emission bands associated with transitions from thermally coupled levels of Er3+, i.e., 2H11/24I15/2 and 4S3/24I15/2. Due to the fact that the presented temperature sensor is ratiometric, and therefore does not rely on a direct change in the measured parameter, it is robust to environmental interferences. Other benefits of this upconversion temperature sensor are its outstanding relative sensitivity and temperature resolution (Sr = 1.232% K−1 and ΔT = 0.09 K, both at 298 K), which allow very precise temperature sensing in the range of 298–362 K. Importantly, this sensor shows constant values of the parameters discussed in the paper during repeated measurements in the heating–cooling cycles, which indicates its high reliability and stability. Furthermore, as the principle of operation of the discussed sensor is based on the measurement of emission spectra, and the sensor itself does not conduct electricity, it is inherently immune to electromagnetic interferences. The developed thermometer might be especially useful in the new generation of wearable devices for human health monitoring.

Supplementary Materials

The following supporting information can be downloaded at: https://www.mdpi.com/article/10.3390/nano12111926/s1, Figure S1: Right side of the knitted fabric; Figure S2: DLS analysis of YF3: 20% Yb3+, 2% Er3+ NPs; Figure S3: EDX spectra of YF3-modified cellulose fibers; Table S1: Basic structural and physical parameters of a knitted fabric made of YF3-modified cellulose fibers; Figure S4: Thermal cycling of YF3-modified fibers between 298 K and 362 K, for the determined thermometric parameters, i.e., Er3+: 525/550 nm band ratio, λex = 975 nm.

Author Contributions

Conceptualization, M.S., P.K., S.L. and M.R.; methodology, M.S. and P.K.; validation, M.S.; formal analysis, M.S., N.S., M.K. and M.R.; investigation, M.S., N.S., P.K. and M.K.; resources, P.K. and S.L.; data curation, M.S. and N.S.; writing—original draft preparation, M.S.; writing—review and editing, S.L. and M.R.; visualization, M.S.; supervision, S.L. and M.R.; project administration, M.S.; funding acquisition, M.S. and N.S. All authors have read and agreed to the published version of the manuscript.

Funding

This research was funded by the Polish National Science Centre (grant numbers 2019/33/N/ST5/00326 and 2018/31/N/ST4/00684) and by the European Union through the European Social Fund under the Operational Program Knowledge Education Development (grant number POWR.03.02.00-00-I026/16). M.S. and N.S. are recipients of the Adam Mickiewicz University Foundation scholarship for the academic year 2021/2022. M. Runowski acknowledges support from Fondo Social Europeo and Agencia Estatal de Investigación (RYC2020-028778-I).

Institutional Review Board Statement

Not applicable.

Informed Consent Statement

Not applicable.

Data Availability Statement

All of the relevant data are available from the corresponding authors upon reasonable request. Source data are provided with this paper.

Conflicts of Interest

The authors declare no conflict of interest.

References

  1. Amin, A.S. Application of a Triacetylcellulose Membrane with Immobilizated of 5-(2′,4′-Dimethylphenylazo)-6-Hydroxypyrimidine-2,4-Dione for Mercury Determination in Real Samples. Sens. Actuators B Chem. 2015, 221, 1342–1347. [Google Scholar] [CrossRef]
  2. Jiang, X.; Xia, J.; Luo, X. Simple, Rapid, and Highly Sensitive Colorimetric Sensor Strips from a Porous Cellulose Membrane Stained with Victoria Blue B for Efficient Detection of Trace Cd(II) in Water. ACS Sustain. Chem. Eng. 2020, 8, 5184–5191. [Google Scholar] [CrossRef]
  3. Li, N.; Yin, J.; Wei, L.; Shen, Q.; Tian, W.; Li, J.; Chen, Y.; Jin, J.; Teng, H.; Zhou, J. Facile Synthesis of Cellulose Acetate Ultrafiltration Membrane with Stimuli-Responsiveness to PH and Temperature Using the Additive of F127-b-PDMAEMA. Chin. J. Chem. 2017, 35, 1109–1116. [Google Scholar] [CrossRef]
  4. Mahadeva, S.K.; Yun, S.; Kim, J. Flexible Humidity and Temperature Sensor Based on Cellulose–Polypyrrole Nanocomposite. Sens. Actuators A Phys. 2011, 165, 194–199. [Google Scholar] [CrossRef]
  5. Manjakkal, L.; Franco, F.F.; Pullanchiyodan, A.; González-Jiménez, M.; Dahiya, R. Natural Jute Fibre-Based Supercapacitors and Sensors for Eco-Friendly Energy Autonomous Systems. Adv. Sustain. Syst. 2021, 5, 2000286. [Google Scholar] [CrossRef]
  6. Fan, J.; Zhang, S.; Li, F.; Yang, Y.; Du, M. Recent Advances in Cellulose-Based Membranes for Their Sensing Applications. Cellulose 2020, 27, 9157–9179. [Google Scholar] [CrossRef]
  7. Zhang, Z.; Liu, G.; Li, X.; Zhang, S.; Lü, X.; Wang, Y. Design and Synthesis of Fluorescent Nanocelluloses for Sensing and Bioimaging Applications. ChemPlusChem 2020, 85, 487–502. [Google Scholar] [CrossRef]
  8. Zhu, P.; Liu, Y.; Fang, Z.; Kuang, Y.; Zhang, Y.; Peng, C.; Chen, G. Flexible and Highly Sensitive Humidity Sensor Based on Cellulose Nanofibers and Carbon Nanotube Composite Film. Langmuir 2019, 35, 4834–4842. [Google Scholar] [CrossRef]
  9. Maddali, H.; Tyryshkin, A.M.; O’Carroll, D.M. Dual-Mode Polymer-Based Temperature Sensor by Dedoping of Electrochemically Doped, Conjugated Polymer Thin Films. ACS Appl. Electron. Mater. 2021, 3, 4718–4725. [Google Scholar] [CrossRef]
  10. Skwierczyńska, M.; Woźny, P.; Runowski, M.; Kulpiński, P.; Lis, S. Optically Active Plasmonic Cellulose Fibers Based on Au Nanorods for SERS Applications. Carbohydr. Polym. 2022, 279, 119010. [Google Scholar] [CrossRef]
  11. Wang, G.; Jiang, G.; Zhu, Y.; Cheng, W.; Cao, K.; Zhou, J.; Lei, H.; Xu, G.; Zhao, D. Developing Cellulosic Functional Materials from Multi-Scale Strategy and Applications in Flexible Bioelectronic Devices. Carbohydr. Polym. 2022, 283, 119160. [Google Scholar] [CrossRef] [PubMed]
  12. Zheng, Y.; Xiao, M.; Jiang, S.; Ding, F.; Wang, J. Coating Fabrics with Gold Nanorods for Colouring, UV-Protection, and Antibacterial Functions. Nanoscale 2013, 5, 788–795. [Google Scholar] [CrossRef] [PubMed]
  13. Kaur, A.; Singh, R.C. Temperature Sensor Based on Exfoliated Graphene Sheets Produced by Microwave Assisted Freezing Induced Volumetric Expansion of Carbonated Water. J. Mater. Sci. Mater. Electron. 2019, 30, 5791–5807. [Google Scholar] [CrossRef]
  14. Shin, J.; Jeong, B.; Kim, J.; Nam, V.B.; Yoon, Y.; Jung, J.; Hong, S.; Lee, H.; Eom, H.; Yeo, J.; et al. Sensitive Wearable Temperature Sensor with Seamless Monolithic Integration. Adv. Mater. 2020, 32, 1905527. [Google Scholar] [CrossRef] [PubMed]
  15. Yang, J.; Wei, D.; Tang, L.; Song, X.; Luo, W.; Chu, J.; Gao, T.; Shi, H.; Du, C. Wearable Temperature Sensor Based on Graphene Nanowalls. RSC Adv. 2015, 5, 25609–25615. [Google Scholar] [CrossRef]
  16. Mikolajek, M.; Martinek, R.; Koziorek, J.; Hejduk, S.; Vitasek, J.; Vanderka, A.; Poboril, R.; Vasinek, V.; Hercik, R. Temperature Measurement Using Optical Fiber Methods: Overview and Evaluation. J. Sens. 2020, 2020, 8831332. [Google Scholar] [CrossRef]
  17. Moraleda, A.; García, C.; Zaballa, J.; Arrue, J. A Temperature Sensor Based on a Polymer Optical Fiber Macro-Bend. Sensors 2013, 13, 13076–13089. [Google Scholar] [CrossRef] [Green Version]
  18. Zhang, H.; Zhao, S.; Wang, X.; Ren, X.; Ye, J.; Huang, L.; Xu, S. The Enhanced Photoluminescence and Temperature Sensing Performance in Rare Earth Doped SrMoO4 Phosphors by Aliovalent Doping: From Material Design to Device Applications. J. Mater. Chem. C 2019, 7, 15007–15013. [Google Scholar] [CrossRef]
  19. Liu, Y.; Peng, W.; Liang, Y.; Zhang, X.; Zhou, X.; Pan, L. Fiber-Optic Mach–Zehnder Interferometric Sensor for High-Sensitivity High Temperature Measurement. Opt. Commun. 2013, 300, 194–198. [Google Scholar] [CrossRef]
  20. Tapetado, A.; Pinzon, P.J.; Zubia, J.; Vazquez, C. Polymer Optical Fiber Temperature Sensor With Dual-Wavelength Compensation of Power Fluctuations. J. Light. Technol. 2015, 33, 2716–2723. [Google Scholar] [CrossRef] [Green Version]
  21. Zheng, T.; Runowski, M.; Stopikowska, N.; Skwierczyńska, M.; Lis, S.; Du, P.; Luo, L. Dual-Center Thermochromic Bi2MoO6:Yb3+, Er3+, Tm3+ Phosphors for Ultrasensitive Luminescence Thermometry. J. Alloy. Compd. 2022, 890, 161830. [Google Scholar] [CrossRef]
  22. Abid; Sehrawat, P.; Julien, C.M.; Islam, S.S. E-Textile Based Wearable Thermometer from WS2 -Quantum Dots. Nanotechnology 2021, 32, 335503. [Google Scholar] [CrossRef]
  23. Brites, C.D.S.; Millán, A.; Carlos, L.D. Lanthanides in Luminescent Thermometry. In Handbook on the Physics and Chemistry of Rare Earths; Elsevier: Amsterdam, The Netherlands, 2016; Volume 49, pp. 339–427. [Google Scholar]
  24. Brites, C.D.S.; Balabhadra, S.; Carlos, L.D. Lanthanide-Based Thermometers: At the Cutting-Edge of Luminescence Thermometry. Adv. Opt. Mater. 2019, 7, 1801239. [Google Scholar] [CrossRef] [Green Version]
  25. Runowski, M. Pressure and Temperature Optical Sensors: Luminescence of Lanthanide-Doped Nanomaterials for Contactless Nanomanometry and Nanothermometry. In Handbook of Nanomaterials in Analytical Chemistry; Elsevier: Amsterdam, The Netherlands, 2020; pp. 227–273. ISBN 9780128166994. [Google Scholar]
  26. Runowski, M.; Woźny, P.; Martín, I.R. Optical Pressure Sensing in Vacuum and High-Pressure Ranges Using Lanthanide-Based Luminescent Thermometer–Manometer. J. Mater. Chem. C 2021, 9, 4643–4651. [Google Scholar] [CrossRef]
  27. Stopikowska, N.; Runowski, M.; Skwierczyńska, M.; Lis, S. Improving Performance of Luminescent Nanothermometers Based on Non-Thermally and Thermally Coupled Levels of Lanthanides by Modulating Laser Power. Nanoscale 2021, 13, 14139–14146. [Google Scholar] [CrossRef]
  28. Suo, H.; Zhao, X.; Zhang, Z.; Wang, Y.; Sun, J.; Jin, M.; Guo, C. Rational Design of Ratiometric Luminescence Thermometry Based on Thermally Coupled Levels for Bioapplications. Laser Photon. Rev. 2021, 15, 2000319. [Google Scholar] [CrossRef]
  29. Brites, C.D.S.; Fiaczyk, K.; Ramalho, J.F.C.B.; Sójka, M.; Carlos, L.D.; Zych, E. Widening the Temperature Range of Luminescent Thermometers through the Intra- and Interconfigurational Transitions of Pr3+. Adv. Opt. Mater. 2018, 6, 1701318. [Google Scholar] [CrossRef]
  30. Manzani, D.; Petruci, J.F.D.S.; Nigoghossian, K.; Cardoso, A.A.; Ribeiro, S.J.L. A Portable Luminescent Thermometer Based on Green Up-Conversion Emission of Er3+/Yb3+ Co-Doped Tellurite Glass. Sci. Rep. 2017, 7, 41596. [Google Scholar] [CrossRef]
  31. Wang, Q.; Liao, M.; Lin, Q.; Xiong, M.; Mu, Z.; Wu, F. A Review on Fluorescence Intensity Ratio Thermometer Based on Rare-Earth and Transition Metal Ions Doped Inorganic Luminescent Materials. J. Alloys Compd. 2021, 850, 156744. [Google Scholar] [CrossRef]
  32. Jaque, D.; Vetrone, F. Luminescence Nanothermometry. Nanoscale 2012, 4, 4301. [Google Scholar] [CrossRef]
  33. Zhu, K.; Zhou, H.; Qiu, J.; Wang, L.-G.; Ye, L. Optical Temperature Sensing Characteristics of Sm3+ Doped YAG Single Crystal Fiber Based on Luminescence Emission. J. Alloy. Compd. 2022, 890, 161844. [Google Scholar] [CrossRef]
  34. Luo, Y.; Zhang, L.; Liu, Y.; Heydari, E.; Chen, L.; Bai, G. Designing Dual-mode Luminescence in Er3+ Doped Y2WO6 Microparticles for Anticounterfeiting and Temperature Measurement. J. Am. Ceram. Soc. 2022, 105, 1375–1385. [Google Scholar] [CrossRef]
  35. Guo, J.; Zhou, B.; Yang, C.; Dai, Q.; Kong, L. Stretchable and Temperature-Sensitive Polymer Optical Fibers for Wearable Health Monitoring. Adv. Funct. Mater. 2019, 29, 1902898. [Google Scholar] [CrossRef]
  36. Suo, H.; Hu, F.; Zhao, X.; Zhang, Z.; Li, T.; Duan, C.; Yin, M.; Guo, C. All-in-One Thermometer-Heater up-Converting Platform YF3: Yb3+, Tm3+ Operating in the First Biological Window. J. Mater. Chem. C 2017, 5, 1501–1507. [Google Scholar] [CrossRef]
  37. Suo, H.; Zhao, X.; Zhang, Z.; Li, T.; Goldys, E.M.; Guo, C. Constructing Multiform Morphologies of YF: Er3+/Yb3+ up-Conversion Nano/Micro-Crystals towards Sub-Tissue Thermometry. Chem. Eng. J. 2017, 313, 65–73. [Google Scholar] [CrossRef]
  38. Pudovkin, M.S.; Ginkel, A.K.; Lukinova, E.V. Temperature Sensitivity of Nd3+, Yb3+:YF3 Ratiometric Luminescent Thermometers at Different Yb3+ Concentration. Opt. Mater. 2021, 119, 111328. [Google Scholar] [CrossRef]
  39. Runowski, M.; Woźny, P.; Martín, I.R.; Lavín, V.; Lis, S. Praseodymium Doped YF3:Pr3+ Nanoparticles as Optical Thermometer Based on Luminescence Intensity Ratio (LIR)—Studies in Visible and NIR Range. J. Lumin. 2019, 214, 116571. [Google Scholar] [CrossRef]
  40. Gong, J.; Li, J.; Xu, J.; Xiang, Z.; Mo, L. Research on Cellulose Nanocrystals Produced from Cellulose Sources with Various Polymorphs. RSC Adv. 2017, 7, 33486–33493. [Google Scholar] [CrossRef] [Green Version]
  41. Gupta, P.K.; Uniyal, V.; Naithani, S. Polymorphic Transformation of Cellulose I to Cellulose II by Alkali Pretreatment and Urea as an Additive. Carbohydr. Polym. 2013, 94, 843–849. [Google Scholar] [CrossRef]
  42. Öztürk, H.B.; Potthast, A.; Rosenau, T.; Abu-Rous, M.; MacNaughtan, B.; Schuster, K.C.; Mitchell, J.R.; Bechtold, T. Changes in the Intra- and Inter-Fibrillar Structure of Lyocell (TENCEL®) Fibers Caused by NaOH Treatment. Cellulose 2009, 16, 37–52. [Google Scholar] [CrossRef]
  43. Runowski, M.; Shyichuk, A.; Tymiński, A.; Grzyb, T.; Lavín, V.; Lis, S. Multifunctional Optical Sensors for Nanomanometry and Nanothermometry: High-Pressure and High-Temperature Upconversion Luminescence of Lanthanide-Doped Phosphates—LaPO4/YPO4:Yb3+ –Tm3+. ACS Appl. Mater. Interfaces 2018, 10, 17269–17279. [Google Scholar] [CrossRef] [PubMed]
  44. Martins, J.C.; Bastos, A.R.N.; Ferreira, R.A.S.; Wang, X.; Chen, G.; Carlos, L.D. Primary Luminescent Nanothermometers for Temperature Measurements Reliability Assessment. Adv. Photonics Res. 2021, 2, 2000169. [Google Scholar] [CrossRef]
  45. Balabhadra, S.; Debasu, M.L.; Brites, C.D.S.; Ferreira, R.A.S.; Carlos, L.D. Upconverting Nanoparticles Working as Primary Thermometers in Different Media. J. Phys. Chem. C 2017, 121, 13962–13968. [Google Scholar] [CrossRef]
  46. Liu, W.; Wang, X.; Zhu, Q.; Li, X.; Sun, X.; Li, J.-G. Upconversion Luminescence and Favorable Temperature Sensing Performance of Eulytite-Type Sr3Y(PO4)3: Yb3+/Ln3+ Phosphors (Ln=Ho, Er, Tm). Sci. Technol. Adv. Mater. 2019, 20, 949–963. [Google Scholar] [CrossRef] [PubMed] [Green Version]
  47. Ngo, T.T.; Cabello-Olmo, E.; Arroyo, E.; Becerro, A.I.; Ocaña, M.; Lozano, G.; Míguez, H. Highly Versatile Upconverting Oxyfluoride-Based Nanophosphor Films. ACS Appl. Mater. Interfaces 2021, 13, 30051–30060. [Google Scholar] [CrossRef] [PubMed]
  48. Chai, G.; Dong, G.; Qiu, J.; Zhang, Q.; Yang, Z. Phase Transformation and Intense 2.7 Μm Emission from Er3+ Doped YF3/YOF Submicron-Crystals. Sci. Rep. 2013, 3, 1598. [Google Scholar] [CrossRef] [Green Version]
  49. Carrillo, F.; Colom, X.; Suñol, J.; Saurina, J. Structural FTIR Analysis and Thermal Characterisation of Lyocell and Viscose-Type Fibres. Eur. Polym. J. 2004, 40, 2229–2234. [Google Scholar] [CrossRef]
  50. Tan, W.; Ren, Y.; Xiao, M.; Guo, Y.; Liu, Y.; Zhang, J.; Zhou, X.; Liu, X. Enhancing the Flame Retardancy of Lyocell Fabric Finished with an Efficient, Halogen-Free Flame Retardant. RSC Adv. 2021, 11, 34926–34937. [Google Scholar] [CrossRef]
  51. Freitas, R.A. Nanomedicine, Volume I: Basic Capabilities; Landes Bioscience: Austin, TX, USA, 1999; Volume I, ISBN 1-57059-645-X. [Google Scholar]
  52. Sadasivuni, K.K.; Kafy, A.; Kim, H.-C.; Ko, H.-U.; Mun, S.; Kim, J. Reduced Graphene Oxide Filled Cellulose Films for Flexible Temperature Sensor Application. Synth. Met. 2015, 206, 154–161. [Google Scholar] [CrossRef]
  53. Yi, H.; Lee, S.-H.; Kim, D.; Jeong, H.E.; Jeong, C. Colorimetric Sensor Based on Hydroxypropyl Cellulose for Wide Temperature Sensing Range. Sensors 2022, 22, 886. [Google Scholar] [CrossRef]
  54. Wei, Y.; Qian, Y.; Zhu, P.; Xiang, L.; Lei, C.; Qiu, G.; Wang, C.; Liu, Y.; Liu, Y.; Chen, G. Nanocellulose-Templated Carbon Nanotube Enhanced Conductive Organohydrogel for Highly-Sensitive Strain and Temperature Sensors. Cellulose 2022, 29, 3829–3844. [Google Scholar] [CrossRef]
Figure 1. (a) Scheme of the formation of the upconversion cellulose fibers; (b) powder XRD patterns of modifier NPs, and modified and unmodified cellulose fibers; (c) TEM image of YF3 NPs; inset shows size distribution of NPs.
Nanomaterials 12 01926 g001
Figure 2. SEM-EDX analysis: (a) SEM images of the fibers surface and (b) cross-section; (c) EDX-mapping of yttrium, (d) fluoride, (e) ytterbium, and (f) erbium; inset presents the field of view.
Nanomaterials 12 01926 g002
Figure 3. (a) Scheme of the energy level diagram of Yb3+ and Er3+, showing possible upconversion processes in the YF3: Yb3+, Er3+ system, (b) upconversion emission spectra of YF3-modified fibers, and (c) the corresponding chromaticity diagram; the inset shows photographs of a knitted fabric made of YF3-modified fibers in daylight (left) and under NIR (λex = 975 nm) laser irradiation (right).
Nanomaterials 12 01926 g003
Figure 4. Spectroscopic properties of YF3-modified fibers (λex=975 nm): (a) upconversion emission spectra measured as a function of temperature; (b) CIE diagram showing the emission color of YF3-modified fibers with increasing temperature values (left) and corresponding photographs of a knitted fabric made of YF3-modified fibers NIR excitation (right); (c) luminescence intensity ratios, corresponding to (d) the relative sensitivities Sr and (e) the temperature resolution ΔT.
Nanomaterials 12 01926 g004
Figure 5. Optical setup for temperature sensing based on a knitted fabric made of YF3-modified fibers.
Nanomaterials 12 01926 g005
Table 1. Mechanical properties of the fibers.
Unmodified Cellulose
Fibers
YF3-Modified Cellulose
Fibers
Elastic modulus [cN/tex]12181519
Tenacity [cN/tex]28.726.2
Elongation at break [%]9.48.0
Linear density [tex]0.32641.450
Table 2. Comparison of the cellulose-based temperature sensors reported in the literature with the YF3-modified cellulose fibers shown in this work.
MaterialType of SensorSensing Range [K]ΔT [K]Sr,
[% K−1]
Susceptible to EMIRef.
YF3-modified cellulose fibersRatiometric UC298–3620.09 (at 298 K)1.23 (at 289 K)NoThis work
Cellulose-PPy nanocompositeCapacitive288–323n.d.n.d.Yes[4]
PEDOT-PSS-SWCNT coated jute fibersResistive297–308n.d.0.23Yes[5]
WS2-QDs/RGO coated cotton fabricResistive77–3980.01 (0.06 human trial)0.56 (298-396 K)Yes[22]
Cellulose/RGO composite filmsCapacitive298–353n.dn.dYes[52]
HPC-ethylene glycolColorimetric253–2982n.a.No[53]
CNF/CNT nanohybridResistive303–353n.d.1.081Yes[54]
Abbreviations: CNF = cellulose nanofiber, CNT = carbon nanotube, HPC = hydroxypropyl cellulose, PEDOT = poly(3,4-ethylenedioxythiophene), PPy = polypyrrole, PSS = polystyrene sulfonate, RGO = reduced graphene oxide, SWCNT = single-walled carbon nanotubes, QDs = quantum dots.
Publisher’s Note: MDPI stays neutral with regard to jurisdictional claims in published maps and institutional affiliations.

