Abstract
Highly active metal-free mesoporous phosphated silica was synthesized by a two-step process and used as a SO2 hydrogenation catalyst. With the assistance of a microwave, MCM-41 was obtained within a 10 min heating process at 180 °C, then a low ratio of P precursor was incorporated into the mesoporous silica matrix by a phosphorization step, which was accomplished in oleylamine with trioctylphosphine at 350 °C for 2 h. For benchmarking, the SiO2 sample without P precursor insertion and the sample with P precursor insertion into the calcined SiO2 were also prepared. From the microstructural analysis, it was found that the presence of CTAB surfactant was important for the incorporation of active P species, thus forming a highly dispersed, ultrafine (uf) phosphate silica, (Si-P) catalyst. The above approach led to the promising catalytic performance of uf-P@meso-SiO2 in the selective hydrogenation of SO2 to H2S; the latter reaction is very important in sulfur-containing gas purification. In particular, uf-P@meso-SiO2 exhibited activity at the temperature range between 150 and 280 °C, especially SO2 conversion of 94% and H2S selectivity of 52% at 220 °C. The importance of the CTAB surfactant can be found in stabilizing the high dispersion of ultrafine P-related species (phosphates). Intrinsic characteristics of the materials were studied using XRD, FTIR, EDX, N2 adsorption/desorption, TEM, and XPS to reveal the structure of the above catalysts.
1. Introduction
There is growing concern about the harmful effects of sulfur dioxide (SO2) from industrial exhaust gas on human health and the environment. Recovering sulfur from sulfur-containing gases by catalytic processes is one of the promising solutions for waste gas purification [1]. In 2019, the global market size of hydrodesulfurization catalysts was USD 2.46 billion, and between 2020 and 2027, it is projected to grow at a 4.4% annual rate. Over the last decade, rigorous environmental regulation has permitted the manufacture of low-sulfur fuels; however, there remains a huge market demand for catalysts that can be applied to convert low-sulfur-containing gases to ultralow or sulfur-free exhaust gas [2].
Currently, the commercial technologies of sulfur-containing gas hydrodesulfurization (HDS) are based on the cobalt/molybdenum sulfides supported on γ-alumina (CoMoS@Al2O3) [3,4]. Several studies have reported SO2 hydrogenation, in which the products are either sulfur or H2S. Based on the selectivity of catalysts [5,6,7,8,9], these products can be easily collected or recovered using absorption/adsorption technologies [10,11,12,13]. These SO2 hydrogenation processes were taken above 300 °C, which demand high energy consumption. Improving the activity of catalysts in a lower temperature range remains a challenge.
Transition metal phosphides (TMPs) have excellent capacity and good application prospects for hydroprocessing reactions. Among the TMPs, the nickel phosphide catalyst is considered the most active for hydroprocessing, even better than the commercial CoMoS@Al2O3 catalyst [14,15]. Recently, our group reported on Ni2P and Ni5P4 catalysts for the selective hydrogenation of SO2 to S and H2S [16,17]. By fine control of the phase, size, and morphologies of nickel phosphide, the SO2 hydrogenation process can take place in the temperature range of 200–300 °C. DFT studies of Ni2P and Ni5P4 catalysts have investigated the stability of different surfaces of nickel phosphides, which provide a deeper understanding of the adsorption and desorption of SO2 and H2 on the surface of nickel phosphide catalysts [18,19,20].
To improve catalyst performance below 200 °C, herein, we report a metal-free phosphate mesoporous silica (Si-P) catalyst for the low-temperature conversion of SO2 in hydrogen. By one-pot rapid microwave synthesis, mesoporous SiO2 with a high surface area and pore volume was developed within 15 min, then after a 2 h phosphorization step in oleylamine (OAm) and trioctylphosphine (TOP), a phospated mesoporous silica (Si-P) catalyst was obtained. This metal-free mesoporous Si-P catalyst shows an unexpected high selectivity to H2S and was tested for SO2 hydrogenation in the temperature range of 160–240 °C. The effect of silica, phosphorus, and surfactant will be discussed in what follows.
2. Experimental Section
2.1. Chemicals
Oleylamine, (OAm, ≥98%, Aldrich, St. Louis, MO, USA), trioctylphosphine (TOP, 97%, Aldrich, St. Louis, MO, USA), ethanol (≥99.8% for HPLC, Aldrich, St. Louis, MO, USA), Ludox® HS-40 colloidal silica (40 wt.% in H2O, Sigma-Aldrich, St. Louis, MO, USA), sodium hydroxide (NaOH, 98%, Acros, Fair Lawn, NJ, USA), hexadecyl trimethyl ammonium bromide (CTAB, 98%, Sigma, St. Louis, MO, USA), and n-hexane (95% anhydrous, Aldrich, St. Louis, MO, USA) were used as received.
2.2. Catalyst Synthesis
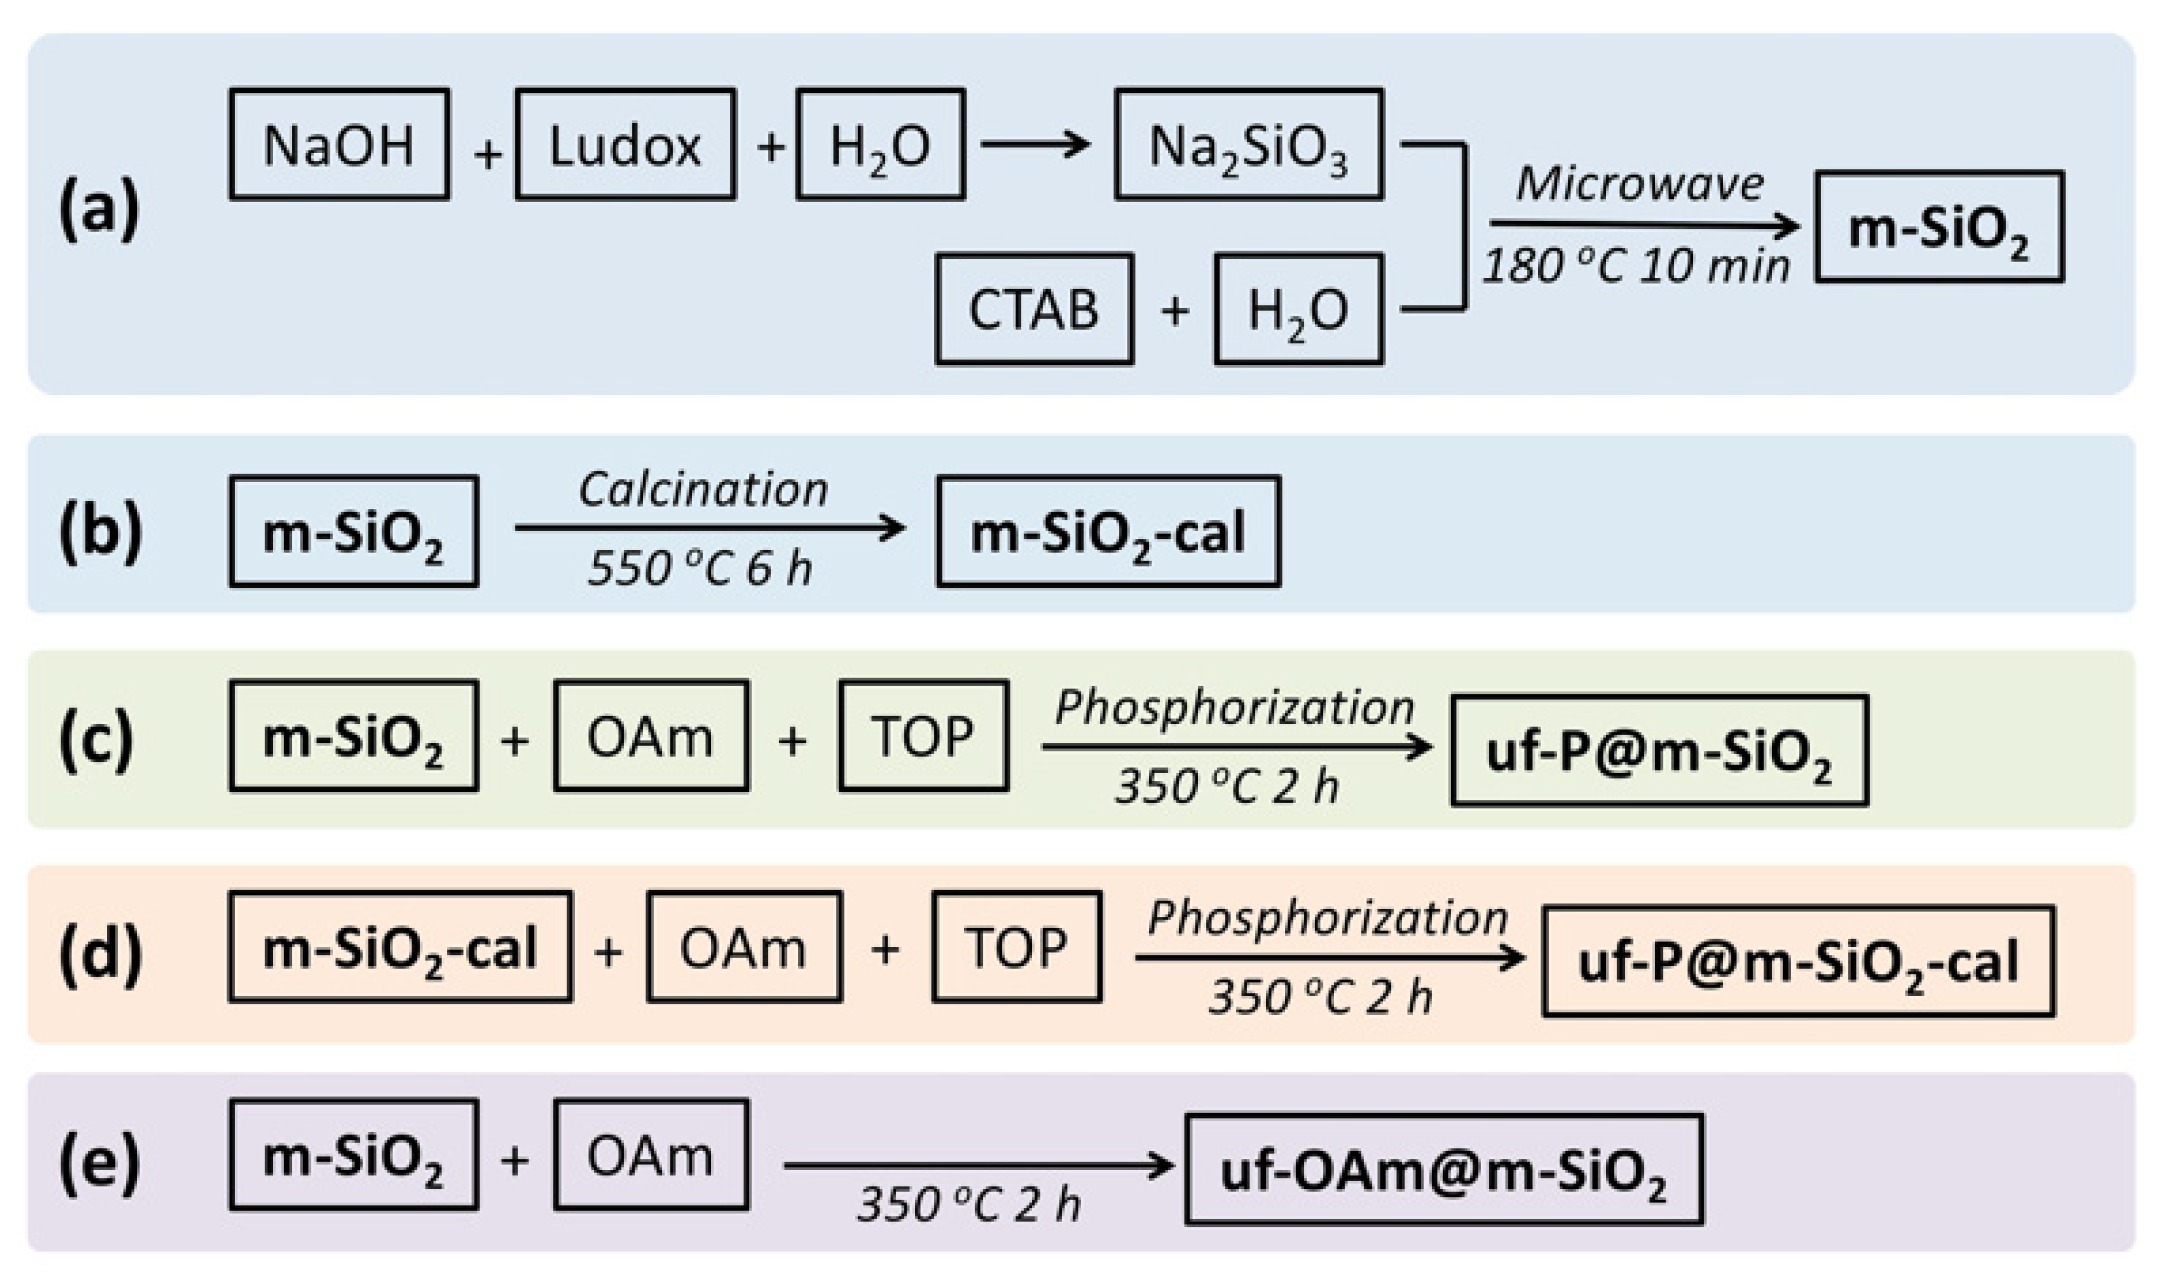
The systematic methodology of synthesis was followed as shown in Scheme 1, and the catalyst preparation steps involved in each sample are presented in Table 1.
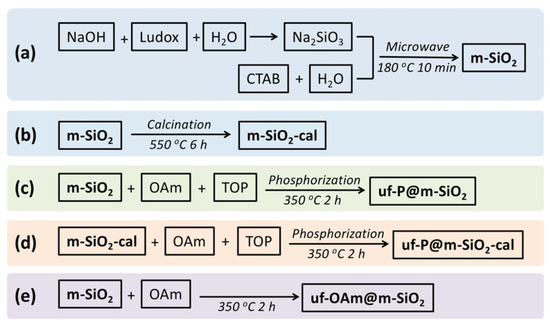
Scheme 1.
Synthetic routes indicating the preparation of the different catalysts of this study. (a) Microwave synthesis of m-SiO2 [21,22]. A 16 g amount of NaOH was dissolved in 400 mL H2O, then 94 mL Ludox (40 wt.%) was added to the above NaOH solution. This mixture was stirred at 40 °C in a sealed polypropylene bottle overnight until the preparation of a clear Na2SiO3 solution was achieved. A 1.0 g amount of CTAB and 35 mL H2O were mixed in a sealed polypropylene bottle, then the above solution was stirred slowly at 60 °C for 1 h to achieve a clear viscous solution. At the same time, 25 g of the above Na2SiO3 solution were stirred at 60 °C in a sealed polypropylene bottle for 1 h. Then, the CTAB solution was added to the Na2SiO3 solution. After 1 h of vigorous stirring at 60 °C, this mixture was removed into a 100 mL Teflon autoclave and placed in the microwave reactor (CEM MARS™ 6 Microwave Digestion and Extraction System), where a program of 5 min ramp heating to 180 °C and dwell time of 10 min at 180 °C was applied, followed by cooling to room temperature. To remove the excess of the surfactants, the solid was filtered on a Büchner funnel and washed with deionized water several times until there were no bubbles in the waste water. Then, the white solid was dried in an oven at 80 °C overnight to obtain an average of 1.5 g white powder m-SiO2. (b) Preparation of m-SiO2-cal [21,22]. The above-mentioned m-SiO2 was calcined in a tube furnace with the following stepwise process: the calcination program was set as 2 °C/min to ramp up from room temperature to 550 °C, and heating at 550 °C for 6 h, then cooled down in air. The obtained white powder was named m-SiO2-cal. (c) Preparation of uf-P@m-SiO2 [16,17]. In N2 atmosphere, 0.5 g m-SiO2 was first mixed with 10 mL OAm and 5 mL TOP in a three-necked flask. This mixture was under magnetic stirring for 10 min at 80 °C, then stirred at 350 °C for 2 h. These operations should be run carefully in the fume hood to avoid serious poisoning and damage to the skin and eyes caused by the TOP and its vapor. After cooling to room temperature, the powder was precipitated by centrifugation for 3 min at 4000 rpm, then washed with ethanol and hexane more than 3 times to remove the excess of the OAm and TOP on the surface of the powders. Finally, the resulting solid was dried in an oven at 80 °C overnight and named uf-P@m-SiO2. (d) Preparation of uf-P@m-SiO2-calIn N2 atmosphere. A 0.5 g amount of m-SiO2-cal was first mixed with 10 mL OAm and 5 mL TOP in a three-necked flask. The following procedures were the same as the preparation of uf-P@m-SiO2. (e) Preparation of uf-OAm@m-SiO2. In N2 atmosphere, 0.5 g m-SiO2 was first mixed with 10 mL OAm in a three-necked flask without any addition of TOP. The following procedures were the same as the preparation of uf-P@m-SiO2.

Table 1.
Catalyst preparation steps based on the synthesis procedures followed.
2.3. Catalytic Assessment: Reaction Metrics
The SO2 selective hydrogenation experiments were run in a fixed bed U-shaped quartz tube reactor (4 mm internal diameter) at atmospheric pressure. A 40 mg catalyst was diluted with 180 mg quartz particles (125 to 250 μm) and loaded into the reactor, followed by a pretreatment in Ar (40 mL/min) at 100 °C for 1 h. The height of the catalyst bed was about 2 cm, which was fixed by the quartz wool, and the volume of the catalyst bed was about 0.25 mL. Then, a feed gas containing SO2 (103 ppm, 20 mL/min) and H2 (20 mL/min, 2% in N2) were fed into the reactor. The total feed gas was set as 40 mL/min (GHSV = ~50,000 h−1). The reaction was run across the temperature range of 100–280 °C. The SO2 conversion to H2S for the sample was determined after 20 min on stream at 100 °C, then the temperature was increased to 120 °C and kept for 20 min. After each 20 min at a temperature platform, the temperature was set to increase by 20 °C until 280 °C. The reactants and reaction products were analyzed by a PerkinElmer Clarus 580 Gas Chromatograph (GC)-Model Arnel 4025 PPC and Model Arnel 4016 PPC Sulphur Chemiluminescence Detector (SCD) [16,17].
The conversion of SO2 can be described based on the following reactions:
The yield of H2S, the conversion of SO2, and the selectivity to H2S were calculated based on the peak area of H2S and SO2 using the following equations:
where (H2S)out is the H2S molar flow rate in the exhaust gas (mol/s), (SO2)in is the SO2 molar flow rate in the feed gas (mol/s), and (SO2)out is the SO2 molar flow rate in the exhaust gas (mol/s).
2.4. Characterization of Catalyst Structure
Glancing angle X-ray powder diffraction analysis was carried out using a Rigaku Ultima IV X-ray diffractometer with the CuKα radiation (λ = 1.5406 Å, 35 kV, 25 mA). Nitrogen adsorption/desorption isotherms were recorded at 77 K using a 3Flex Micromeritics (Atlanta, GA, USA) instrument (~90 mg sample was pretreated at 100 °C in vacuum overnight for degassing). The morphologies of the catalysts were determined using a high-resolution transmission electron microscopy HR-TEM (FEI Tecnai, 200 kV). Nanoscale TEM elemental mapping was carried out using JEM-F200 electron microscope (EX-37001). Fourier transform infrared spectra were measured by a FTIR-FRONTIER/PERKIN ELMER spectrometer. Elemental analysis was conducted in an FEI Quanta 250 FEG scanning microscope (SEM). The atomic percentage (%) of the components was calculated from five measurements done at various locations/magnifications. The photoelectron spectra of the samples were carried out using a ThermoFisher Scientific k-alpha X-ray Photoelectron Spectrometer (East Grinstead, UK, monochromatic Al Kα X-ray source, hv = 1486.6 eV). The wide scan spectra were recorded using an analyzer pass energy of 300 eV. For the high-resolution core-level spectra, the pass energy was reduced to 50 eV. Quantification was performed using instrument-modified sensitivity factors following a Shirley background removal. The binding energies given are referenced to the adventitious C 1 s peak at 285.0 eV.
3. Results and Discussion
3.1. Catalyst Characterization
The low-angle XRD patterns of samples in Figure 1 display three characteristic peaks corresponding to the (100), (110), and (200) plane diffractions, respectively, typical of the hexagonal structure (p6mm symmetry) of MCM-41 [21,22]. In addition to the broad peak originating from the amorphous SiO2 at around 20° [23], no other obvious peaks were observed between 2θ of 10° and 70° (Figure S1), showing the absence of any crystalline phase related to P species. For the uf-P@m-SiO2-cal and m-SiO2-cal samples, the diffraction peaks decrease after the removal of the surfactant by calcination (550 °C in air), while for the uf-P@m-SiO2 sample, the phosphorization process (350 °C in OAm) did not lead to collapse of the hexagonal structure.
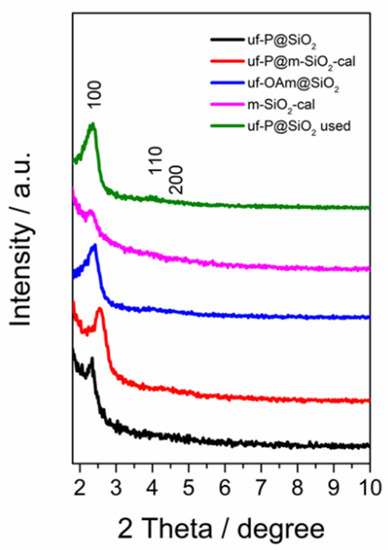
Figure 1.
Glancing angle XRD patterns uf-P@m-SiO2 (fresh and used), uf-P@m-SiO2-cal, uf-OAm@m-SiO2, and m-SiO2-cal samples.
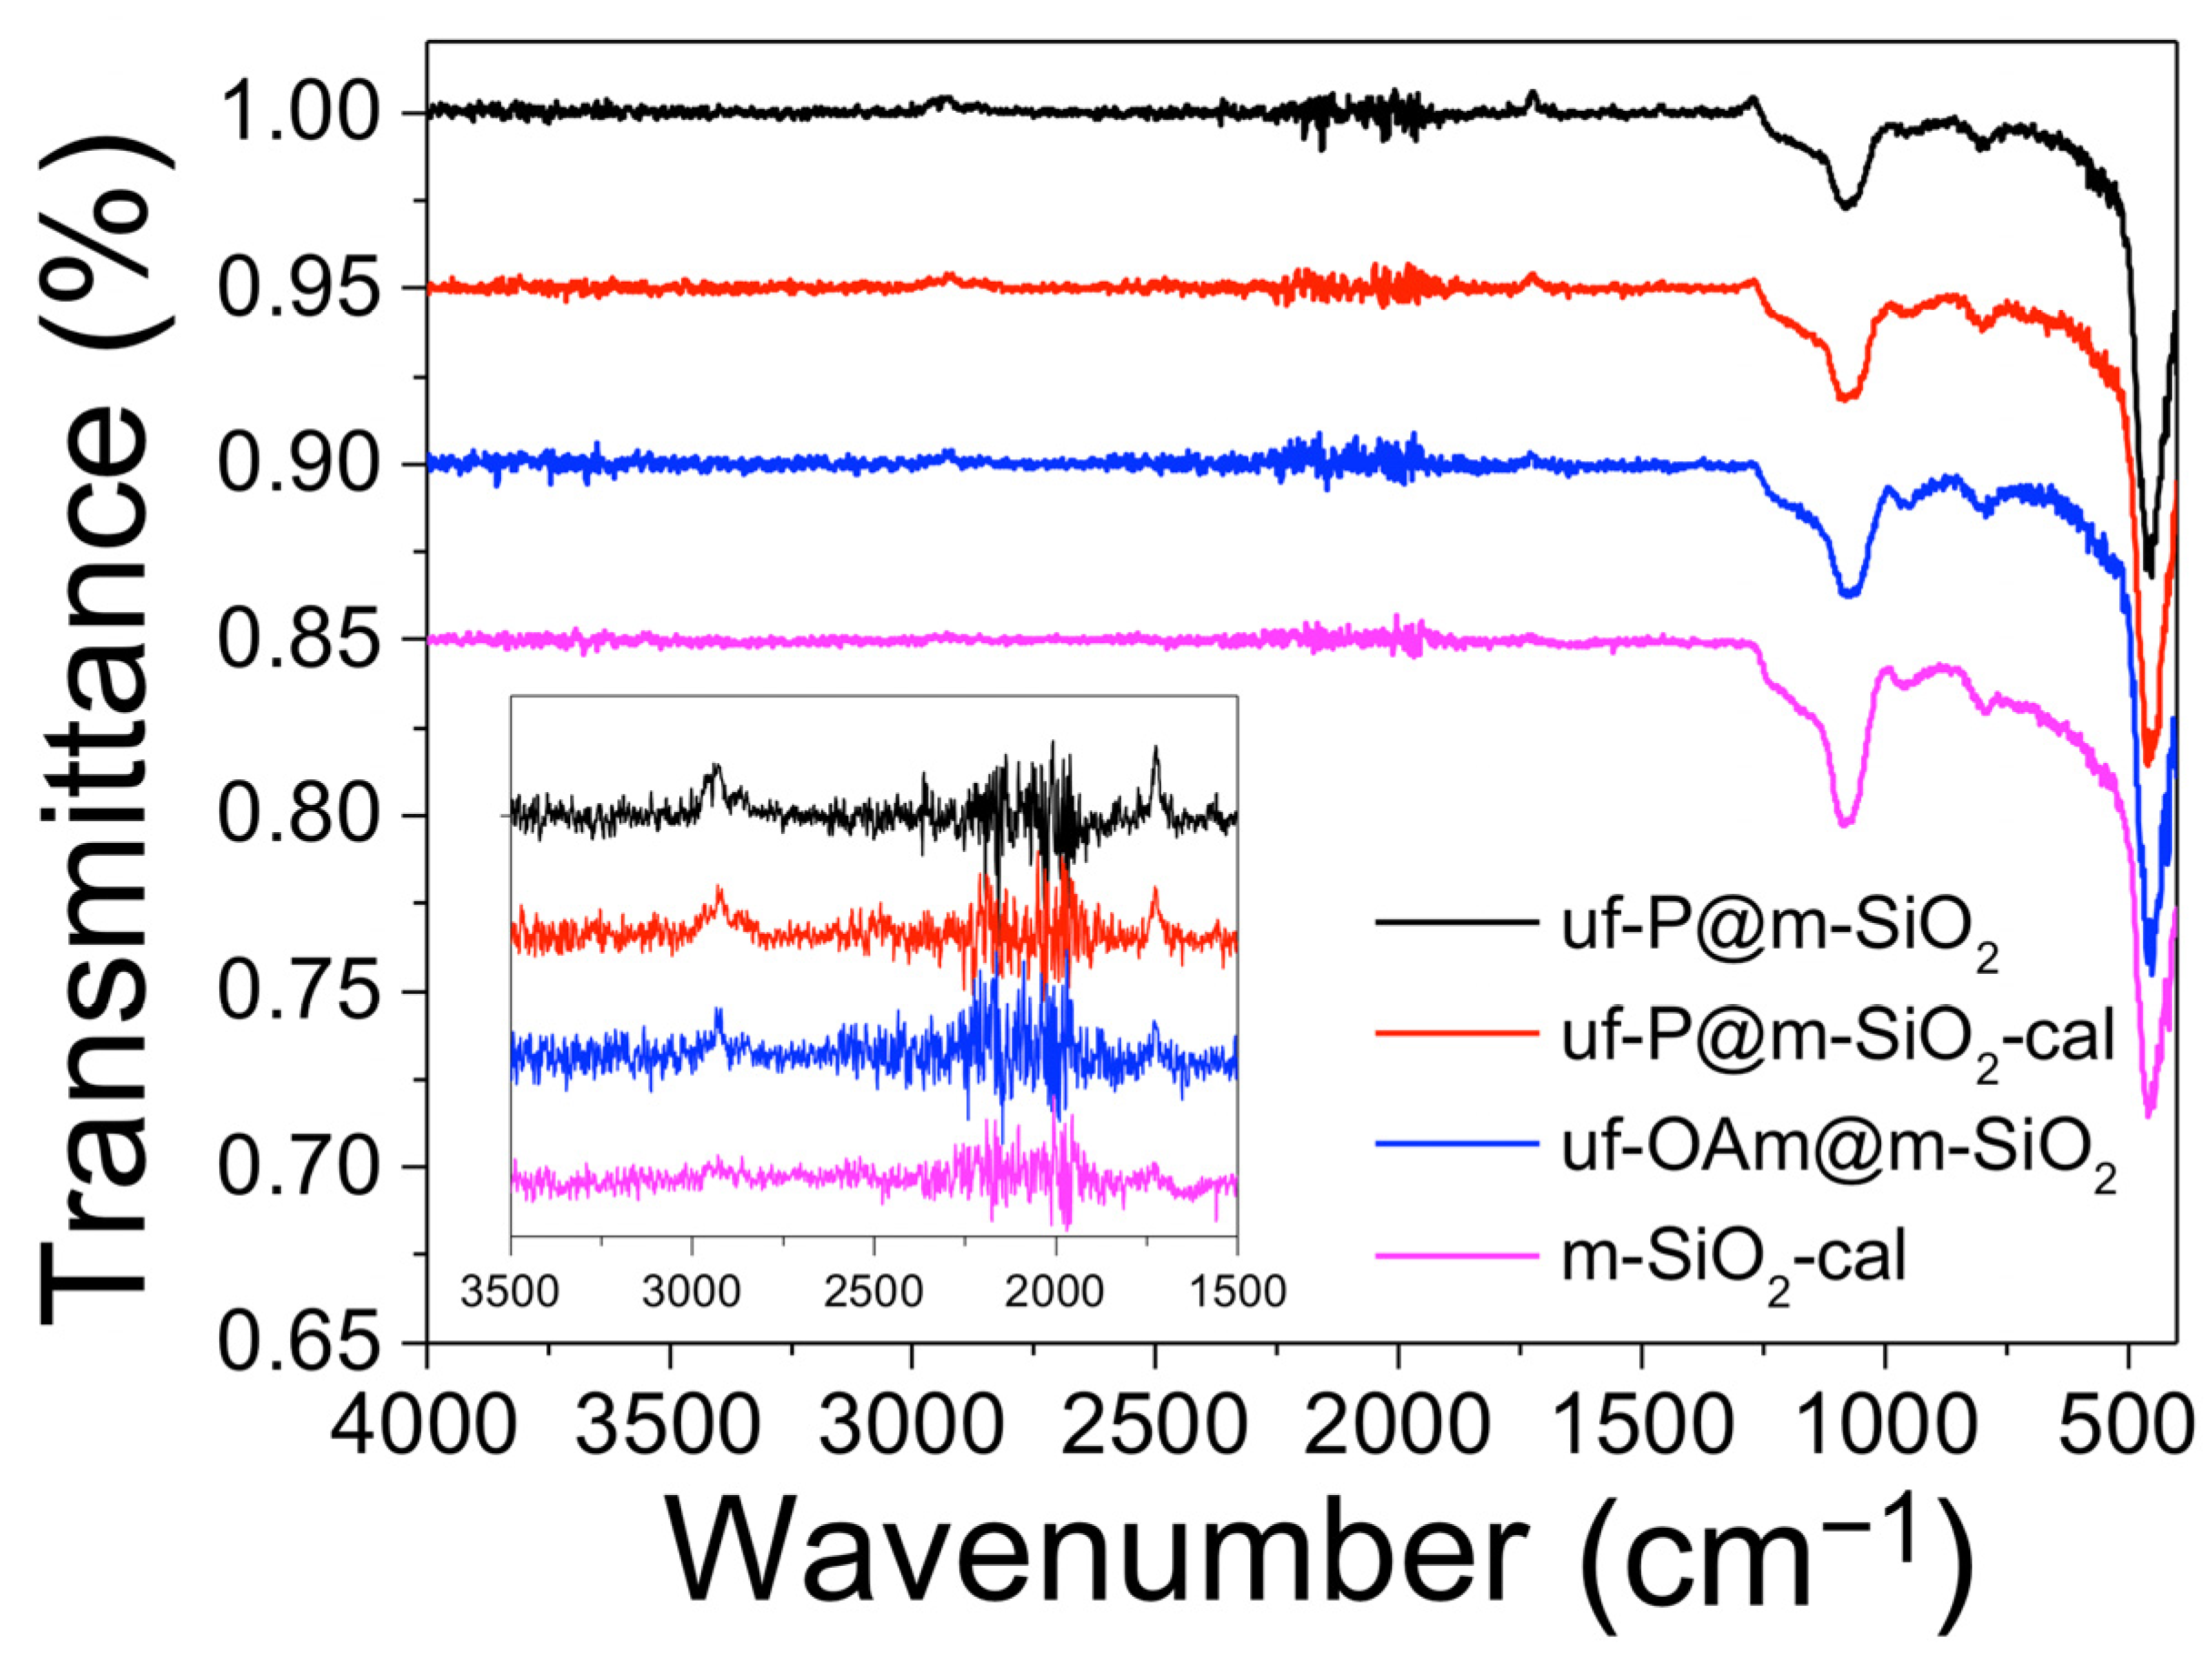
In Figure 2, all four samples present typical FTIR bands of the MCM-41 matrix [24]. The peaks at around 800 cm−1 corresponding to the Si–OH bending vibration and at around 960 cm−1 are the peaks of the Si-OH bond stretching vibration of silanol groups. The peaks centered at 1080 cm−1 and 1230 cm−1 correspond to the Si–O–Si asymmetric stretching vibration. The small peaks at 1725 cm−1 indicate the existence of –C=O stretch, which comes from the residual CTAB and OAm. The peaks at 2870 cm−1, 2930 cm−1, and 2950 cm−1 are associated with the –C–H stretching vibration of residual CTAB and OAm. In the 1100–1250 cm−1 region, the peaks related to phosphates can be found. However, due to their overlapping with other peaks and the low P precursor loading, it is rather difficult to clearly observe the peaks assigned to P-related functional groups. The phosphates origin can be due to the fact that TOP (P-bearing precursor compound) reacts at 350 °C/2 h with silica O2−/OH− groups, part of the P-compound decomposes (carbon chain), and the P centers react with O2−/OH− from silica forming the phosphates.
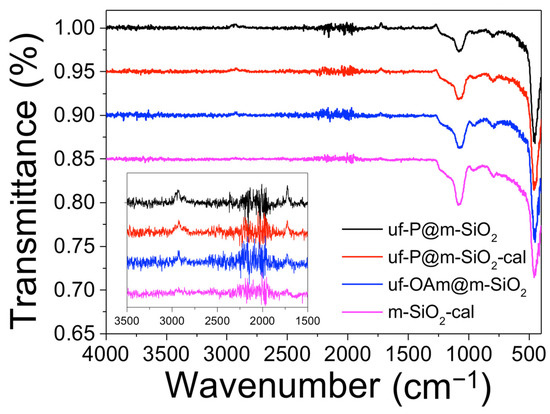
Figure 2.
Fourier transform infrared (FTIR) spectra of uf-P@m-SiO2, uf-P@m-SiO2-cal, uf-OAm@m-SiO2, and m-SiO2-cal samples.
The phosphorization process took place by mixing 10 mL oleylamine and 5 mL trioctylphosphine. A 0.5 g amount of SiO2 powder was dispersed into the above solution. The initial atomic ratio of P to Si is between 1 and 2, and excess P compared to Si in the initial mixture was introduced to ensure the sufficient access of P to the SiO2 matrix. The final loading of P to Si is less than 0.1% (Table 2 and Table S1), as the P was highly dispersed onto the SiO2 matrix. The loading of P compared to the SiO2 matrix, expressed as the P/Si atomic concentration ratio and determined by SEM-EDX and XPS, is shown in Table 2, showing the P/Si atomic concentration ratio. Si in the fresh samples of uf-P@m-SiO2 and uf-P@m-SiO2-cal is about 0.4%, and 0.8%, respectively, while in the spent samples of uf-P@m-SiO2 and uf-P@m-SiO2-cal, it is about 0.4% and 1.1%, respectively. No P was found in the samples uf-OAm@m-SiO2 and m-SiO2-cal. The relatively low P content assures the high dispersion of phosphate groups.
Table 2.
SEM-EDX and XPS determined P/Si atomic concentration ratio of the catalysts before and after the catalytic performance test.
The textural property of uf-P@m-SiO2 was studied by N2 adsorption/desorption experiments at 77 K. The collected isotherm along with the pore size distributions are presented in Figure 3. According to the IUPAC classification, Figure 3 exhibits the typical type IV isotherm [25]. There are three different volume increases: the increases at low, medium, and high relative pressure, which correspond to the filling of microporous, mesoporous, and intergrain volumes, respectively. For uf-P@m-SiO2, the BET surface area is 533 m2/g, the pore volume is 0.38 cm3/g, and the BJH pore size sharp peaks are centered at 2.5 nm, which is attributed to the mesoporous channels. Compared to the surface area and pore volume of MCM-41 in the literature (~1000 m2/g, ~1.0 cm3/g) [21,22], the pores of uf-P@m-SiO2 are partially occupied, covered with the residual surfactant, and incorporated of P into the SiO2 structure, the latter being an active nonporous phase.
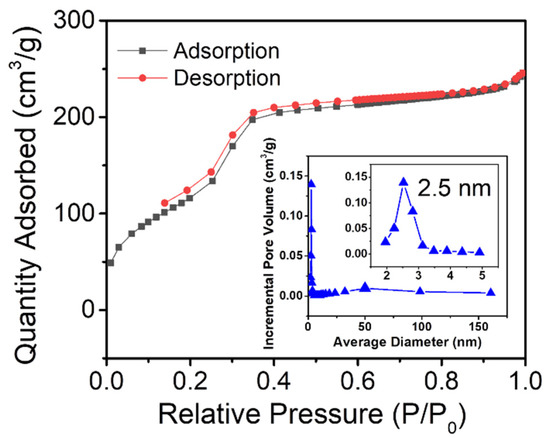
Figure 3.
N2 adsorption/desorption isotherms of uf-P@m-SiO2 with their average pore width versus incremental pore volume, determined via the BJH method by desorption isotherms.
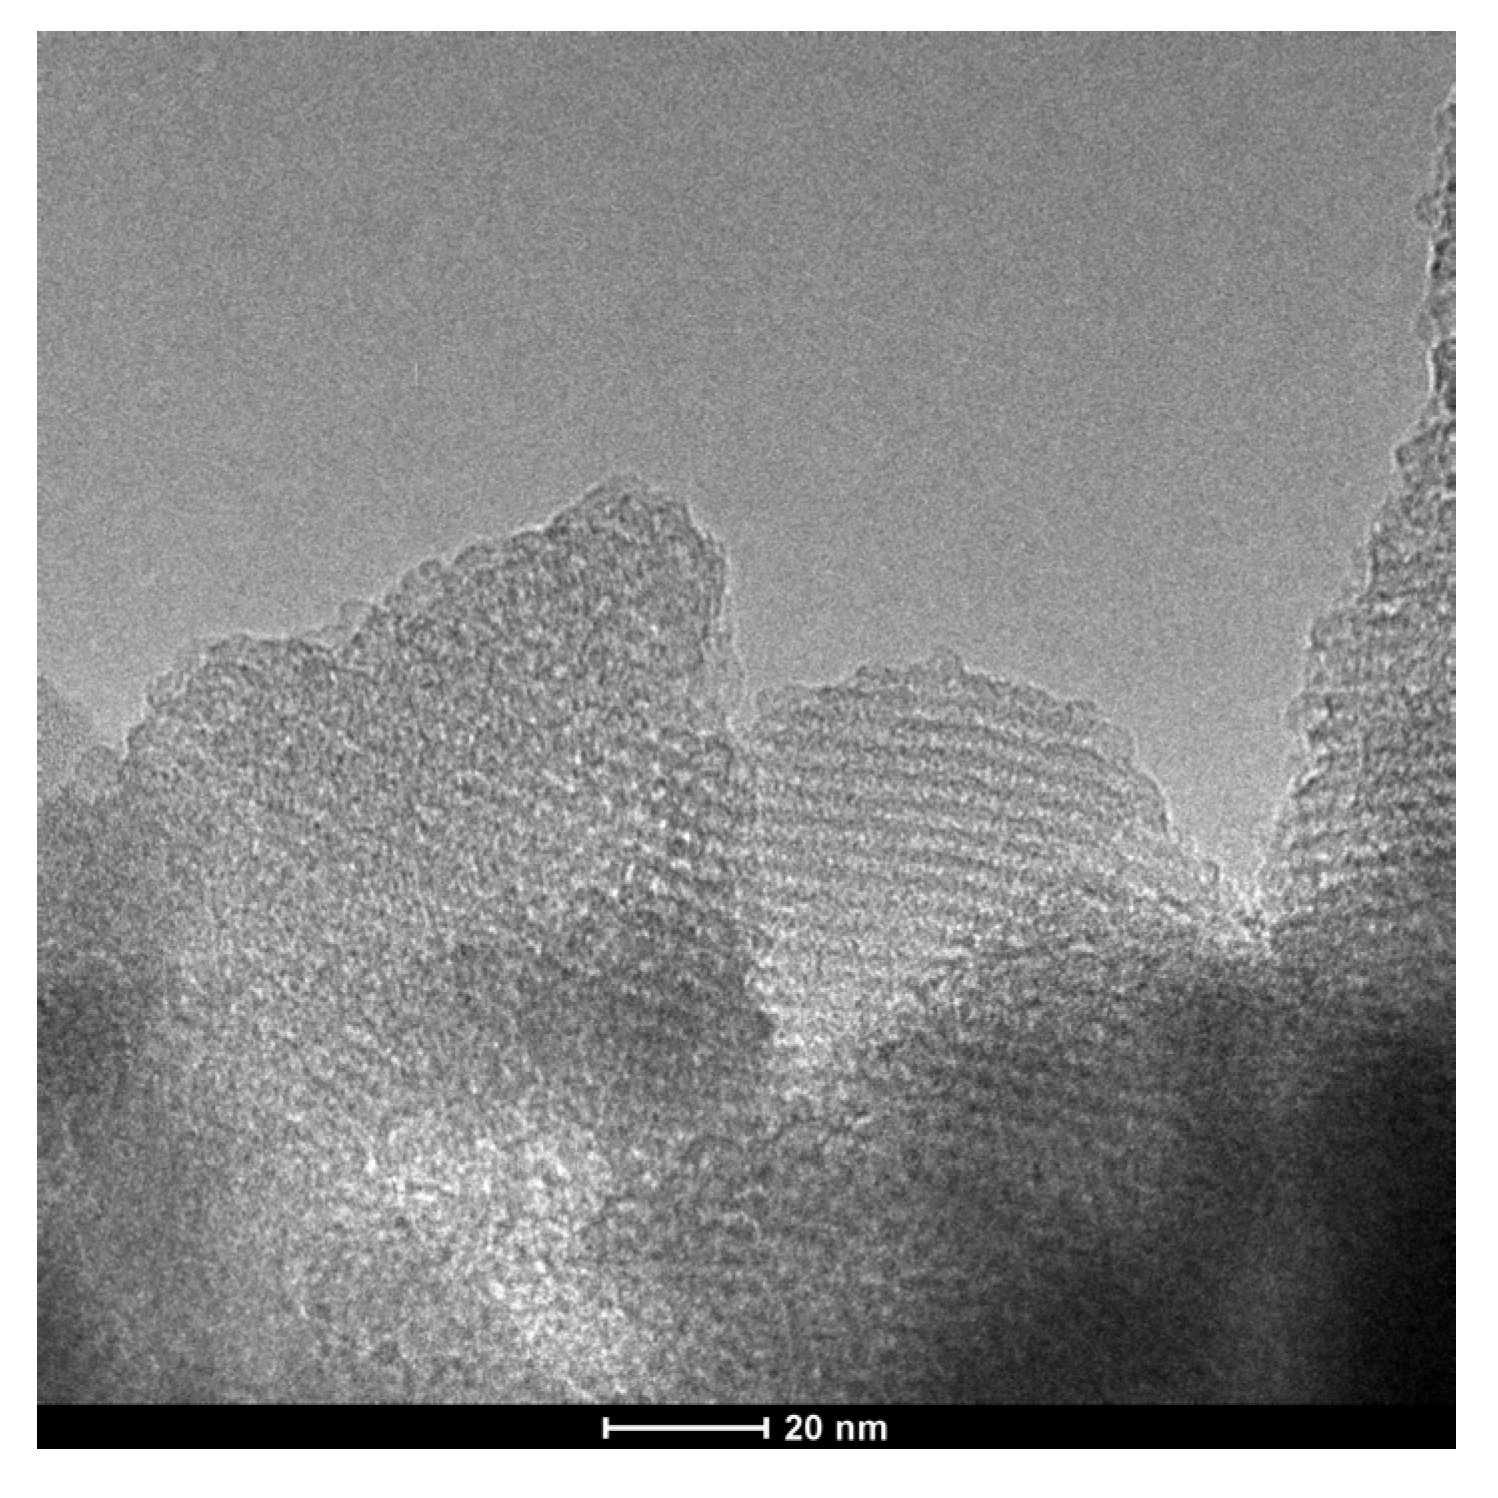
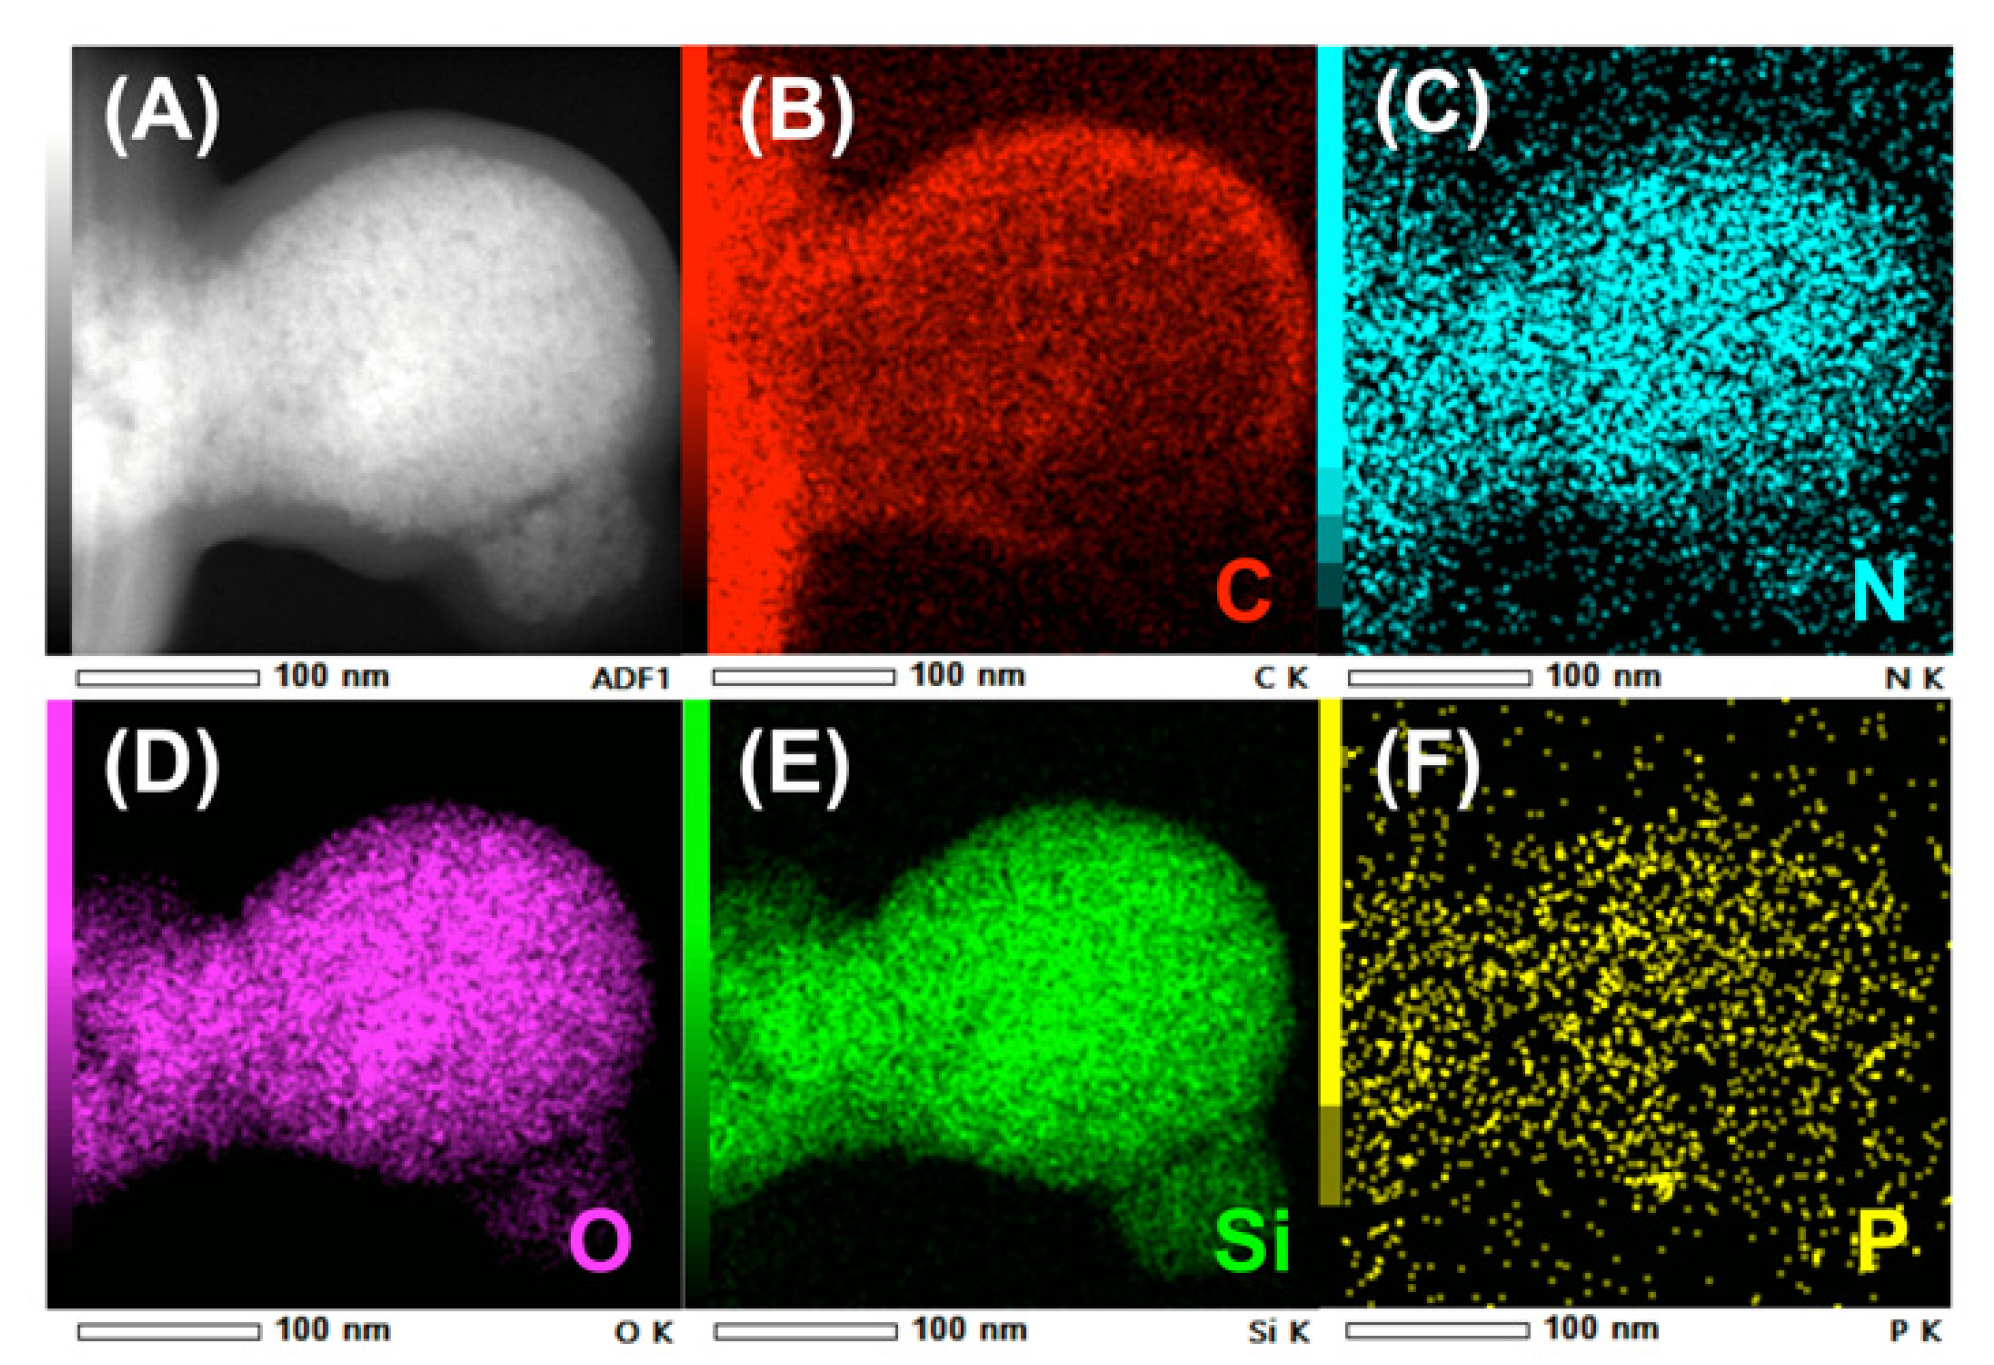
The TEM image of uf-P@m-SiO2 displays the mesoporous SiO2 framework (Figure 4), which indicates a typical MCM-41 structure [21,22]. The ordered fingerprint of the hexagonal honeycomb SiO2 skeleton can be clearly observed. The silica walls show a thickness of about 1 nm, while the pore diameter is about 2 nm. This is consistent with the average pore diameter data from the N2 adsorption/desorption result (Figure 3). Despite that the uf-P@m-SiO2 sample was synthesized following a phosphorization process at 350 °C for 2 h, there was neither obvious collapse nor destruction of the SiO2 matrix nor formation of a domain related to the P species. In order to track the P-related phase dispersion, TEM elemental mapping of C, N, O, Si, and P was carried out at different positions over the uf-P@m-SiO2 sample (Figure 5, Figures S2 and S3). Figure 5F shows that the P species were dispersed uniformly in the uf-P@m-SiO2 sample. In addition to Si (Figure 5E) and O (Figure 5D), which are components of the SiO2 framework, the rest of the elements, namely C (Figure 5B) and N (Figure 5C), are also observed, which are uniformly dispersed in uf-P@m-SiO2. That the source of C and N is the nondecomposed CTAB surfactant (synthesis remnant) allows us to consider that CTAB and P-related species are dispersed in the same areas. The EDX quantitative analysis of uf-P@m-SiO2 based on TEM mapping (Table S2, Figures S2–S4) indicates the P/Si atomic concentration ratio to be 0.4%, which is consistent with the SEM-EDX result (Table 2).

Figure 4.
TEM image of uf-P@m-SiO2.
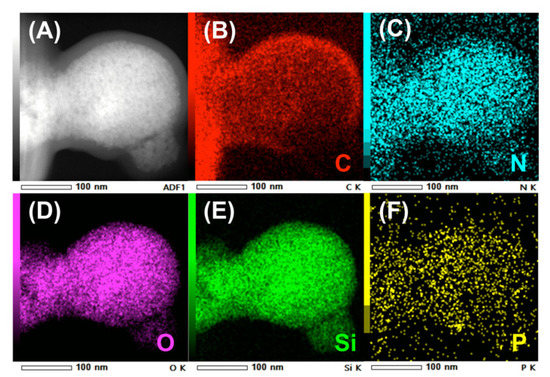
Figure 5.
TEM elemental mapping of uf-P@m-SiO2. (A) the TEM image of uf-P@m-SiO2, (B) the C element mapping, (C) the N element mapping, (D) the O element mapping, (E) the Si element mapping (F) the P element mapping.
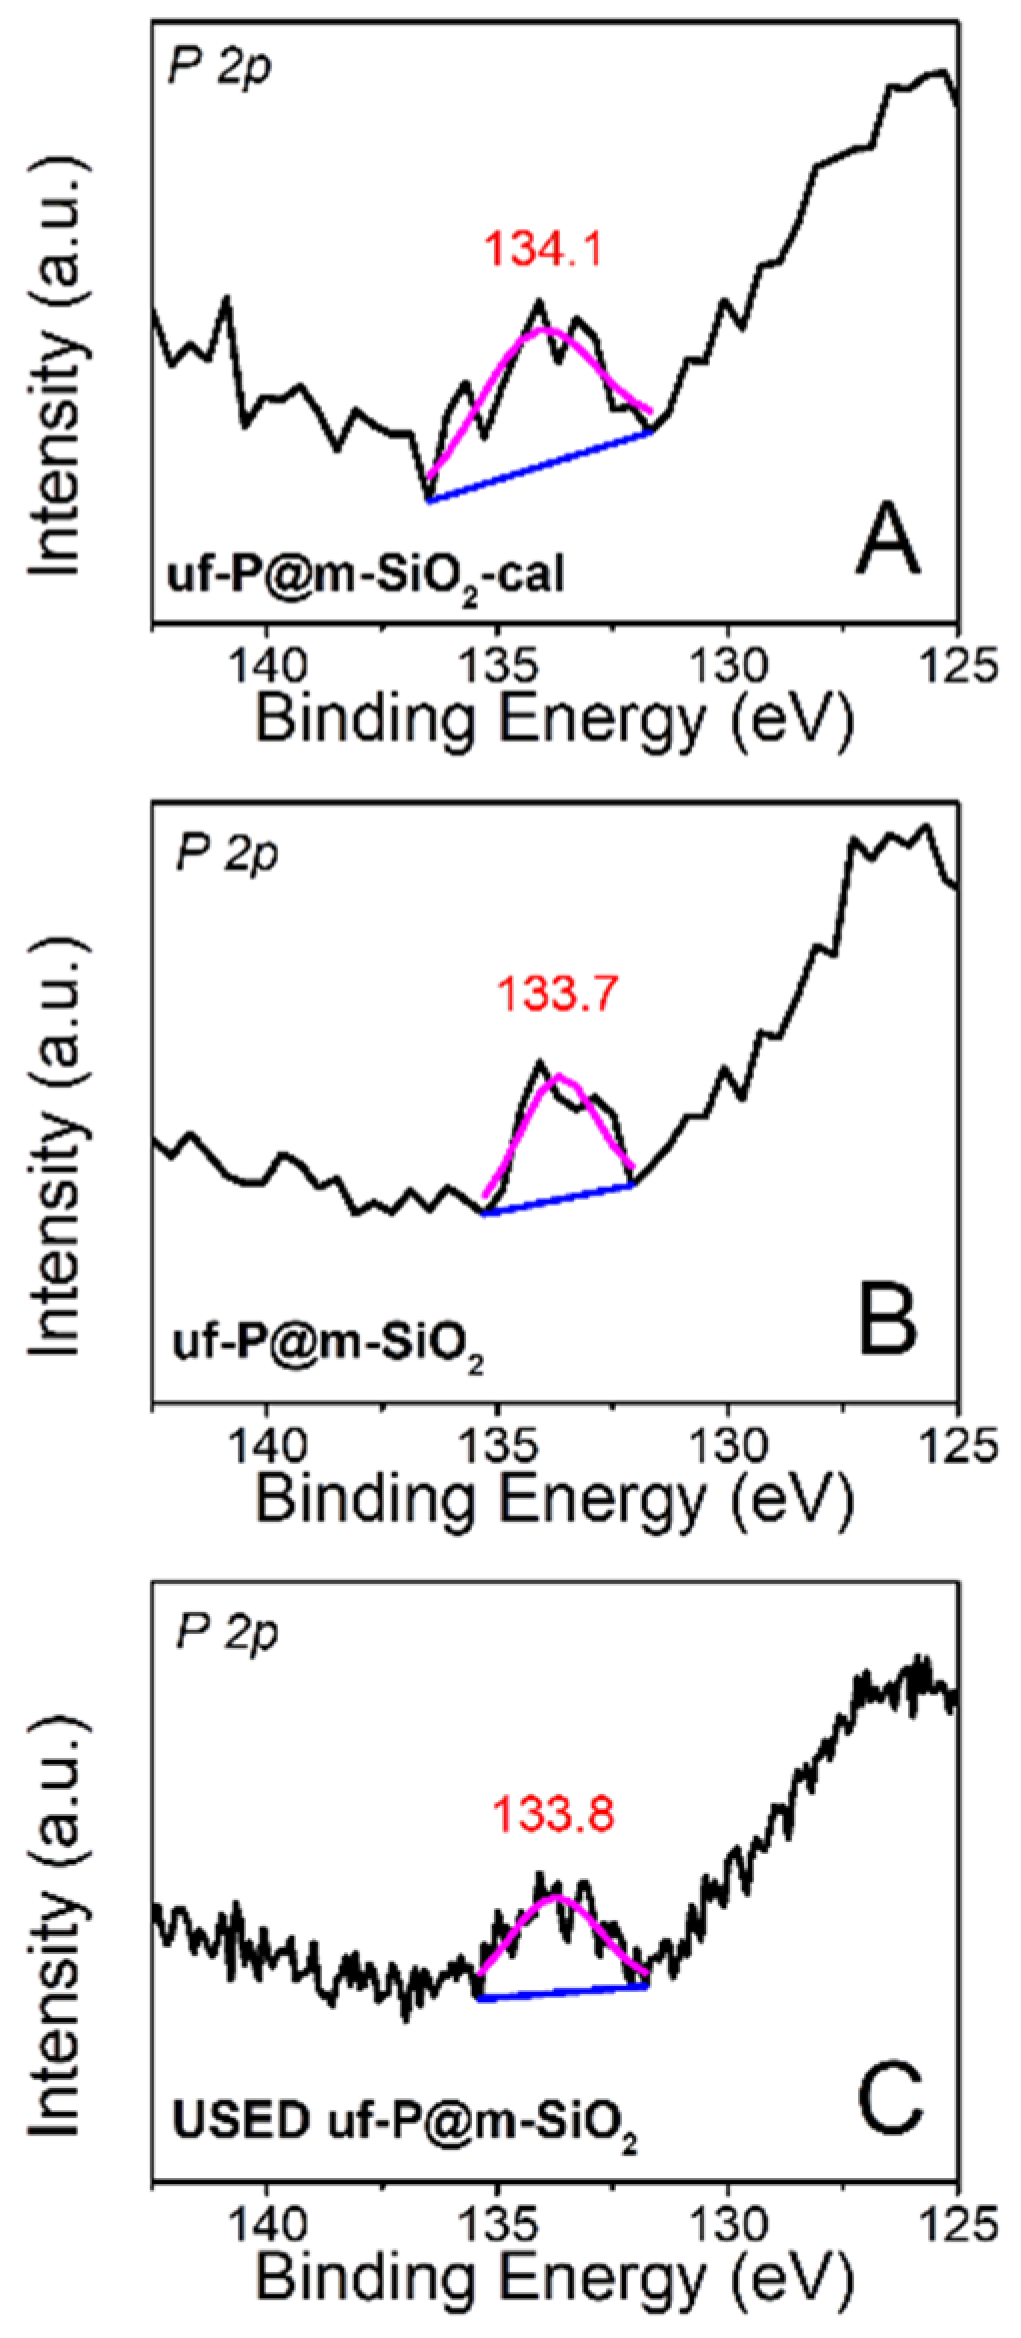
The X-ray photoelectron spectra (XPS) of uf-P@m-SiO2-cal (Figure 6A: fresh) and uf-P@m-SiO2 (Figure 6B: fresh; Figure 6C: used) were collected to identify the chemical state of P. The peak is located at ~134 eV for all samples, which can be attributed to the presence of phosphate species [26]. There is no peak at a binding energy of 130 eV, typical of elemental phosphorus or phosphorus pentoxide at 135.0–135.5 eV [26]. The XPS quantitative analysis of uf-P@m-SiO2 (Table S1) indicates the atomic concentration ratio of P/Si is about 0.4 at.%, which is consistent with the result from SEM-EDX (Table 2) and TEM-EDX data (Table S2). The atomic concentration ratio of P/Si and the P peaks (Figure 6) do not show obvious differences between uf-P@m-SiO2-cal and uf-P@m-SiO2 (Figure 6B: fresh; Figure 6C: used), while the C and N ratios in used uf-P@m-SiO2 are lower than the C and N ratio in the fresh uf-P@m-SiO2 sample. The latter is anticipated due to the reaction temperature and the slow decomposition of residual CTAB during the reaction.
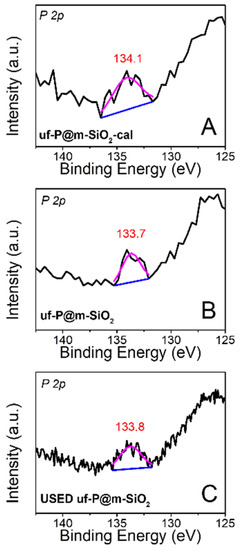
Figure 6.
High-resolution XPS spectra of uf-P@m-SiO2-cal (A): fresh and uf-P@m-SiO2 (B); fresh and (C) used.
3.2. Catalytic Performance
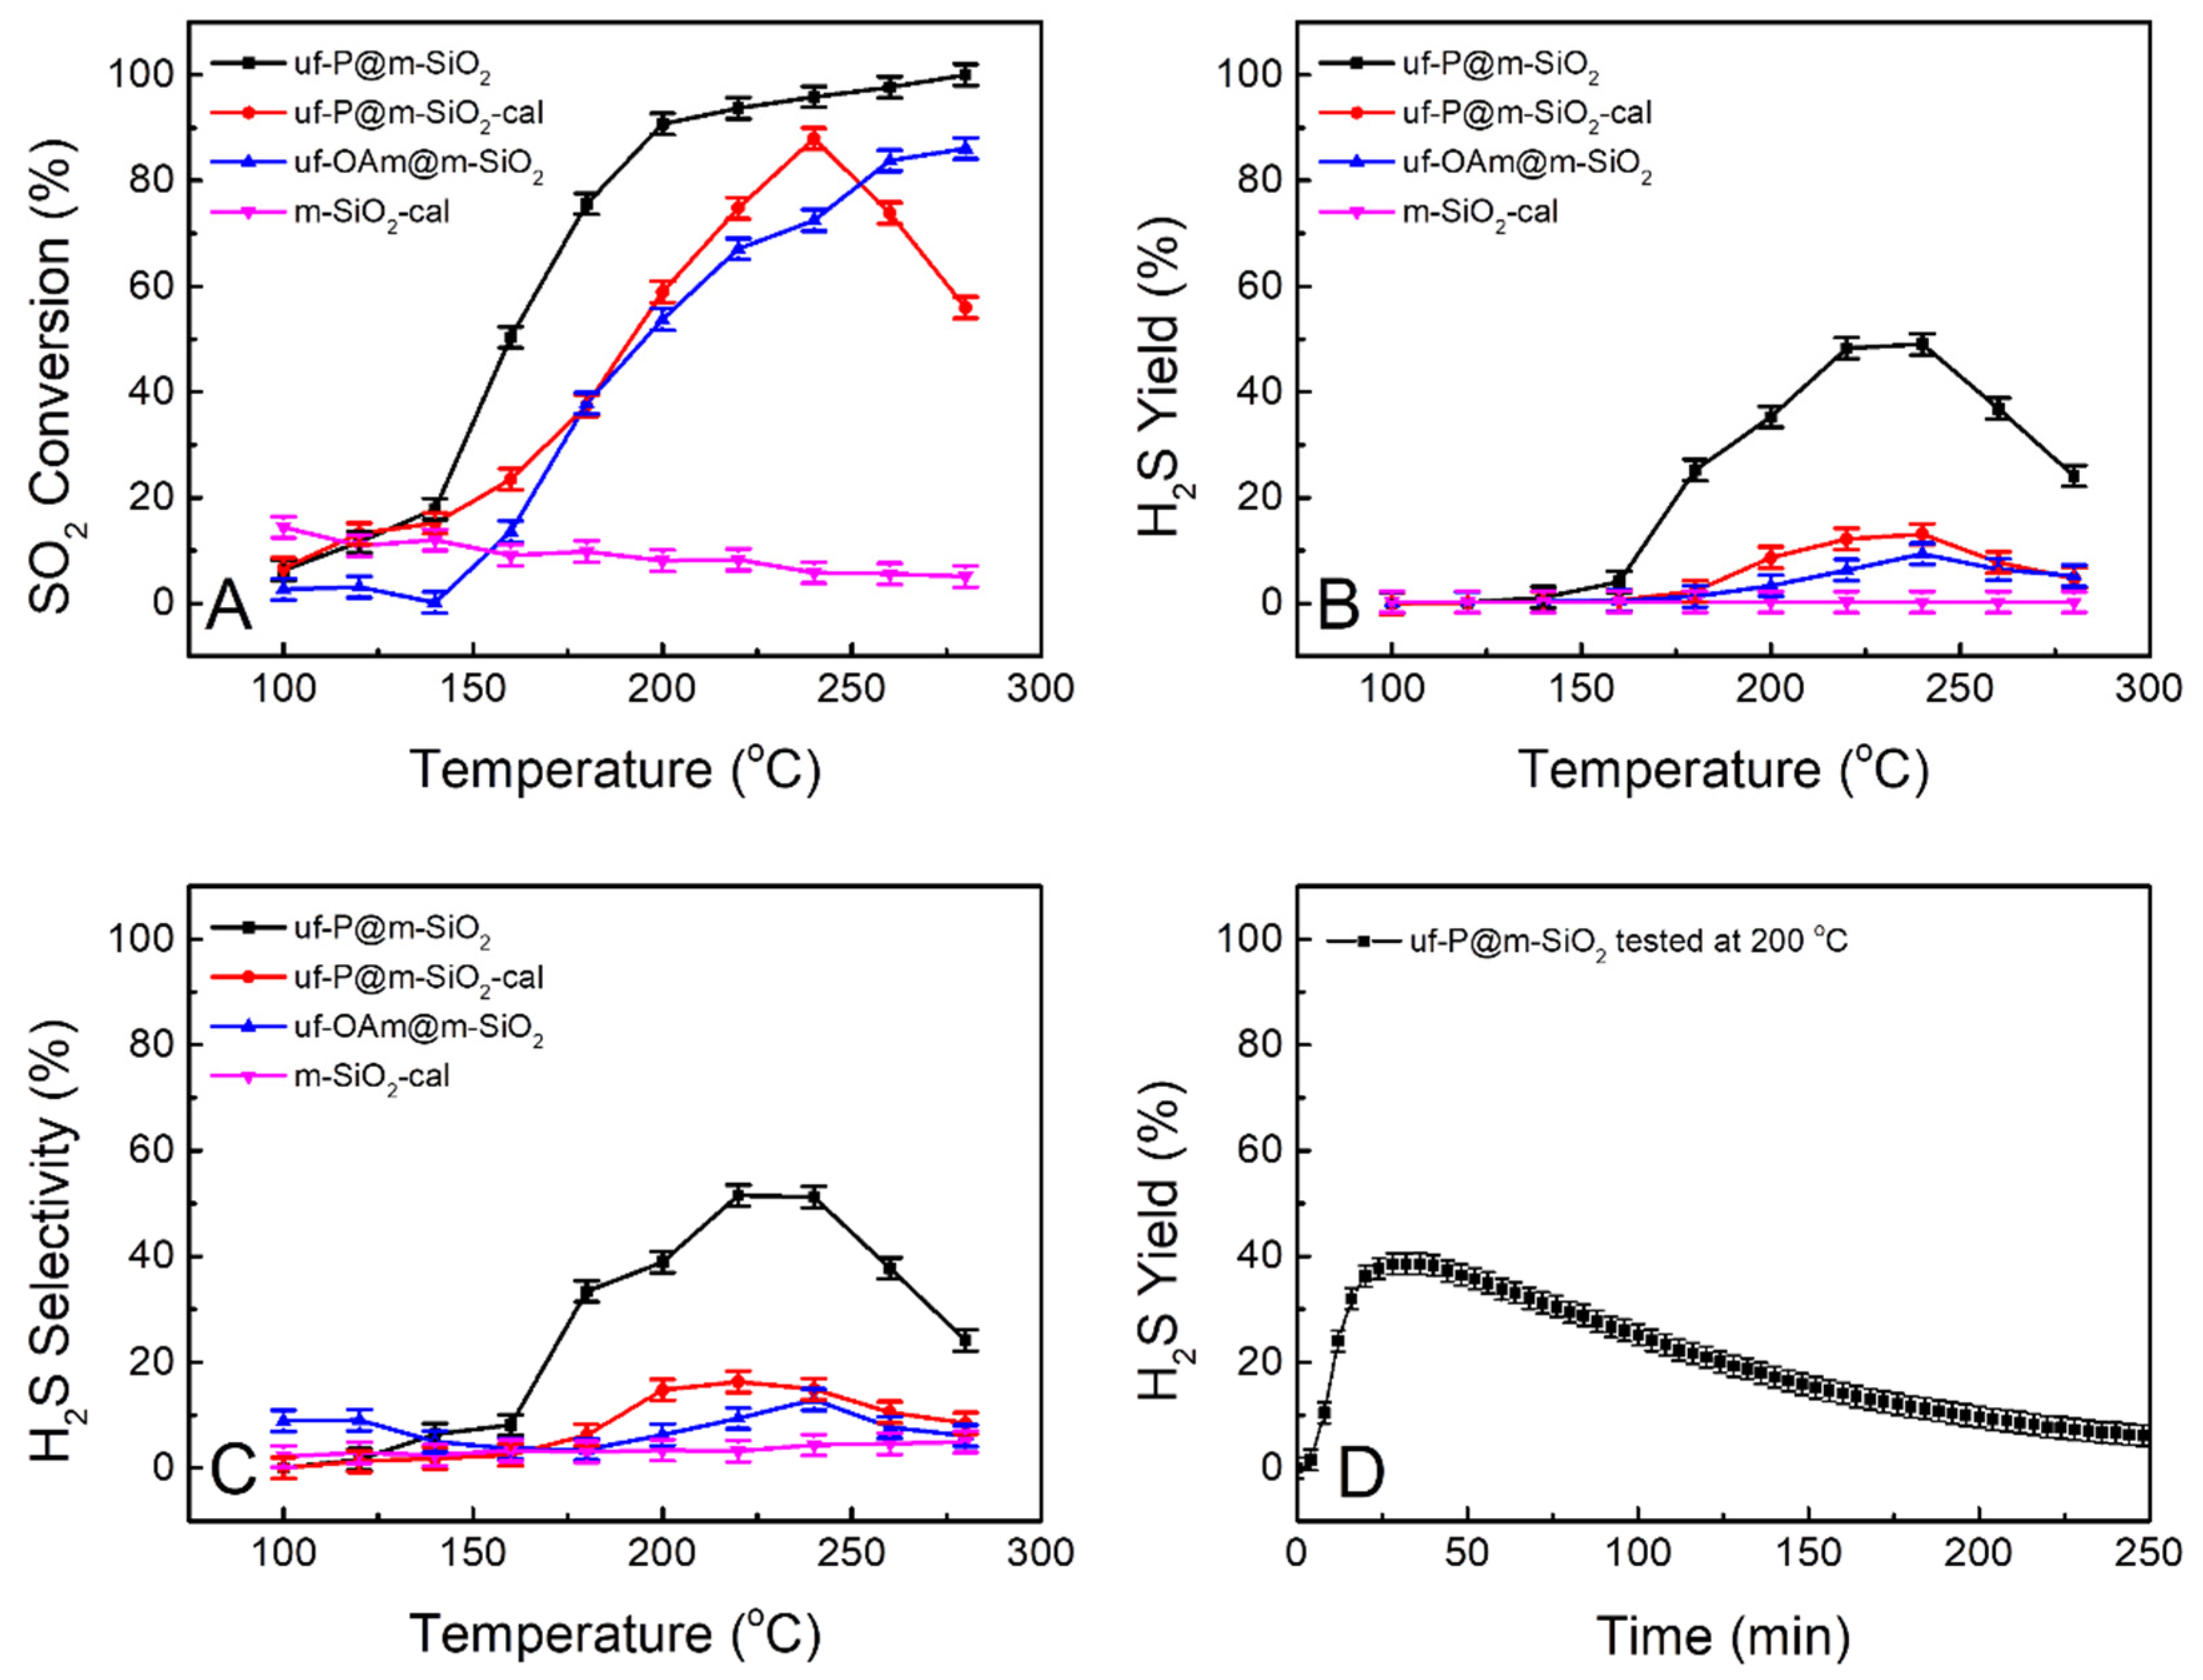
Figure 7 shows the catalytic performance test results of the four samples of interest in the present study for the conversion of SO2 to H2S in the presence of hydrogen. The pure SiO2 sample of m-SiO2-cal was tested as a reference for the other samples, and it was considered to have no activity as a blank. The other three samples show an increased conversion of SO2 with the increase in temperature over 150 °C (Figure 7A). The diffusion of reactants to the catalyst were negligible based on the Weisz-Prater Criterion and Mears Criterion (Table S3). Even without P, the uf-OAm@m-SiO2 sample shows effective SO2 conversion and around 9% of H2S yield at 240 °C (Figure 7B, blue curve). The uf-P@m-SiO2-cal sample has a similar H2S yield of around 13% at 240 °C (Figure 7B, red curve). The uf-P@m-SiO2 sample has a H2S yield of 25% at 180 °C and achieves the highest H2S yield of 49% at 220–240 °C (Figure 7B, black curve). Below 240 °C, the activities of the above catalysts increase with the increase in temperature, while when the temperature exceeds 240 °C, their activities begin to decrease. A long-term test was run at 200 °C for the uf-P@m-SiO2 catalyst (Figure 7D). The H2S yield reached 39% after the 30 min test and then slowly decreased. After 250 min, the H2S yield dropped to 6%. It is believed that phosphates act as electronegative sites, increasing the acidity of silica –OH sites. Due to the ultrafine nature of the uf-P@m-SiO2 sample, it is suggested that the silica originated from –OH, and the phosphates groups are adjacent. The adsorbed SO2 species are hydrogenated by the highly acidic H of silica, while H2 in the feed replenishes the OH centers in silica.
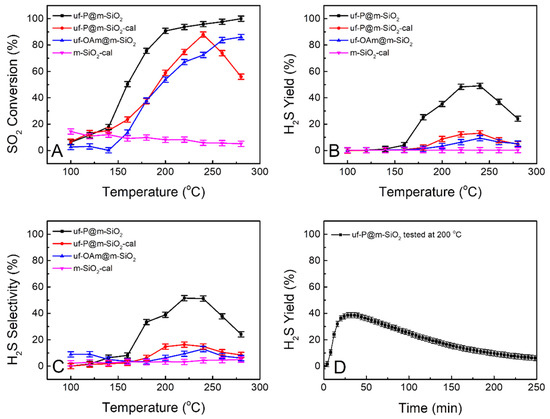
Figure 7.
Curves of SO2 conversion (A), H2S yield (B), and H2S selectivity (C) obtained from uf-P@m-SiO2, uf-P@m-SiO2-cal, uf-OAm@m-SiO2, and m-SiO2-cal at the temperature of 100 °C to 280 °C. H2S yield of uf-P@m-SiO2 long-term test at 200 °C (D).
The mesoporous SiO2 was calcined at 550 °C for 6 h to remove the surfactant. Following this treatment, no organic residue in the mesoporous SiO2 was expected. This is the “m-SiO2-cal” sample that was run as a reference material among the four samples for the catalytic performance test. By comparison, the phosphorization processes in the solution of oleylamine and trioctylphosphine for the sample “m-SiO2” (as-made mesoporous SiO2 without calcination) and the “m-SiO2-cal sample” were run to achieve the “uf-P@m-SiO2” sample (containing organic residual template to improve the P loading) and the sample “uf-P@m-SiO2-cal” (without organic residual template) (Table 1). It has been reported that the active component can be highly dispersed by the assistance of the surfactant during the synthesis of a zeolite-supported catalyst [27]. We consider that the P-related phase (phosphates) dispersion was effectively influenced by the presence of surfactants, which may lead to the difference observed in the catalyst performance. It is obvious that uf-P@m-SiO2 shows much better catalytic performance than uf-P@m-SiO2-cal (Figure 7B,C). Although the P loading of both samples is similar (Table 2), the P dispersion state can be very different. During the phosphorization step, when the temperature goes above 200 °C, the TOP slowly decomposes, and the P is slowly loaded onto the SiO2 surface. Without the presence of the surfactant, the loading of P is similar to a conventional impregnation step, with no surface control of the P position and subsequent P aggregation, while with the assistance of the surfactant, the P site can be dispersed slowly and uniformly on the SiO2 matrix to avoid any aggregation, thus leading to the high population of active sites [16,27]. For the long-term test, the residual CTAB gradually decomposed during the reaction process at high temperature, resulting in the change in the dispersion state of the active phosphates component on the surface, and the activity of uf-P@m-SiO2 slowly decreases.
A critical comparison of the present catalysts with catalysts for SO2 conversion, reported already in the literature (Table S4), leads to the following conclusions. Most of the reactions in the literature were run at high temperature i.e., 240–550 °C, and the metal species are necessary as the active components (Fe/Co/Ni, etc.). In this study, no metal precursor was involved, and the P loading ratio is very low (<1%). The much lower activity temperature range herein (160 °C–240 °C) compared to the reports in the literature can fit the industry requirement of low energy cost.
4. Conclusions
Highly dispersed metal-free phosphated mesoporous silica was obtained with the coexistence of a CTAB surfactant in mesoporous SiO2 and tested as a catalyst for SO2 hydrogenation. This uf-P@m-SiO2 catalyst was applied for the low-temperature conversion of SO2 to H2S in hydrogen and showed a H2S yield of 49% at 220 °C. The synthesis of mesoporous SiO2 matrix was achieved in a 10 min heating process in a microwave at 180 °C, and the phosphorization step was completed in OAm and TOP at 350 °C for 2 h. TEM images show the hexagonal honeycomb mesopores of SiO2 with a silica wall thickness of 1 nm and a pore diameter of 2 nm, while N2 adsorption/desorption isotherms show the BET surface area of the uf-P@m-SiO2 catalyst is 533 m2/g, and the pore volume is 0.38 cm3/g. Elemental analysis and mapping indicated that P (about 0.4 at.% to Si) was dispersed uniformly on the SiO2 framework. The residual undecomposed CTAB is a key factor for the high dispersion of active P species (phosphates). The synthesis process is simple and fast, without the introduction of expensive metal precursors, and the product was easy to separate. This metal-free phosphated mesoporous silica catalyst can inspire the design and synthesis of highly dispersed active catalysts containing phosphate groups for a variety of hydrogenation applications.
Supplementary Materials
The following are available online at https://www.mdpi.com/article/10.3390/nano11092440/s1, Figure S1: XRD patterns uf-P@m-SiO2 (fresh and used), uf-P@m-SiO2-cal, uf-OAm@m-SiO2, and m-SiO2-cal, Figure S2: TEM elemental mapping of uf-P@m-SiO2 (Position 2). (A,B) the TEM image of uf-P@m-SiO2, (C) the C element mapping, (D) the N element mapping, (E) the O element mapping, (F) the Si element mapping (G) the P element mapping, Figure S3: TEM elemental mapping of uf-P@m-SiO2 (Position 3). (A,B) the TEM image of uf-P@m-SiO2, (C) the C element mapping, (D) the N element mapping, (E) the O element mapping, (F) the Si element mapping (G) the P element mapping, Figure S4: TEM2-EDX total area spectrum recorded from the mapped area in Figure 5, Figures S2 and S3 for the sample uf-P@m-SiO2, Table S1: XPS elemental concentrations for uf-P@m-SiO2-cal (A: fresh), and uf-P@m-SiO2 (B: fresh, and C: used), Table S2: TEM-EDX elemental concentrations for uf-P@m-SiO2, Table S3: Weisz-Prater Criterion and Mears Criterion calculation for the catalyst performance test, Table S4: Comparison of the catalytic performance of different catalysts from literature of the SO2 conversion to H2S, selectivity and yield of H2S.
Author Contributions
Conceptualization, methodology, investigation, formal analysis, data curation, characterization (XRD, TEM, performance), writing—original draft preparation, X.L.; characterization (BET, IR, EDX), S.G.; characterization (XPS), M.A.B. and S.J.H.; conceptualization, supervision, validation, project administration, funding acquisition, writing—review and editing, K.P. All authors have read and agreed to the published version of the manuscript.
Funding
Khalifa University of Science and Technology under the CIRA-2018-007 grant and support under the RCII-2018-024 grant.
Institutional Review Board Statement
Not applicable.
Informed Consent Statement
Not applicable.
Data Availability Statement
Not applicable.
Acknowledgments
Xinnan Lu and Kyriaki Polychronopoulou acknowledge the financial support from the Khalifa University of Science and Technology under the CIRA-2018-007 grant and the support under the RCII-2018-024. Xinnan Lu acknowledges Ya Gao and Guofeng Zhao for assistance with XRD characterization.
Conflicts of Interest
The authors declare no competing financial interests.
References
- Chorkendorff, I.; Niemantsverdriet, J.W. Concepts of Modern Catalysis and Kinetics; Wiley-VCH Verlag GmbH & Co. KGaA: Weinheim, Germany, 2017; Volume 9, p. 399. [Google Scholar]
- GRAND VIEW RESEARCH, Hydrodesulfurization Catalysts Market Size, Share & Trends Analysis Report by Type (Load Type, Non-load Type), By Application (Diesel, Naphtha), By Region, and Segment Forecasts, 2020–2027. 2020. Available online: https://www.grandviewresearch.com/industry-analysis/hydrodesulfurization-catalysts-market (accessed on 7 September 2021).
- Eow, J.S. Recovery of sulfur from sour acid gas: A review of the technology. Environ. Prog. Sustain. Energy 2002, 21, 143–162. [Google Scholar] [CrossRef]
- Brunet, S.; Mey, D.; Pérot, G.; Bouchy, C.; Diehl, F. On the hydrodesulfurization of FCC gasoline: A review. Appl. Catal. A 2005, 278, 143–172. [Google Scholar] [CrossRef]
- Ishiguro, A.; Liu, Y.; Nakajima, T.; Wakatsuki, Y. Efficient reduction of sulfur dioxide with hydrogen over TiO2-supported catalysts derived from ruthenium salts and ruthenium cluster complexes. J. Catal. 2002, 206, 159–164. [Google Scholar] [CrossRef]
- Paik, S.C.; Kim, H.; Chung, J.S. The catalytic reduction of SO2 to elemental sulfur with H2 or CO. Catal. Today 1997, 38, 193–198. [Google Scholar] [CrossRef]
- Paik, S.C.; Chung, J.S. Selective hydrogenation of SO2 to elemental sulfur over transition metal sulfides supported on Al2O3. Appl. Catal. B 1996, 8, 267–279. [Google Scholar] [CrossRef]
- Gengfeng, D.E.; Jiang, K.; Xia, C.A.; Chunfa, L.I. Reduction of SO2 to elemental sulfur over rare earth-iron catalysts. J. Rare Earths 2009, 27, 744–748. [Google Scholar]
- Li, K.T.; Hung, Y.C. Hydrogenation of sulfur dioxide to hydrogen sulfide over Fe/γ-Al2O3 catalysts. Appl. Catal. B 2003, 40, 13–20. [Google Scholar] [CrossRef]
- Polychronopoulou, K.; Galisteo, F.C.; Granados, M.L.; Fierro, J.L.; Bakas, T.; Efstathiou, A.M. Novel Fe–Mn–Zn–Ti–O mixed-metal oxides for the low-temperature removal of H2S from gas streams in the presence of H2, CO2, and H2O. J. Catal. 2005, 236, 205–220. [Google Scholar] [CrossRef]
- Polychronopoulou, K.; Fierro, J.L.G.; Efstathiou, A.M. Novel Zn–Ti-based mixed metal oxides for low-temperature adsorption of H2S from industrial gas streams. Appl. Catal. B 2005, 57, 125–137. [Google Scholar] [CrossRef]
- Polychronopoulou, K.; Efstathiou, A.M. Effects of sol−gel synthesis on 5Fe−15Mn−40Zn−40Ti−O mixed oxide structure and its H2S removal efficiency from industrial gas streams. Environ. Sci. Technol. 2009, 43, 4367–4372. [Google Scholar] [CrossRef]
- Georgiadis, A.G.; Charisiou, N.D.; Goula, M.A. Removal of hydrogen sulfide from various industrial gases: A re-view of the most promising adsorbing materials. Catalysts 2020, 10, 521. [Google Scholar] [CrossRef]
- Oyama, S.T. Novel catalysts for advanced hydroprocessing: Transition metal phosphides. J. Catal. 2003, 216, 343–352. [Google Scholar] [CrossRef]
- Oyama, S.T.; Gott, T.; Zhao, H.; Lee, Y.K. Transition metal phosphide hydroprocessing catalysts: A review. Catal. Today 2009, 143, 94–107. [Google Scholar] [CrossRef]
- Lu, X.; Baker, M.A.; Anjum, D.H.; Basina, G.; Hinder, S.J.; Papawassiliou, W.; Pell, A.J.; Karagianni, M.; Papavassiliou, G.; Shetty, D.; et al. Ni2P Nanoparticles Embedded in Mesoporous SiO2 for Catalytic Hydrogenation of SO2 to Elemental S. ACS Appl. Nano Mater. 2021, 4, 5665–5676. [Google Scholar] [CrossRef]
- Lu, X.; Baker, M.A.; Anjum, D.H.; Papawassiliou, W.; Pell, A.J.; Fardis, M.; Papavassiliou, G.; Hinder, S.J.; Gaber, S.A.A.; Gaber, D.A.A.; et al. Nickel Phosphide Nanoparticles for Selective Hydrogenation of SO2 to H2S. ACS Appl. Nano Mater. 2021, 4, 6568–6582. [Google Scholar] [CrossRef]
- Papawassiliou, W.; Carvalho, J.P.; Panopoulos, N.; Al Wahedi, Y.; Wadi, V.K.; Lu, X.; Polychronopoulou, K.; Lee, J.B.; Lee, S.; Kim, C.Y.; et al. Crystal and electronic facet analysis of ultrafine Ni2P particles by solid-state NMR nanocrystallography. Nat. Commun. 2021, 12, 1–11. [Google Scholar] [CrossRef]
- Elmutasim, O.; Sajjad, M.; Singh, N.; AlWahedi, Y.; Polychronopoulou, K. Combined DFT and microkinetic modeling study of SO2 hydrodesulfurization reaction on Ni5P4 catalyst. Appl. Surf. Sci. 2021, 559, 149872. [Google Scholar] [CrossRef]
- Bahamon, D.; Khalil, M.; Belabbes, A.; Alwahedi, Y.; Vega, L.F.; Polychronopoulou, K. A DFT study of the adsorption energy and electronic interactions of the SO2 molecule on a CoP hydrotreating catalyst. RSC Adv. 2021, 11, 2947–2957. [Google Scholar] [CrossRef]
- Chaignon, J.; Bouizi, Y.; Davin, L.; Calin, N.; Albela, B.; Bonneviot, L. Minute-made and low carbon fingerprint microwave synthesis of high quality templated mesoporous silica. Green Chem. 2015, 17, 3130–3140. [Google Scholar] [CrossRef]
- Lu, X.; Clément, R.; Lu, Y.; Albela, B.; Baker, R.T.; Bonneviot, L. Selective C-C Bond Cleavage in Diols and Lignin Models: High-throughput Screening of Metal Oxide-Anchored Vana-dium in Mesoporous Silica. Catalysts 2021, 11, 901. [Google Scholar] [CrossRef]
- Huo, C.; Ouyang, J.; Yang, H. CuO nanoparticles encapsulated inside Al-MCM-41 mesoporous materials via direct synthetic route. Sci. Rep. 2014, 4, 1–9. [Google Scholar] [CrossRef] [PubMed]
- Nhavene, E.P.; Andrade, G.F.; Faria, J.A.; Gomes, D.A.; Sousa, E.M. Biodegradable polymers grafted onto multifunctional mesoporous silica nanoparticles for gene delivery. ChemEngineering 2018, 2, 24. [Google Scholar] [CrossRef] [Green Version]
- Thommes, M.; Kaneko, K.; Neimark, A.V.; Olivier, J.P.; Rodriguez-Reinoso, F.; Rouquerol, J.; Sing, K.S.W. Physisorption of gases, with special reference to the evaluation of surface area and pore size distribution (IUPAC Technical Report). Pure Appl. Chem. 2015, 87, 1051–1069. [Google Scholar] [CrossRef] [Green Version]
- X-ray Photoelectron Spectroscopy (XPS) Reference Pages. Available online: http://www.xpsfitting.com/2013/01/phosphorus.html (accessed on 7 September 2021).
- Lu, X.; Zhao, G.; Lu, Y. Propylene epoxidation with O2 and H2: A high-performance Au/TS-1 catalyst prepared via a deposition–precipitation method using urea. Catal. Sci. Technol. 2013, 3, 2906–2909. [Google Scholar] [CrossRef]


Publisher’s Note: MDPI stays neutral with regard to jurisdictional claims in published maps and institutional affiliations. |
© 2021 by the authors. Licensee MDPI, Basel, Switzerland. This article is an open access article distributed under the terms and conditions of the Creative Commons Attribution (CC BY) license (https://creativecommons.org/licenses/by/4.0/).