Article

BiVO4 Ceramic Photoanode with Enhanced Photoelectrochemical Stability

1
State Key Laboratory of Crystal Materials, Shandong University, Jinan 250100, China
2
School of Physics and Electronic Engineering, TaiShan University, Tai’an 271000, China
3
School of Physics, Shandong University, Jinan 250100, China
*
Authors to whom correspondence should be addressed.
Nanomaterials 2021, 11(9), 2404; https://doi.org/10.3390/nano11092404
Submission received: 22 July 2021 / Revised: 24 August 2021 / Accepted: 10 September 2021 / Published: 15 September 2021

Abstract

:
Monoclinic bismuth vanadate (BiVO4) is an attractive material with which to fabricate photoanodes due to its suitable band structure and excellent photoelectrochemical (PEC) performance. However, the poor PEC stability originating from its severe photo-corrosion greatly restricts its practical applications. In this paper, pristine and Mo doped BiVO4 ceramics were prepared using the spark plasma sintering (SPS) method, and their photoelectrochemical properties as photoanodes were investigated. The as-prepared 1% Mo doped BiVO4 ceramic (Mo-BVO (C)) photoanode exhibited enhanced PEC stability compared to 1% Mo doped BiVO4 films on fluorine doped Tin Oxide (FTO) coated glass substrates (Mo-BVO). Mo-BVO (C) exhibited a photocurrent density of 0.54 mA/cm2 and remained stable for 10 h at 1.23 V vs. reversible hydrogen electrode (RHE), while the photocurrent density of the Mo-BVO decreased from 0.66 mA/cm2 to 0.11 mA/cm2 at 1.23 V vs. RHE in 4 h. The experimental results indicated that the enhanced PEC stability of the Mo-BVO (C) could be attributed to its higher crystallinity, which could effectively inhibit the dissociation of vanadium in BiVO4 during the PEC process. This work may illustrate a novel ceramic design for the improvement of the stability of BiVO4 photoanodes, and might provide a general strategy for the improvement of the PEC stability of metal oxide photoanodes.

1. Introduction

Photoelectrochemical (PEC) water splitting is regarded as one of the most high-potential strategies to solve environmental and energy issues for human society in the future can, as it can produce hydrogen and oxygen by directly utilizing solar energy. To withstand the conditions of oxidation and maintain long-term stability in aqueous solution, oxide semiconductors, such as TiO2 [1], ZnO [2], BiVO4 [3], and WO3 [4], etc, have become the preferred photoelectrode candidates. Among these materials, BiVO4 has received great attention as a photoanode for photoelectrochemical water splitting owing to its suitable band structure and excellent semiconductor properties [5,6]. Consequently, BiVO4 is an ideal photoanode and enables oxygen evolution at a low bias, in contrast to many other metal oxides [7,8]. The maximum photocurrent of BiVO4 photoanode could be up to 7.5 mA/cm2 under AM1.5 G light irradiation, with a theoretical conversion efficiency of over 9% [9]. To improve the photoelectrochemical performance of BiVO4 photoanodes, great efforts have been made by researchers all over the world, such as improving the light absorption of the materials by optimizing their morphology and surface structure [10,11,12], doping with transition metal ions to improve electrical conductivity [13,14], loading coa catalyst on the surface of the electrode in order to accelerate water oxidation kinetics [7,14], and constructing a heterojunction to stimulate the transportation and separation of photogenerated electrons and holes [15,16].
Although the photocurrent of BiVO4 photoanodes has been greatly improved, their stability has not been well addressed. According to research, the poor photoelectrochemical (PEC) stability of BiVO4 photoanodes could be attributed to the dissociation of V into the solution from the electrode, which can be greatly accelerated under light illumination, resulting in more severe photo-corrosion [17,18,19]. Depositing a protective layer, or the modification of a layer of cocatalysts on the surface of the electrode is the most commonly used method for the prevention of surface photo-corrosion and for the improvement of the stability of BiVO4 photoanodes [7,14]. Recently, it was found that the photo-corrosion and the instability of photoanodes were also closely related to surface defects. Our previous investigations found that the PEC stability of single-crystalline ZnO photoanodes with fewer surface defects was much higher than that of ZnO photoanodes consisting of ZnO nanorods [2]. Thus, if we could fabricate a BiVO4 photoanode with enhanced crystallinity, its PEC stability might also be improved. Additionally, with increased crystallinity, there would be fewer surface defects on the BiVO4 photoanode, which could subsequently reduce the recombination of photogenerated electrons and holes on the electrode’s surface. This could also further improve the PEC performance of BiVO4 photoanodes [20,21]. However, BiVO4 single crystals are quite difficult and complex to produce in comparison with the simple fabrication procedure of BiVO4 polycrystalline films. In this regard, BiVO4 ceramics fabricated by BiVO4 powders could offer an alternative to BiVO4 single crystals, which not only exhibit higher crystallinity than BiVO4 films consisting of nanoparticles, but might also be easier to fabricate than BiVO4 single crystals.
Based on this idea, BiVO4 ceramics photoanodes with (Mo-BVO (C)) or without (BVO (C)) Mo doping were prepared by using the spark plasma sintering (SPS) method [22]. For comparison, we prepared the Mo doped BiVO4 (Mo-BVO) films on FTO substrate. The photocurrent of the Mo-BVO (C) electrode was 0.54 mA/cm2 and that of the Mo-BVO film was 0.66 mA/cm2 under 1.23 V (vs. reversible hydrogen electrode (RHE)). After a long-term water splitting reaction, the Mo-BVO (C) showed better stability than the Mo-BVO electrode under identical conditions. The Mo-BVO (C) exhibited a photocurrent density of 0.54 mA/cm2 and remained stable for 10 h at 1.23 V vs. RHE. By contrast, the photocurrent density of the Mo-BVO decreased from 0.66 mA/cm2 to 0.11 mA/cm2 at 1.23 V vs. RHE in 4 h. By comparing the morphologies, structures, and surface states of the as-prepared Mo-BVO (C) and the Mo-BVO, we attributed the excellent PEC stability of the Mo-BVO (C) to its lower number of surface defects and itshigher crystallinity, which could inhibit the dissociation of V in BiVO4 and suppress the photo-corrosion during PEC process. Therefore, the preparation of ultra-thin BiVO4 materials with high density and high crystallization is a rational strategy to effectively improve the PEC stability of BiVO4 semiconductor.

2. Experimental Details

2.1. Raw Materials

Bismuth (III) nitrate (Bi(NO3)3·5H2O), ammonium metavanadate (NH4VO3), vanadium acetylacetonate (VO(acac)2), bis(acetylacetonato)dioxomolybdenum (MoO2(acac)2), and hexaammonium molybdate ((NH4)6Mo7O24·4H2O) were purchased from shanghai Aladdin Biochemical Technology Co., Ltd, Shanghai, China. Citric acid, Nitric acid (69 wt%), and liquid ammonia (30 wt%) were obtained from Sinopharm Chemical Reagent Co Ltd., Shanghai, China. All the other chemicals were of analytical grade and were used as received without further purification. All the solutions were prepared with deionized (DI) water obtained from a PURE ROUP 30 water purification system.

2.2. Preparation of BiVO4 and Mo doped BiVO4 Powders

The BiVO4 and Mo doped BiVO4 powders were synthesized using a modified sol-gel route [23,24]. In a typical synthetic procedure, 40 mmol Bi(NO3)3·5H2O were dissolved into 200 mL of 3 M nitric acid under stirring, then 24 g of citric acid and 60 mL of deionized water were added, respectively. The mixture was magnetically stirred for 30 min. The pH of the above mixture was adjusted to 7.00 with an ammonia solution through vigorous stirring at room temperature, and the solution A was obtained. The solution B contained ammonium metavanadate (NH4VO3) (4.633 g) and citric acid (24 g) in 200 mL boiling water. The pH of the solution B was adjusted to 7.00 by controlling the addition of NH4OH, or nitric acid. To prepare the bismuth vanadate precursor solution, A and B solutions were mixed together with the Bi: V molar ratio of 1.0:1.0. To obtain the Mo doped BiVO4, a certain amount of molybdenum source ((NH4)6Mo7O24) was added to solution B. Next, the A and B solutions were mixed together, with a Bi: V: Mo molar ratio of 1:0.99:0.01, in order to obtain the 1% Mo doped BiVO4 precursor. Subsequently, the mixture solution was put into an oil bath pot at 80 °C with magnetic stirring. After 10–15 h, the homogeneous blue sol was formed, transferred to an oven, and maintained at 100 °C for 4 days, until it became a dark, brown, dry gel. Following this, the gel was grounded into powder by an agate mortar and pestle. Next, the powders were calcined in a muffle furnace at 500 °C for 4 h. Finally, when the temperature was cooled to room temperature, the bright yellow powder was collected to make the BiVO4 ceramics.

2.3. Preparation of BiVO4 and Mo Doped BiVO4 Ceramics

10 g of BiVO4 (or Mo-BiVO4) powders were placed in a graphite mold. Next, the mold was placed in the sintering furnace of plasma at 66 MPa of uniaxial pressure, the door of the furnace chamber was closed, and the vacuum pump was opened. At a pressure of 66 MPa, a heating rate of 100 °C/min was kept at 700 °C for 10 min. Next, the temperature was cooled down to room temperature and the ceramic sample was taken out of the chamber. The coated graphite paper was then removed with sandpaper. The density of the ceramic was measured according to the Archimedes principle. The sintering time of ceramics should not be too long. At high temperatures (above 450 °C), BiVO4 would decompose, which would result in the loss of vanadium via volatile VOx, i.e., VO2, species according to research [25].

2.4. Fabrication of BiVO4 and Mo Doped BiVO4 Films on FTO Substrate

The 1% Mo doped BiVO4 photoanode was prepared with the spin-coating method and then calcined at a high temperature [26,27]. FTO glass cleaned by ethanol, acetone, deionized water, and glycol was used as the substrate. In a specific preparation process, 0.72 mmol of Bi(NO3)3·5H2O, 0.633 g of vanadium acetylacetonate, and bis(acetylacetonato)dioxomolybdenum (0.0048 g) were dissolved in glacial acetic acid and acetylacetone, respectively. Subsequently, the two solutions were evenly mixed and magnetically stirred for 20 min, and then the precursor solution was obtained by ultrasound at room temperature for 6 h. The precursor was spin-coated onto FTO glass at 700 rpm for 10 s. Next, the FTO substrate was dried at 150 °C for 10 min, and then calcined at 450 °C for 30 min. The above process was repeated four times, before a photoanode with a thickness of 215 nm was obtained. The FTO was cut into many small strips (size: 0.5 × 1.0 cm2) with a diamond glass knife; the solution area was 0.25 mm2. The preparation of pure BiVO4 film (BVO) followed the same method and procedure as that of the Mo doped BiVO4 film, except for the addition of bis(acetylacetonato)dioxomolybdenum in the precursor solution.

2.5. Preparation of BiVO4 and Mo-BiVO4 Ceramic Photoanode

The BVO and Mo-BVO ceramics ware cut into many square flakes (5.0 × 5.0 × 0.3 mm3) with a diamond wire cutting machine. Next, the two sides were polished with sandpaper and alumina slurry. The thickness of the BVO (C) and the Mo-BVO (C) was optimized around 10–30 μm. Next, one side of the ceramic chip was coated in Gallium-Indium eutectic and treated at 500 °C for 20 min in a muff furnace to obtain Ohmic contact. Subsequently, copper wires were connected to the surface of the Gallium-Indium eutectic with silver paste. When the silver glue was completely dry, the metal surface and copper wire were sealed with epoxy resin to prevent electricity leakage. The area of the photoelectrode was about 1–3 mm2.

2.6. Photoelectrochemical Characterizations

The photoelectrochemical properties of these BiVO4 photoanodes were studied in a three-electrode configuration using the as-prepared BiVO4 ceramic or film photoelectrode as the working electrode, a platinum sheet as the counter electrode, and a standard saturated calomel electrode (SEC) as the reference electrode in 0.1 M of potassium phosphate buffer solution (KPi, pH = 7). The data were recorded on an electrochemical workstation (Shanghai Chenhua electrochemical analyzer / CHI600E workstation, Shanghai, China). All light sources were simulated sunlight, which was provided by a 300 W Xe arc lamp equipped with an AM 1.5 G filter (Perfectlight, Beijing, Co. LTD, Beijing, China, 100 mW /cm2). The bias voltage of the electrode was converted to a reversible hydrogen electrode (RHE) by the following equation:
E R H E = E S C E + 0.591 p H + 0.241
The photocurrent density-bias curves (J-V) were taken at a scan rate of 20 mV·s−1 in the three-electrode cell of a KPi electrolyte under AM 1.5 G irradiation. The incident-photon-to-current-conversion efficiency (IPCE) measurements were performed by measuring the photocurrent density under monochromated light irradiation with a 500 W Xe arc lamp coupled into a grating monochromator. Electrochemical impedance spectroscopy (EIS) was performed in potentiostatic mode at 0 V bias voltage vs. the reversible hydrogen electrode (RHE) over frequencies ranging from 100 kHz to 100 mHz.

2.7. Characterizations

The morphology, crystal structure, and components of the samples as prepared were analyzed by scanning electron microscopy (SEM, a Hitachi S-4800 microscope from Japan with an accelerating voltage of 5 kV), and energy dispersive spectroscopy (EDS) from Tokyo, Japan, X-ray diffraction (XRD, Bruker AXS D8 advance powder diffracto-meter with a Cu Kα X-ray tube, Karlsruhe, Germany). The X-ray photoelectron spectroscopy (XPS) measurements were performed on an ESCALAB 250 photoelectron spectrometer from Massachusetts, US, employing Al Kα radiation (E = 1486.6 eV). The C 1s line located at 284.6 eV was used as the calibration position for all the element data. The diffuse reflectance spectra were measured by using a Shimadzu UV 2550 UV-vis spectrometer from Kyoto, Japan equipped with an integrating sphere in the wavelength range of 200–800 nm. The Raman spectra were obtained by excitation of the samples with a 473 nm laser on a LabRAM HR800 Raman spectrometer (Horiba Jobin Yvon) from Paris, France.

3. Results and Discussion

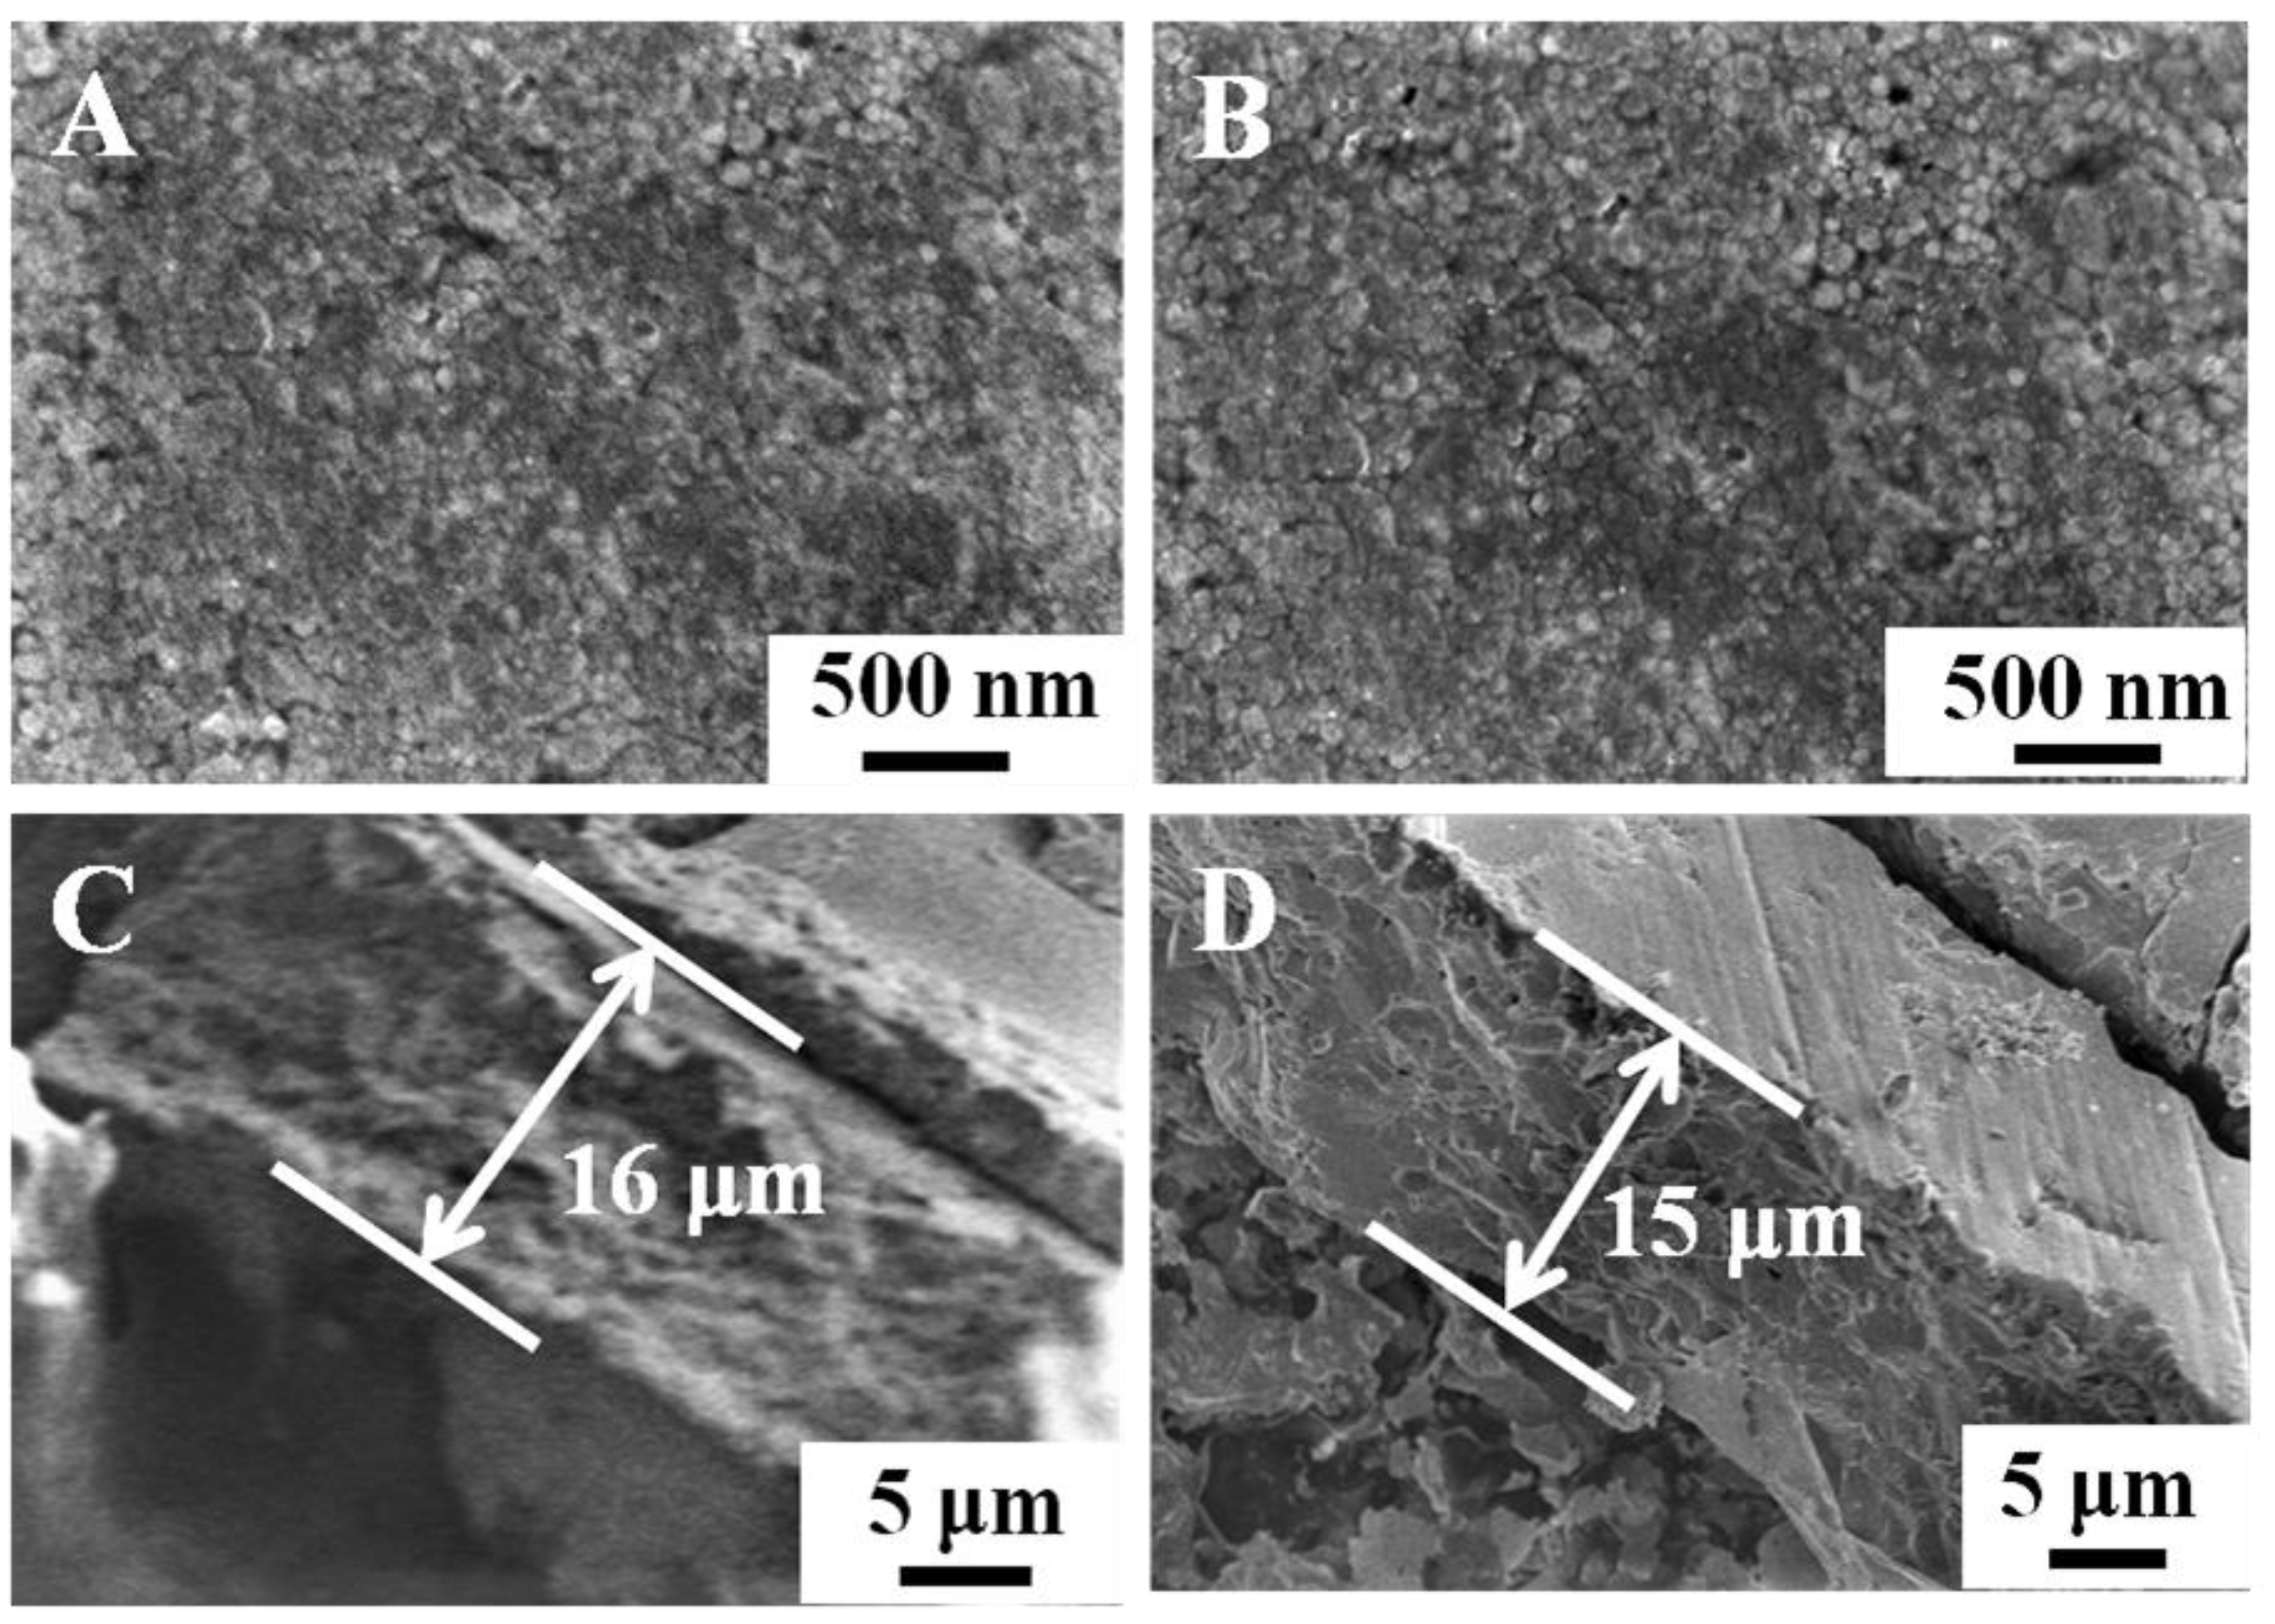
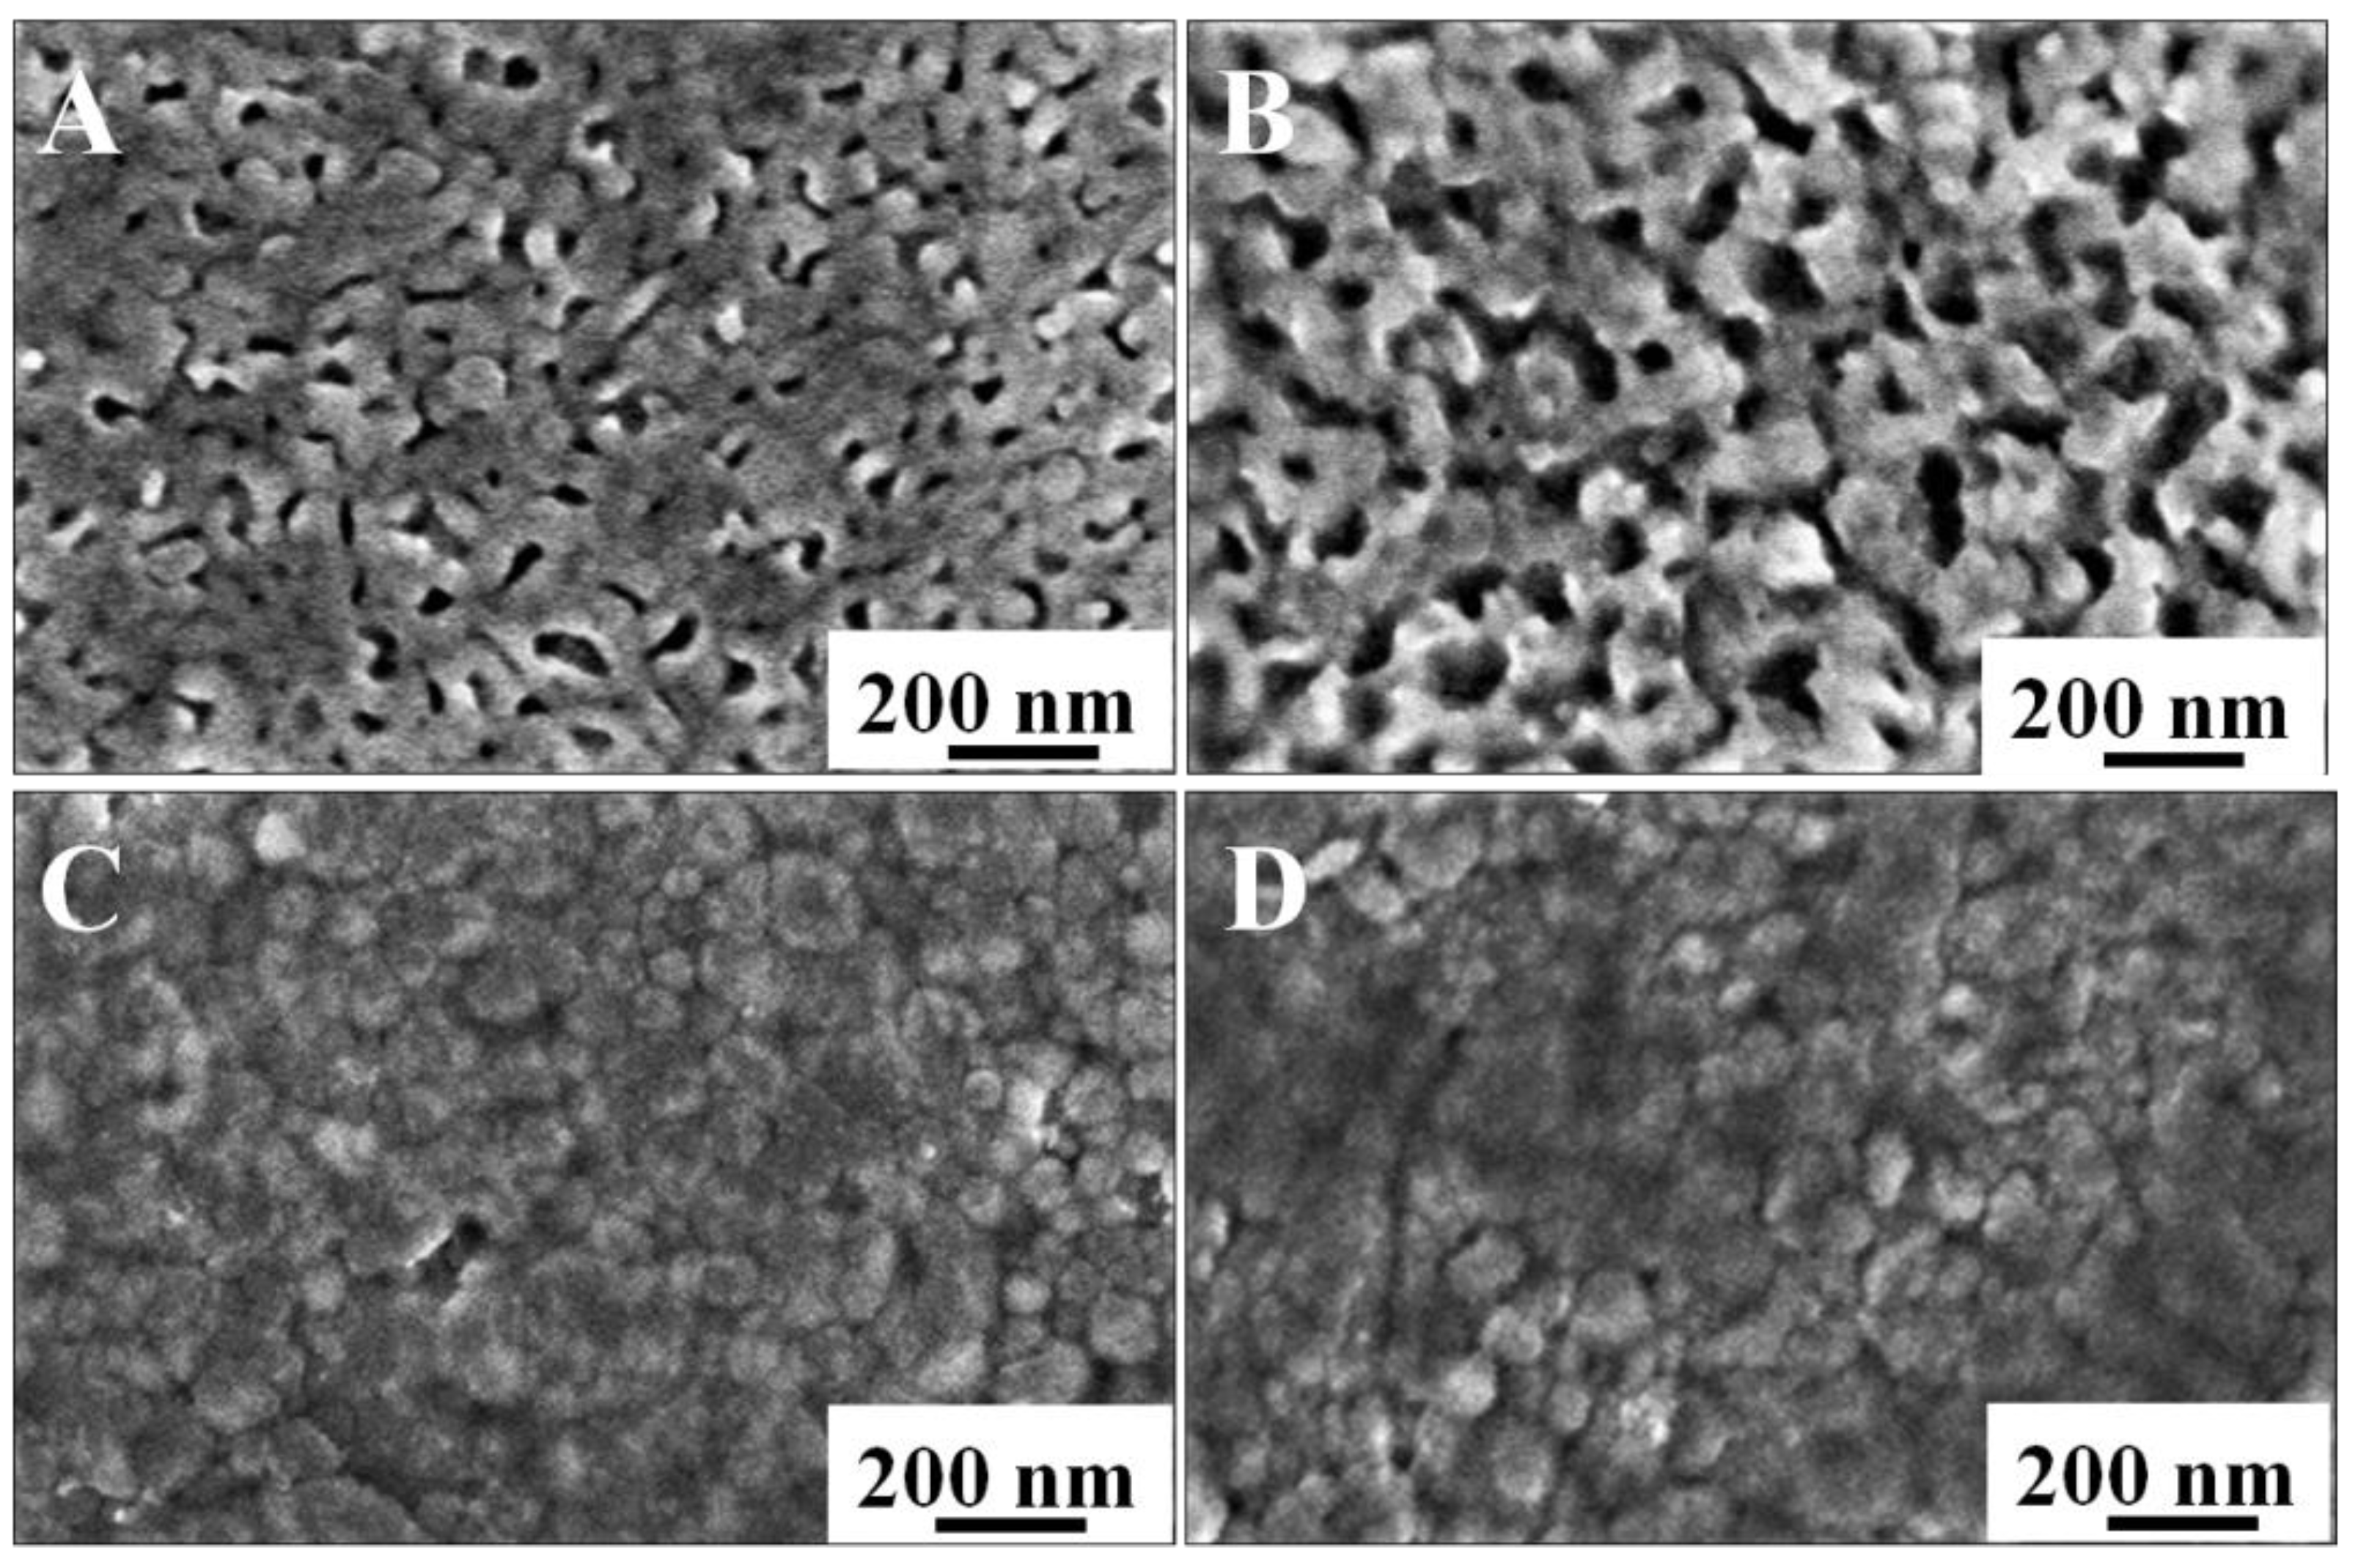
3.1. Morphologies and Structures of As-Prepared Samples

The scanning electron microscopy (SEM) images of the BiVO4 powder precursors used to fabricate the BVO (C) and the Mo-BVO (C) are shown in Figure S1. The BiVO4 precursor powders with and without Mo doping obtained by sol-gel methods exhibited similar morphologies, which were spherical or ellipsoidal, with sizes of 0.4~1.5 μm, and consisted of nanoparticles of 100~200 nm. The surface area of the doped and undoped powders measured by nitrogen adsorption and desorption were also quite similar: 2.77 m2/g and 2.82 m2/g, respectively.
Figure 1 shows the surfaces and the cross-section of the BVO (C) and Mo-BVO (C) ceramics. A few bubbles or holes can be observed on the surface of the ceramics chips, indicating that the as-prepared BVO (C) and Mo-BVO (C) showed high densities. The densities of the as-prepared BVO (C) and Mo-BVO (C) were measured to be 98.5% and 99.8% of the theoretical density for monoclinic BiVO4 (6.9 g/cm3) [28], respectively. The grain sizes of both ceramic samples were about 1~3 μm. The cross-sectional image shown in Figure 1C,D indicates that the thickness of the as-prepared BVO (C) and Mo-BVO (C) was about 15 μm. Although the thickness of the as-prepared BVO (C) and Mo-BVO (C) ceramics were still much larger than the diffusion length of the photogenerated electrons, which could lower the bulk charge separation efficiency during the PEC process, the ceramic chips would have easily broken during the electrode fabrication process if we had made them thinner. For comparison, the SEM images of the BVO and Mo-BVO films on FTO substrates are also presented, as shown in Figure S2. The morphologies of the BVO and Mo-BVO films are quite different from the BVO (C) and Mo-BVO (C), as shown in Figure 1, which mainly consisted of inter-connected nanoparticles with sizes of 10–50 nm. There were numerous voids between these nanoparticles. Furthermore, the thickness of both the BVO and the Mo-BVO films was about 200 nm.

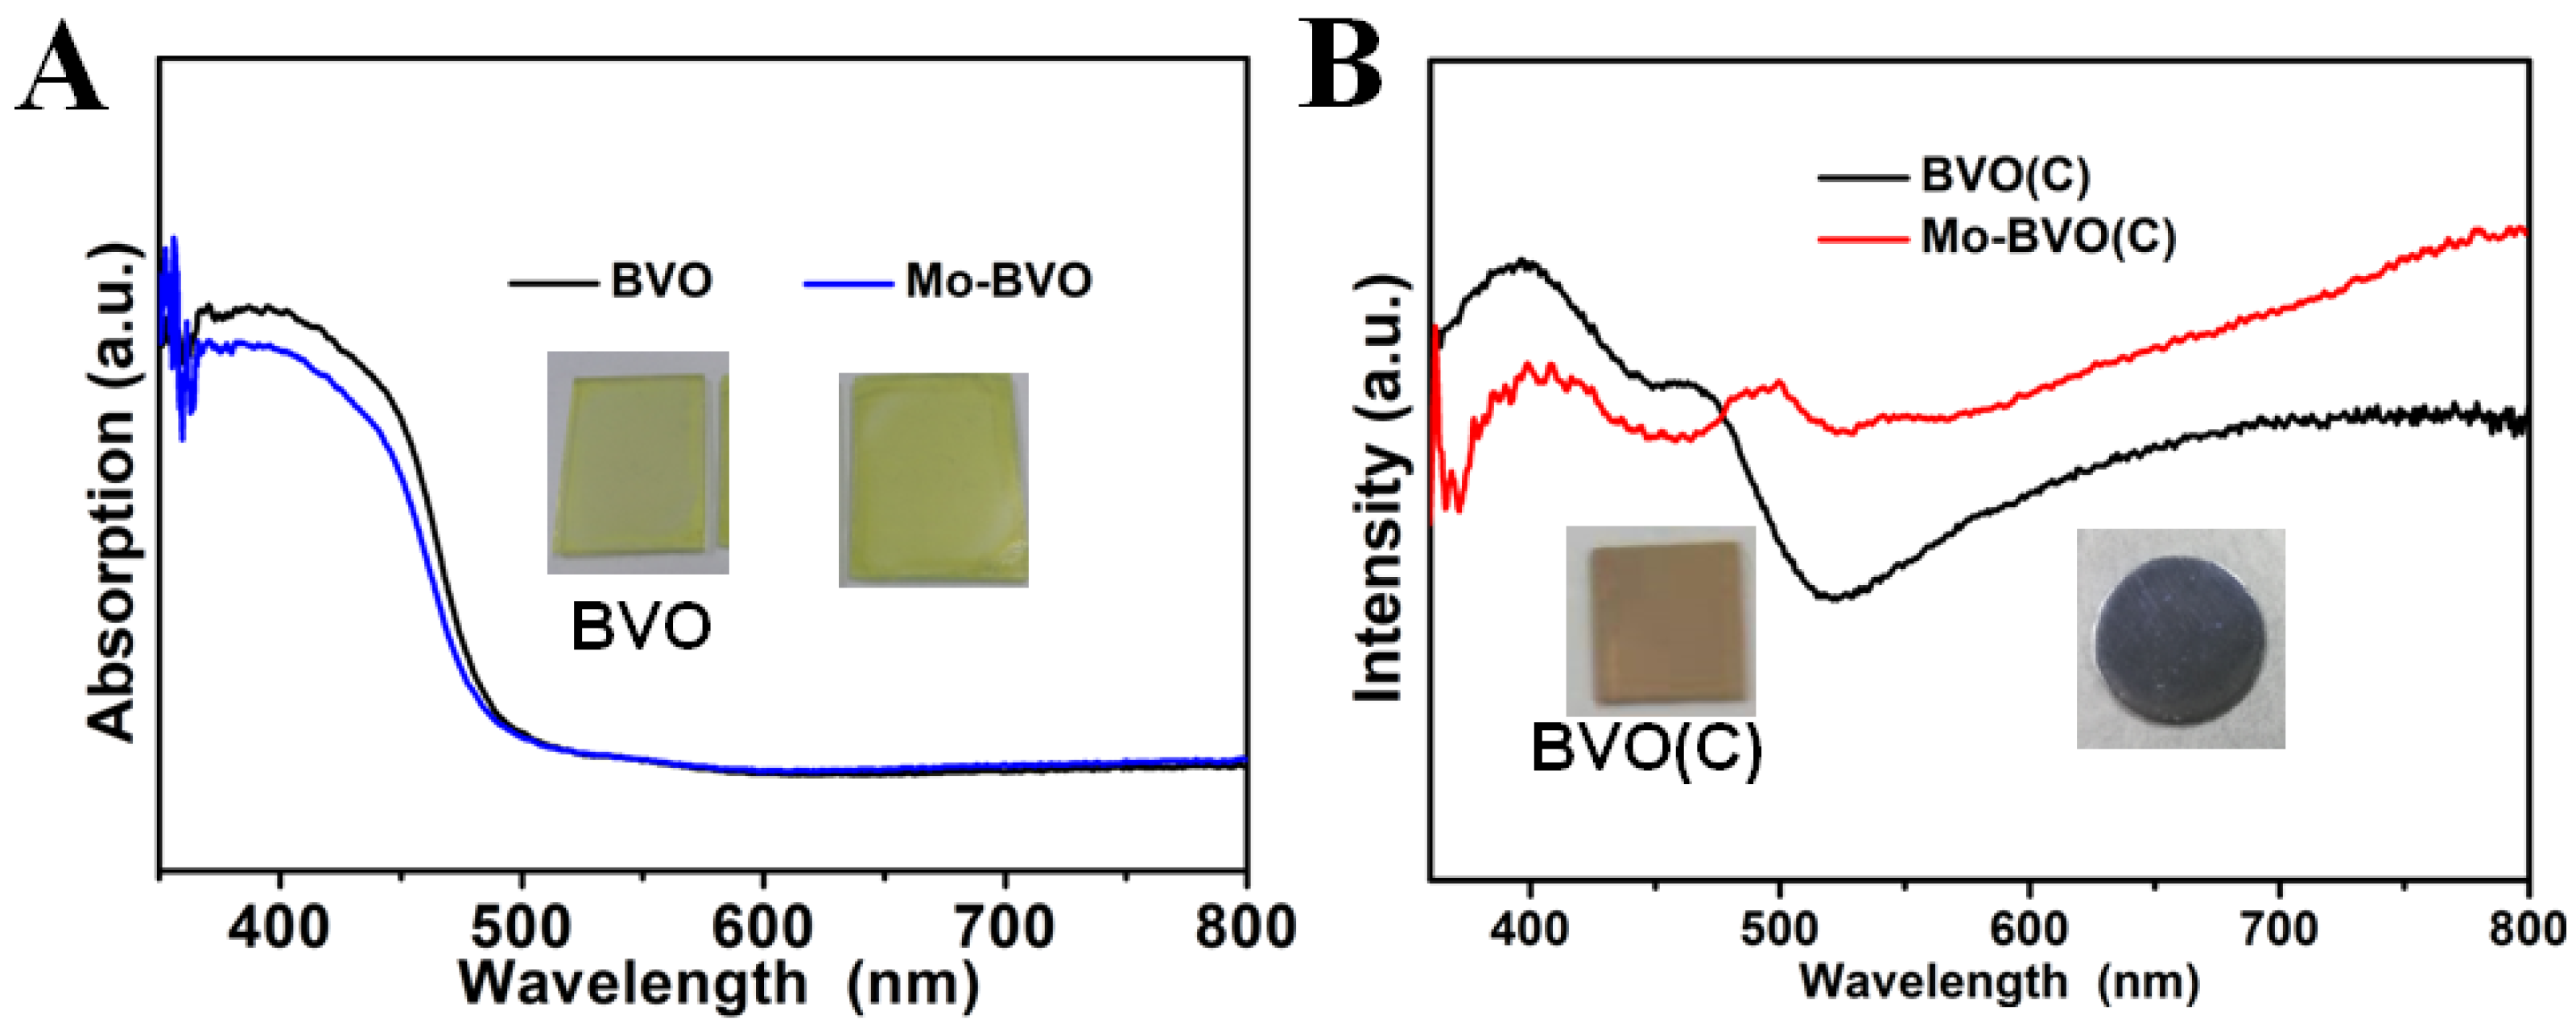
3.2. X-ray Diffraction and UV-Vis DRS Measurements

The XRD patterns of the BVO (C) and Mo-BVO (C), shown in Figure S3, can be identified as monoclinic BiVO4 (JPCDS No. 14-688) without any other impurity peaks. For the BVO and Mo-BVO, the XRD peaks corresponding to the FTO substrates (marked by * in Figure S3) can be observed beside the XRD peaks corresponding to the monoclinic BiVO4.
The light absorption of the as-prepared BVO and Mo-BVO films on the FTO substrates and the BVO (C) and Mo-BVO (C) ceramics were characterized by UV-Vis diffused reflectance spectra. As shown in Figure 2B, the BVO (C) exhibited a pale-yellow color with an absorption edge of 517 nm. However, after Mo doping, the Mo-BVO (C) exhibited a dark grey color with light absorption in the whole visible region. This is quite similar to the case of Mo doped BiVO4 single crystals reported in a different study [29]. According to this study, the change of sample color after Mo doping could be ascribed to the formation of shallow donor impurities, which can give rise to a low-energy transition between impurity levels and the conduction band of BiVO4. As a result, all visible photons can be absorbed by Mo doped BiVO4 ceramics or single crystals. This dark grey color is thought to be closely related to the size of the crystal domains, where the dark grey color of the Mo-BVO (C) turns back to yellow after grinding, as illustrated in Figure S4. Both the BVO and Mo-BVO films on the FTO substrates exhibited similar light absorption curves with a light absorption edge at 500 nm, as shown in Figure 2A.

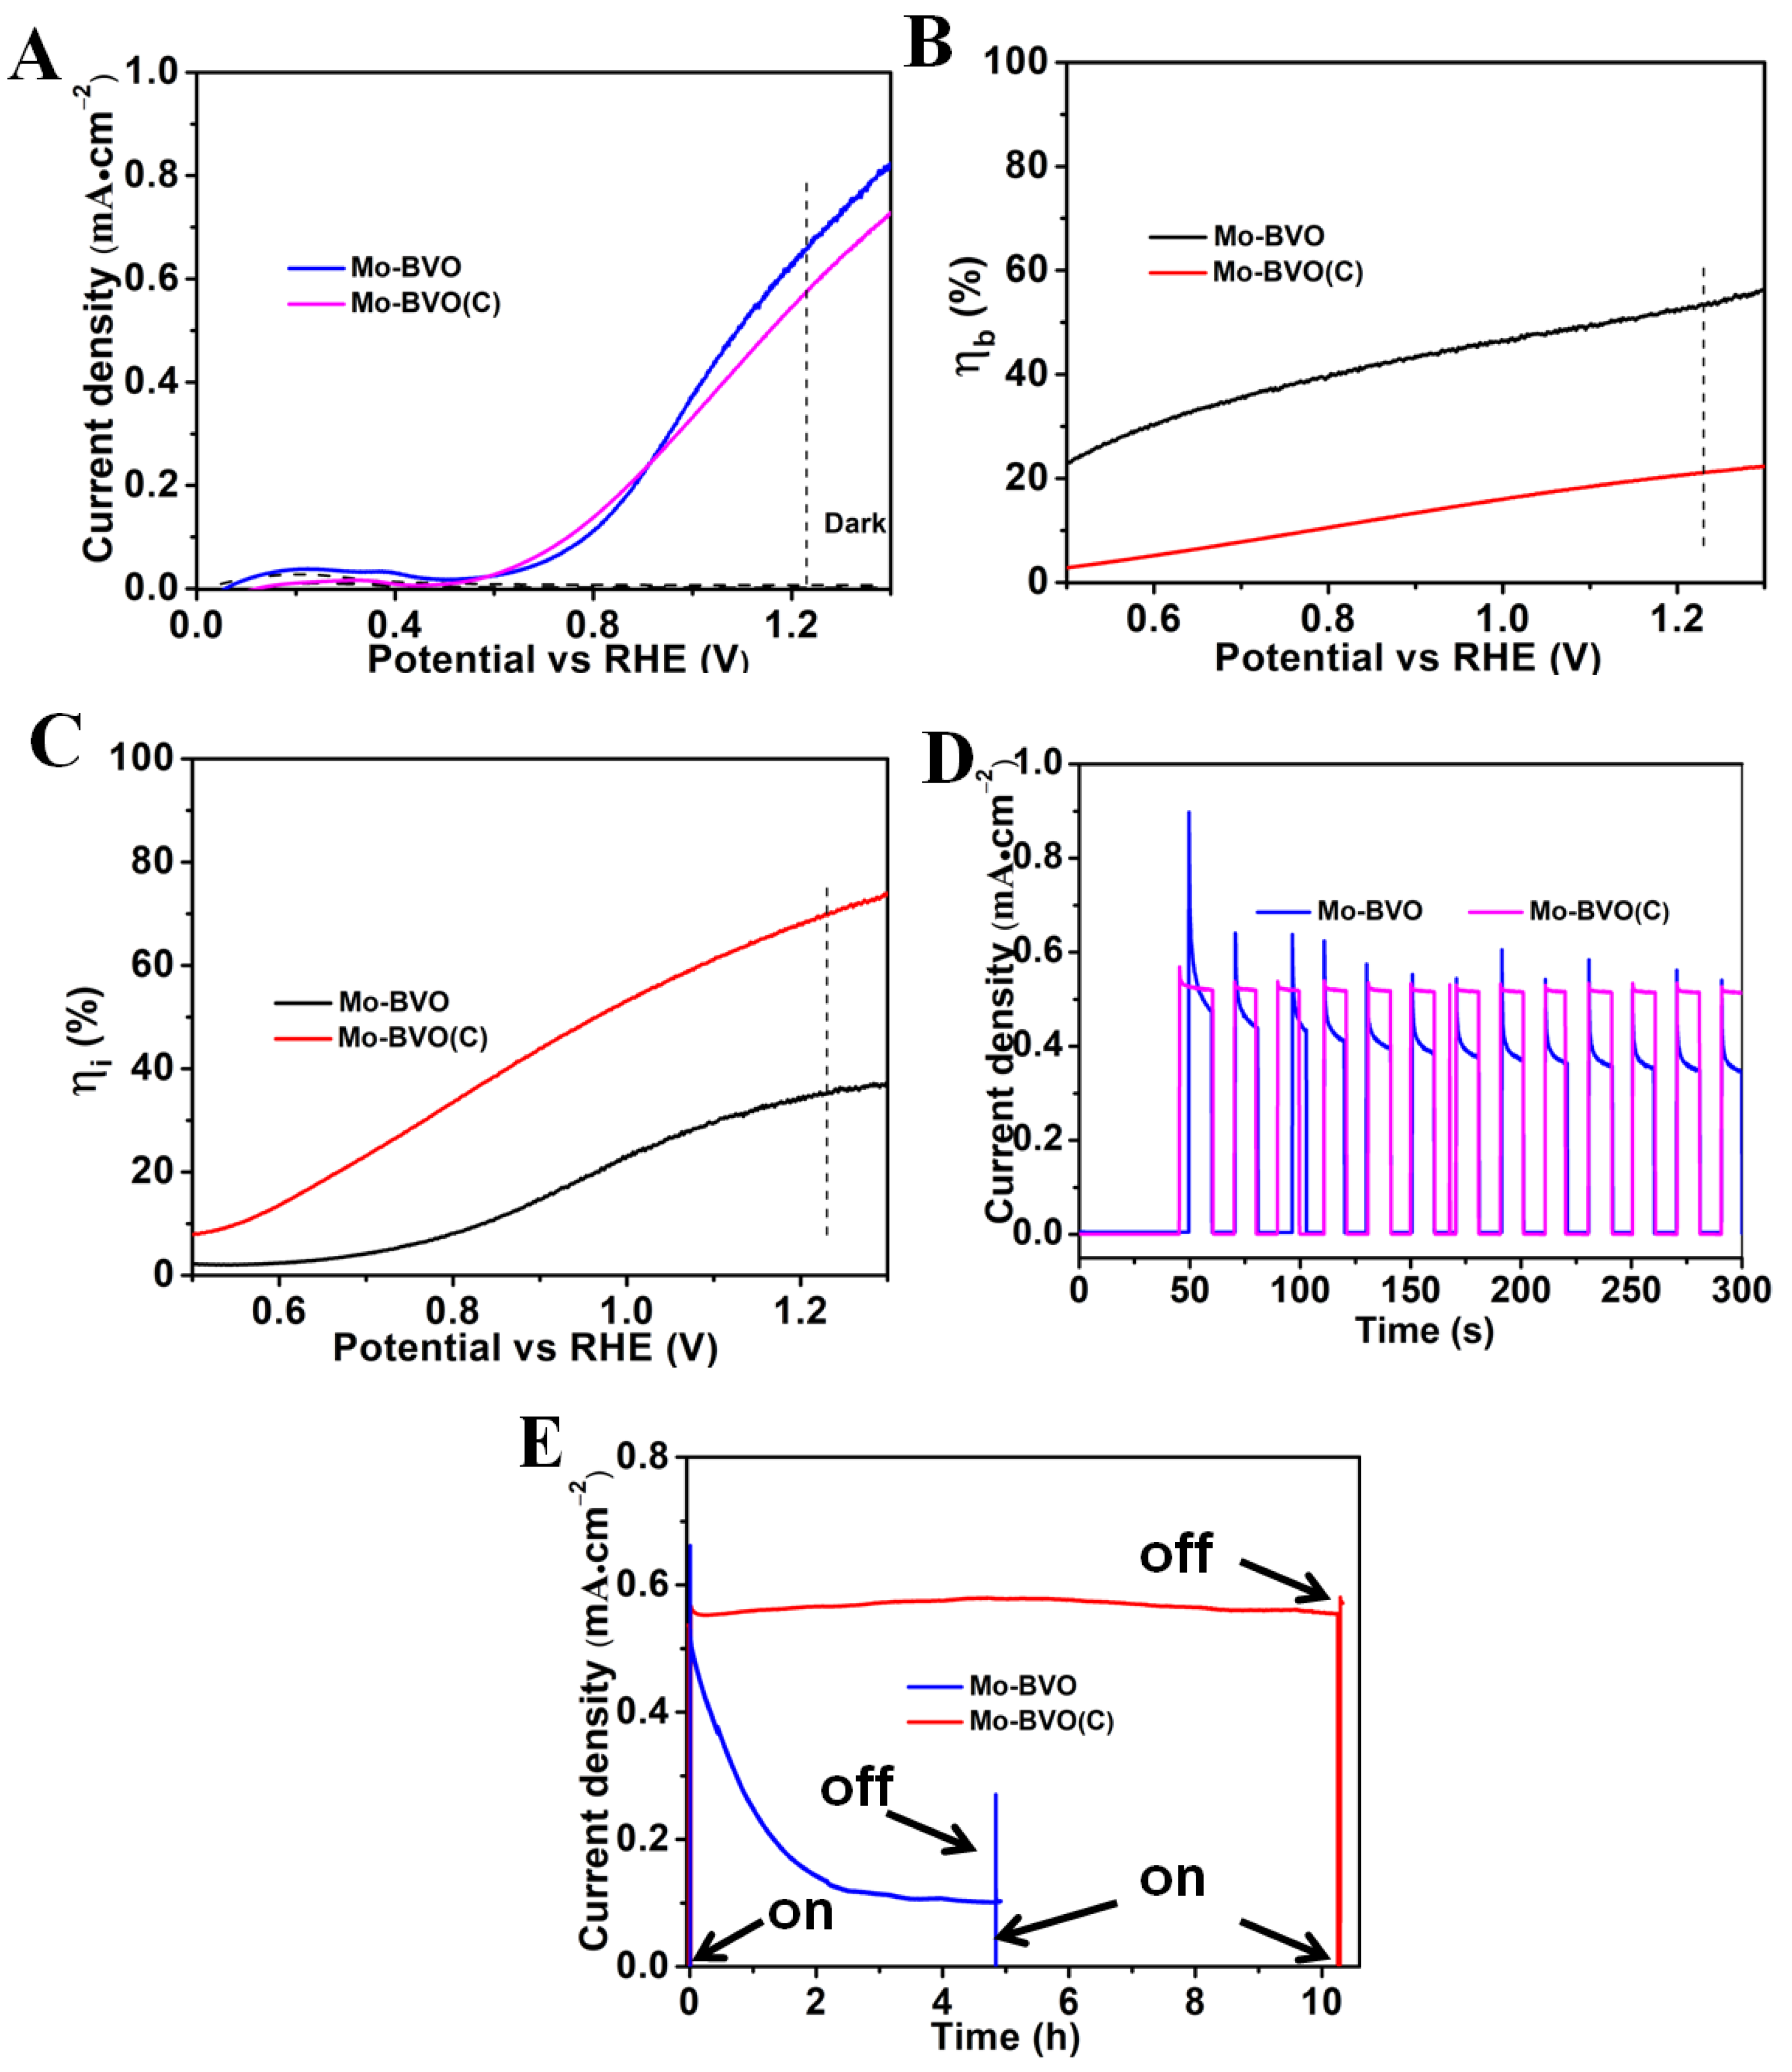
3.3. Photoelectrochemical Properties of BVO, BVO(C), Mo-BVO(C), and Mo-BVO

The photocurrent density versus applied potential (J-V) and the photocurrent density versus time curves (J-T) of the BVO(C) and the BVO are shown in Figure S5. Figure 3 shows the PEC performances of the Mo-BVO and Mo-BVO (C) samples. The photocurrents of the Mo-BVO (C) and Mo-BVO photoanodes were quite similar under AM1.5 G simulated solar light irradiation, as shown in Figure 3A. At 1.23 V vs. RHE, the photocurrent densities for the Mo-BVO and the Mo-BVO (C) were 0.54 and 0.66 mA/cm2, respectively. The lower photocurrent density of the Mo-BVO (C) was due to the larger thickness of the ceramic chips compared to those in the Mo-BVO films, which lowered the bulk charge separation efficiency as the photogenerated electrons transported across the photoanode. To prove this point, the bulk ( η b ) and interfacial ( η i ) charge separation efficiency of the as-prepared Mo-BVO and Mo-BVO (C) were calculated following the procedure shown in SI. The η b and η i of the two electrodes vs. the bias voltage are shown in Figure 3B,C. As shown in Figure 3B, the η b of the Mo-BVO and the Mo-BVO (C) at 1.23 V vs. RHE were 53.4% and 22.0%, respectively. This is in accordance with the analysis mentioned above. The Mo-BVO (C) was as thick as ~15 μm, which is much thicker than Mo-BVO film (~200 nm). Thus, more electrons would have recombined as they transported across the electrode in the Mo-BVO (C) than in the Mo-BVO film, which lead to a lower η b value for the Mo-BVO (C). Electrochemical impendence spectra (EIS) analysis were also carried out at 0 V vs. SCE under light irradiation. The Nyquist plots of Mo-BVO (C) and Mo-BVO are presented in Figure S6. As can be seen, the Mo-BVO exhibited a smaller semicircle than the Mo-BVO (C), which indicates that the charge transfer resistance (RCT) in the Mo-BVO was smaller than that in the Mo-BVO (C). By fitting the Nyquist plots according to the equivalent circuit, the RCT for the Mo-BVO (C) and the Mo-BVO were estimated at 11.3 and 6.5 kΩ, respectively, which is also accordance with the η b values mentioned above.
The η i of Mo-BVO (C) was much higher than that of the Mo-BVO film. As shown in Figure 3C, the η i values for the Mo-BVO (C) and the Mo-BVO at 1.23 V vs. RHE were 69.6% and 35.3%, respectively. This indicates that there were fewer defects on the surface of the Mo-BVO (C) than on that of the Mo-BVO because the surface defects would have been the main recombination centers for the photogenerated electrons and holes at the electrode/electrolyte interface during the PEC process. Additionally, the stability of the BiVO4 photoanodes was also regarded as closely dependent on the number of surface defects; in other words, the higher the surface defects, the lower the stability of the photoanode. Thus, the PEC stability of the as-prepared Mo-BVO (C) was expected to be much better than that of the Mo-BVO film.
In order to evaluate the PEC stability of the as-prepared Mo-BVO (C) and Mo-BVO photoanodes, the steady state photocurrents were measured at 1.23 V vs. RHE under chopped AM 1.5 G simulated solar light. As shown in Figure 3D, the Mo-BVO (C) exhibited better PEC stability, as expected. The photocurrent density of the Mo-BVO (C) was kept at 0.54 mA/cm2 without any decay in 300 s, while the photocurrent density of the Mo-BVO rapidly decreased from 0.66 mA/cm2 to 0.40 mA/cm2 in 300 s. On closer observation of the transient photocurrent pulse, the shapes of the pulse for the Mo-BVO (C) and the Mo-BVO were also quite different. As the light was turned on, the photocurrent of both the Mo-BVO (C) and the Mo-BVO increased rapidly. However, the photocurrent of the Mo-BVO rapidly decreased until the light was off, while the photocurrent of the Mo-BVO (C) slightly decreased and stabilized rapidly. This indicates that the recombination of photogenerated charge carriers in the Mo-BVO was much quicker than in the Mo-BVO (C), which could mainly be ascribed to the larger number of surface defects in the Mo-BVO. To address this point, steady state photocurrent measurements were also performed in the presence of Na2SO3 as a hole scavenger, as shown in Figure S7. The photocurrent density of both the Mo-BVO (C) and the Mo-BVO increased in the presence of 0.1 M Na2SO3. At 1.23 V vs. RHE, the photocurrent densities of the Mo-BVO (C) and the Mo-BVO were 0.79 and 1.87 mA/cm2, respectively. Furthermore, as shown in the J-T plots in Figure S7B, the photocurrents of both the Mo-BVO (C) and the Mo-BVO remained stable without any decay. More importantly, the shape of the transient photocurrent pulse of the Mo-BVO greatly changed, while the photocurrent rapidly increased as the light was turned on and quickly stabilized. This result indicates that the rapid surface recombination of photogenerated electrons and holes could have been the main reason for the poor PEC stability of the as-prepared Mo-BVO, which would subsequently have lead to the rapid decrease in photocurrent. In order to investigate the long-term PEC stability of the Mo-BVO (C) and the Mo-BVO, steady state photocurrent measurements were performed at 1.23 V vs. RHE under AM 1.5 G simulated solar light irradiation for a longer time. As shown in Figure 3E, the Mo-BVO (C) exhibited excellent PEC stability, while the photocurrent kept stable without any obvious decay after 10 h. However, the photocurrent of the Mo-BVO decreased from 0.66 to 0.11 mA/cm2 after 4 h.
The incident photon-to-current conversion efficiencies (IPCEs) of the Mo-BVO (C) and the Mo-BVO were also measured, as shown in Figure S8. The IPCEs of the Mo-BVO were slightly higher than those of the Mo-BVO (C). At 420 nm, the IPCE values for the Mo-BVO and the Mo-BVO (C) were 17% and 12%, respectively. The IPCE plots of the Mo-BVO accorded with the DRS spectra, as shown in Figure 2, where the IPCE value become zero as the wavelengths were longer than 500 nm. However, the IPCE plots of the Mo-BVO (C) were quite different from the DRS spectra, as shown in Figure 2. Although the Mo-BVO (C) absorbed photons atwavelengths longer than 500 nm, these photons could not generate any photocurrent during PEC water splitting.

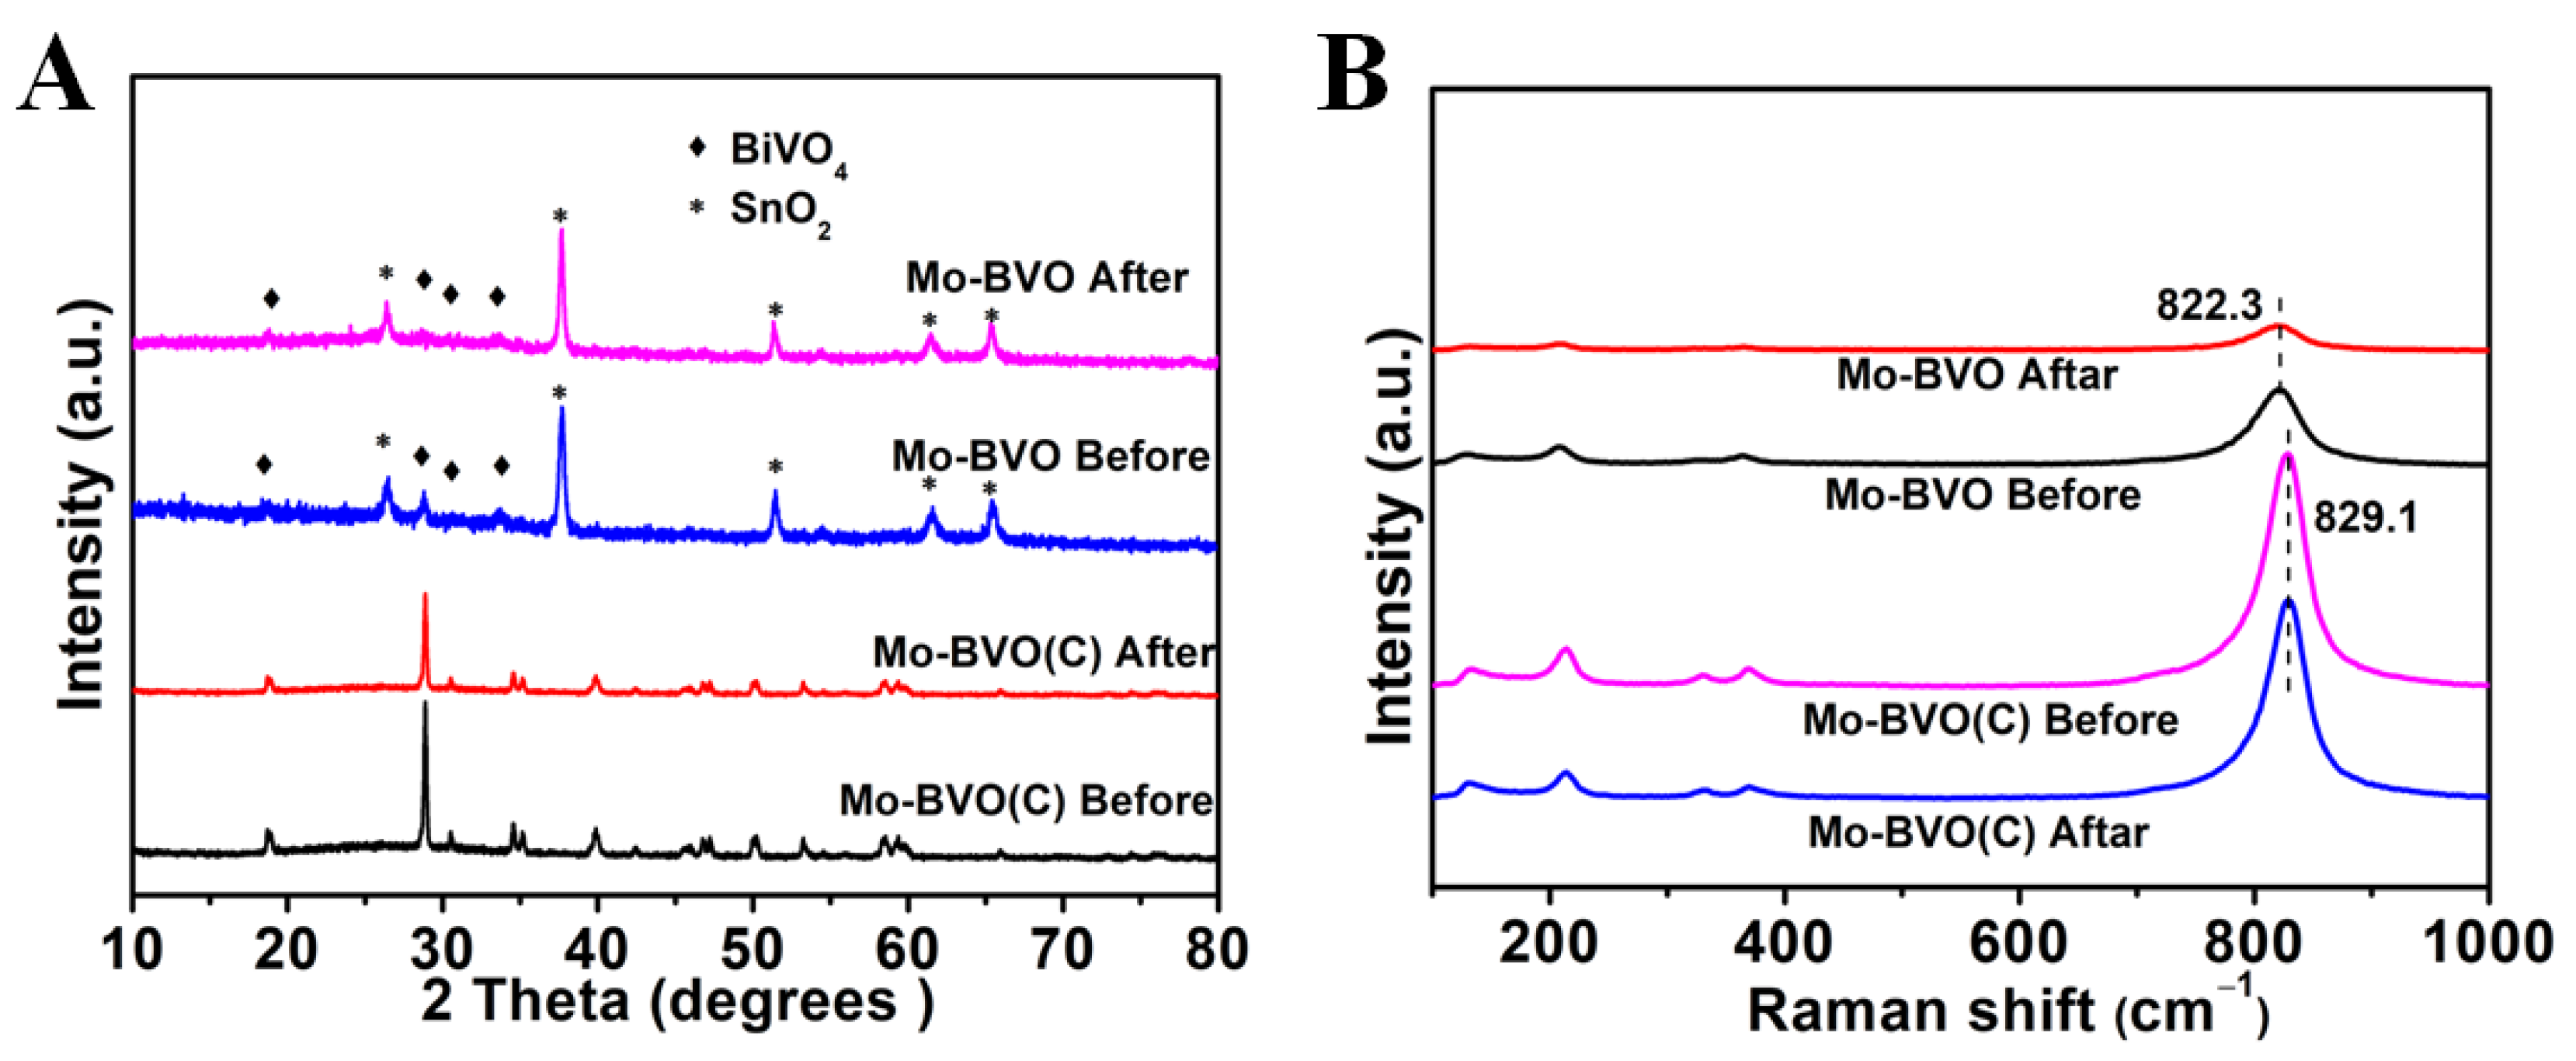
3.4. Photoelectrochemical Properties, SEM, XRD, Raman, XPS, and EDS of the Mo-BVO and Mo-BVO (C) Electrodes after the Stability Test

In order to probe the mechanism underlying the good PEC stability of the as-prepared Mo-BVO (C), systematic investigations were carried out to find changes before and after the long-term PEC experiments. For comparison, the same characterizations of the Mo-BVO films on the FTO substrates were also investigated.
As shown in Figure 4A, no obvious changes to the structures of Mo-BVO and Mo-BVO (C) were observed after the long-term PEC experiments. Both the Mo-BVO and the Mo-BVO were indexed to monoclinic BiVO4 without the appearance of any other impurities. However, the intensity of the XRD of the Mo-BVO was very low, and it becomes lower after four hours of illumination, as shown in Figure 4A. According to the diffraction intensity, the crystallinity of the film was poor. The higher the crystalline quality, the smaller the proportion of defects. The defects acted as trapping and recombination centers for the photogenerated electrons and holes, resulting in a decrease in photoelectrochemical catalytic activity and severe photocorrosion.
The Raman spectra of the two photoelectrodes before and after illumination are shown in Figure 4B. Five Raman peaks were detected in both the Mo-BVO and the Mo-BVO (C), which was ascribed to the characteristic Raman peaks for monoclinic scheelite BiVO4. The strongest peaks, at around 822 cm−1 (Mo-BVO) and 829 cm−1 (Mo-BVO(C)), were ascribed to the antisymmetric stretching modes of the VO4 tetrahedra. The bending modes of the VO4 tetrahedra at 328 cm−1 and 369 cm−1, and 323 cm−1 and 364 cm−1, belonged to the Mo-BVO electrode and Mo-BVO (C) electrode, respectively. The peaks at 126 cm−1 and 209 cm−1 (Mo-BVO), and 131 cm−1 and 214 cm−1 (Mo-BVO (C)) were due to the vibration of the crystal lattice [29,30,31]. After long-term PEC experiments, the Raman spectra of Mo-BVO (C) did not change. However, the Raman peaks of the Mo-BVO become weaker and wider after the long-term PEC experiments, as the intensity and the width of the Raman peaks were closely related to the crystallinity of the materials. The change in the Raman peaks for the Mo-BVO before and after the PEC experiments indicated the decrease in the crystallinity of the Mo-BVO.
In order to investigate the changes in the morphologies of the Mo-BVO (C) and the Mo-BVO, SEM images for the two samples before and after the PEC stability test were prepared, as shown in Figure 5. As can be seen in Figure 5A,B, great morphological changes were observed for the Mo-BVO before and after the PEC stability test. The original morphology of the Mo-BVO consisted of inter-connected Mo doped BiVO4 nanoparticles with smooth surfaces. However, these Mo doped BiVO4 nanoparticles were seriously corroded after the PEC experiments at 1.23 V for 4 h. This is consistent with the photocorrosion phenomenon of the reported BiVO4 film electrodes [6], in which either the interface between the particles or the surface of particles is corroded preferentially. The case of the Mo-BVO (C) was much better, where the surface morphology did not greatly change before or after the PEC stability test for 10 h.
As the instability of the BiVO4 photoanodes was thought to have been due to the partial dissociation of V into the electrolyte solution during the PEC process, the Bi/V ratio before and after the PEC process in the photoanode was expected to increase. To probe the change to the Bi/V ratio, EDS measurements were carried out on the Mo-BVO and the Mo-BVO (C) before and after the PEC stability test. The initial Bi/V ratios for the Mo-BVO (C) and the Mo-BVO were 1: 0.87 and 1:0.80, respectively (see Table S1). However, after the stability test, the Bi/V ratios for the Mo-BVO (C) and the Mo-BVO became 1: 0.73 and 1: 0.73, respectively. This result indicated that more V was dissociated from the Mo-BVO than from Mo-BVO (C). This could explain why the PEC stability of the Mo-BVO (C) was much better than that of the Mo-BVO.
To probe the surface states of the Mo-BVO and the Mo-BVO (C) before and after the stability tests, XPS measurements were also performed. As shown in Figures S9 and S10, C, Bi, V, O and Mo were detected in both samples. Furthermore the actual doping concentrations of Mo in the Mo-BVO and the Mo-BVO (C) were measured at 0.63% and 0.5%, respectively (see Table S2). Although the starting dopant concentration in both the Mo-BVO and the Mo-BVO (C) was the same (1%), more V could volatize during the high-temperature calcination process in the Mo-BVO (C) owing to its higher calcination temperature and longer calcination time. As shown in Figure S9, the Bi 4f and V 3d XPS peaks of the Mo-BVO (C) remained almost unchanged before and after the long-term PEC test. However, in the case of the Mo-BVO, the V 3d XPS peaks clearly became smaller after the PEC test, while the Bi 4f XPS peaks remained unchanged. The initial Bi/V ratio for the Mo-BVO and the Mo-BVO (C) were 1:0.80 and 1:0.9, respectively. Furthemore, after the stability test, the Bi/V ratio for the Mo-BVO and the Mo-BVO (C) became 1: 0.51 and 1: 0.80, respectively. This result accorded with the stability test discussed above, where the decrease of the V 3d XPS peaks for the Mo-BVO was ascribed to the dissociation of V into the electrolyte solution during the long-term PEC test, indicating that the Mo-BVO (C) was more stable than the Mo-BVO during the PEC process. Accordingly, the O 1s XPS peaks corresponding to the surface oxygen species [32,33,34] (hydroxy groups, dangling oxygen) at about 531 eV also greatly changed for the Mo-BVO, while the ratio of surface oxygen species of the Mo-BVO increased from 9.25% to 22.35% before and after the stability test, respectively (see Figure S10E). However, for the Mo-BVO (C), this ratio only slightly increased from 27 % to 30% before and after the stability test. This result was also consistent with the SEM images in Figure 5, where serious photo-corrosion in the Mo-BVO film effectively increased the exposed surface area to electrolyte solution, leading to an increase in the number of surface oxygen species.
According to the experimental results and the analyses discussed above, the Mo-BVO (C) ceramic electrode with higher crystallinity and fewer surface defects was proven to be more stable than the Mo-BVO film consisting of nanoparticles. BiVO4 ceramic photoanodes, with their higher crystallinity and fewer surface defects, not only exhibit higher interfacial charge separation efficiency, but are also able to effectively inhibit the dissociation of V from the electrode to the electrolyte solution during the PEC process. As the stability of BiVO4 photoanode is vitally important for practical applications, BiVO4 ceramics could be potential candidates for the fabrication of highly stable BiVO4 photoanodes for PEC water splitting. On the other hand, as it might be difficult to decrease the thickness of BiVO4 ceramics to hundreds of nanometers, the PEC stability of BiVO4 photoanodes could also be enhanced by improving their crystallinity and reducing the concentration of their surface defects.

4. Conclusions

In summary, we fabricated BiVO4 ceramics with high density and good crystallinity using the SPS method and investigated their PEC performances and stability. Compared to Mo-BVO films on FTO substrates consisting of BiVO4 nanoparticles, the as-prepared Mo-BVO (C) exhibited greatly enhanced PEC stability under simulated solar light irradiation. At 1.23 V vs. RHE, the photocurrent of the Mo-BVO (C) remained almost unchanged at 0.54 mA/cm2 for as long as 10 h, while the photocurrent of the Mo-BVO films decreased from 0.66 mA/cm2 to 0.11 mA/cm2 in 4 h. By comparing the changes to the respective structures, morphologies, compositions, and surface states of the as-prepared Mo-BVO and the Mo-BVO (C) before and after the PEC stability tests, the excellent PEC stability of the Mo-BVO (C) was ascribed to its superior crystallinity and lower concentration of surface defects, which can greatly reduce the dissociation of V from the electrode and prevent photo-corrosion during the PEC process. This study demonstrates a rational design of BiVO4 ceramics to improve the stability of the corresponding photoanode, and may be applied to other metal oxide photoanodes in order to maintain their high photostability.

Supplementary Materials

The following are available online at https://www.mdpi.com/article/10.3390/nano11092404/s1, Figure S1: SEM images of the BiVO4 powder precursors to fabricate BVO (C) and Mo-BVO (C), Figure S2: Top-view and cross-sectional SEM images of BVO and Mo-BVO films on FTO substrates, Figure S3: XRD patterns of BVO (C), Mo-BVO (C), BVO and Mo-BVO films on FTO substrates, Figure S4: UV-Vis absorption spectrums of Mo-BVO(C) powder and BVO(C) powder from the Mo-BVO(C) ceramiac and BVO(C) ceramiac ground with a mortar, Figure S5: Photocurrent density versus applied potential (J-V) curves and Photocurrent vs. time (I-T) measured for the BVO(C) and BiVO4 film photoanodes with a scan rate of 20 mV/s under AM 1.5G illumination in 0.1 M KPi buffer solution, Figure S6: Nyquist plots of Mo-BVO(C) and Mo-BVO samples, Figure S7: J-V and I-T curves measured for the Mo-BVO and Mo-BVO(C) photoanodes in 0.1M Na2SO3 KPi solution, Figure S8: IPCEs for Mo-BVO and Mo-BVO(C) measured in the wavelength range from 350 to 550 nm at applied voltage of 1.23 V vs. RHE, Figure S9: XPS patterns of the Mo-BVO(C) electrodes in KPi before and after PEC stability tests, Figure S10: XPS patterns of the Mo-BVO electrodes in KPi before and after PEC stability tests, Table S1. EDS of Mo-BVO and Mo-BVO(C), Table S2: Mo content in Mo-BVO and Mo-BVO(C).

Author Contributions

Conceptualization, L.Z.; data curation, Y.L. (Yujie Li) and W.J.; Formal analysis, L.Z.; M.L. and Z.Z.; Investigation, Y.L. (Yujie Li); J.L. and P.W.; Methodology, L.Z.; M.L. and F.M.; Project administration, Z.W.; Y.L. (Yuanyuan Liu) and B.H.; Supervision, H.C. and B.H.; Resources, Z.W.; P.W.; Y.D. and B.H.; Writing—original draft, L.Z.; Writing—review & editing, M.W. and H.C.; Validation, Z.Z.; Y.L. (Yuanyuan Liu) and B.H. All authors have read and agreed to the published version of the manuscript.

Funding

This work was financially supported by the National Natural Science Foundation of China (21972078, 51972195), the National Key R & D Program “key scientific issues of transformative technology” (2020YFA0710301) and the Natural Science Foundation of Shandong Province (ZR2019MEM004). Z.Y.W. acknowledges the support from the Shandong University multidisciplinary research and innovation team’s young scholars (2020QNQT11) and the Fundamental Research Funds of Shandong University (2018JC039). B.B.H acknowledges the support from the Taishan Scholar Foundation of Shandong Province.

Data Availability Statement

The data presented in this study are available on request from the corresponding author.

Conflicts of Interest

The authors declare no conflict of interest.

References

  1. Fujishima, A.; Honda, K. Electrochemical photolysis of water at a semiconductor electrode. Nature 1972, 238, 37–38. [Google Scholar] [CrossRef] [PubMed]
  2. Zhang, B.; Wang, Z.Y.; Huang, B.B.; Zhang, X.Y.; Qin, X.Y.; Li, H.L.; Dai, Y.; Li, Y.J. Anisotropic Photoelectrochemical (PEC) Performances of ZnO Single Crystalline Photoanode: Effect of Internal Electrostatic Fields on the Separation of Photogenerated Charge Carriers during PEC Water Splitting. Chem. Mater. 2016, 28, 6613–6620. [Google Scholar] [CrossRef]
  3. Qiu, Y.C.; Liu, W.; Chen, W.; Chen, W.; Zhou, G.M.; Hsu, P.-C.; Zhang, R.F.; Liang, Z.; Fan, S.S.; Zhang, Y.G.; et al. Efficient solar-driven water splitting by nanocone BiVO4-perovskite tandem cells. Sci. Adv. 2016, 2, e1501764. [Google Scholar] [CrossRef] [Green Version]
  4. Liu, X.E.; Wang, F.Y.; Wang, Q. Nanostructure-based WO3 photoanodes for photoelectrochemical water splitting. Phys. Chem. Chem. Phys. 2012, 4, 7894–7911. [Google Scholar] [CrossRef]
  5. Cooper, J.K.; Gul, S.; Toma, F.M.; Chen, L.; Glans, P.-A.; Guo, J.H.; Ager, J.W.; Yano, J.; Sharp, I.D. Electronic structure of monoclinic BiVO4. Chem. Mater. 2014, 26, 5365–5373. [Google Scholar] [CrossRef]
  6. Toma, F.M.; Cooper, J.K.; Kunzelmann, V.M.; McDowell, M.T.; Yu, J.; Larson, D.M.; Borys, N.J.; Abelyan, C.; Beeman, J.W.; Yu, K.M.; et al. Mechanistic insights into chemical and photochemical transformations of bismuth vanadate photoanodes. Nat. Commun. 2016, 7, 12012. [Google Scholar] [CrossRef] [PubMed] [Green Version]
  7. Seabold, J.A.; Choi, K.S. Efficient and stable photooxidation of water by a bismuth vanadate photoanode couples with an iron oxyhydroxide oxygen evolution catalyst. J. Am. Chem. Soc. 2012, 134, 2186–2192. [Google Scholar] [CrossRef]
  8. Nair, V.; Perkins, C.L.; Lin, Q.Y.; Law, M. Textured nanoporous Mo: BiVO4 photoanodes with high charge transport and charge transfer quantum efficiencies for oxygen evolution. Energy Environ. Sci. 2016, 9, 412–1429. [Google Scholar] [CrossRef] [Green Version]
  9. Tayebi, M.; Lee, B.-K. Recent advances in BiVO4 semiconductor materials for hydrogen production using photoelectrochemical water splitting. Renew. Sust. Energy Rev. 2019, 111, 332–343. [Google Scholar] [CrossRef]
  10. Jeong, S.Y.; Choi, K.S.; Shin, H.-M.; Kim, T.L.; Song, J.; Yoon, S.; Jang, H.W.; Yoon, M.-H.; Jeon, C.; Lee, J.; et al. Enhanced photocatalytic performance depending on morphology of bismuth vanadate thin film synthesized by pulsed laser deposition. ACS Appl. Mater. Interfaces 2017, 9, 505–512. [Google Scholar] [CrossRef]
  11. Zhang, L.W.; Lin, C.-Y.; Valev, V.K.; Reisner, E.; Steiner, U.; Baumberg, J.J. Plasmonic Enhancement in BiVO4 Photonic Crystals for Effi cient Water Splitting. Small 2014, 10, 3970–3978. [Google Scholar] [CrossRef] [Green Version]
  12. Zhou, M.; Bao, J.; Xu, Y.; Zhang, J.J.; Xie, J.F.; Guan, M.L.; Wang, C.L.; Wen, L.Y.; Lei, Y.; Xie, Y. Photoelectrodes Based upon Mo: BiVO4 Inverse Opals for Photoelectrochemical Water Splitting. ACS Nano 2014, 8, 7088–7098. [Google Scholar] [CrossRef] [PubMed]
  13. Talasila, G.; Sachdev, S.; Srivastva, U.; Saxena, D.; Ramakumar, S.S.V. Modified synthesis of BiVO4 and effect of doping (Mo or W) on its photoelectrochemical performance for water splitting. Energy Rep. 2020, 6, 1963–1972. [Google Scholar] [CrossRef]
  14. Zhong, D.K.; Choi, S.; Gamelin, D.R. Near-Complete Suppression of Surface Recombination in Solar Photoelectrolysis by “Co-Pi” Catalyst-Modified W:BiVO4. J. Am. Chem. Soc. 2011, 133, 18370–18377. [Google Scholar] [CrossRef]
  15. Grigioni, I.; Abdellah, M.; Corti, A.; Dozzi, M.V.; Hammarström, L.; Selli, E. Photoinduced Charge-Transfer Dynamics in WO3/BiVO4 Photoanodes Probed through Midinfrared Transient Absorption Spectroscopy. J. Am. Chem. Soc. 2018, 140, 14042–14045. [Google Scholar] [CrossRef] [Green Version]
  16. Bielinski, A.R.; Lee, S.; Brancho, J.J.; Esarey, S.L.; Gayle, A.J.; Kazyak, E.; Sun, K.; Bartlett, B.M.; Dasgupta, N.P. Atomic Layer Deposition of Bismuth Vanadate Core-Shell Nanowire Photoanodes. Chem. Mater. 2019, 31, 3221–3227. [Google Scholar] [CrossRef]
  17. McDowell, M.T.; Lichterman, M.F.; Spurgeon, J.M.; Hu, S.; Sharp, I.D.; Brunschwig, B.S.; Lewis, N.S. Improved Stability of Polycrystalline Bismuth Vanadate Photoanodes by Use of Dual-Layer Thin TiO2/Ni Coatings. J. Phys. Chem. C 2014, 118, 19618–19624. [Google Scholar] [CrossRef] [Green Version]
  18. Zhang, B.B.; Huang, X.J.; Zhang, Y.; Lu, G.X.; Chou, L.J.; Bi, Y.P. Unveiling the Activity and Stability Origin of BiVO4 Photoanodes with FeNi Oxyhydroxides for Oxygen Evolution. Angew. Chem. Int. Ed. 2020, 132, 19152–19157. [Google Scholar] [CrossRef]
  19. Lee, D.K.; Cho, K.-S. Enhancing long-term photostability of BiVO4 photoanodes for solar water splitting by tuning electrolyte composition. Nat. Energy 2018, 3, 53–60. [Google Scholar] [CrossRef]
  20. Qiu, W.T.; Xiao, S.; Ke, J.W.; Wang, Z.; Tang, S.Y.; Zhang, K.; Qian, W.; Huang, Y.C.; Huang, D.; Tong, Y.X.; et al. Freeing the polarons to facilitate charge transport in BiVO4 from oxygen vacancies with an oxidative 2D precursor. Angew. Chem. Int. Ed. 2019, 58, 19087–19095. [Google Scholar] [CrossRef]
  21. Meng, Q.J.; Zhang, B.B.; Fan, L.Z.; Liu, H.D.; Valvo, M.; Edström, K.; Coartero, M.; Marco, R.D.; Crespo, G.A.; Sun, L.C. Efficient BiVO4 photoanodes by postsynthetic treatment: Remarkable improvements in photoelectrochemical performance from facile borate modification. Angew. Chem. Int. Ed. 2019, 58, 19027–19033. [Google Scholar] [CrossRef] [Green Version]
  22. Guillon, O.; Gonzalez-Julian, J.; Dargatz, B.; Kessel, T.; Schierning, G.; Räthel, J.; Herrmann, M. Field-Assisted Sintering Technology/ Spark Plasma Sintering: Mechanisms, Materials, and Technology Developments. Adv. Eng. Mater. 2014, 16, 830–849. [Google Scholar] [CrossRef]
  23. Wang, M.; Che, Y.S.; Niu, C.; Dang, M.Y.; Dong, D. Effective visible light-active boron and europium co-doped BiVO4 synthesized by sol-gel method for photodegradion of methyl orange. J. Hazard. Mater. 2013, 262, 447–455. [Google Scholar] [CrossRef]
  24. Gromboni, M.F.; Coelho, D.; Mascaro, L.H.; Pockett, A.; Marken, F. Enhancing activity in a nanostructured BiVO4 photoanode with a coating of microporous Al2O3. Appl. Catal. B Environ. 2017, 200, 133–140. [Google Scholar] [CrossRef] [Green Version]
  25. Lamers, M.; Fiechter, S.; Friedrich, D.; Abdi, F.F.; Van de Krol, R. Formation and suppression of defects during heat treatment of BiVO4 photoanodes for solar water splitting. J. Mater. Chem. A 2018, 6, 18694–18700. [Google Scholar] [CrossRef] [Green Version]
  26. Wang, M.R.; Wang, Z.Y.; Zhang, B.; Jiang, W.Y.; Bao, X.L.; Cheng, H.F.; Zheng, Z.K.; Wang, P.; Liu, Y.Y.; Whangbo, M.-H.; et al. Enhancing the Photoelectrochemical Water Oxidation Reaction of BiVO4 Photoanode by Employing Carbon Spheres as Electron Reservoirs. ACS Catal. 2020, 10, 13031–13039. [Google Scholar] [CrossRef]
  27. Zhang, H.P.; Li, H.L.; Wang, Z.Y.; Zheng, Z.K.; Wang, P.; Liu, Y.Y.; Zhang, X.Y.; Qin, X.Y.; Dai, Y.; Huang, B.B. Fabrication of BiVO4 Photoanode Consisted of Mesoporous Nanoparticles with Improved Bulk Charge Separation Efficiency. Appl. Catal. B Environ. 2018, 238, 586–591. [Google Scholar] [CrossRef]
  28. Hirota, K.; Komatsu, G.; Yamashita, M.; Takemura, H.; Yamaquchi, O. Formation, Characterization and singtering of Alkoxy-derived Bismuth Vanadate. Mat. Res. Bull. 1992, 27, 823–830. [Google Scholar] [CrossRef]
  29. Rettie, A.J.E.; Lee, H.C.; Marshall, L.G.; Lin, J.-F.; Capan, C.; Lindemuth, J.; McCloy, J.S.; Zhou, J.S.; Bard, A.J.; Buddie Mullins, C. Combined Charge Carrier Transport and Photoelectrochemical Characterization of BiVO4 Single Crystals: Intrinsic Behavior of a Complex Metal Oxide. J. Am. Chem. Soc. 2013, 135, 11389–11396. [Google Scholar] [CrossRef] [PubMed]
  30. Jang, M.S.; Park, H.L.; Kim, J.N.; Ro, J.H.; Park, Y.H. Raman Spectrum in Monoclinic BiVO4. Jpn. J. Appl. Phys. 1985, 24, 506–507. [Google Scholar] [CrossRef]
  31. Frost, R.L.; Henry, D.A.; Weier, M.L.; Martens, W. Raman spectroscopy of three polymorphs of BiVO4: Clinobisvanite, dreyerite and pucherite, with comparisons to (VO4)3-bearing minerals: Namibite, pottsite and schumacherite. J. Raman Spectrosc. 2006, 37, 722–732. [Google Scholar] [CrossRef] [Green Version]
  32. Du, J.Y.; Zhong, X.H.; He, H.C.; Huang, J.; Yang, M.J.; Ke, G.L.; Wang, J.; Zhou, Y.; Dong, F.Q.; Ren, Q.; et al. Enhanced Photoelectrochemical Water Oxidation Performance on BiVO4 by Coupling of CoMoO4 as a Hole-Transfer and Conversion Cocatalyst. ACS Appl. Mater. Interfaces 2018, 10, 42207–42216. [Google Scholar] [CrossRef] [PubMed]
  33. Li, T.F.; He, J.F.; Pena, B.; Berlinguette, C.P. Curing BiVO4 Photoanodes with Ultraviolet Light Enhances Photoelectrocatalysis. Angew. Chem. Int. Ed. 2016, 55, 1769–1772. [Google Scholar] [CrossRef] [PubMed]
  34. Trześniewski, B.J.; Digdaya, I.A.; Nagaki, T.; Ravishankar, S.; Herraiz-Cardona, I.; Vermaas, D.A.; Longo, A.; Gimenez, S.; Smith, W.A. Near-complete suppression of surface losses and total internal quantum efficiency in BiVO4 photoanodes. Energy Environ. Sci. 2017, 10, 1517–1529. [Google Scholar] [CrossRef] [Green Version]
Figure 1. (A,B) show SEM images of the BVO (C) and Mo-BVO (C) ceramics fabricated by the BiVO4 precursor powders. (C,D) show cross-sectional images of the as-prepared BVO (C) and Mo-BVO (C).
Nanomaterials 11 02404 g001
Figure 2. (A) UV-vis DRS of BVO and Mo-BVO. (B) UV-vis DRS of BVO (C) and Mo-BVO(C). The inset shows the digital photos of BVO, Mo-BVO, BVO(C), and Mo-BVO(C).
Nanomaterials 11 02404 g002
Figure 3. (A) Photocurrent density vs. applied potential (J−V) curves measured for the Mo-BVO and Mo-BVO (C) photoanodes, with a scan rate of 20 mV/s under AM 1.5 G illumination in 0.1 M KPi buffer solution. (B) The bulk charge separation efficiencies ( η b ) and (C) interfacial charge separation efficiencies ( η i ) of Mo-BVO and Mo-BVO (C) as a function of applied bias, respectively. (D) Photocurrent vs. time (J−T) measurements performed for the Mo-BVO and Mo-BVO (C) photoanodes with chopped light (AM 1.5 G) at 1.23 V (vs. RHE) in a phosphate buffer (pH = 7) solution. (E) J−T curves of the Mo-BVO and the Mo-BVO (C) measured at 1.23V (vs. RHE) for 10 h in a KPi solution (PH = 7).
Nanomaterials 11 02404 g003
Figure 4. (A) XRD data of Mo-BVO and Mo-BVO (C) before and after PEC for 4 h and 10 h in a KPi solution, respectively. (B) Raman spectrum of Mo-BVO and Mo-BVO (C) before and after PEC for 4 h and 10 h, respectively.
Nanomaterials 11 02404 g004
Figure 5. Morphology of Mo-BVO and Mo-BVO (C) before and after 4h and 10 h J-T measurements, respectively. (A) Before Mo-BVO. (B) After Mo-BVO. (C) Before Mo-BVO (C). (D) After Mo-BVO (C).
Nanomaterials 11 02404 g005
Publisher’s Note: MDPI stays neutral with regard to jurisdictional claims in published maps and institutional affiliations.

