
An Electrochemical Sensor Based on Amino Magnetic Nanoparticle-Decorated Graphene for Detection of Cannabidiol


Abstract
:1. Introduction
2. Materials and Methods
2.1. Reagents and Apparatus
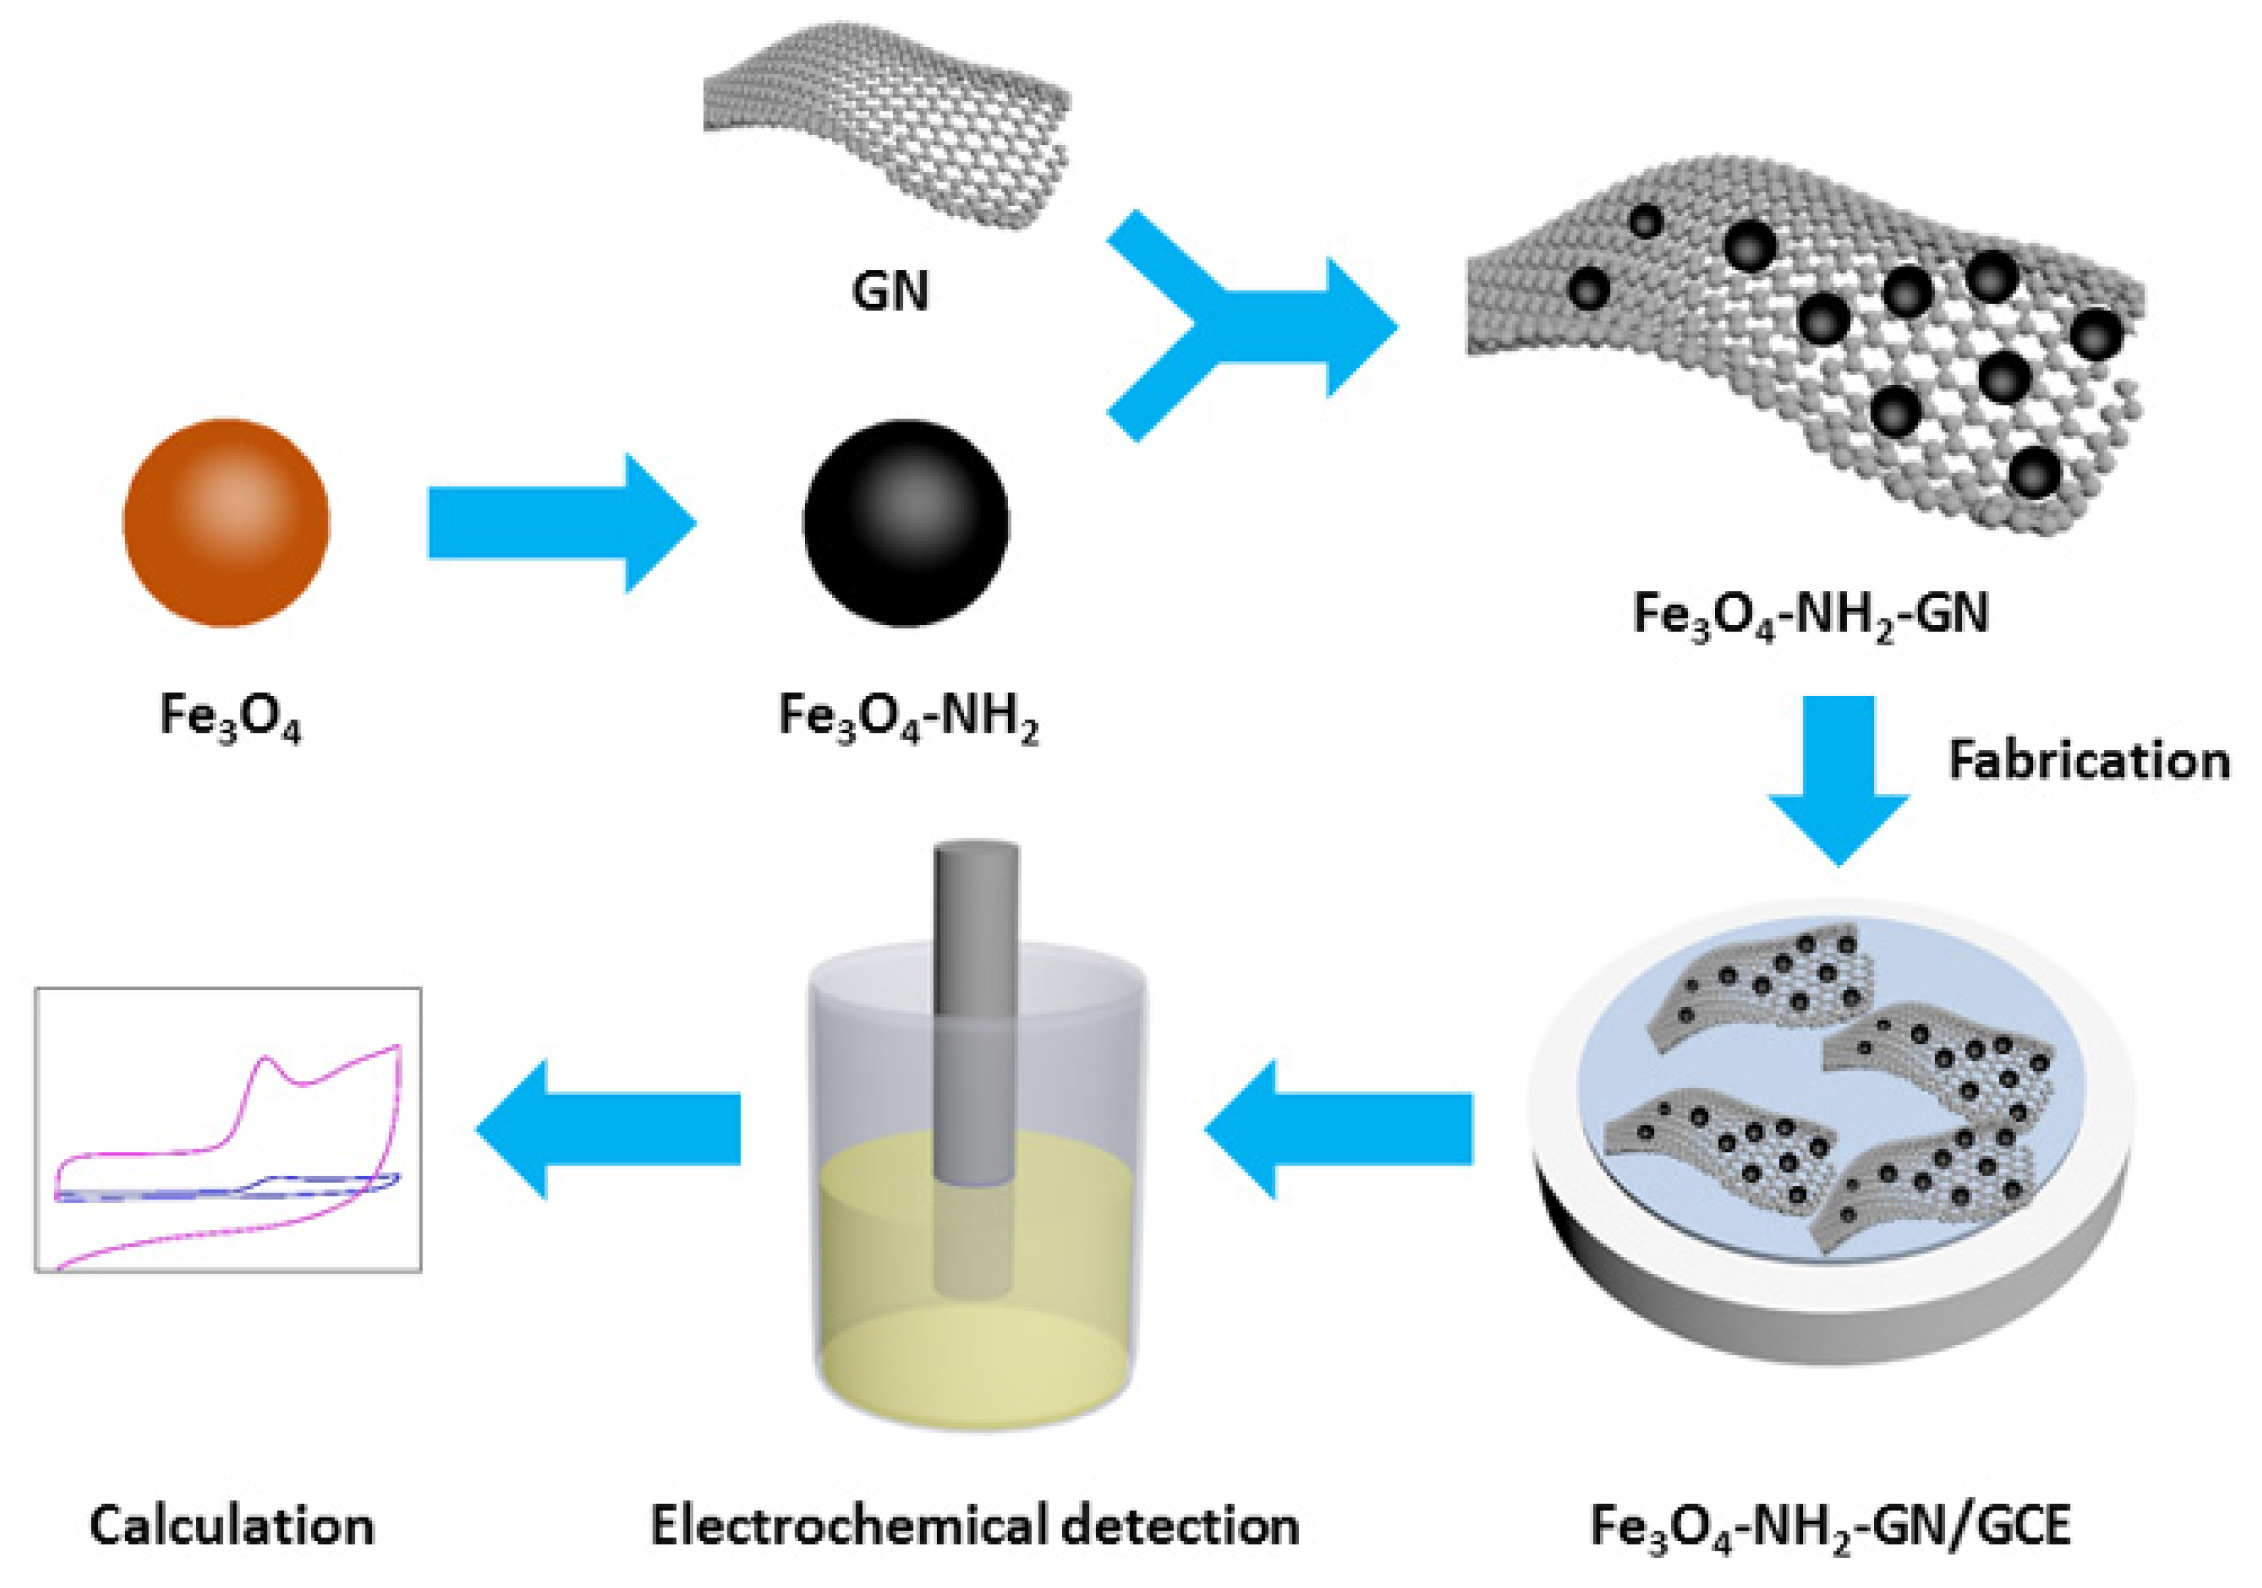
2.2. Preparation of Fe3O4-NH2 Nanoparticles
2.3. Fabrication of the Fe3O4-NH2-GN/GCE
2.4. Preparation of Real Sample
2.5. Determination of CBD by HPLC
2.6. Electrochemical Measurements
3. Results and Discussion
3.1. Characterizations of Nanomaterials
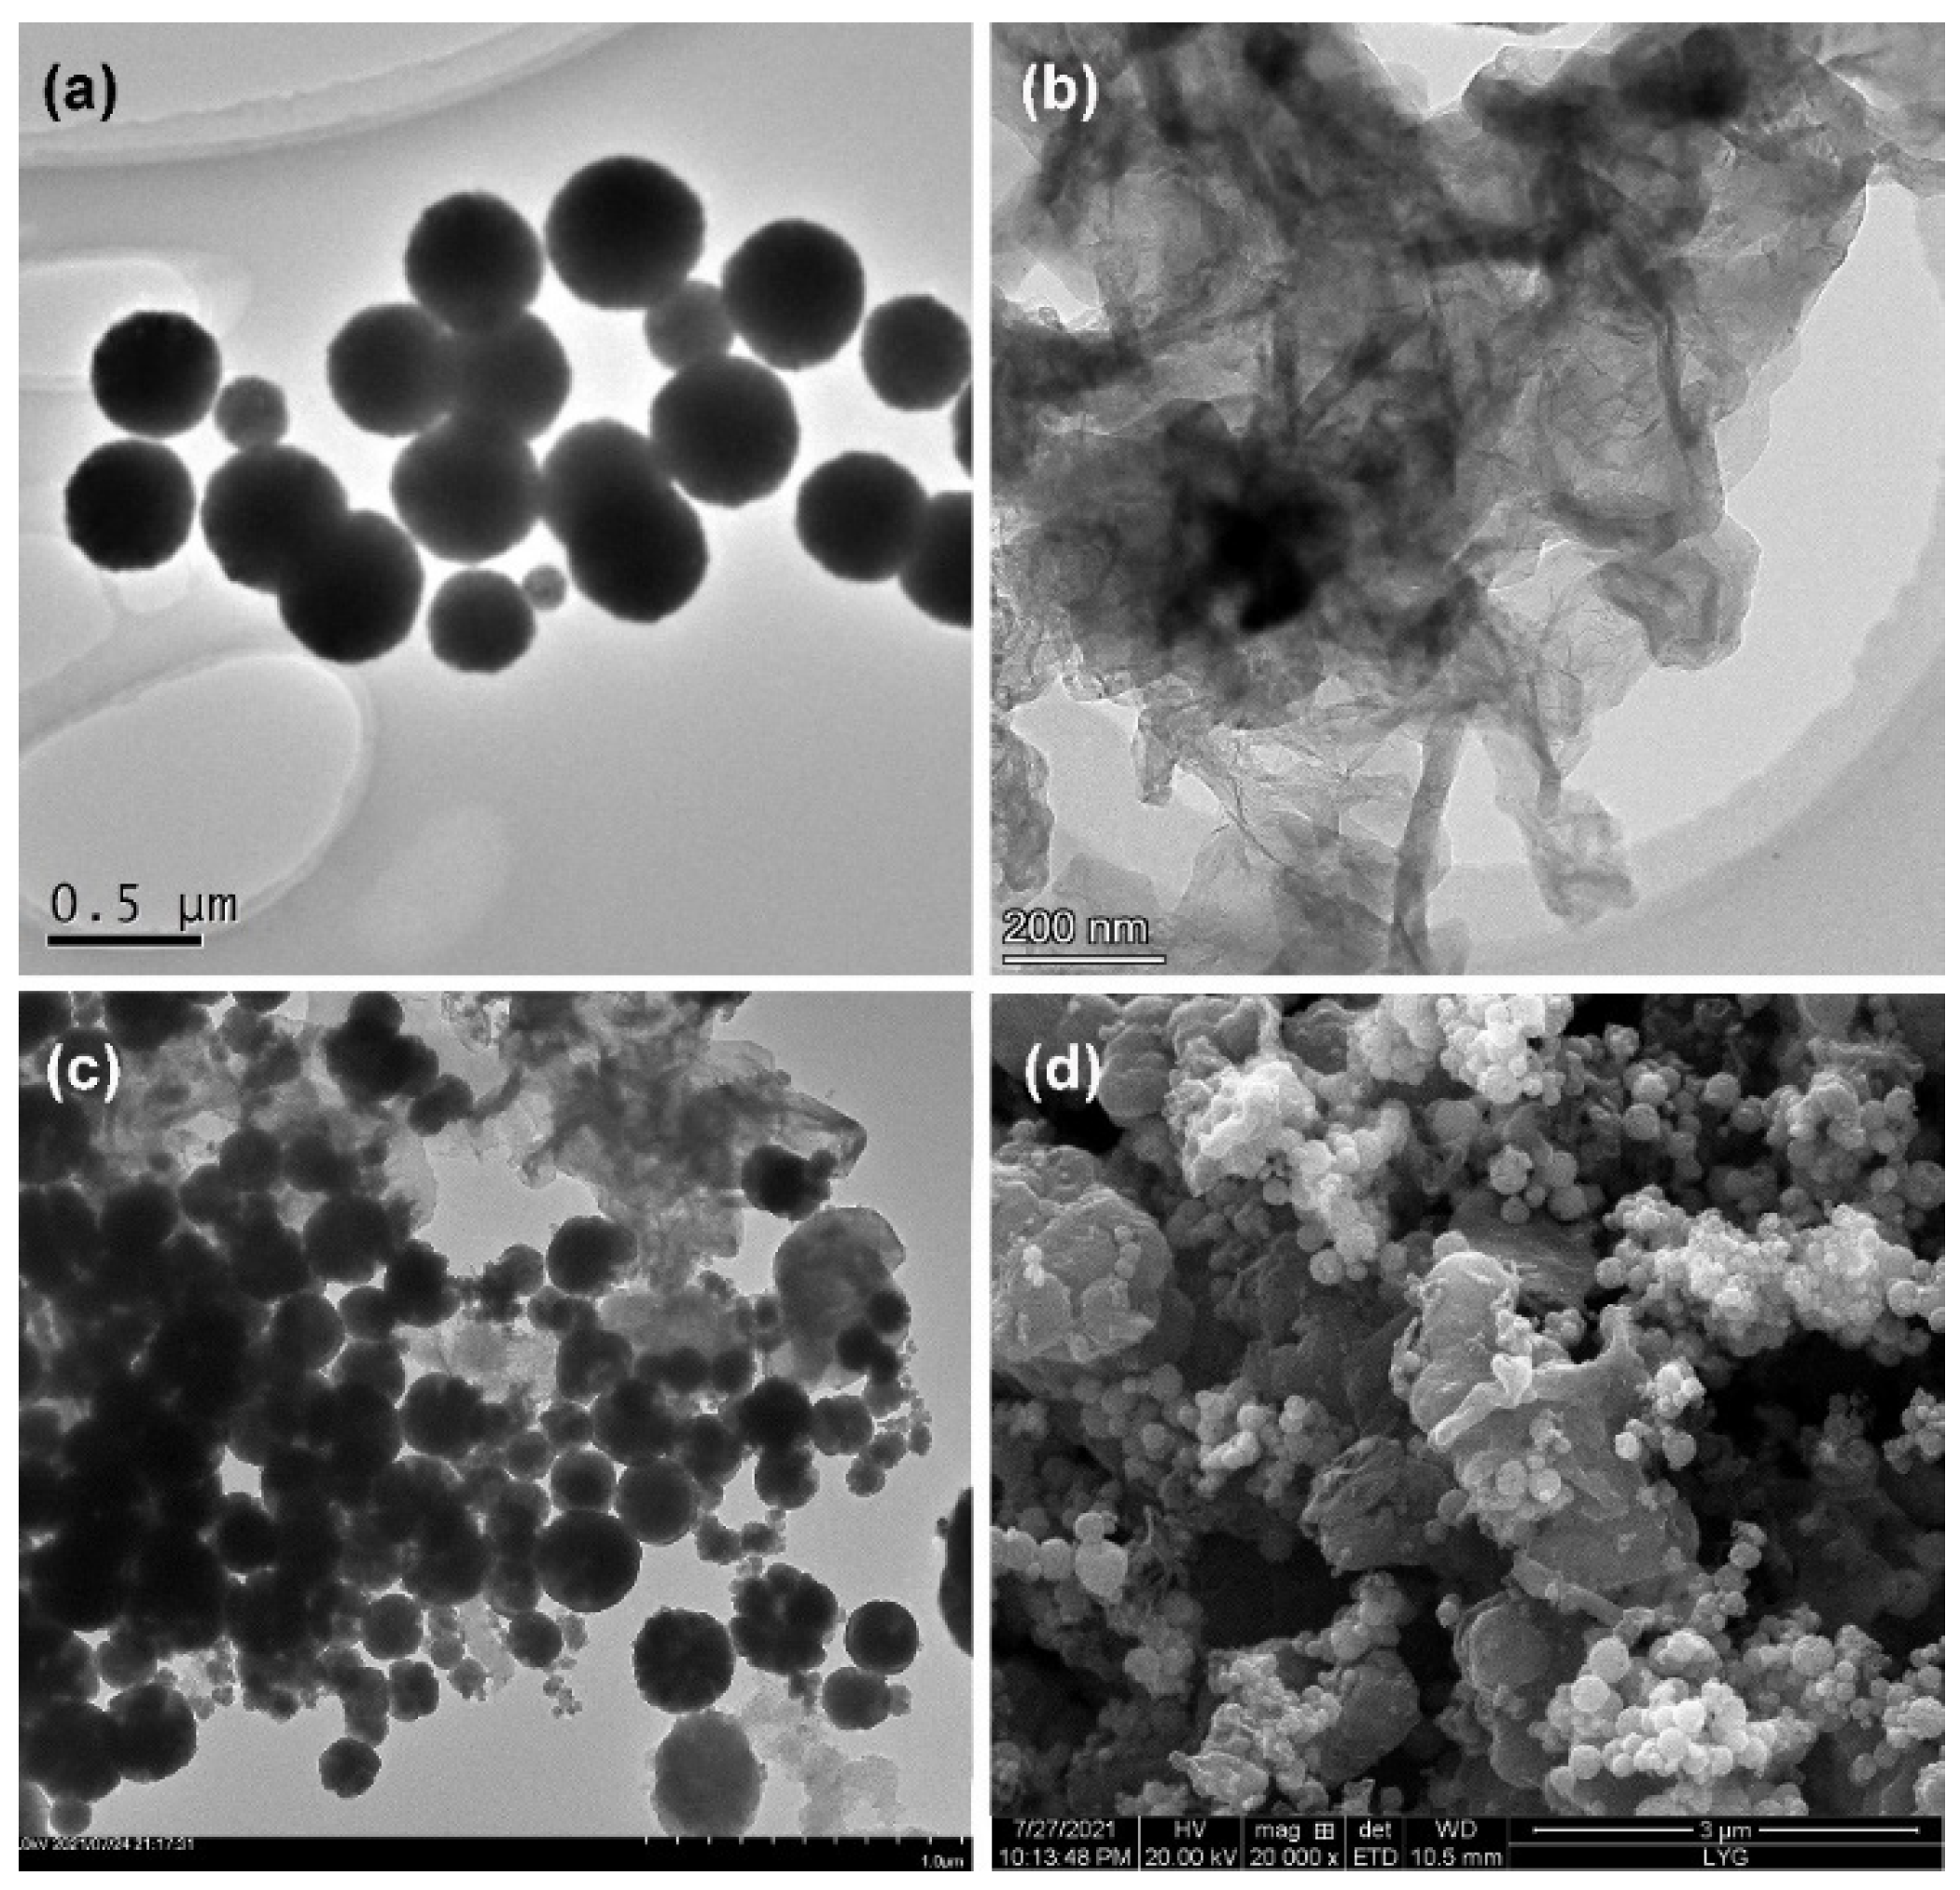
3.1.1. TEM and SEM
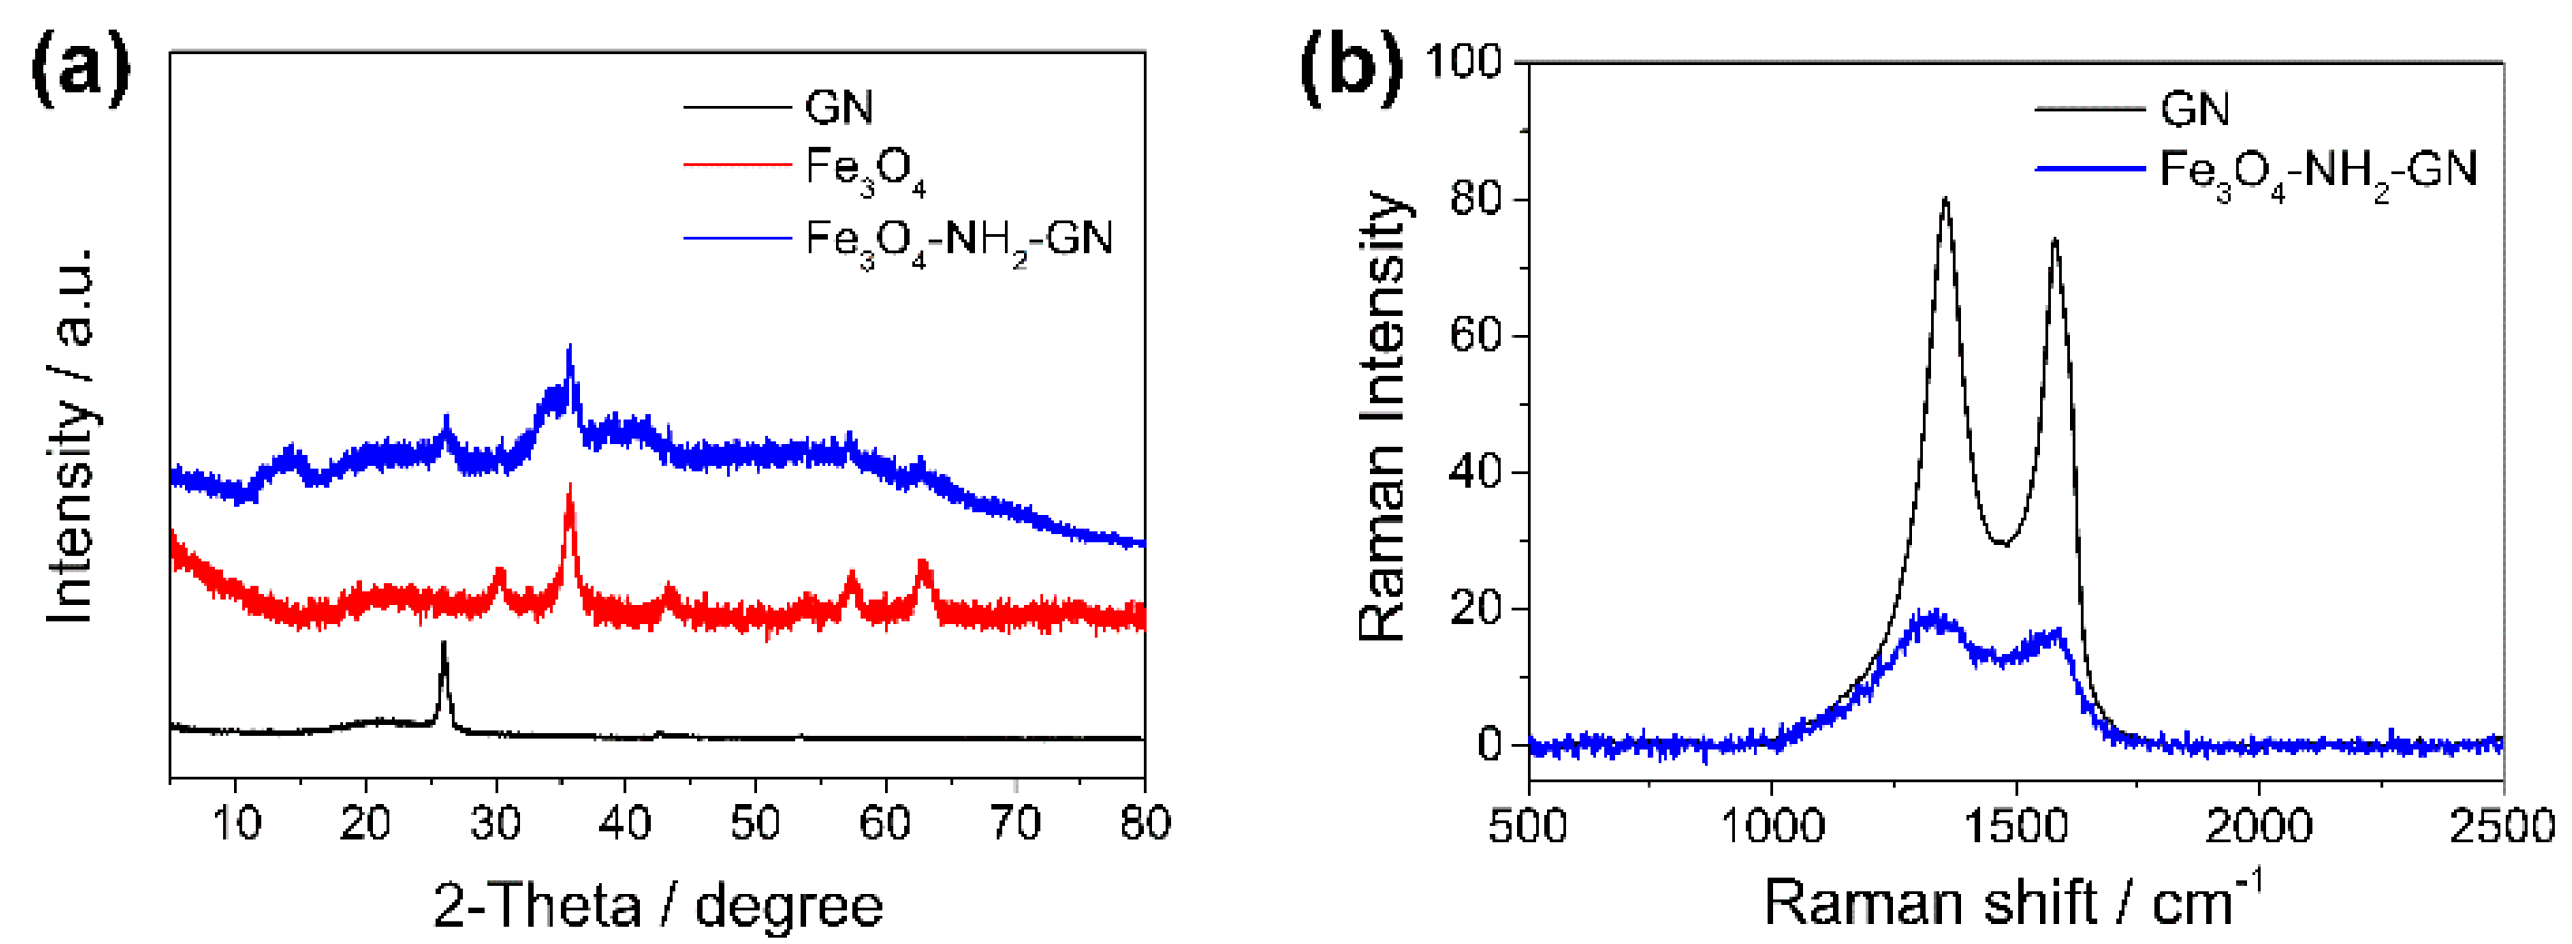
3.1.2. XRD
3.1.3. Raman
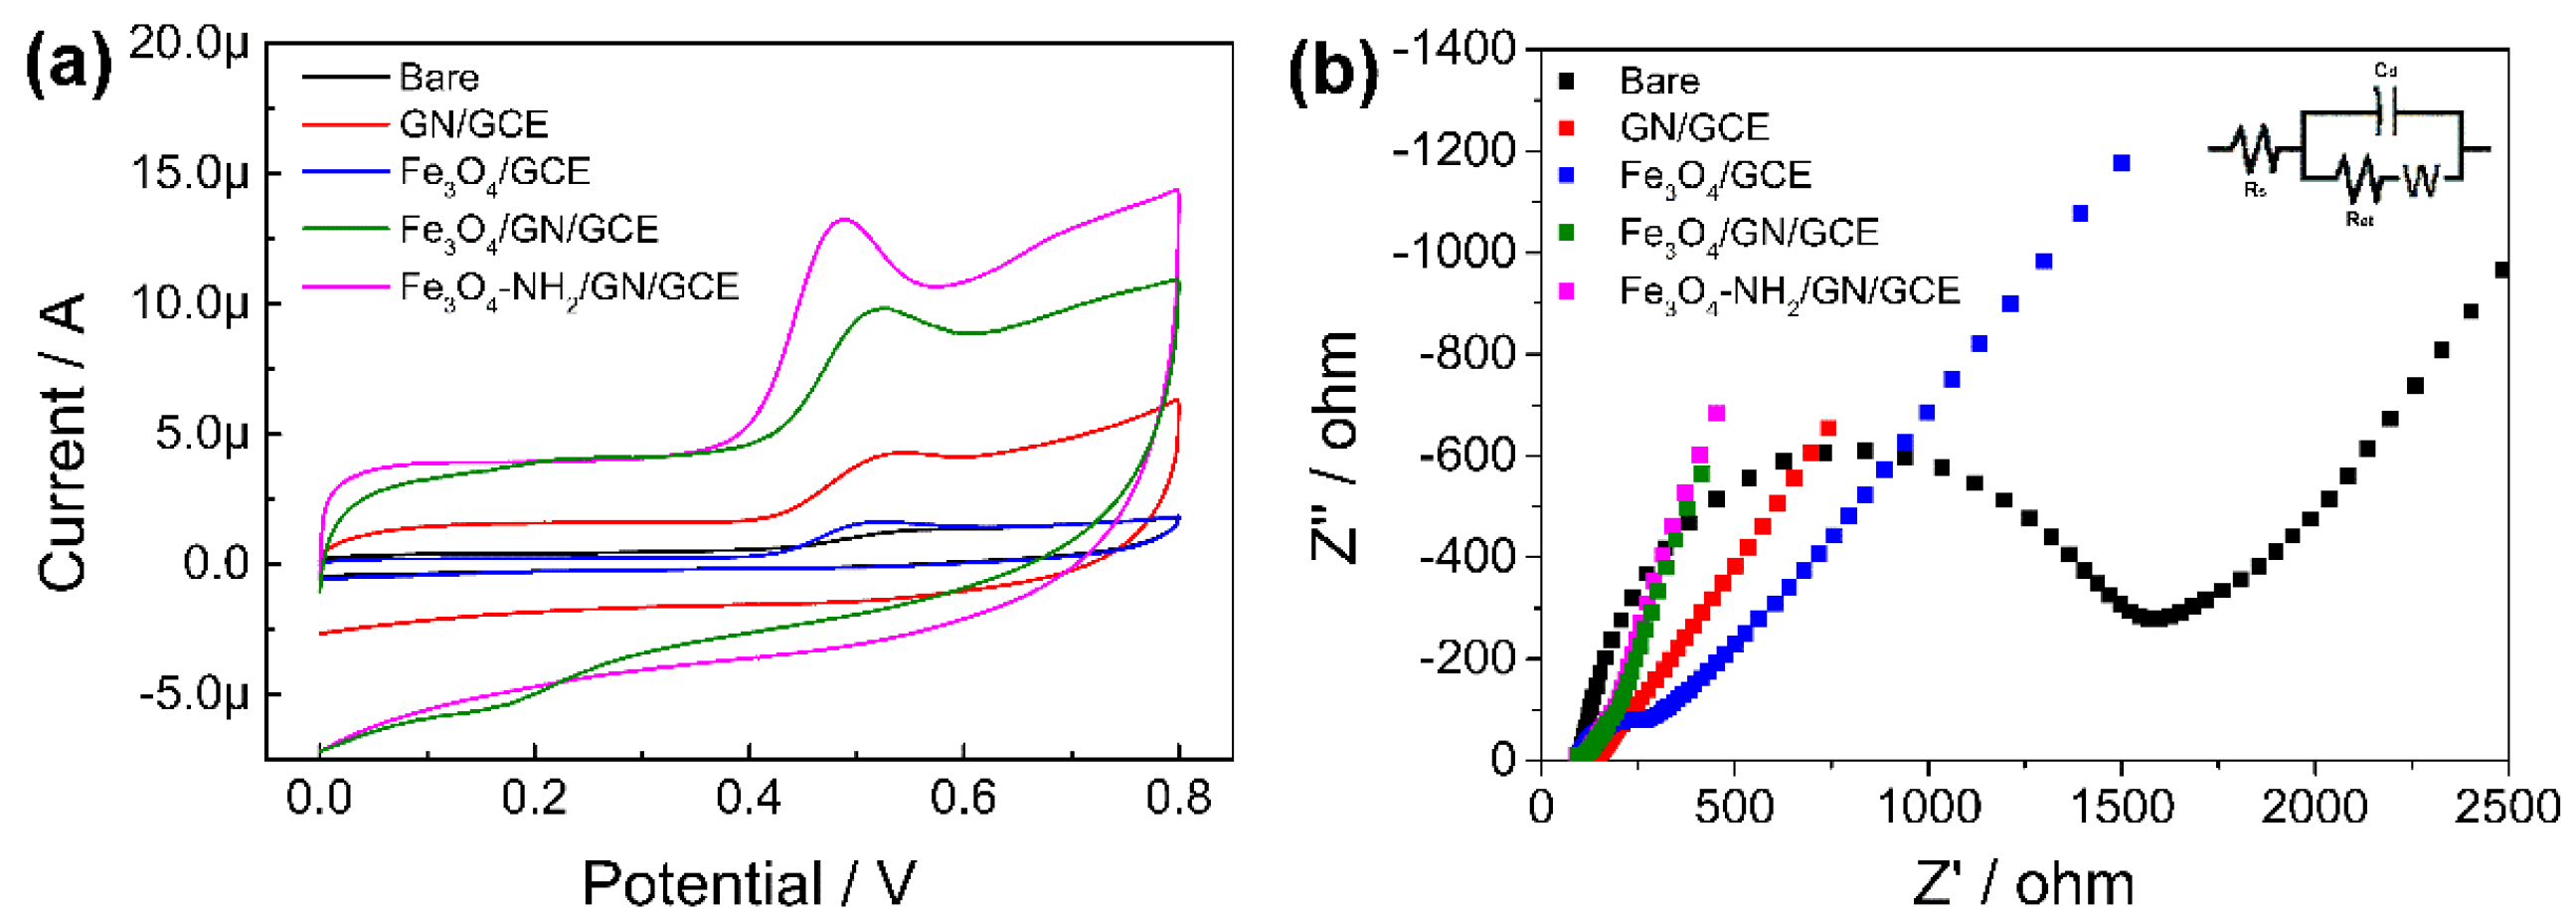
3.2. Electrochemical Characteristics
3.3. Optimization of Electrochemical Conditions
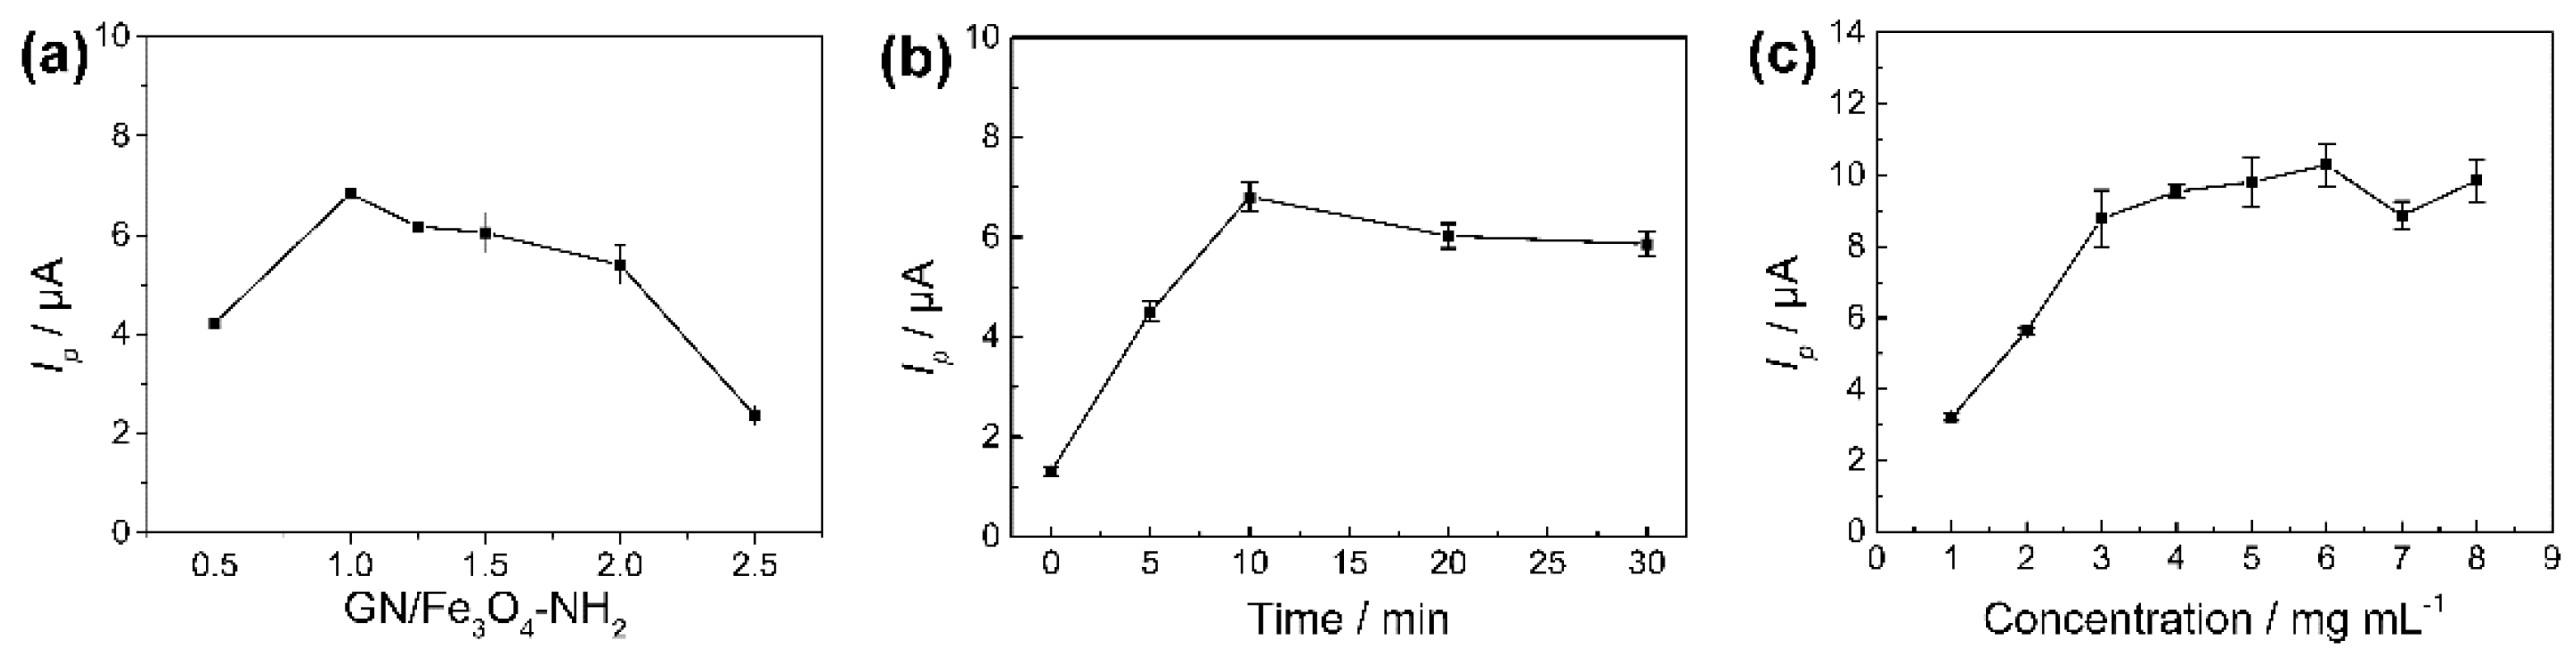
3.3.1. Effect of Composition of Fe3O4-NH2-GN
3.3.2. Effect of Ultrasonication Time of Fe3O4-NH2-GN
3.3.3. Effect of Concentration of Fe3O4-NH2-GN
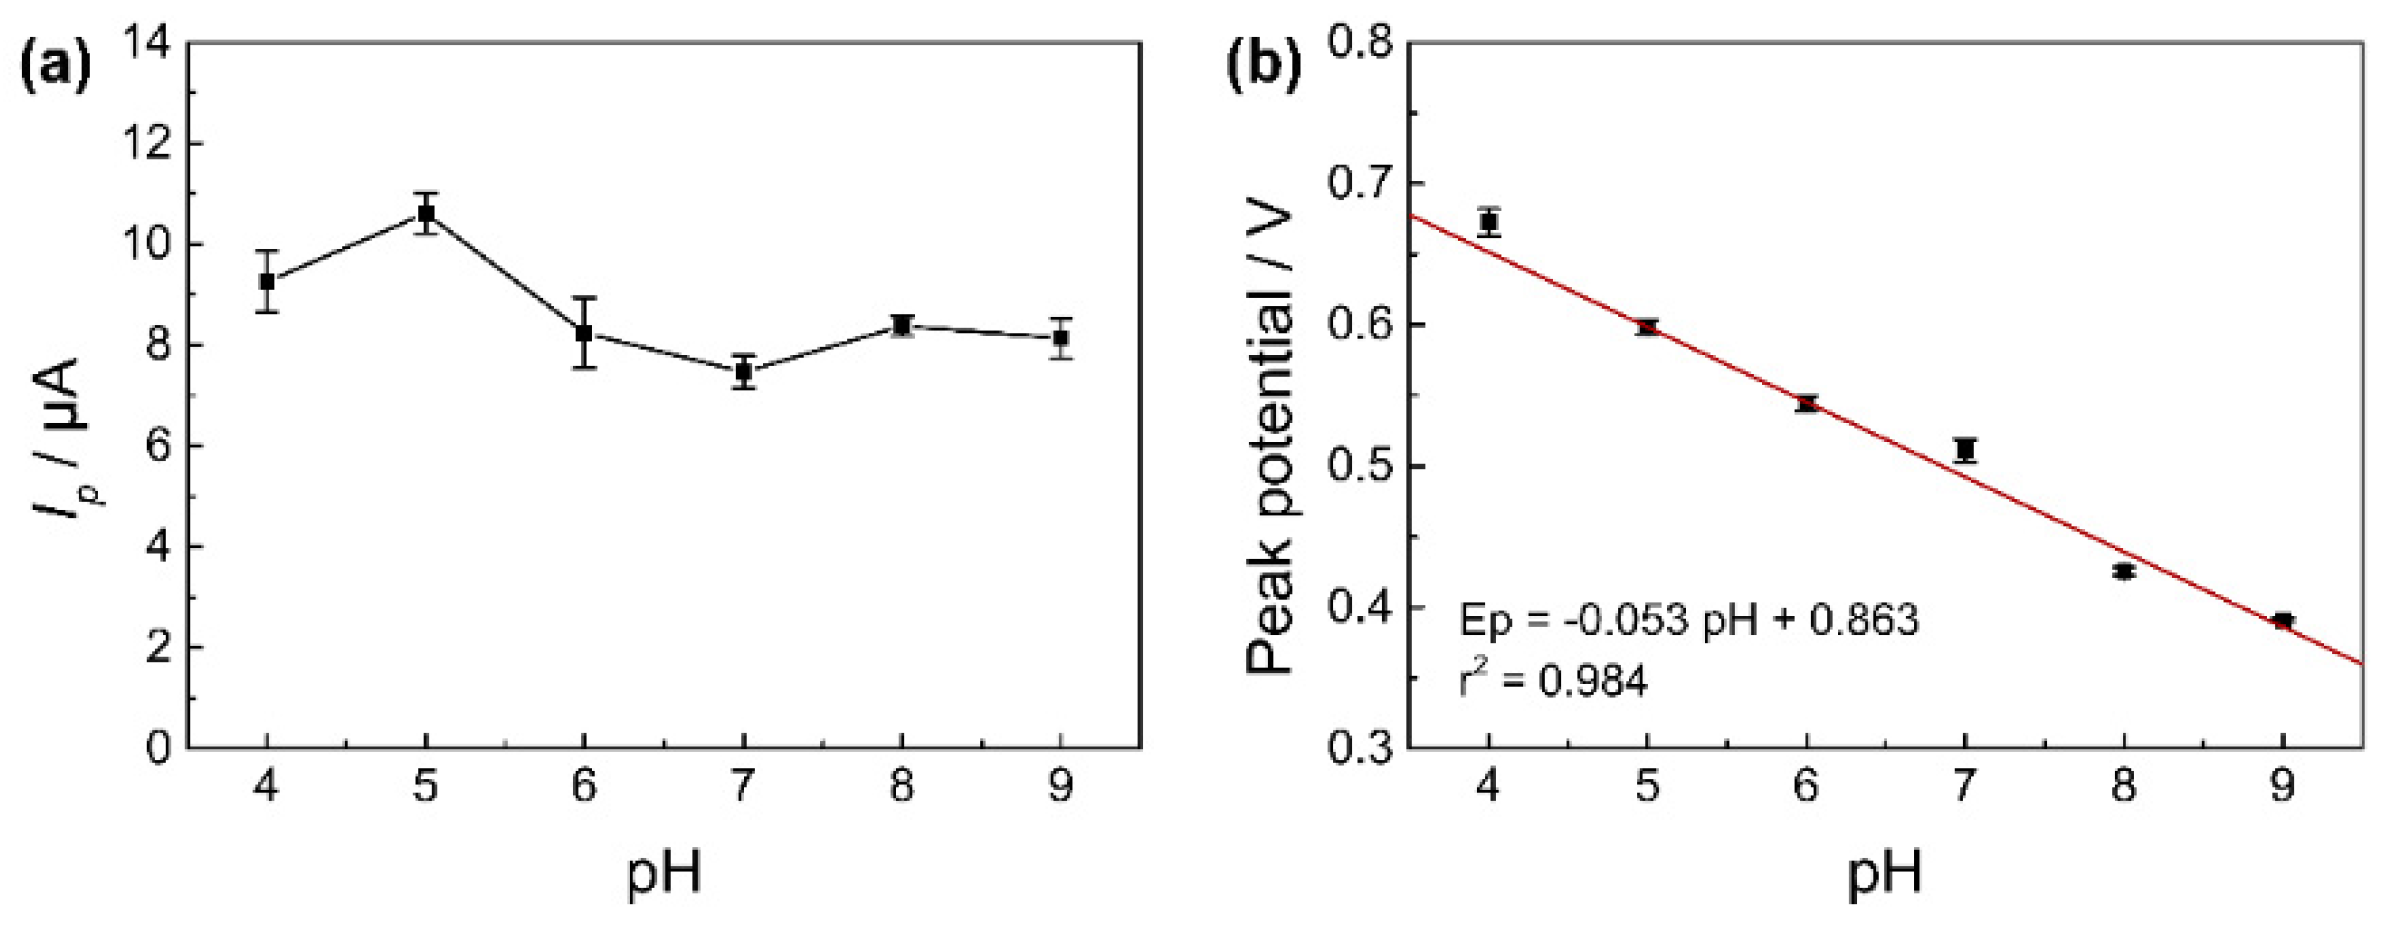
3.3.4. Effect of pH
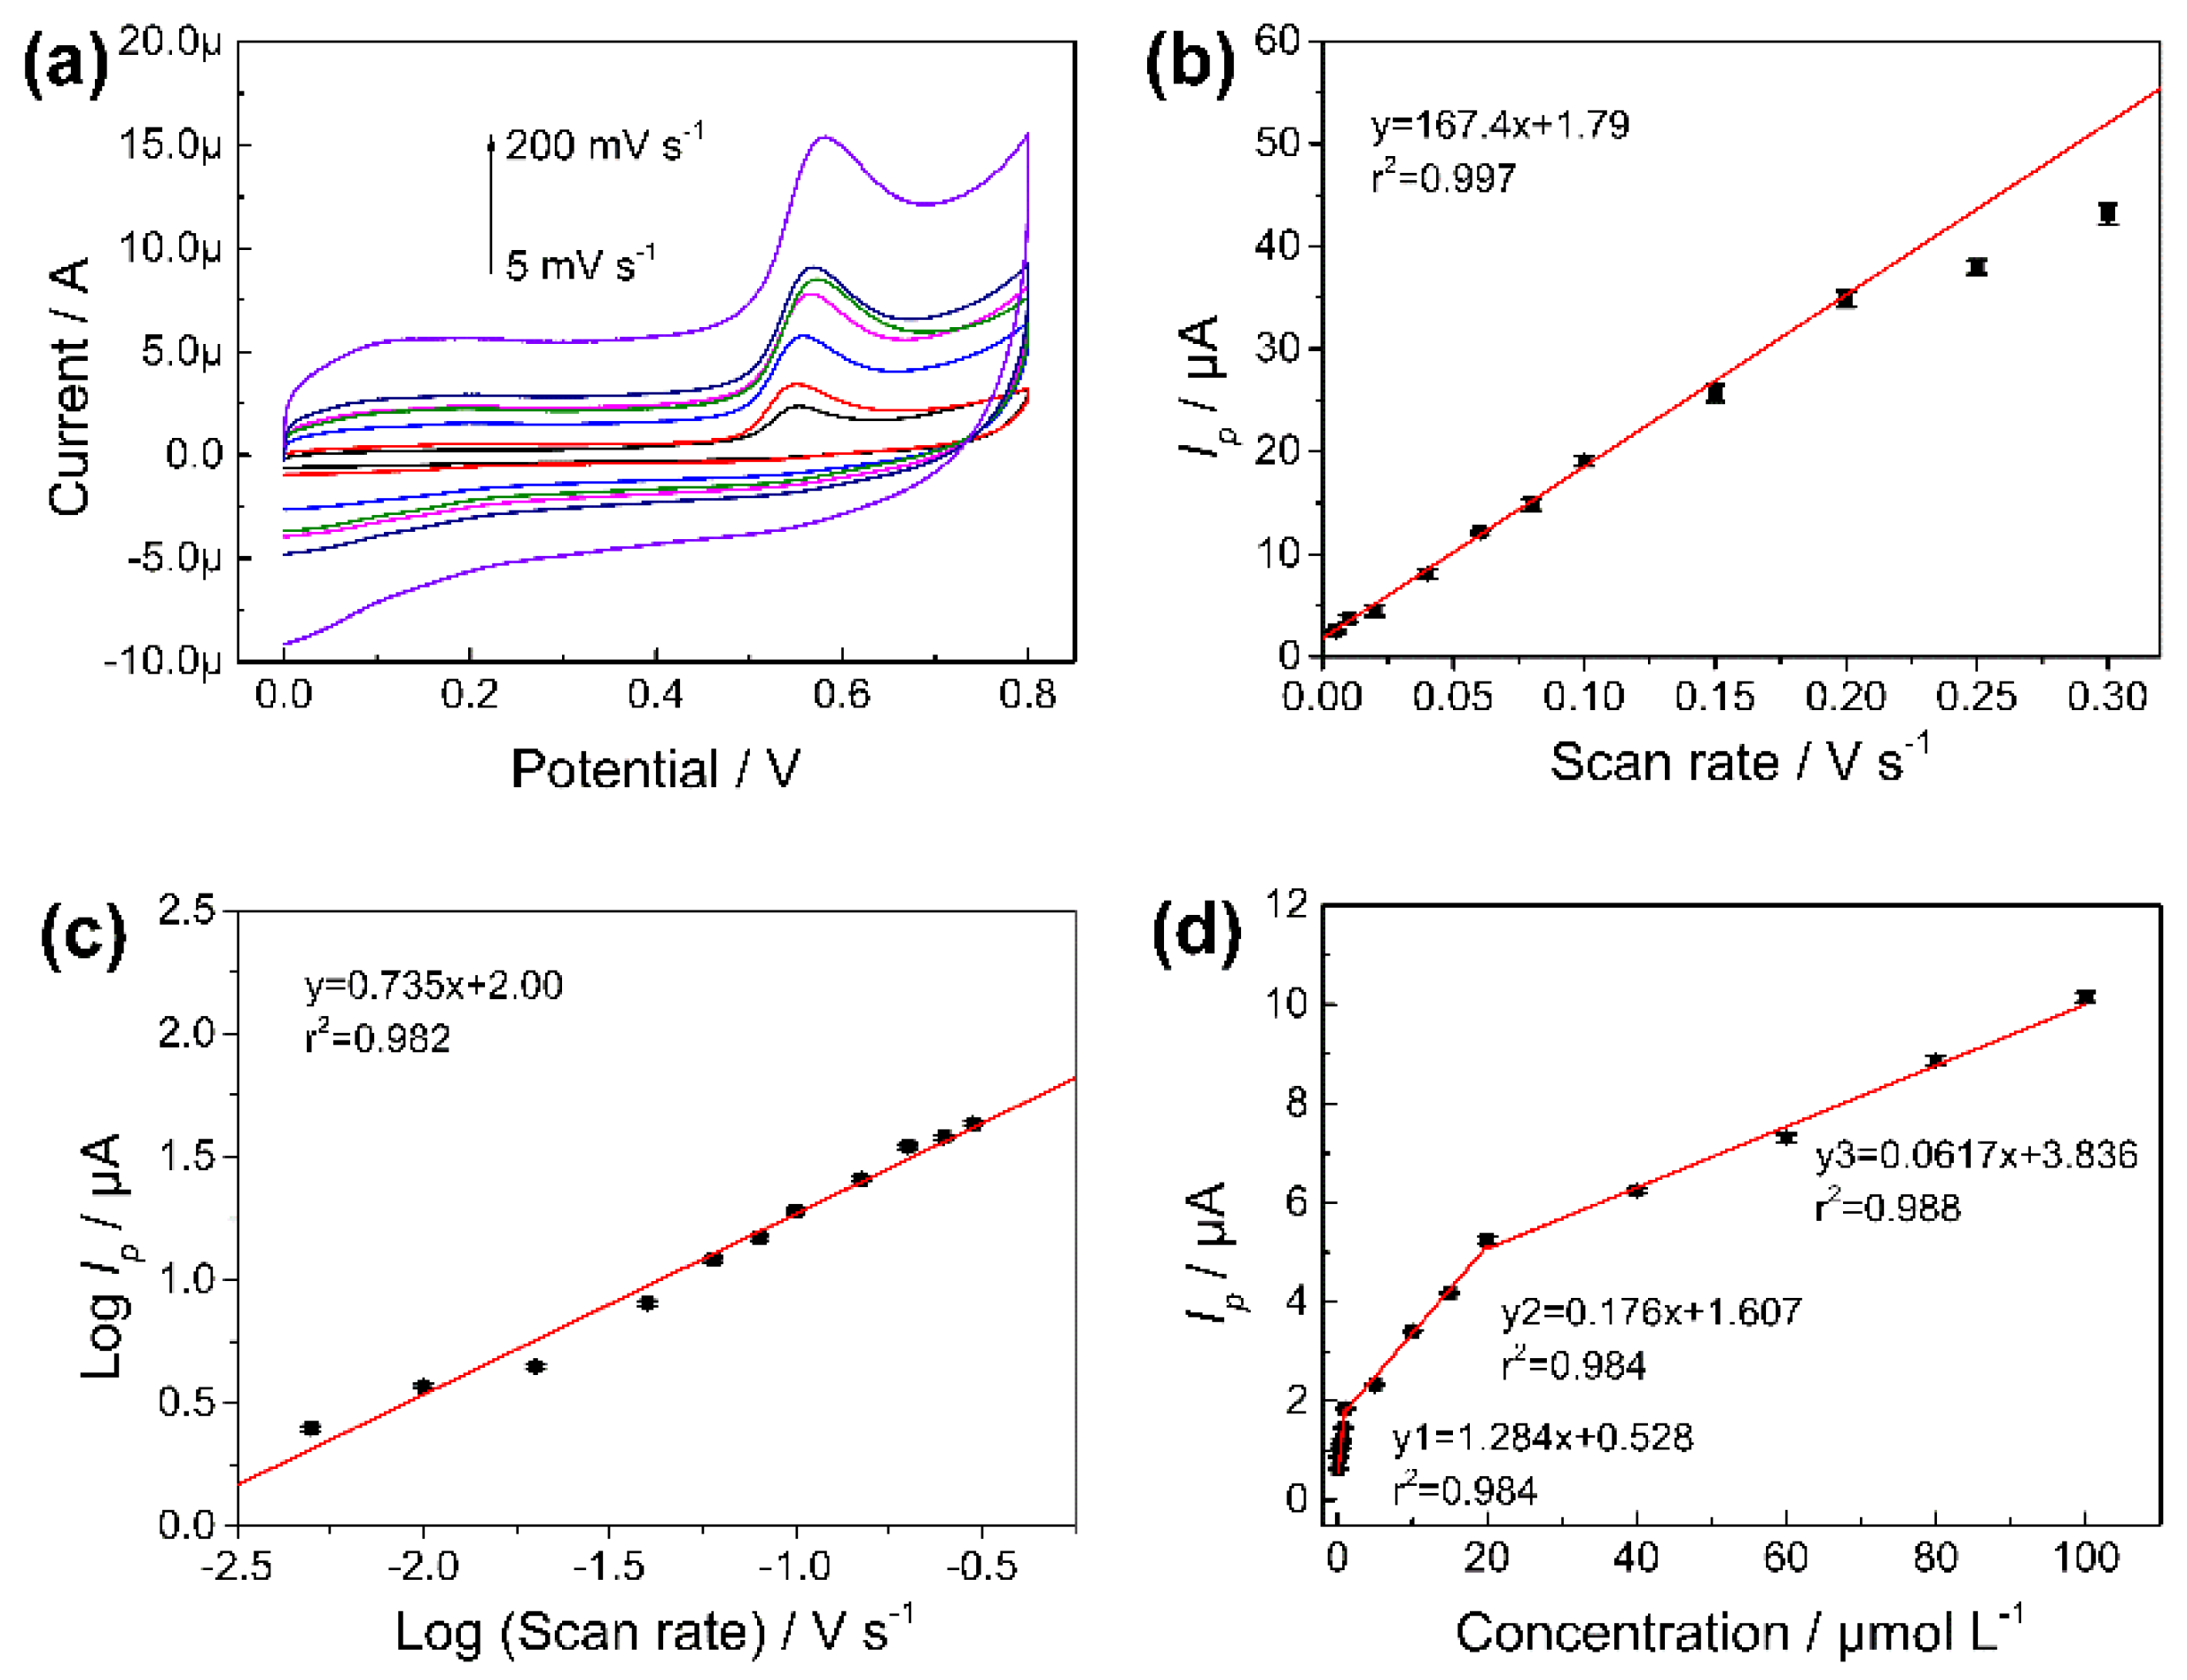
3.4. The Influence of the Scan Rate
3.5. Quantitative Analysis of CBD
3.6. Practicability of the Fe3O4-NH2-GN/GCE
4. Conclusions
Supplementary Materials
Author Contributions
Funding
Institutional Review Board Statement
Informed Consent Statement
Data Availability Statement
Acknowledgments
Conflicts of Interest
References
- Alegre-Zurano, L.; Martín-Sánchez, A.; Valverde, O. Behavioural and molecular effects of cannabidiolic acid in mice. Life Sci. 2020, 259, 118271. [Google Scholar] [CrossRef] [PubMed]
- Bonini, S.A.; Premoli, M.; Tambaro, S.; Kumar, A.; Maccarinelli, G.; Memo, M.; Mastinu, A. Cannabis sativa: A comprehensive ethnopharmacological review of a medicinal plant with a long history. J. Ethnopharmacol. 2018, 227, 300–315. [Google Scholar] [CrossRef]
- Shannon, S.; Lewis, N.; Lee, H.; Hughes, S. Cannabidiol in Anxiety and Sleep: A Large Case Series. Perm. J. 2019, 23, 18–41. [Google Scholar] [CrossRef] [PubMed] [Green Version]
- Di Marco Pisciottano, I.; Guadagnuolo, G.; Soprano, V.; De Crescenzo, M.; Gallo, P. A rapid method to determine nine natural cannabinoids in beverages and food derived from Cannabis sativa by liquid chromatography coupled to tandem mass spectrometry on a QTRAP 4000. Rapid Commun. Mass Spectrom. 2018, 32, 1728–1736. [Google Scholar] [CrossRef] [PubMed]
- Crescente, G.; Piccolella, S.; Esposito, A.; Scognamiglio, M.; Fiorentino, A.; Pacifico, S. Chemical composition and nutraceutical properties of hempseed: An ancient food with actual functional value. Phytochem. Rev. 2018, 17, 733–749. [Google Scholar] [CrossRef]
- McRae, G.; Melanson, J.E. Quantitative determination and validation of 17 cannabinoids in cannabis and hemp using liquid chromatography-tandem mass spectrometry. Anal. Bioanal. Chem. 2020, 412, 7381–7393. [Google Scholar] [CrossRef]
- Nemeškalová, A.; Hájková, K.; Mikulů, L.; Sýkora, D.; Kuchař, M. Combination of UV and MS/MS detection for the LC analysis of cannabidiol-rich products. Talanta 2020, 219, 121250. [Google Scholar] [CrossRef]
- Shokoohi Rad, S.; Dalali, N.; Baheri, T. Combination of magnetic solid-phase extraction with dispersive liquid–liquid microextraction followed by GC-MS for trace analysis of synthetic cannabinoids in plasma samples. Micro Nano Lett. 2020, 15, 545–549. [Google Scholar] [CrossRef]
- Wanklyn, C.; Burton, D.; Enston, E.; Bartlett, C.-A.; Taylor, S.; Raniczkowska, A.; Black, M.; Murphy, L. Disposable screen printed sensor for the electrochemical detection of delta-9-tetrahydrocannabinol in undiluted saliva. Chem. Cent. J. 2016, 10, 1. [Google Scholar] [CrossRef] [Green Version]
- How, Z.T.; El-Din, M.G. A critical review on the detection, occurrence, fate, toxicity, and removal of cannabinoids in the water system and the environment. Environ. Pollut. 2021, 268. [Google Scholar] [CrossRef]
- Wei, K.; Sun, J.; Gao, Q.; Yang, X.; Ye, Y.; Ji, J.; Sun, X. 3D “honeycomb” cell/carbon nanofiber/gelatin methacryloyl (GelMA) modified screen-printed electrode for electrochemical assessment of the combined toxicity of deoxynivalenol family mycotoxins. Bioelectrochemistry 2021, 139, 107743. [Google Scholar] [CrossRef]
- Raghavan, V.S.; O’Driscoll, B.; Bloor, J.M.; Li, B.; Katare, P.; Sethi, J.; Gorthi, S.S.; Jenkins, D. Emerging graphene-based sensors for the detection of food adulterants and toxicants—A review. Food Chem. 2021, 355, 129547. [Google Scholar] [CrossRef]
- Maphiri, V.M.; Rutavi, G.; Sylla, N.F.; Adewinbi, S.A.; Fasakin, O.; Manyala, N. Novel Thermally Reduced Graphene Oxide Microsupercapacitor Fabricated via Mask—Free AxiDraw Direct Writing. Nanomaterials 2021, 11, 1909. [Google Scholar] [CrossRef]
- Chen, S.-Y.; Chung, S.-H. Advanced Current Collectors with Carbon Nanofoams for Electrochemically Stable Lithium—Sulfur Cells. Nanomaterials 2021, 11, 2083. [Google Scholar] [CrossRef]
- Bukkitgar, S.D.; Shetti, N.P.; Aminabhavi, T.M. Electrochemical investigations for COVID-19 detection-A comparison with other viral detection methods. Chem. Eng. J. 2021, 420, 127575. [Google Scholar] [CrossRef]
- Sundaresan, R.; Mariyappan, V.; Chen, S.-M.; Keerthi, M.; Ramachandran, R. Electrochemical sensor for detection of tryptophan in the milk sample based on MnWO4 nanoplates encapsulated RGO nanocomposite. Colloids Surf. A 2021, 625, 126889. [Google Scholar] [CrossRef]
- Nasrollahpour, H.; Isildak, I.; Rashidi, M.-R.; Hashemi, E.A.; Naseri, A.; Khalilzadeh, B. Ultrasensitive bioassaying of HER-2 protein for diagnosis of breast cancer using reduced graphene oxide/chitosan as nanobiocompatible platform. Cancer Nanotechnol. 2021, 12, 10. [Google Scholar] [CrossRef]
- You, Z.; Fu, Y.; Xiao, A.; Liu, L.; Huang, S. Magnetic molecularly imprinting polymers and reduced graphene oxide modified electrochemical sensor for the selective and sensitive determination of luteolin in natural extract. Arab. J. Chem. 2021, 14, 102990. [Google Scholar] [CrossRef]
- Carneiro, P.; Morais, S.; Pereira, M.C. Nanomaterials towards Biosensing of Alzheimer’s Disease Biomarkers. Nanomaterials 2019, 9, 1663. [Google Scholar] [CrossRef] [PubMed] [Green Version]
- Li, J.; Li, Y.; Zhai, X.; Cao, Y.; Zhao, J.; Tang, Y.; Han, K. Sensitive electrochemical detection of hepatitis C virus subtype based on nucleotides assisted magnetic reduced graphene oxide-copper nano-composite. Electrochem. Commun. 2020, 110, 106601. [Google Scholar] [CrossRef]
- Chimezie, A.B.; Hajian, R.; Yusof, N.A.; Woi, P.M.; Shams, N. Fabrication of reduced graphene oxide-magnetic nanocomposite (rGO-Fe3O4) as an electrochemical sensor for trace determination of As(III) in water resources. J. Electroanal. Chem. 2017, 796, 33–42. [Google Scholar] [CrossRef]
- Sun, B.; Gou, X.; Bai, R.; Abdelmoaty, A.A.A.; Ma, Y.; Zheng, X.; Hu, F. Direct electrochemistry and electrocatalysis of lobetyolin via magnetic functionalized reduced graphene oxide film fabricated electrochemical sensor. Mater. Sci. Eng. C 2017, 74, 515–524. [Google Scholar] [CrossRef] [PubMed]
- Pakapongpan, S.; Poo-arporn, R.P. Self-assembly of glucose oxidase on reduced graphene oxide-magnetic nanoparticles nanocomposite-based direct electrochemistry for reagentless glucose biosensor. Mater. Sci. Eng. C 2017, 76, 398–405. [Google Scholar] [CrossRef]
- Sharafeldin, M.; Bishop, G.W.; Bhakta, S.; El-Sawy, A.; Suib, S.L.; Rusling, J.F. Fe3O4 nanoparticles on graphene oxide sheets for isolation and ultrasensitive amperometric detection of cancer biomarker proteins. Biosens. Bioelectron. 2017, 91, 359–366. [Google Scholar] [CrossRef] [PubMed] [Green Version]
- Mathew, G.; Dey, P.; Das, R.; Chowdhury, S.D.; Paul Das, M.; Veluswamy, P.; Neppolian, B.; Das, J. Direct electrochemical reduction of hematite decorated graphene oxide (α-Fe2O3@erGO) nanocomposite for selective detection of Parkinson’s disease biomarker. Biosens. Bioelectron. 2018, 115, 53–60. [Google Scholar] [CrossRef]
- Liu, Y.; Huang, Y.; Xiao, A.; Qiu, H.; Liu, L. Preparation of Magnetic Fe3O4/MIL-88A Nanocomposite and Its Adsorption Properties for Bromophenol Blue Dye in Aqueous Solution. Nanomaterials 2019, 9, 51. [Google Scholar] [CrossRef] [Green Version]
- Chen, J.; Leng, J.; Yang, X.A.; Liao, L.P.; Liu, L.L.; Xiao, A.P. Enhanced Performance of Magnetic Graphene Oxide-Immobilized Laccase and Its Application for the Decolorization of Dyes. Molecules 2017, 22, 221. [Google Scholar] [CrossRef] [Green Version]
- Poo-arporn, Y.; Pakapongpan, S.; Chanlek, N.; Poo-arporn, R.P. The development of disposable electrochemical sensor based on Fe3O4-doped reduced graphene oxide modified magnetic screen-printed electrode for ractopamine determination in pork sample. Sens. Actuators B 2019, 284, 164–171. [Google Scholar] [CrossRef]
- Cen, Y.; Xiao, A.P.; Chen, X.Q.; Liu, L.L. Screening and separation of alpha-amylase inhibitors from Solanum nigrum with amylase-functionalized magnetic graphene oxide combined with high-speed counter-current chromatography. J. Sep. Sci. 2017, 40, 4780–4787. [Google Scholar] [CrossRef]
- Liu, L.L.; Ma, Y.J.; Chen, X.Q.; Xiong, X.; Shi, S.Y. Screening and identification of BSA bound ligands from Puerariae lobata flower by BSA functionalized Fe3O4 magnetic nanoparticles coupled with HPLC-MS/MS. J. Chromatogr. B-Anal. Technol. Biomed. Life Sci. 2012, 887, 55–60. [Google Scholar] [CrossRef]
- Kulkarni, S.B.; Patil, U.M.; Shackery, I.; Sohn, J.S.; Lee, S.; Park, B.; Jun, S. High-performance supercapacitor electrode based on a polyaniline nanofibers/3D graphene framework as an efficient charge transporter. J. Mater. Chem. A 2014, 2, 4989–4998. [Google Scholar] [CrossRef]
- Wang, Q.; Gu, C.; Fu, Y.; Liu, L.; Xie, Y. Ultrasensitive Electrochemical Sensor for Luteolin Based on Zirconium Metal-Organic Framework UiO-66/Reduced Graphene Oxide Composite Modified Glass Carbon Electrode. Molecules 2020, 25, 4557. [Google Scholar] [CrossRef] [PubMed]
- Xu, L.; Li, J.; Zhang, J.; Sun, J.; Gan, T.; Liu, Y. A disposable molecularly imprinted electrochemical sensor for the ultra-trace detection of the organophosphorus insecticide phosalone employing monodisperse Pt-doped UiO-66 for signal amplification. Analyst 2020, 145, 3245–3256. [Google Scholar] [CrossRef]
- López-Iglesias, D.; García-Guzmán, J.J.; Zanardi, C.; Palacios-Santander, J.M.; Cubillana-Aguilera, L.; Pigani, L. Fast electroanalytical determination of Cannabidiol and Cannabinol in aqueous solution using Sonogel-Carbon-PEDOT devices. J. Electroanal. Chem. 2020, 878, 114591. [Google Scholar] [CrossRef]
- Renaud-Young, M.; Mayall, R.M.; Salehi, V.; Goledzinowski, M.; Comeau, F.J.E.; MacCallum, J.L.; Birss, V.I. Development of an ultra-sensitive electrochemical sensor for Δ9-tetrahydrocannabinol (THC) and its metabolites using carbon paper electrodes. Electrochim. Acta 2019, 307, 351–359. [Google Scholar] [CrossRef]
- Teymourian, H.; Salimi, A.; Khezrian, S. Fe3O4 magnetic nanoparticles/reduced graphene oxide nanosheets as a novel electrochemical and bioeletrochemical sensing platform. Biosens. Bioelectron. 2013, 49, 1–8. [Google Scholar] [CrossRef] [PubMed] [Green Version]
- Su, C.-W.; Tian, J.-H.; Ye, J.-J.; Chang, H.-W.; Tsai, Y.-C. Construction of a Label-Free Electrochemical Immunosensor Based on Zn-Co-S/Graphene Nanocomposites for Carbohydrate Antigen 19-9 Detection. Nanomaterials 2021, 11, 1475. [Google Scholar] [CrossRef]
- Fu, Y.; You, Z.; Xiao, A.; Liu, L. Magnetic molecularly imprinting polymers, reduced graphene oxide, and zeolitic imidazolate frameworks modified electrochemical sensor for the selective and sensitive detection of catechin. Microchim. Acta 2021, 188, 71. [Google Scholar] [CrossRef] [PubMed]
- Cirrincione, M.; Zanfrognini, B.; Pigani, L.; Protti, M.; Mercolini, L.; Zanardi, C. Development of an electrochemical sensor based on carbon black for the detection of cannabidiol in vegetable extracts. Analyst 2021, 146, 612–619. [Google Scholar] [CrossRef] [PubMed]
- Šafranko, S.; Stanković, A.; Asserghine, A.; Jakovljević, M.; Hajra, S.; Nundy, S.; Medvidović-Kosanović, M.; Jokić, S. Electroactivated Disposable Pencil Graphite Electrode—New, Cost-effective, and Sensitive Electrochemical Detection of Bioflavonoid Hesperidin. Electroanalysis 2021, 33, 1063–1071. [Google Scholar] [CrossRef]
- Zhang, J.; Zhang, X. Electrode material fabricated by loading cerium oxide nanoparticles on reduced graphene oxide and its application in electrochemical sensor for tryptophan. J. Alloys Compd. 2020, 842, 155934. [Google Scholar] [CrossRef]
- Pierini, G.D.; Maccio, S.A.; Robledo, S.N.; Ferrari, A.G.-M.; Banks, C.E.; Fernández, H.; Zon, M.A. Screen-printed electrochemical-based sensor for taxifolin determination in edible peanut oils. Microchem. J. 2020, 159, 105442. [Google Scholar] [CrossRef]
- Liu, J.; Sun, L.; Li, G.; Hu, J.; He, Q. Ultrasensitive detection of dopamine via electrochemical route on spindle-like α-Fe2O3 Mesocrystals/rGO modified GCE. Mater. Res. Bull. 2021, 133, 111050. [Google Scholar] [CrossRef]
- Ganesh, H.V.S.; Patel, B.R.; Fini, H.; Chow, A.M.; Kerman, K. Electrochemical Detection of Gallic Acid-Capped Gold Nanoparticles Using a Multiwalled Carbon Nanotube-Reduced Graphene Oxide Nanocomposite Electrode. Anal. Chem. 2019, 91, 10116–10124. [Google Scholar] [CrossRef]
- Wang, T.; Wang, C.; Xu, X.; Li, Z.; Li, D. One-Step Electrodeposition Synthesized Aunps/Mxene/ERGO for Selectivity Nitrite Sensing. Nanomaterials 2021, 11, 1892. [Google Scholar] [CrossRef]
- Backofen, U.; Matysik, F.-M.; Lunte, C.E. Determination of cannabinoids in hair using high-pH∗ non-aqueous electrolytes and electrochemical detection: Some aspects of sensitivity and selectivity. J. Chromatogr. A 2002, 942, 259–269. [Google Scholar] [CrossRef]
- Hacke, A.C.M.; Lima, D.; de Costa, F.; Deshmukh, K.; Li, N.; Chow, A.M.; Marques, J.A.; Pereira, R.P.; Kerman, K. Probing the antioxidant activity of Δ9-tetrahydrocannabinol and cannabidiol in Cannabis sativa extracts. Analyst 2019, 144, 4952–4961. [Google Scholar] [CrossRef]

| Fabrication Sequence | Ip (μA) | Process Method | Ip (μA) |
|---|---|---|---|
| GN/Fe3O4-NH2/GCE | 1.808 | Ultrasonication | 3.352 |
| Fe3O4-NH2/GN/GCE | 3.388 | Solvothermal | 4.232 |
| Fe3O4-NH2-GN/GCE | 5.327 | Mix | 5.550 |
| Electrode | Linear Rage (μmol L−1) | LOD (μmol L−1) | Ref. |
|---|---|---|---|
| GC/CB | 0.96–6.37 | 0.35 | [39] |
| Sonogel-Carbon-PEDOT | 1.59–19.1 | 0.94 | [34] |
| NACE–ED | 0.32–31.8 | 0.064 | [46] |
| GCE | -NM | -NM | [47] |
| Fe3O4-NH2-GN/GCE | 0.1–100.0 | 0.04 | This study |
| Samples | Added (μmol L−1) | Found (μmol L−1) | Recovery (%) | RSD (%) | HPLC (μmol L−1) |
|---|---|---|---|---|---|
| Extract of C. sativa | 0 | 11.95 | - | 2.23 | 12.06 |
| 1.0 | 13.00 | 100.4 | 2.05 | - | |
| 5.0 | 16.84 | 99.1 | 3.51 | - |
Publisher’s Note: MDPI stays neutral with regard to jurisdictional claims in published maps and institutional affiliations. |
© 2021 by the authors. Licensee MDPI, Basel, Switzerland. This article is an open access article distributed under the terms and conditions of the Creative Commons Attribution (CC BY) license (https://creativecommons.org/licenses/by/4.0/).
Share and Cite
Zhang, Y.; You, Z.; Hou, C.; Liu, L.; Xiao, A. An Electrochemical Sensor Based on Amino Magnetic Nanoparticle-Decorated Graphene for Detection of Cannabidiol. Nanomaterials 2021, 11, 2227. https://doi.org/10.3390/nano11092227
Zhang Y, You Z, Hou C, Liu L, Xiao A. An Electrochemical Sensor Based on Amino Magnetic Nanoparticle-Decorated Graphene for Detection of Cannabidiol. Nanomaterials. 2021; 11(9):2227. https://doi.org/10.3390/nano11092227
Chicago/Turabian StyleZhang, Yi, Zongyi You, Chunsheng Hou, Liangliang Liu, and Aiping Xiao. 2021. "An Electrochemical Sensor Based on Amino Magnetic Nanoparticle-Decorated Graphene for Detection of Cannabidiol" Nanomaterials 11, no. 9: 2227. https://doi.org/10.3390/nano11092227
APA StyleZhang, Y., You, Z., Hou, C., Liu, L., & Xiao, A. (2021). An Electrochemical Sensor Based on Amino Magnetic Nanoparticle-Decorated Graphene for Detection of Cannabidiol. Nanomaterials, 11(9), 2227. https://doi.org/10.3390/nano11092227