
Magnetic Characterization by Scanning Microscopy of Functionalized Iron Oxide Nanoparticles

 , , , , , and
Abstract
:1. Introduction
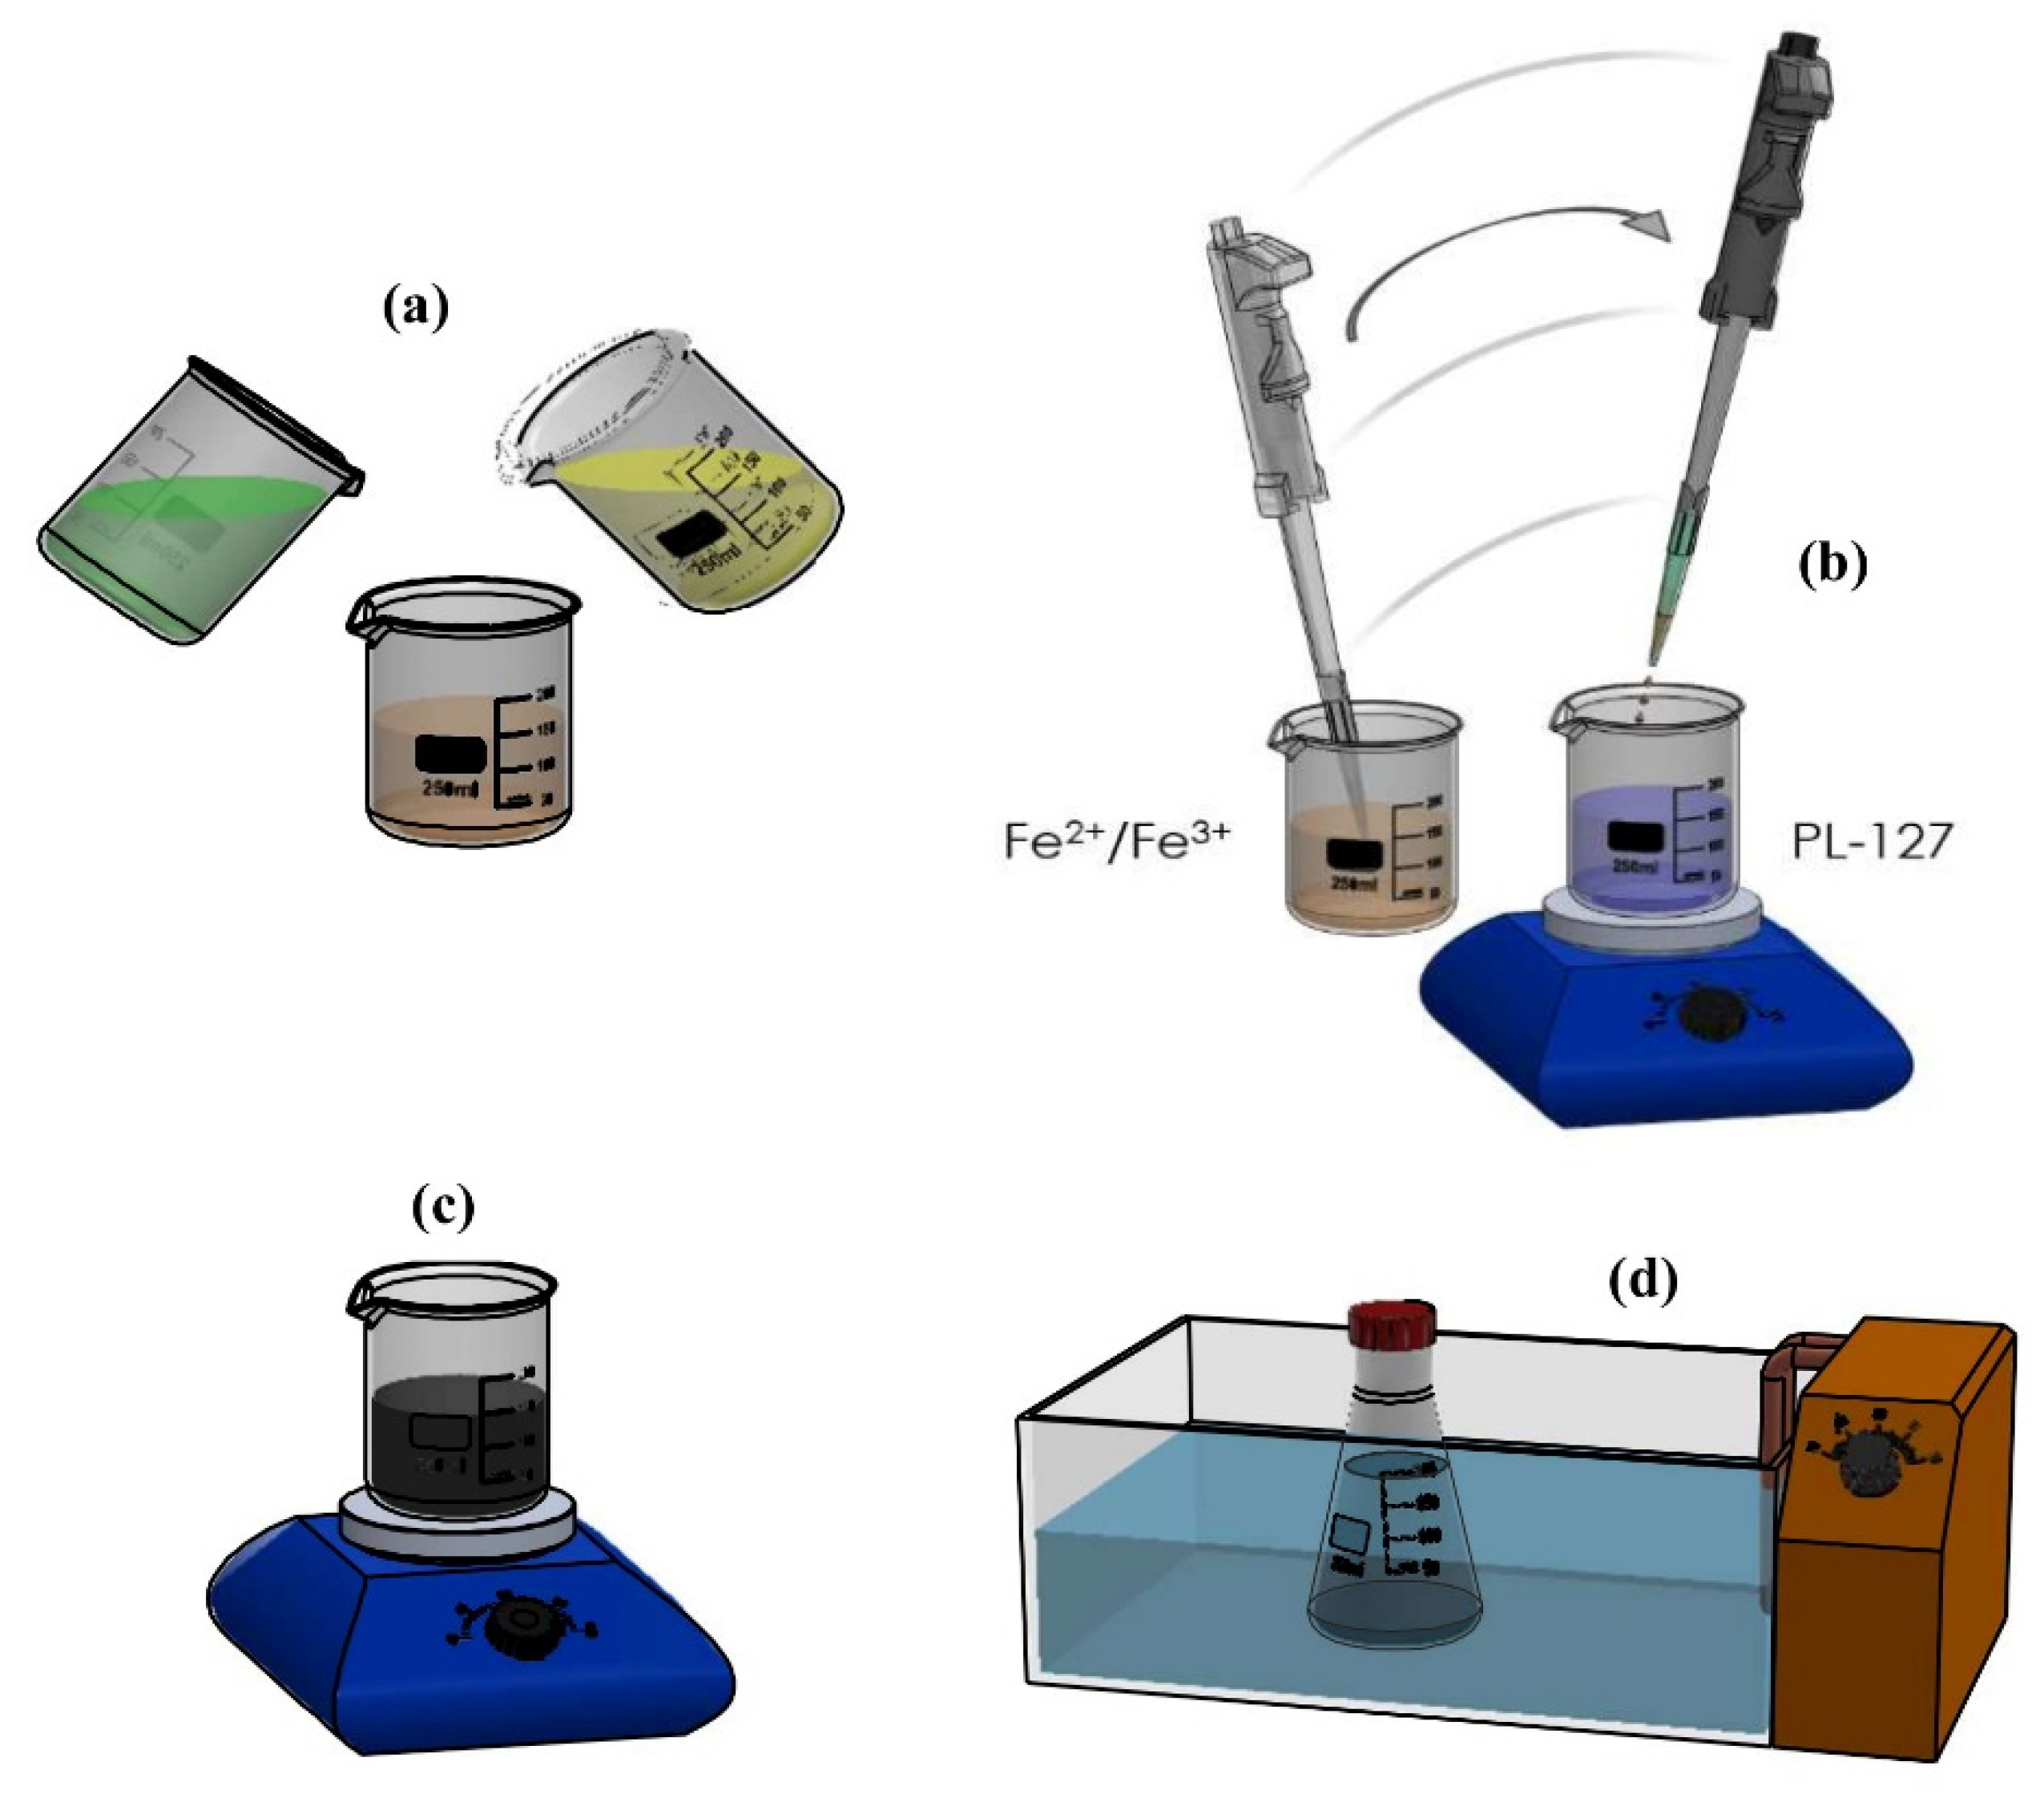
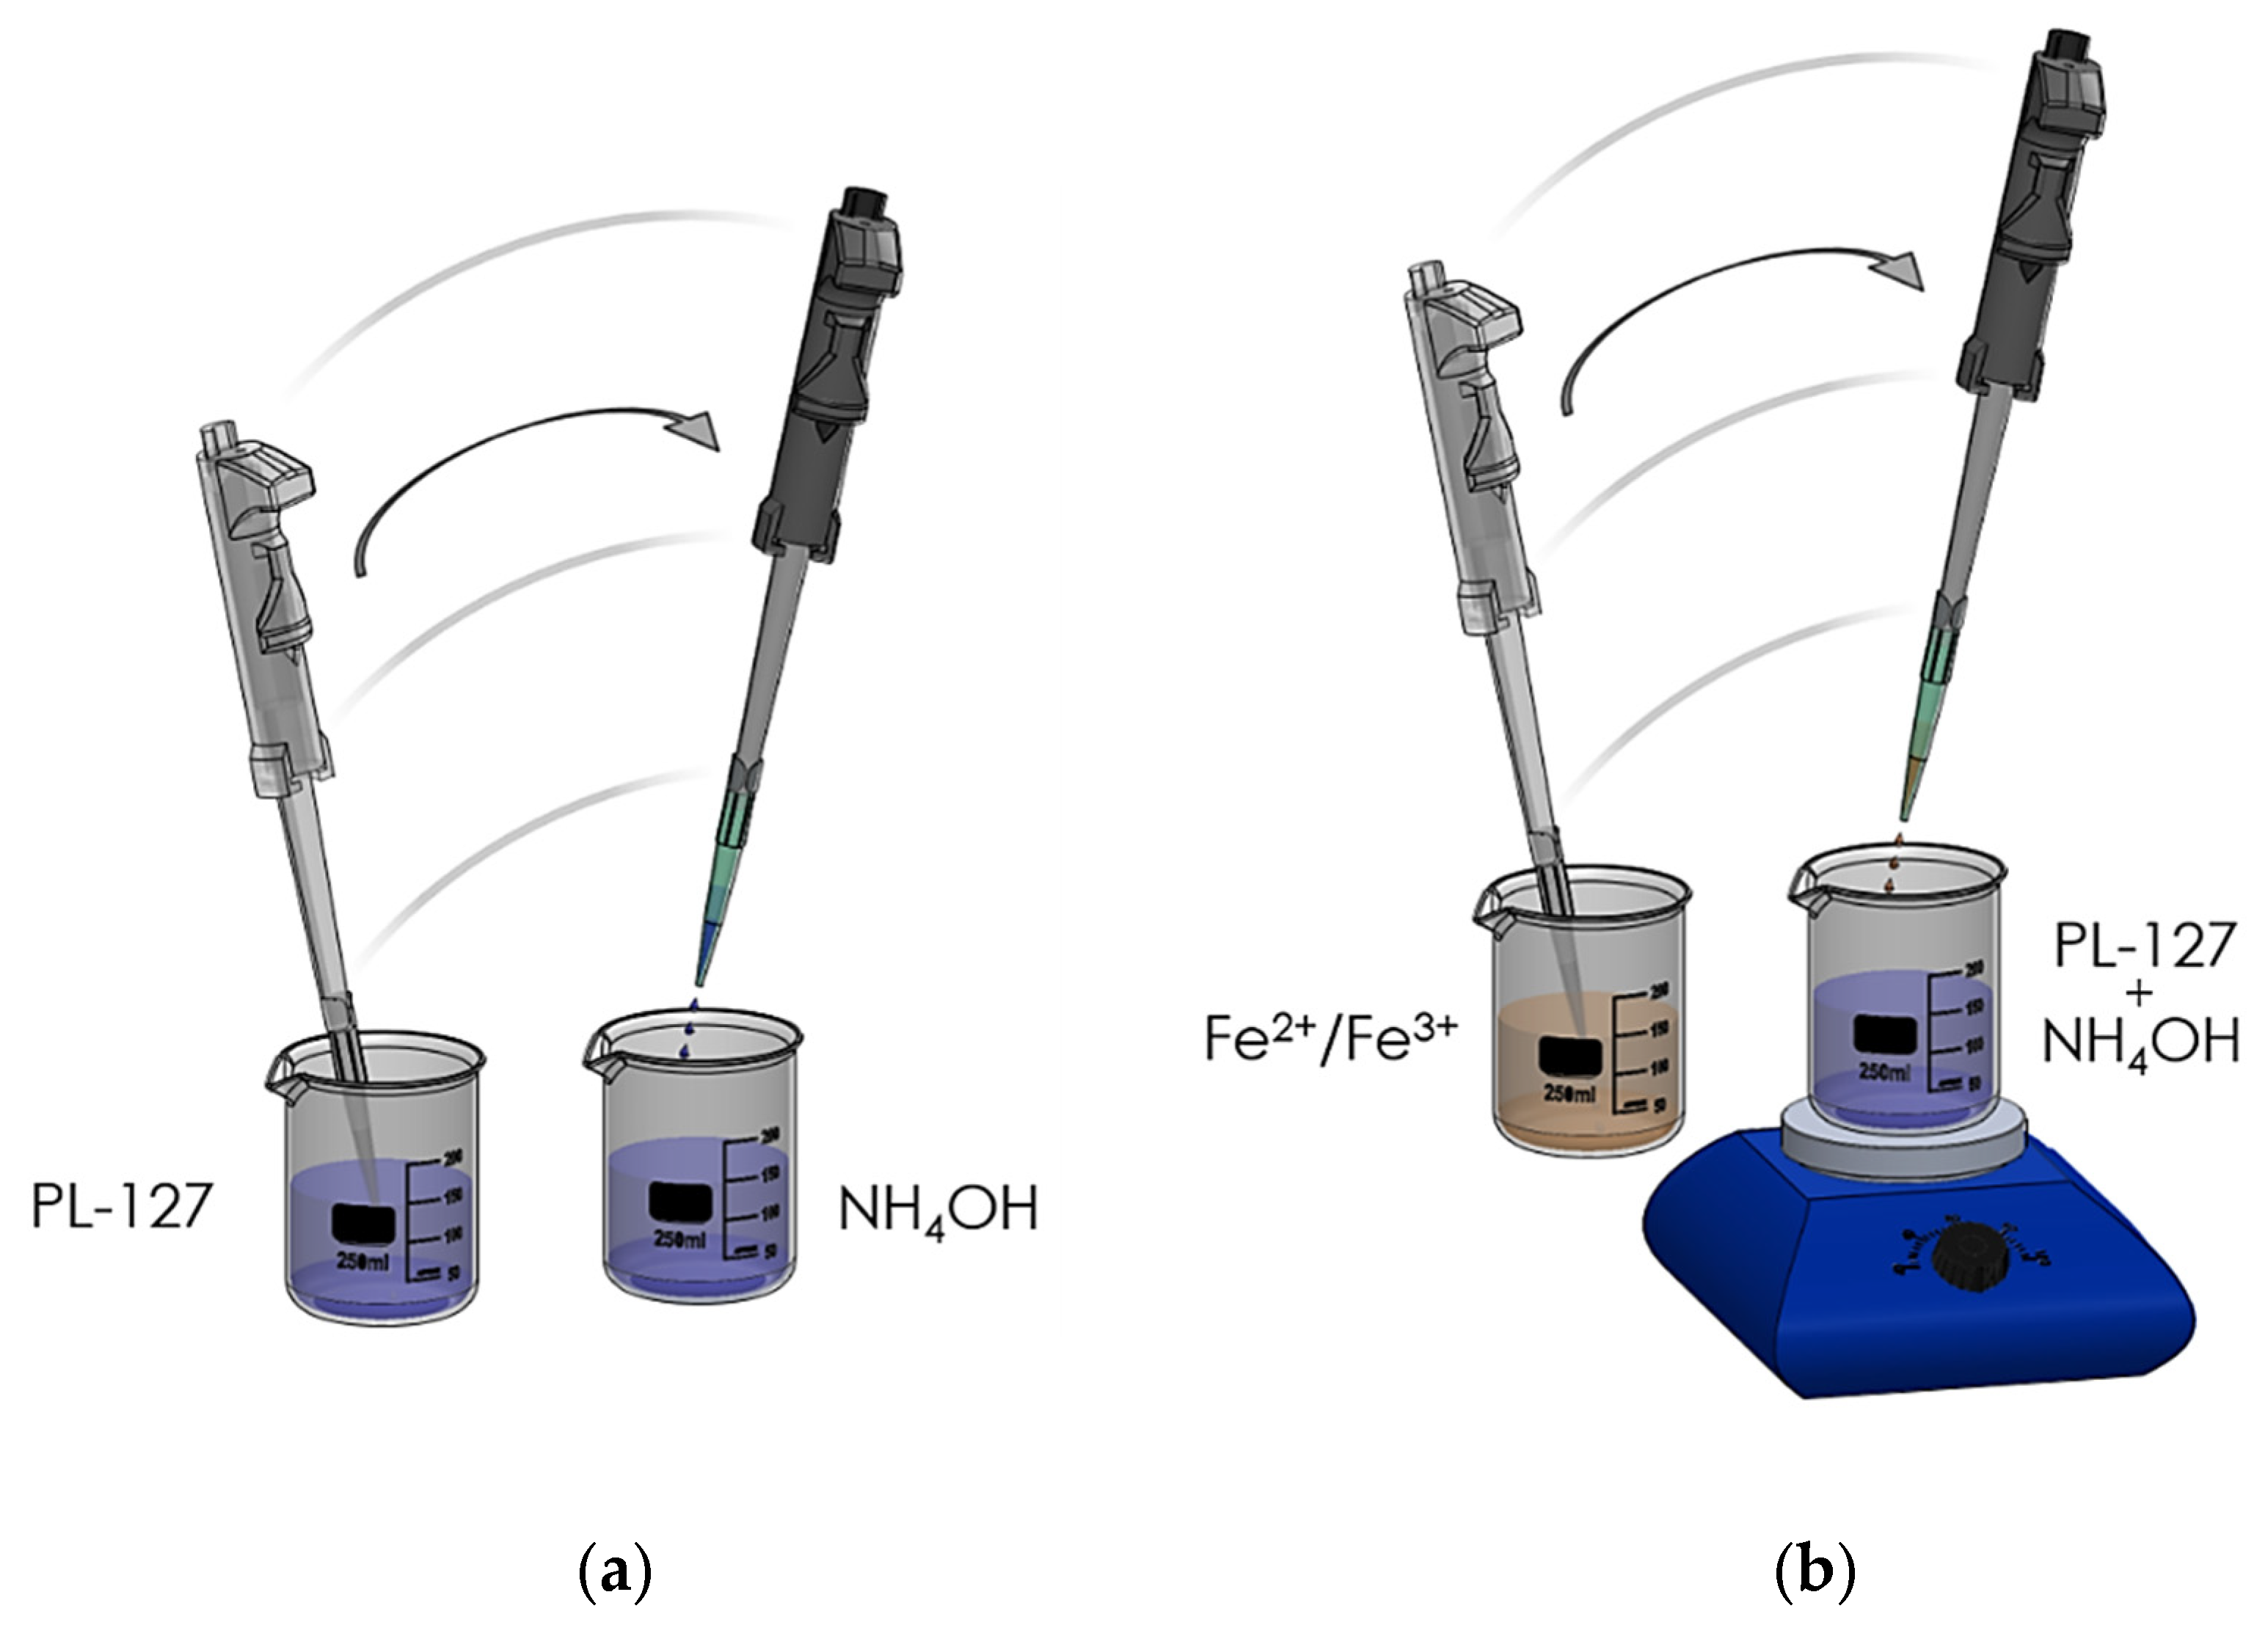
2. Experimental
3. Nanoparticles Characterization
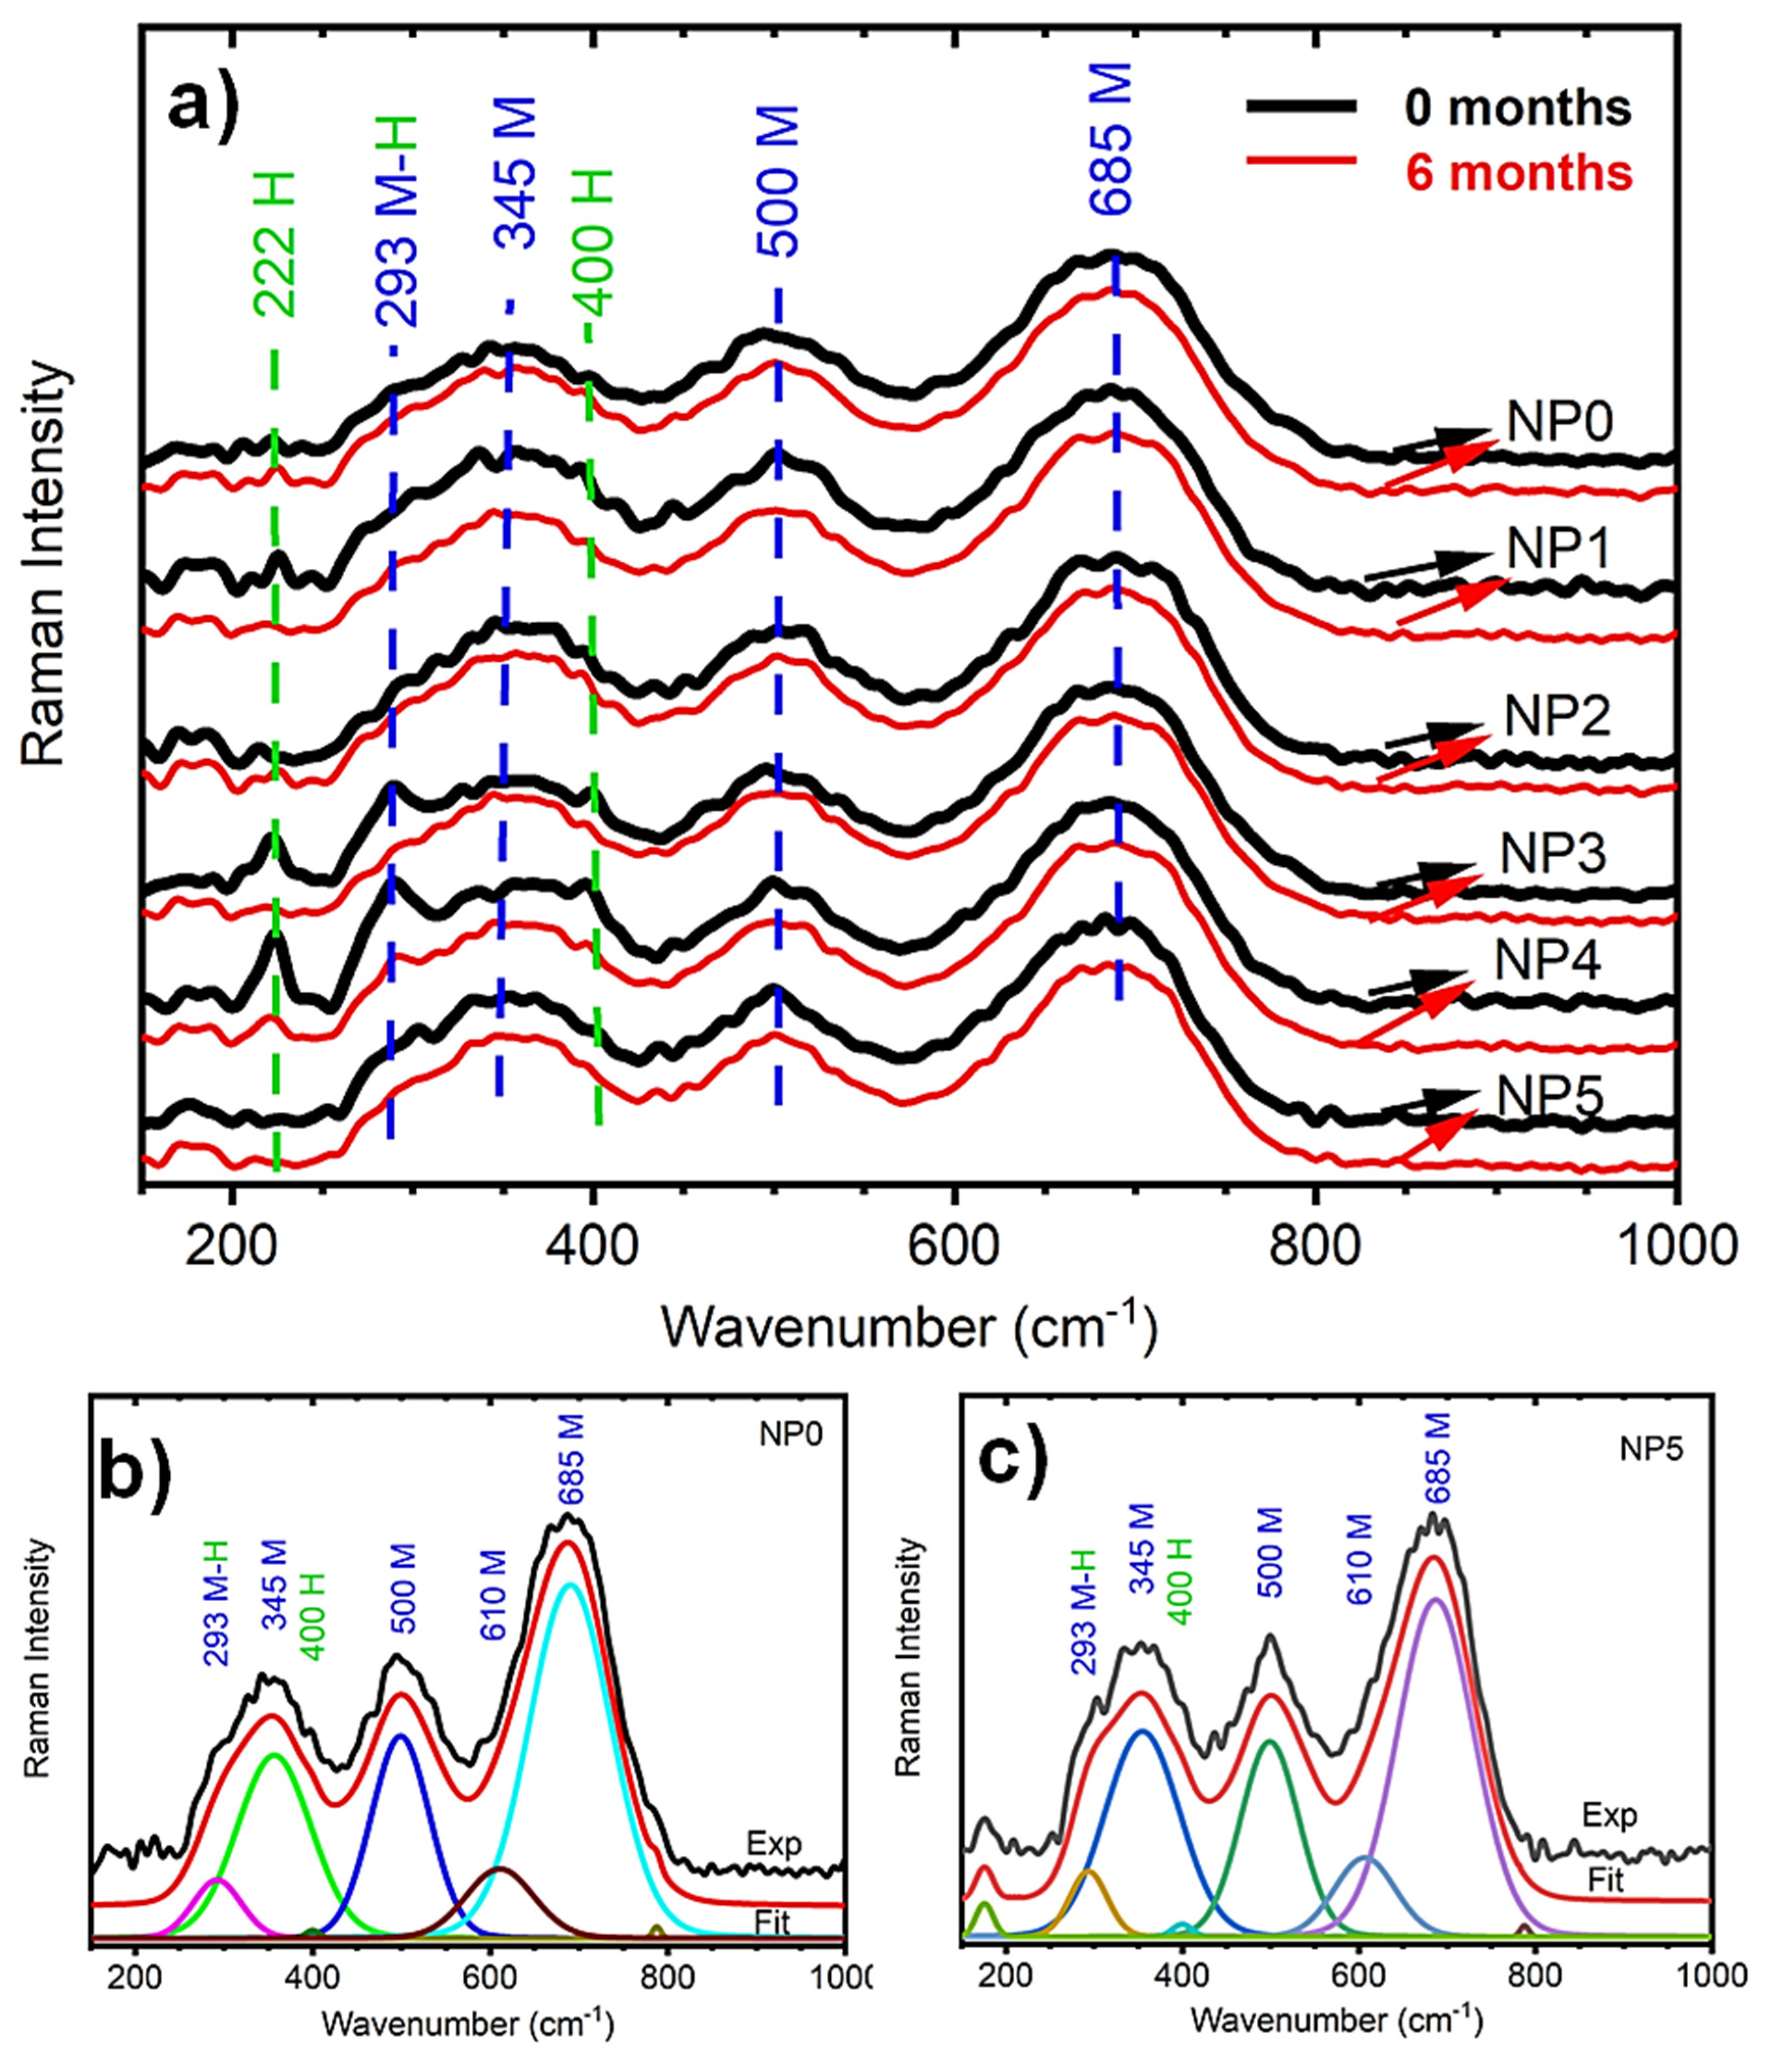
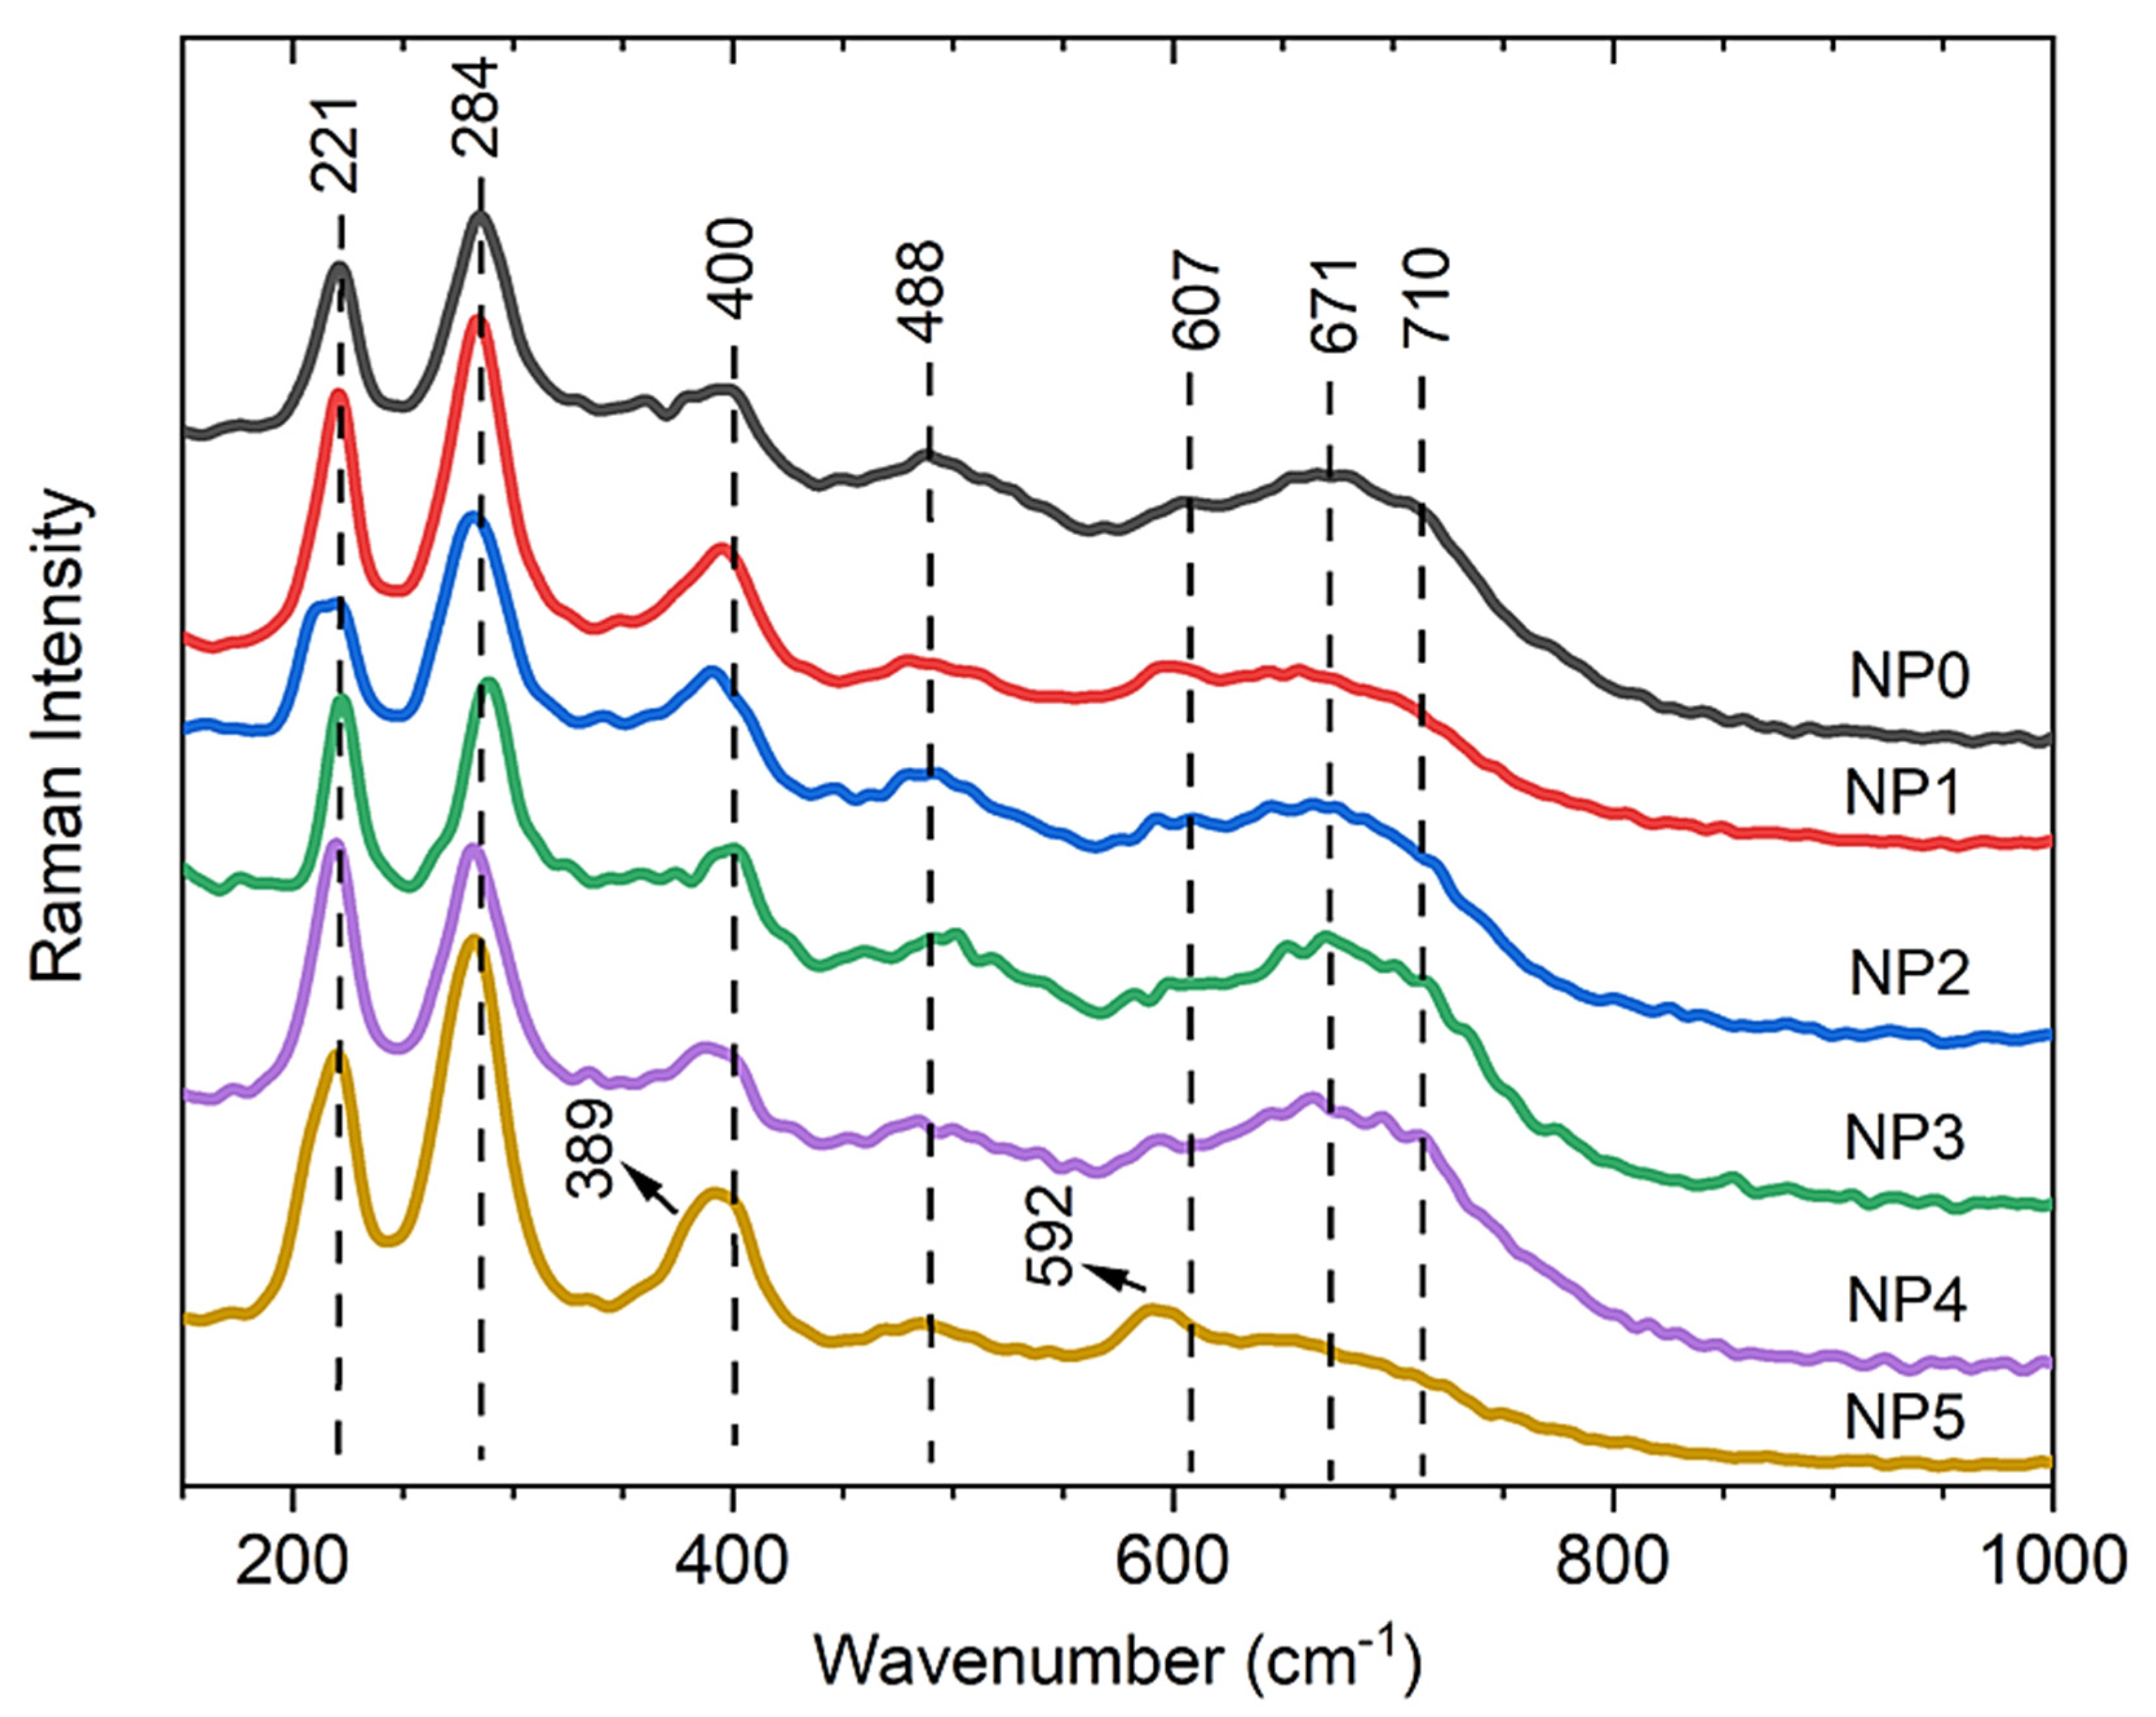
3.1. Raman Spectroscopy
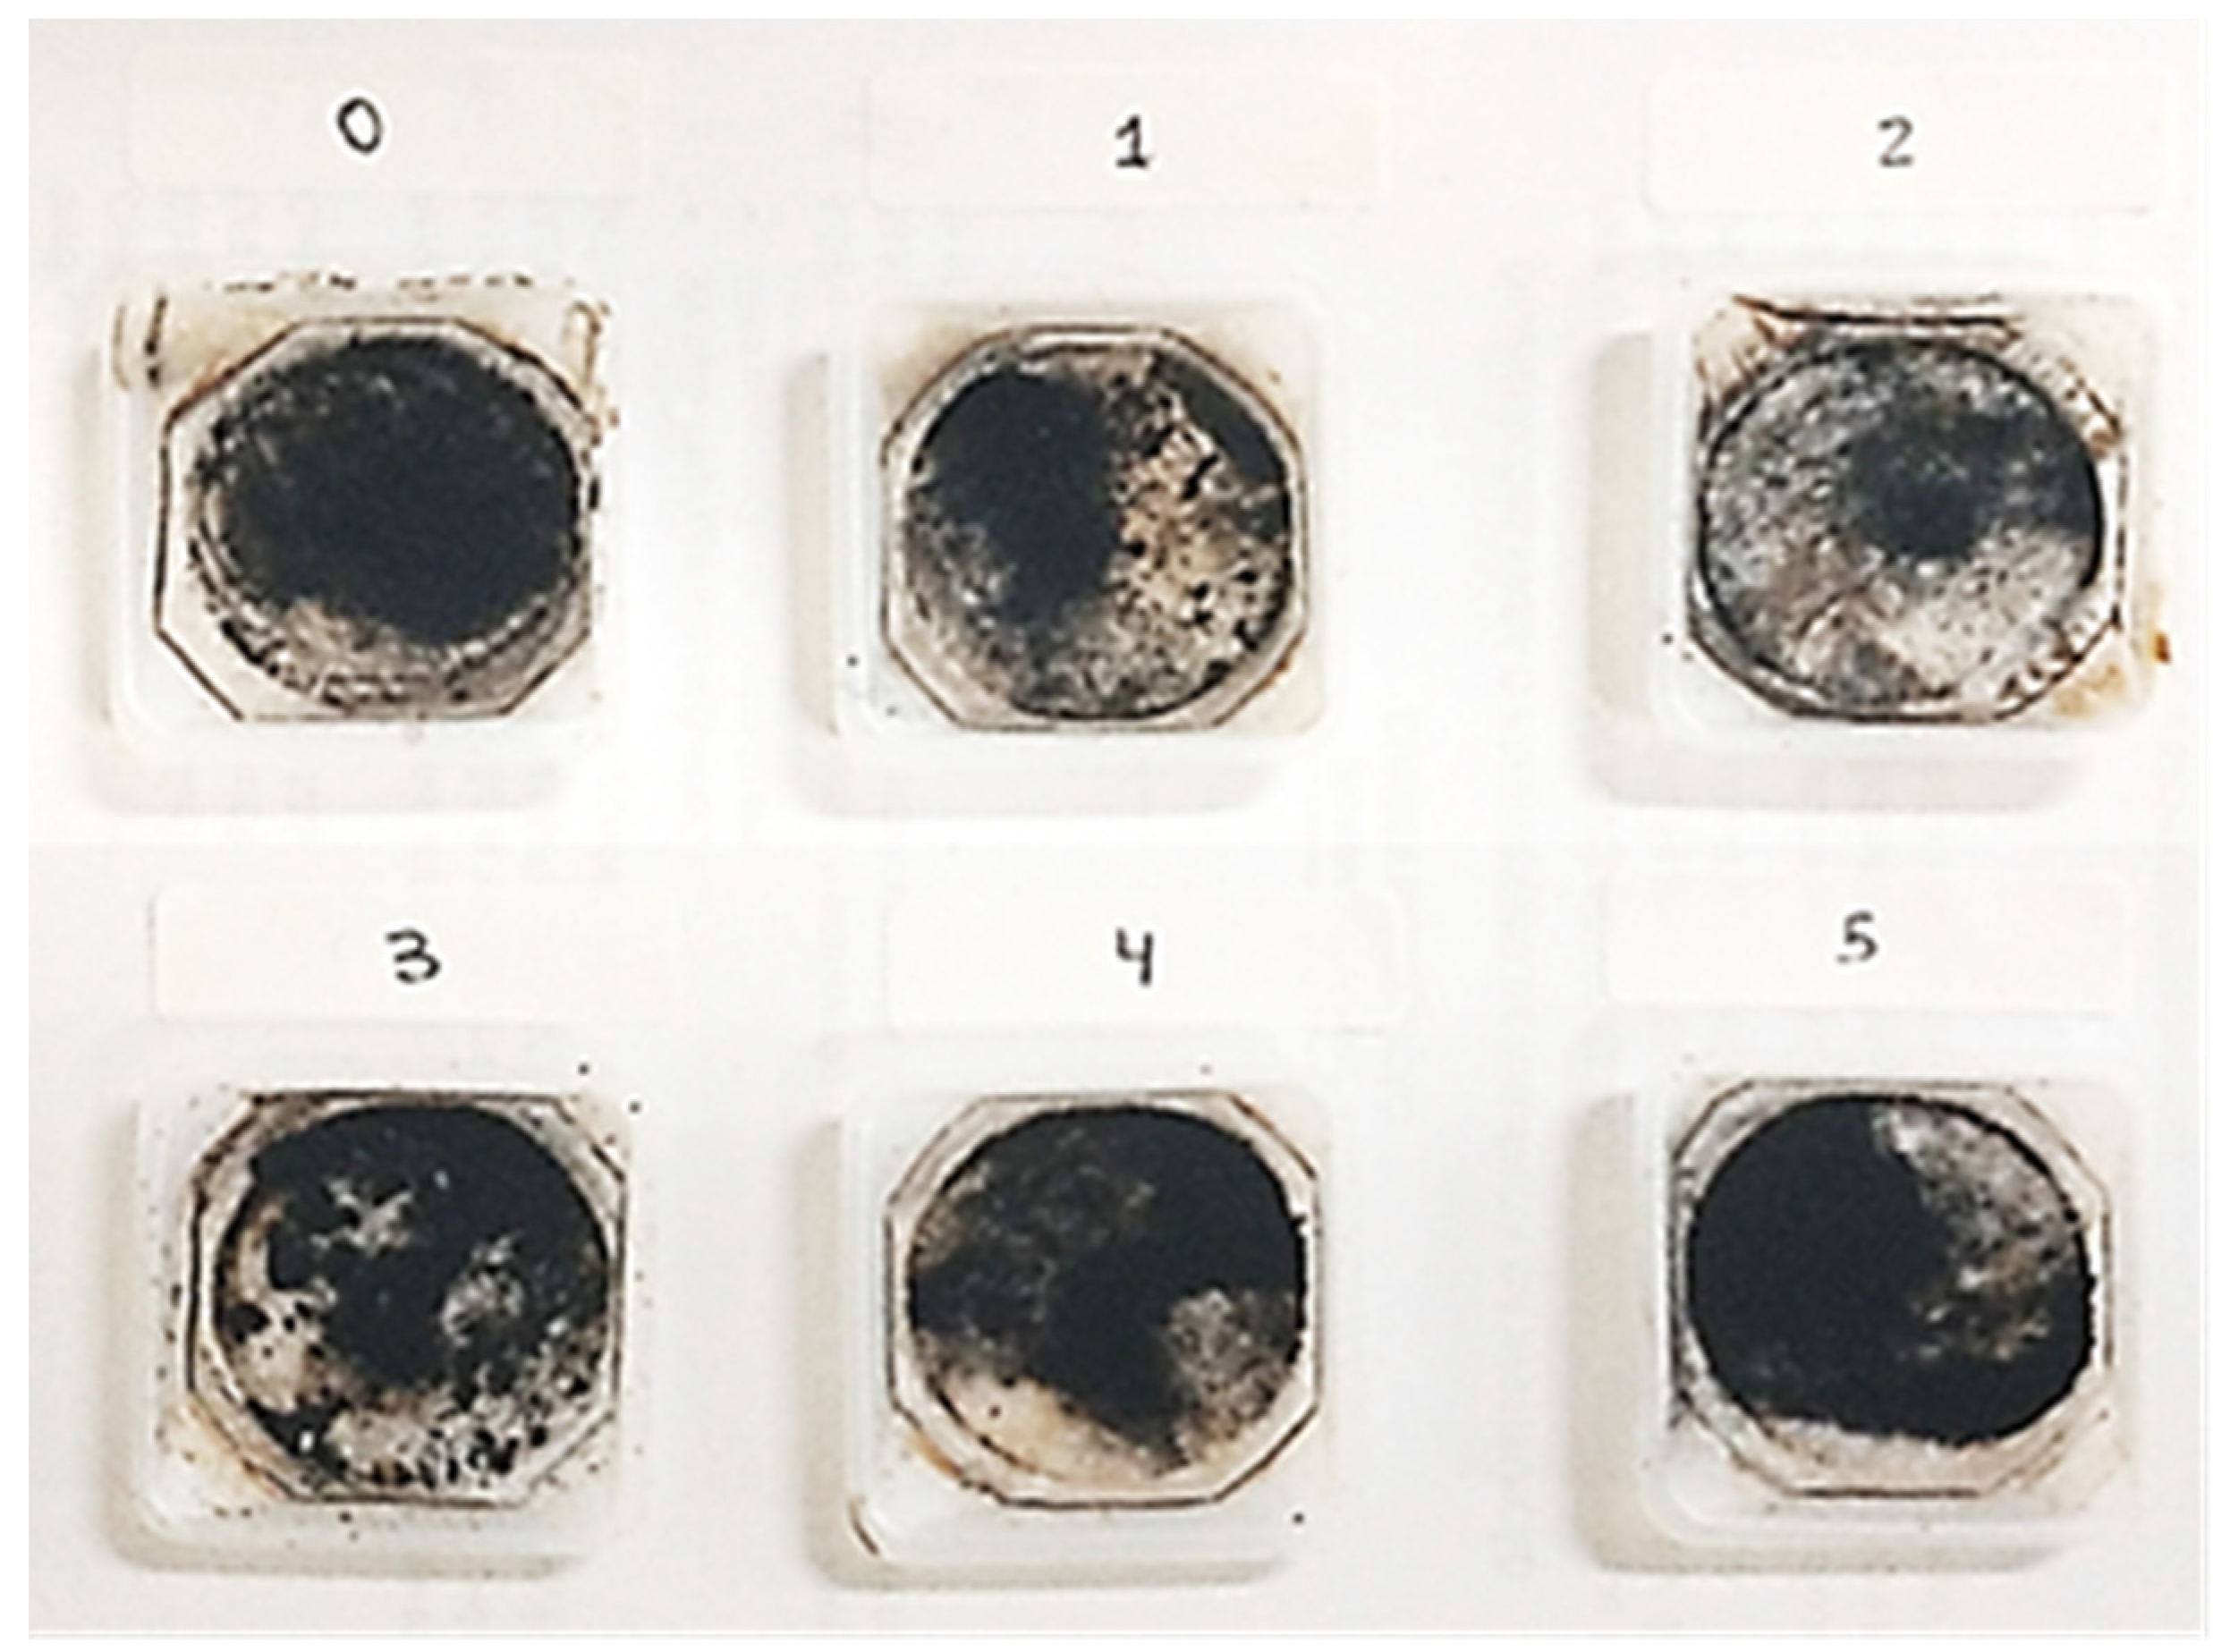
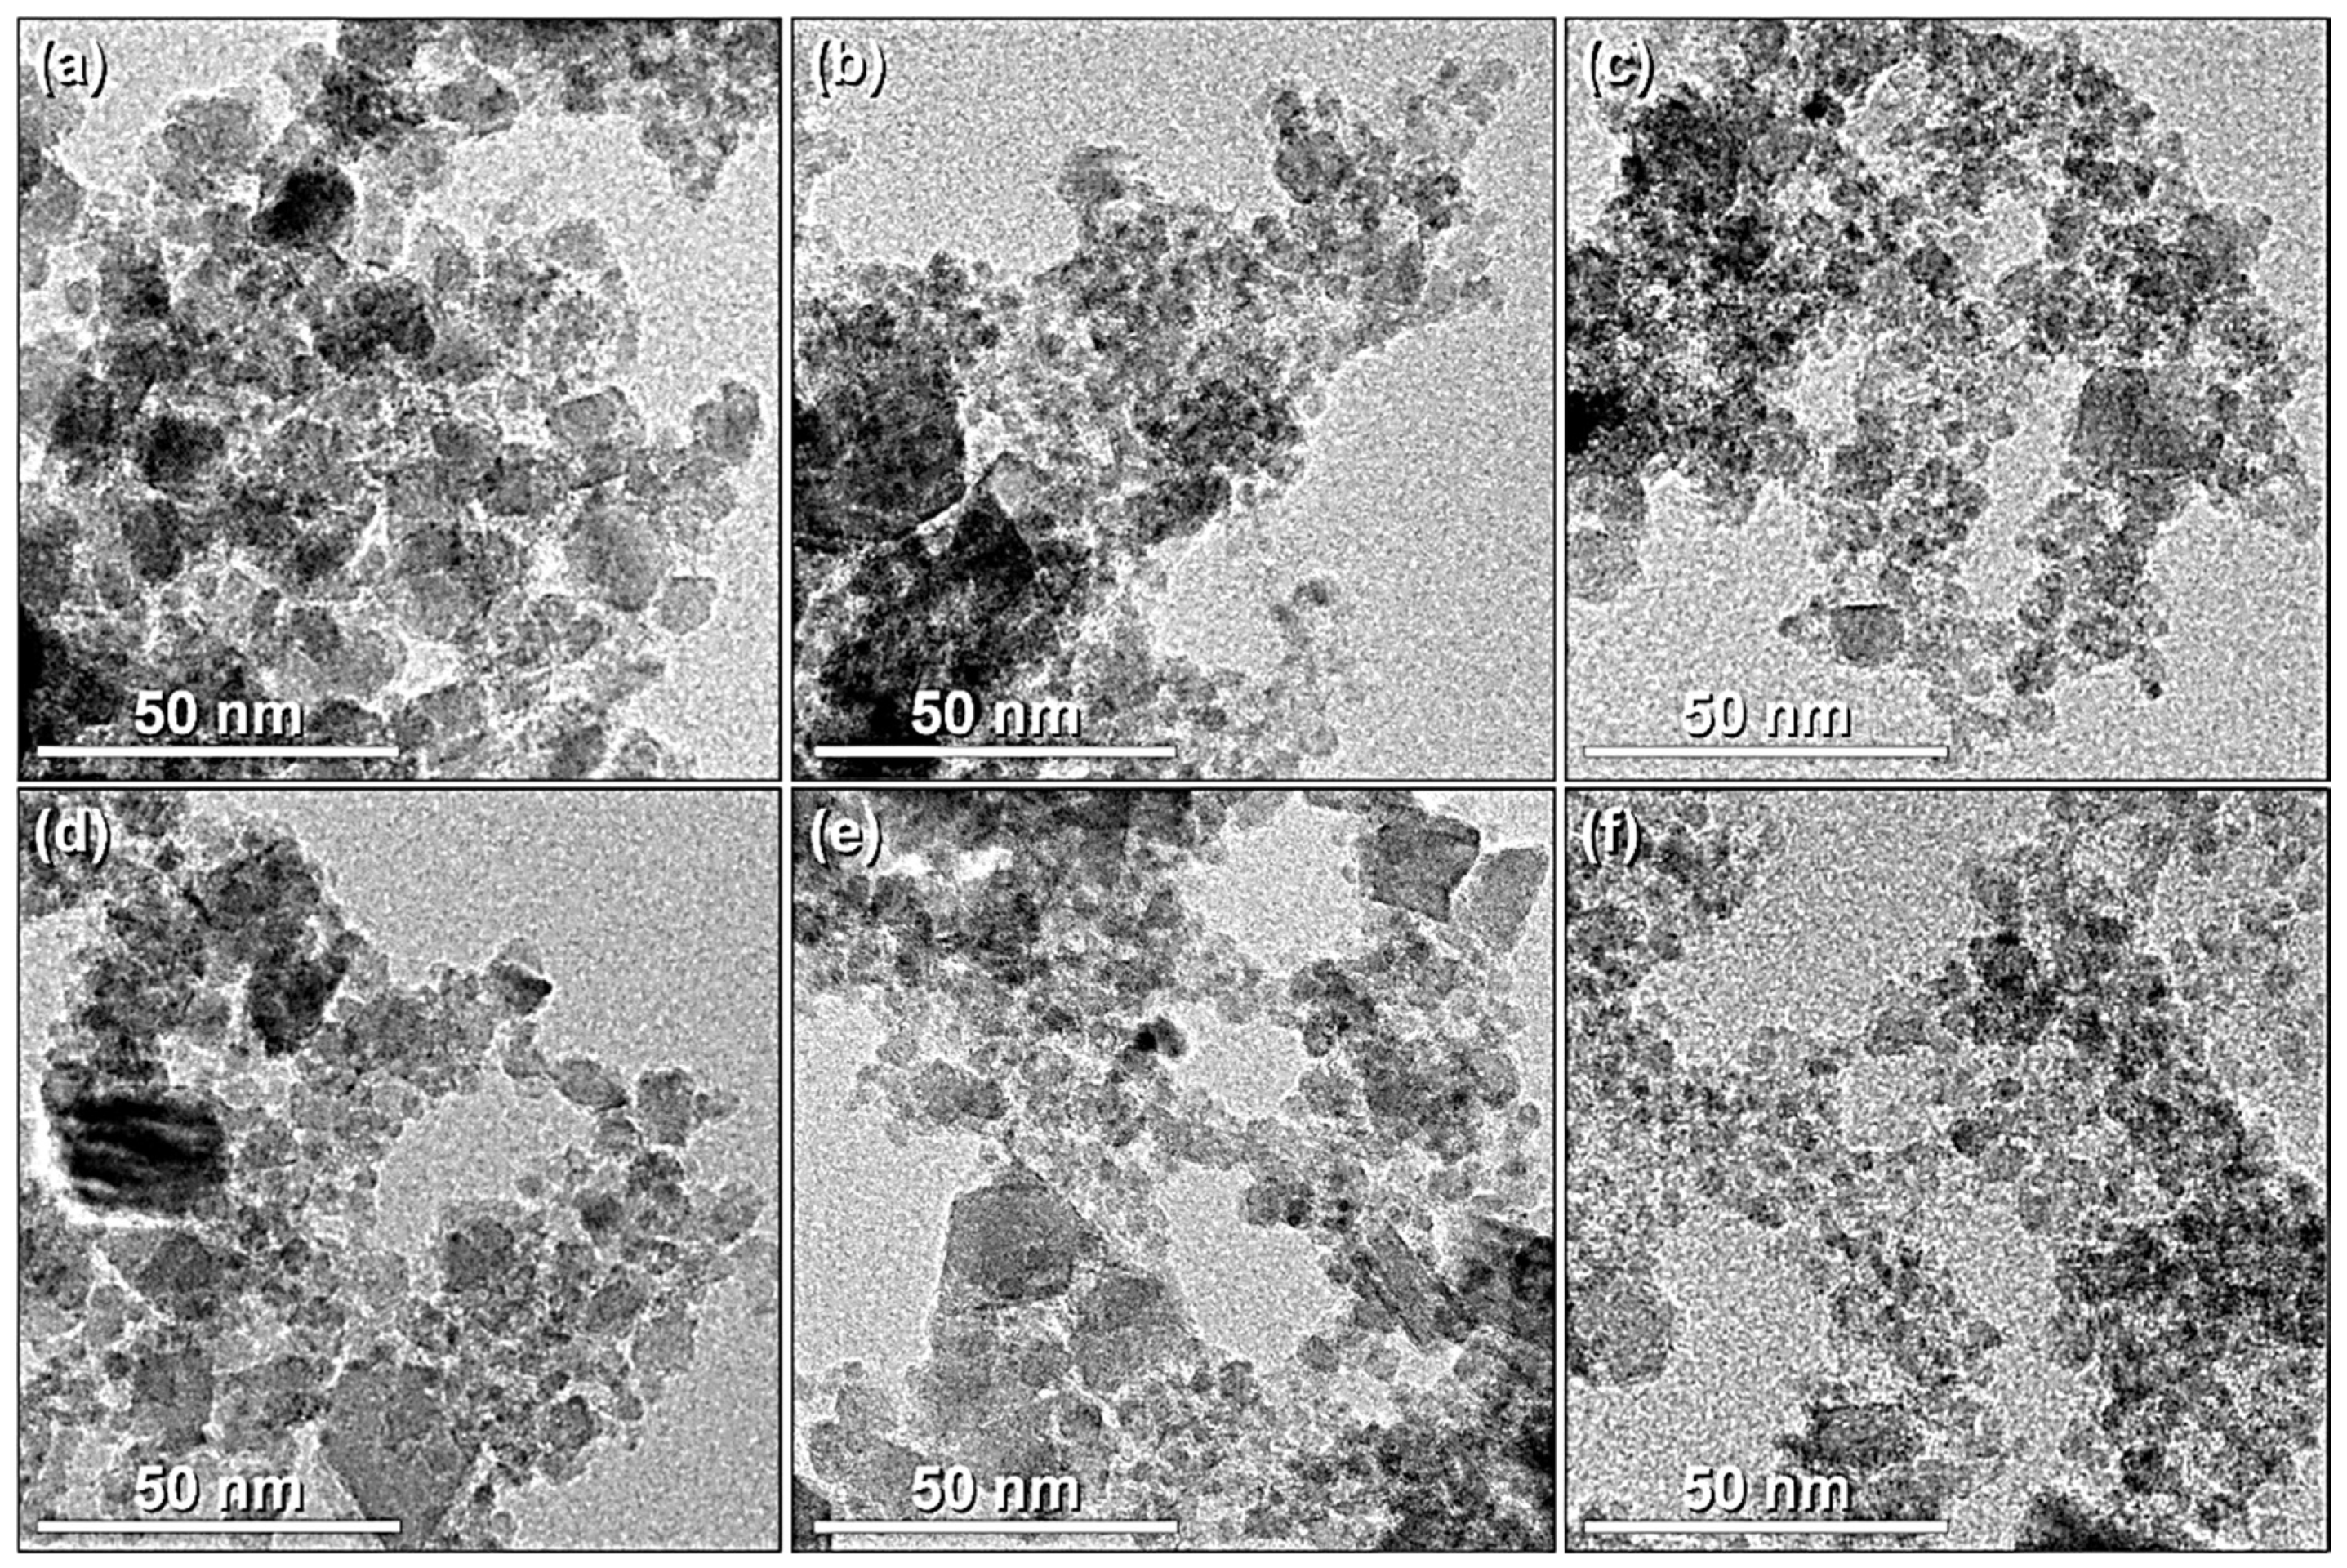
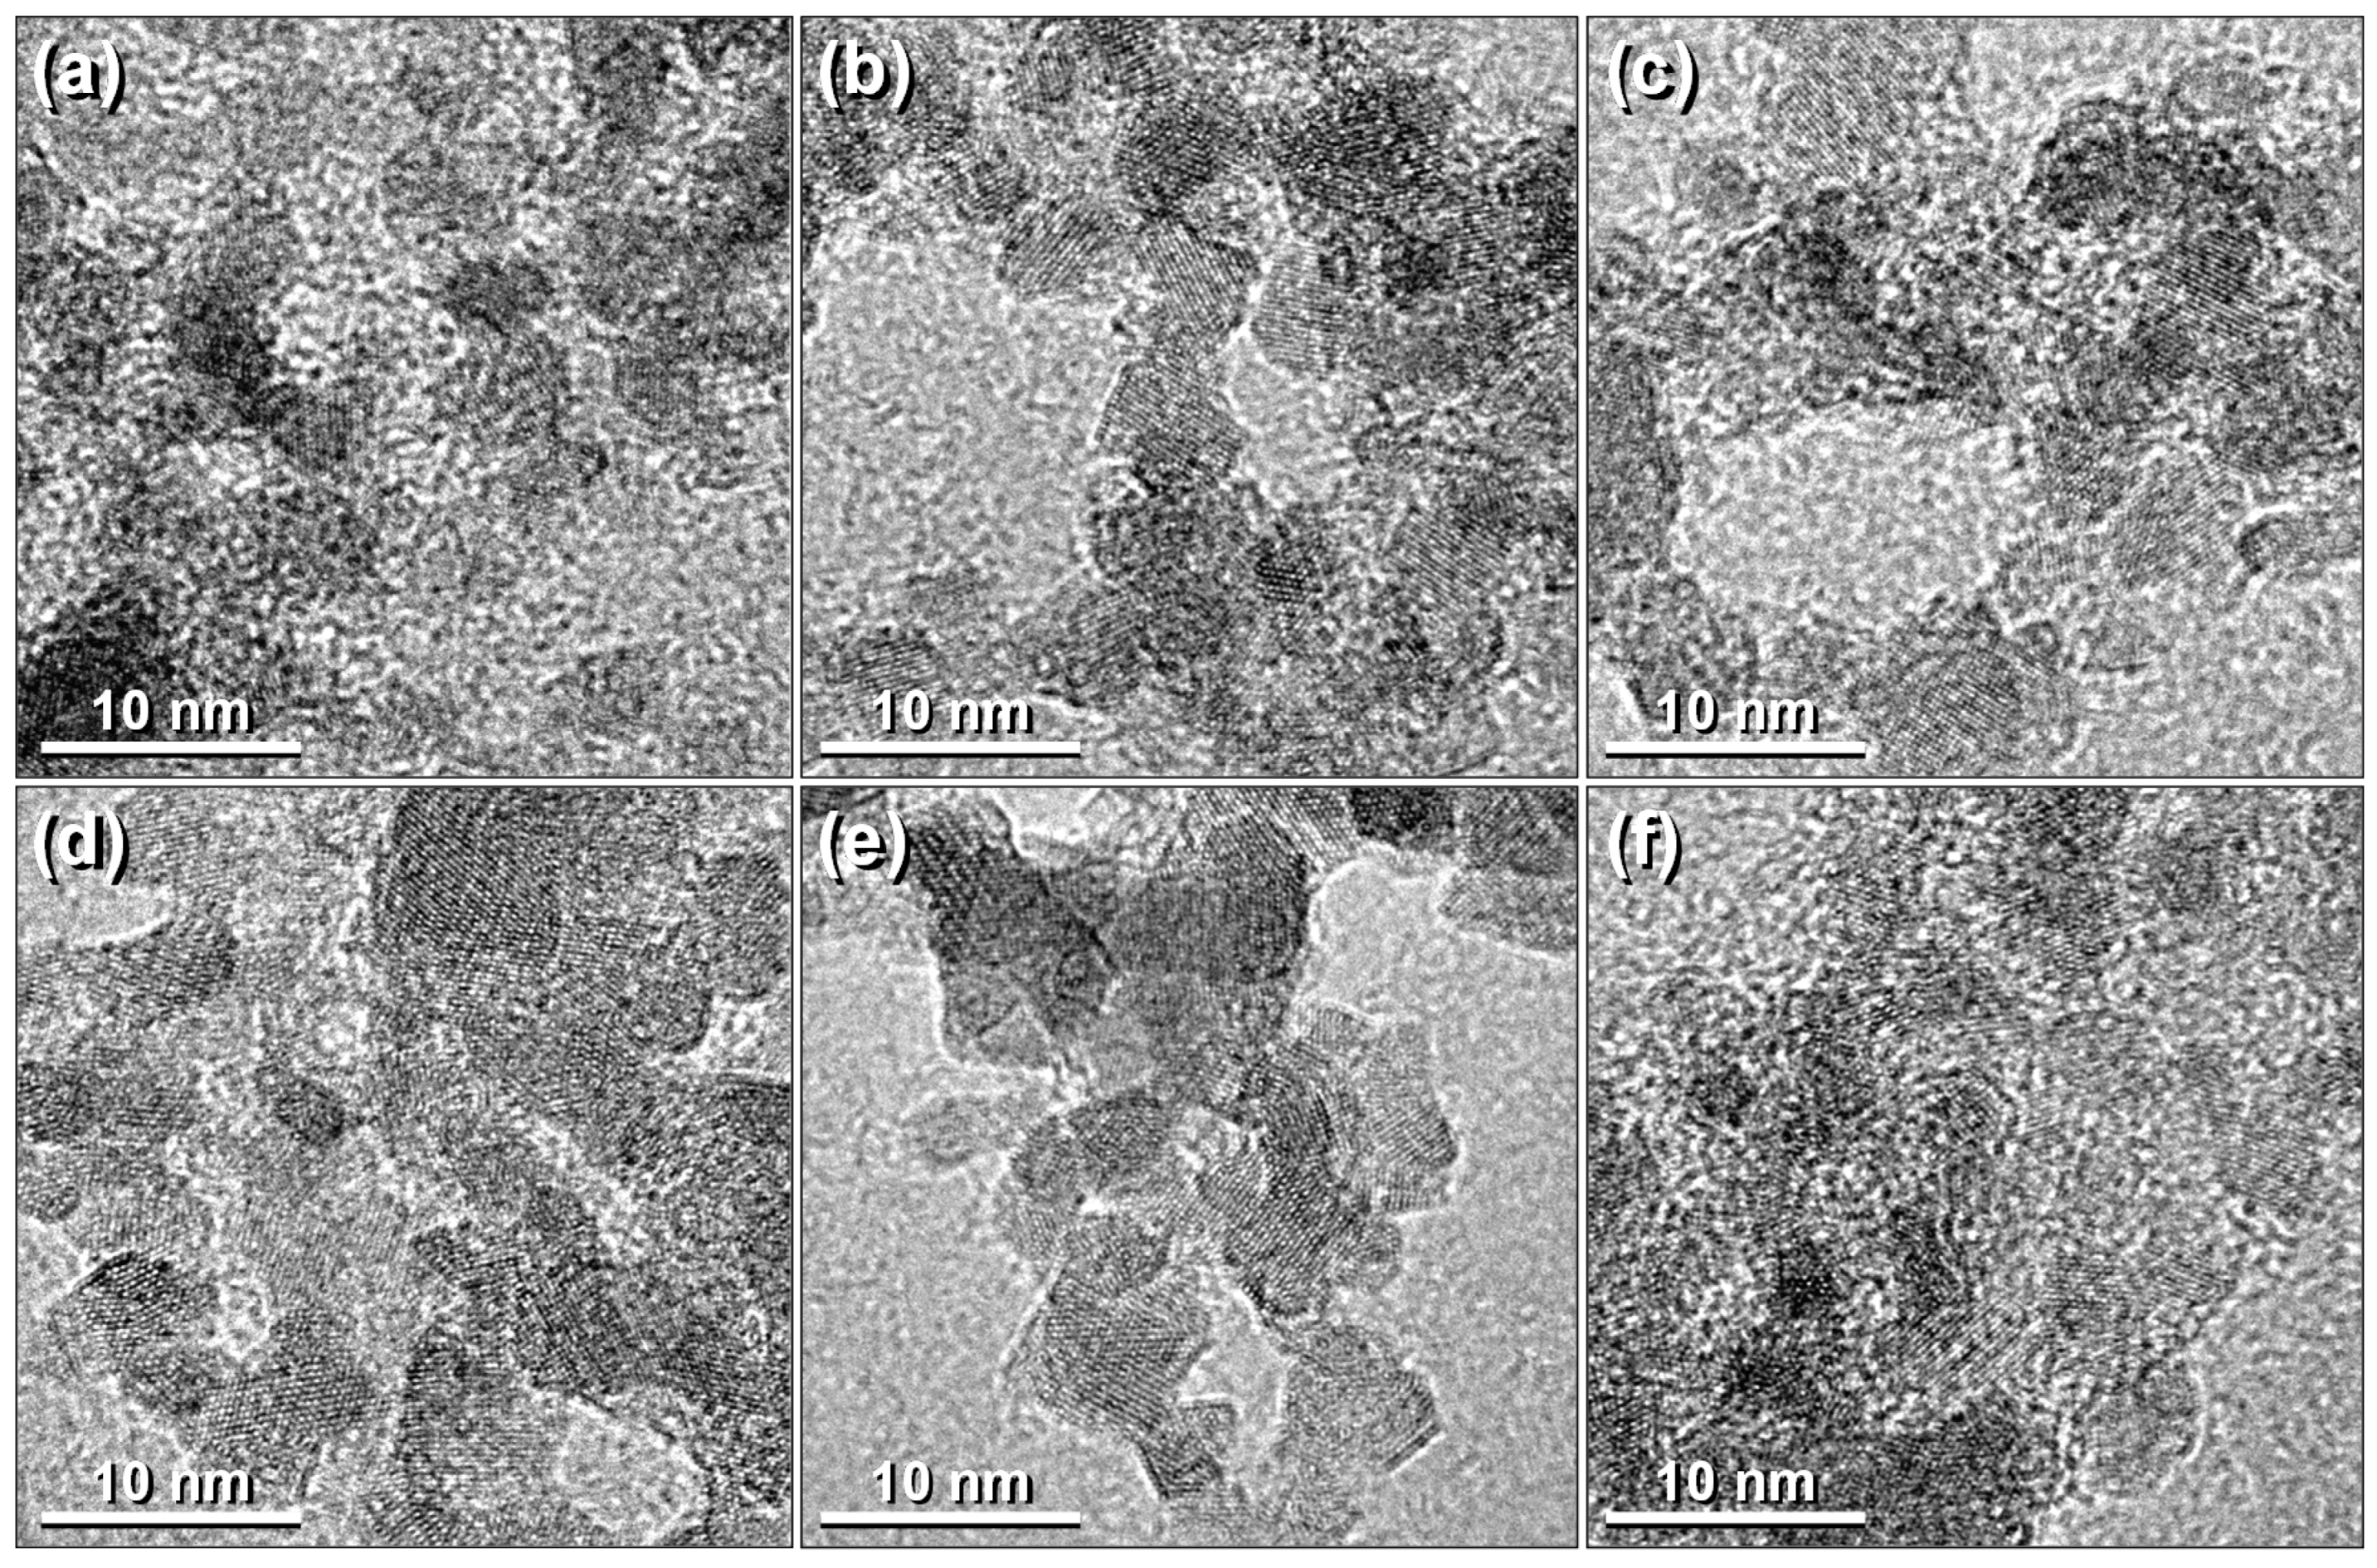
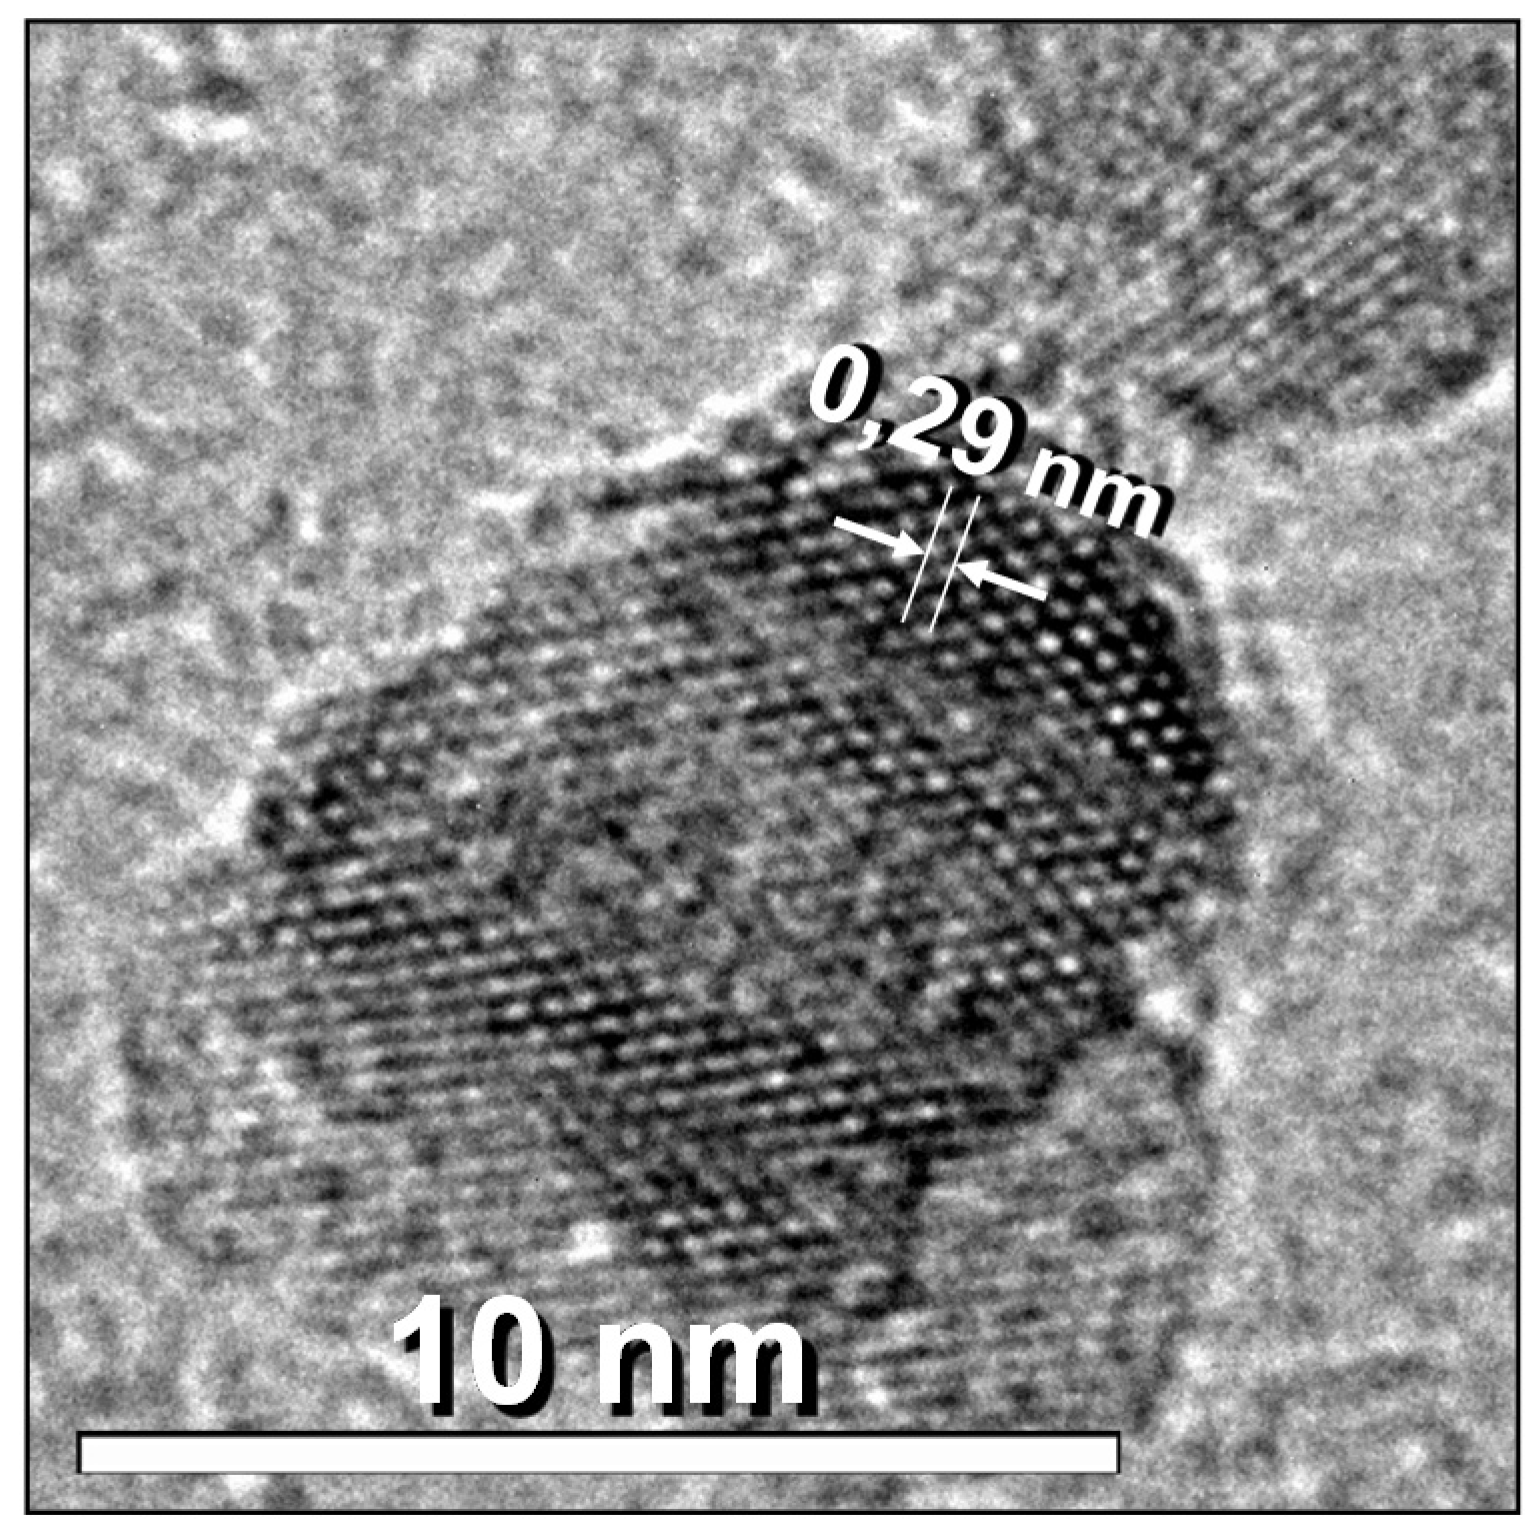
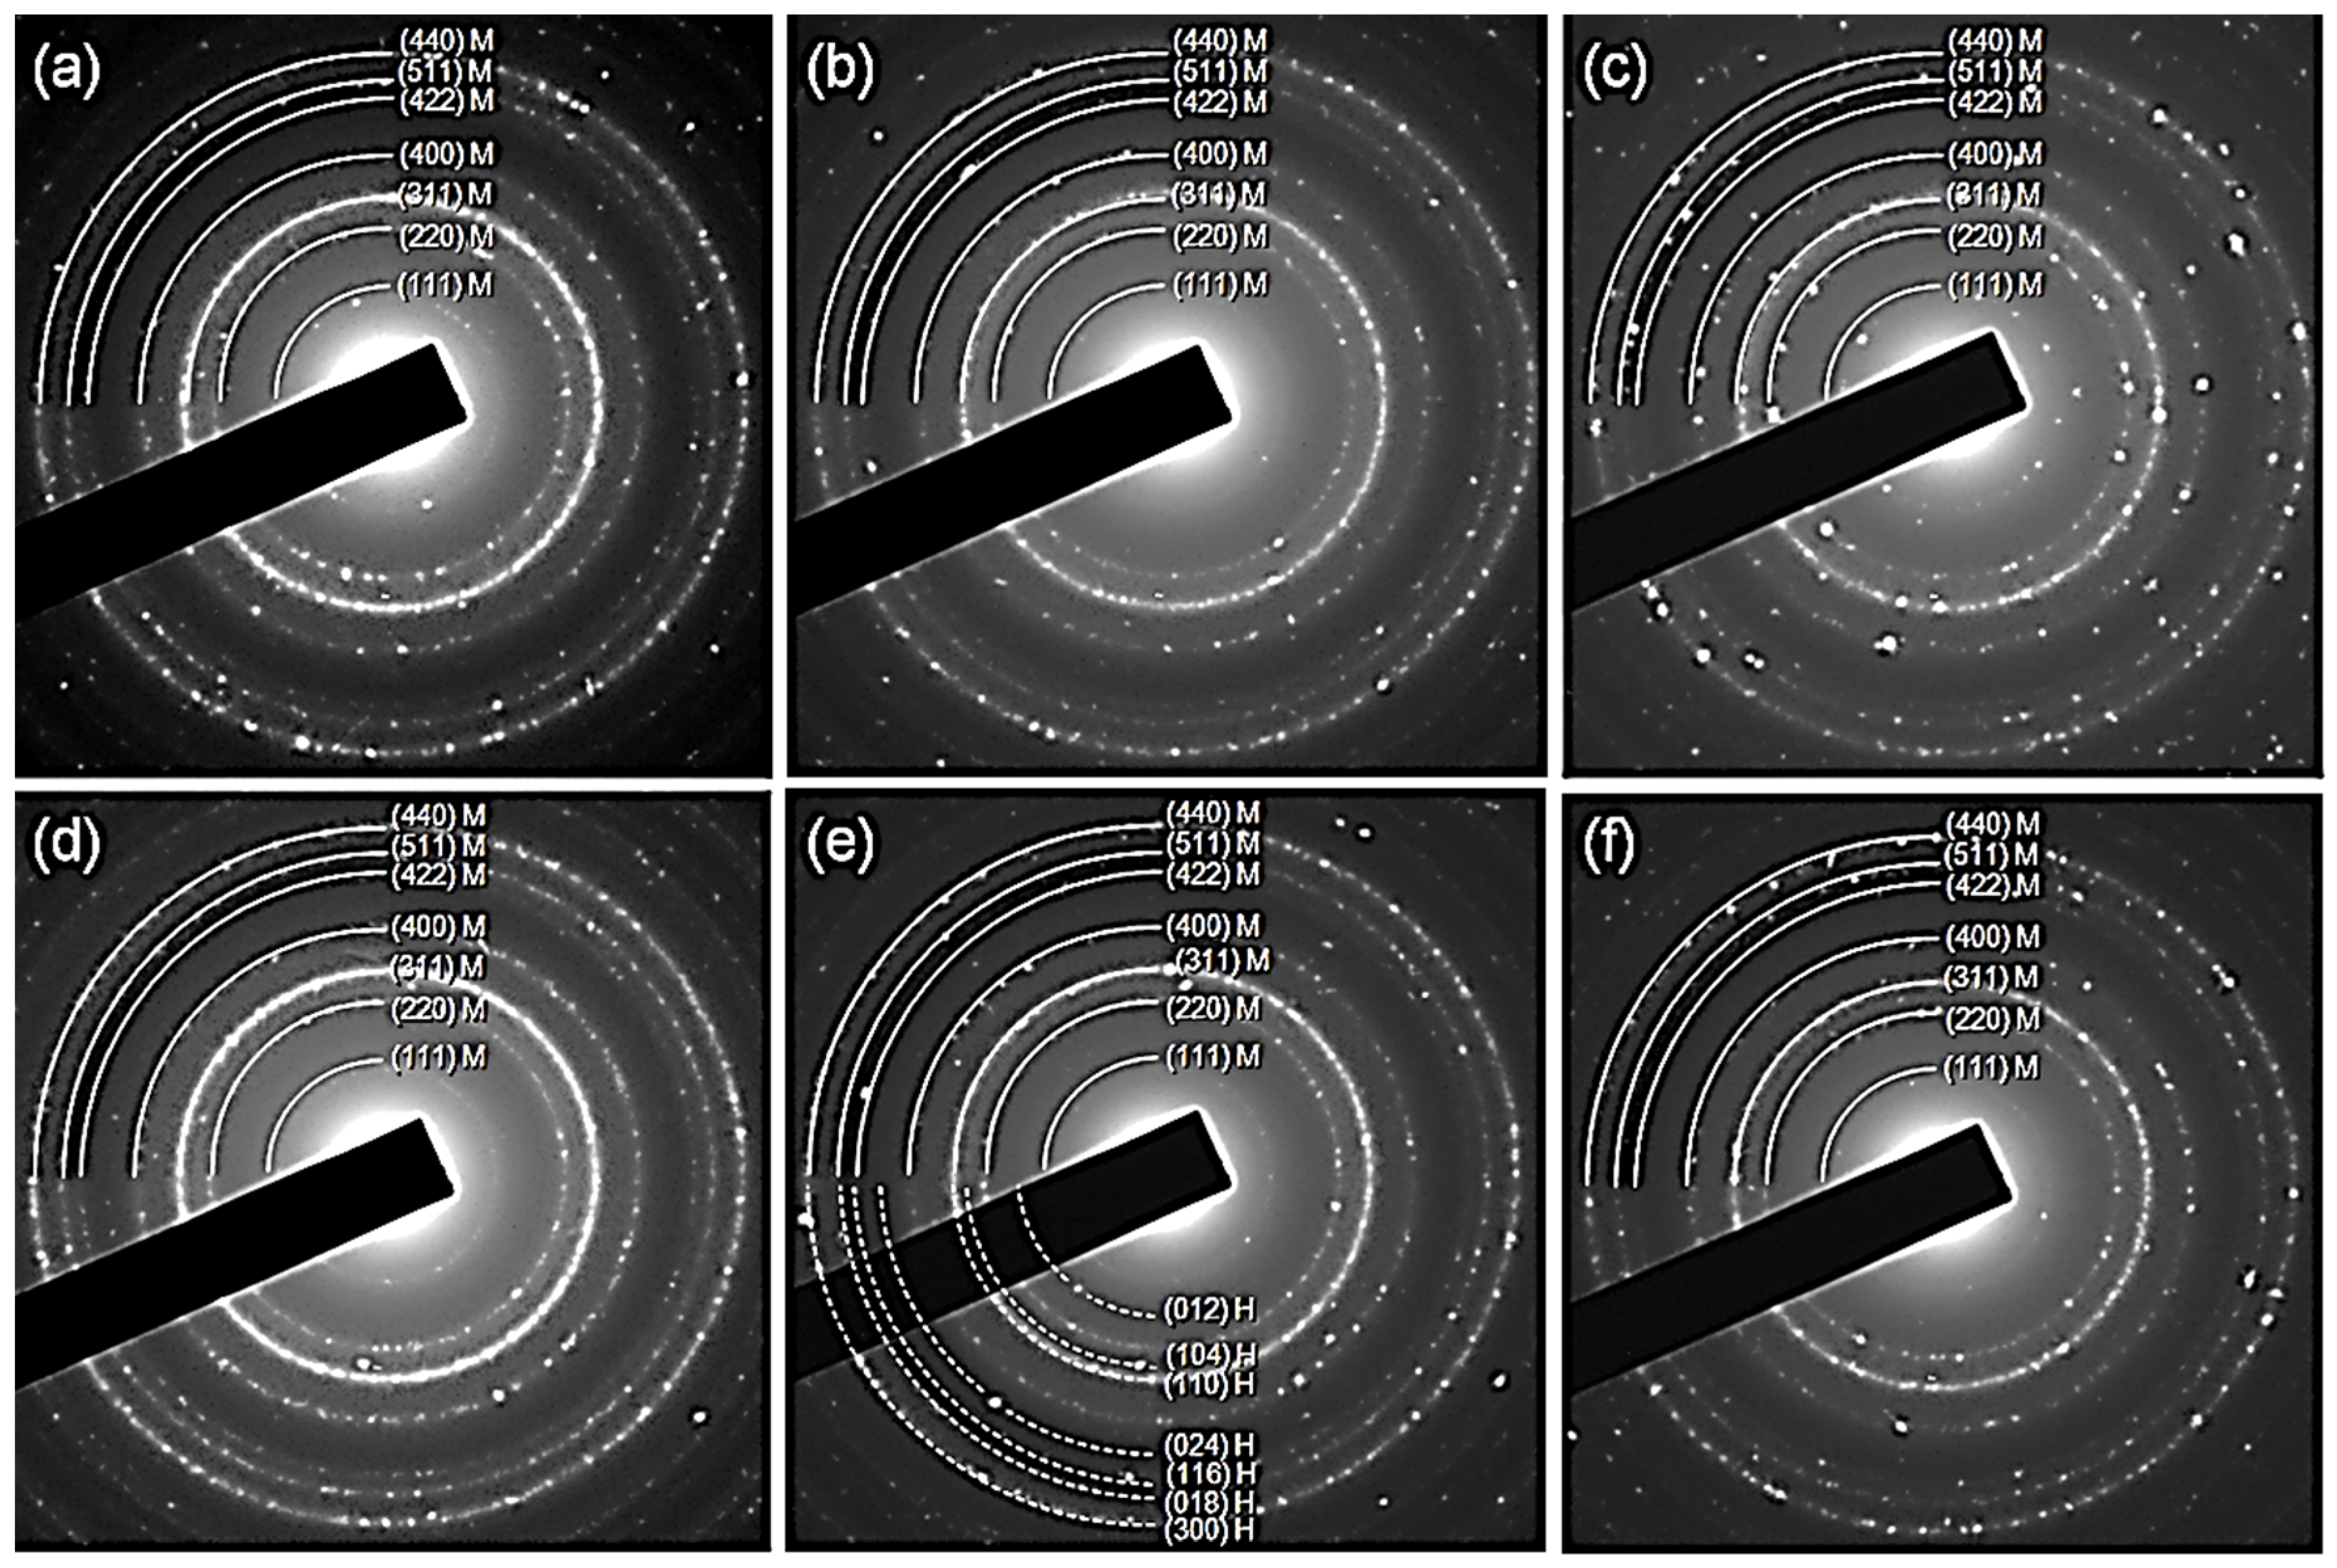
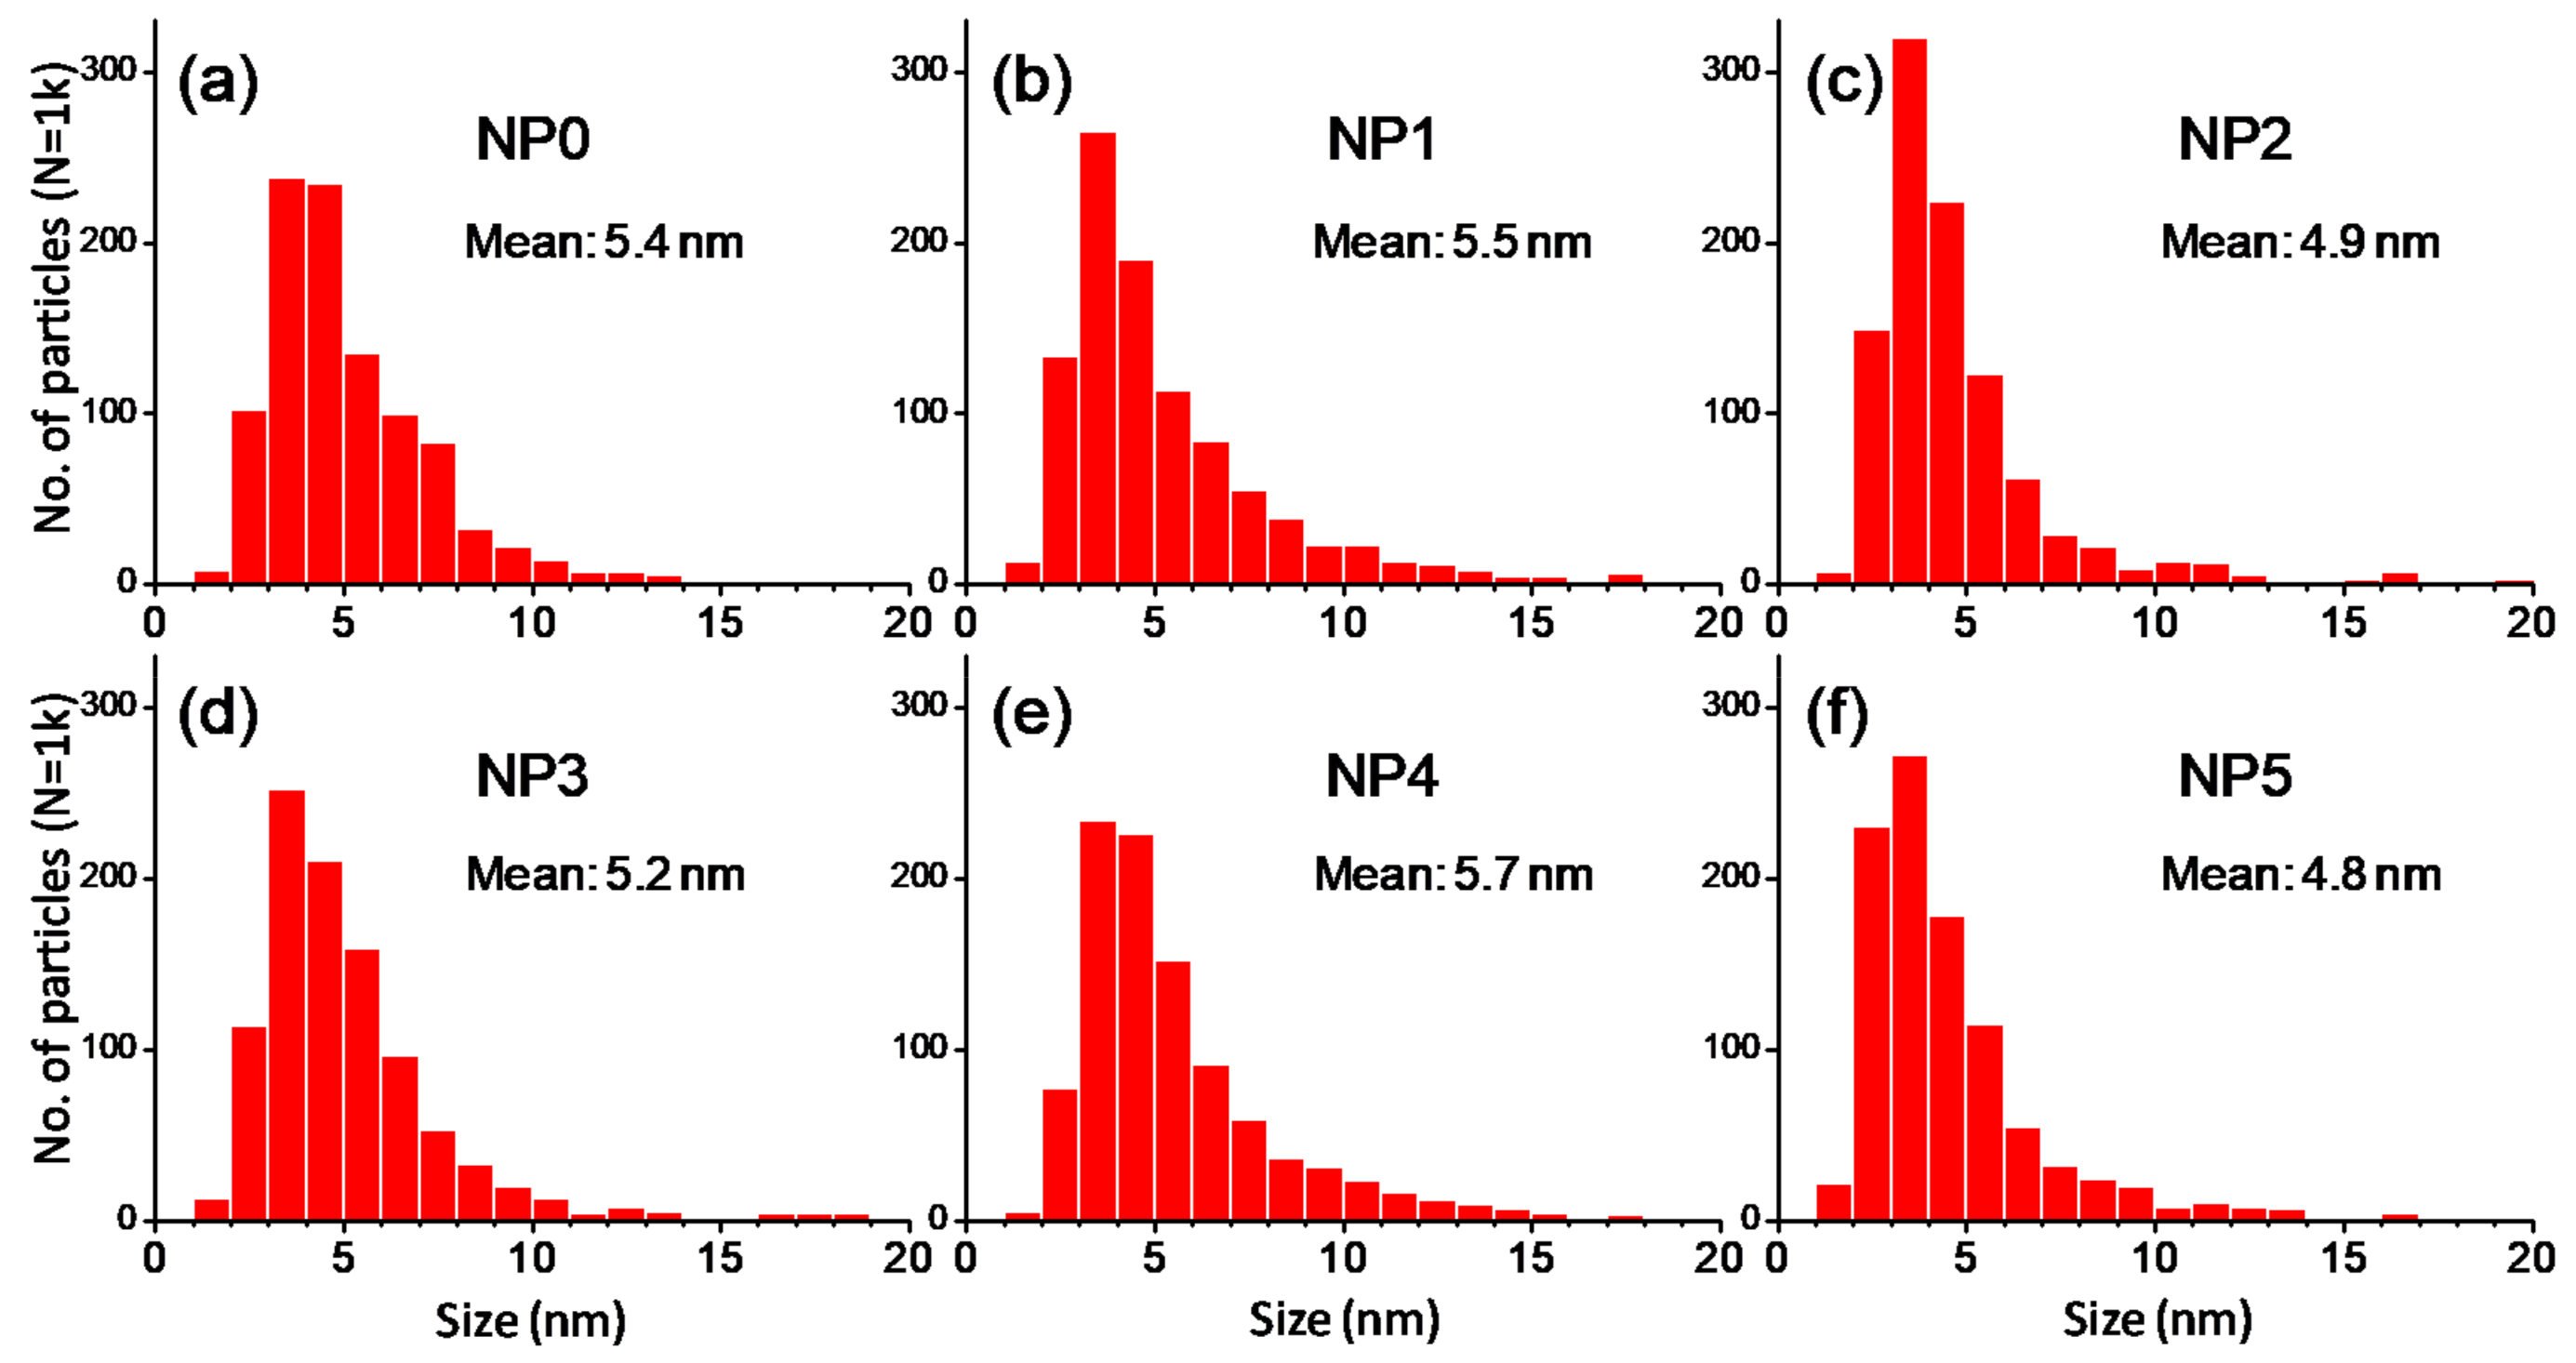
3.2. Transmission Electron Microscopy
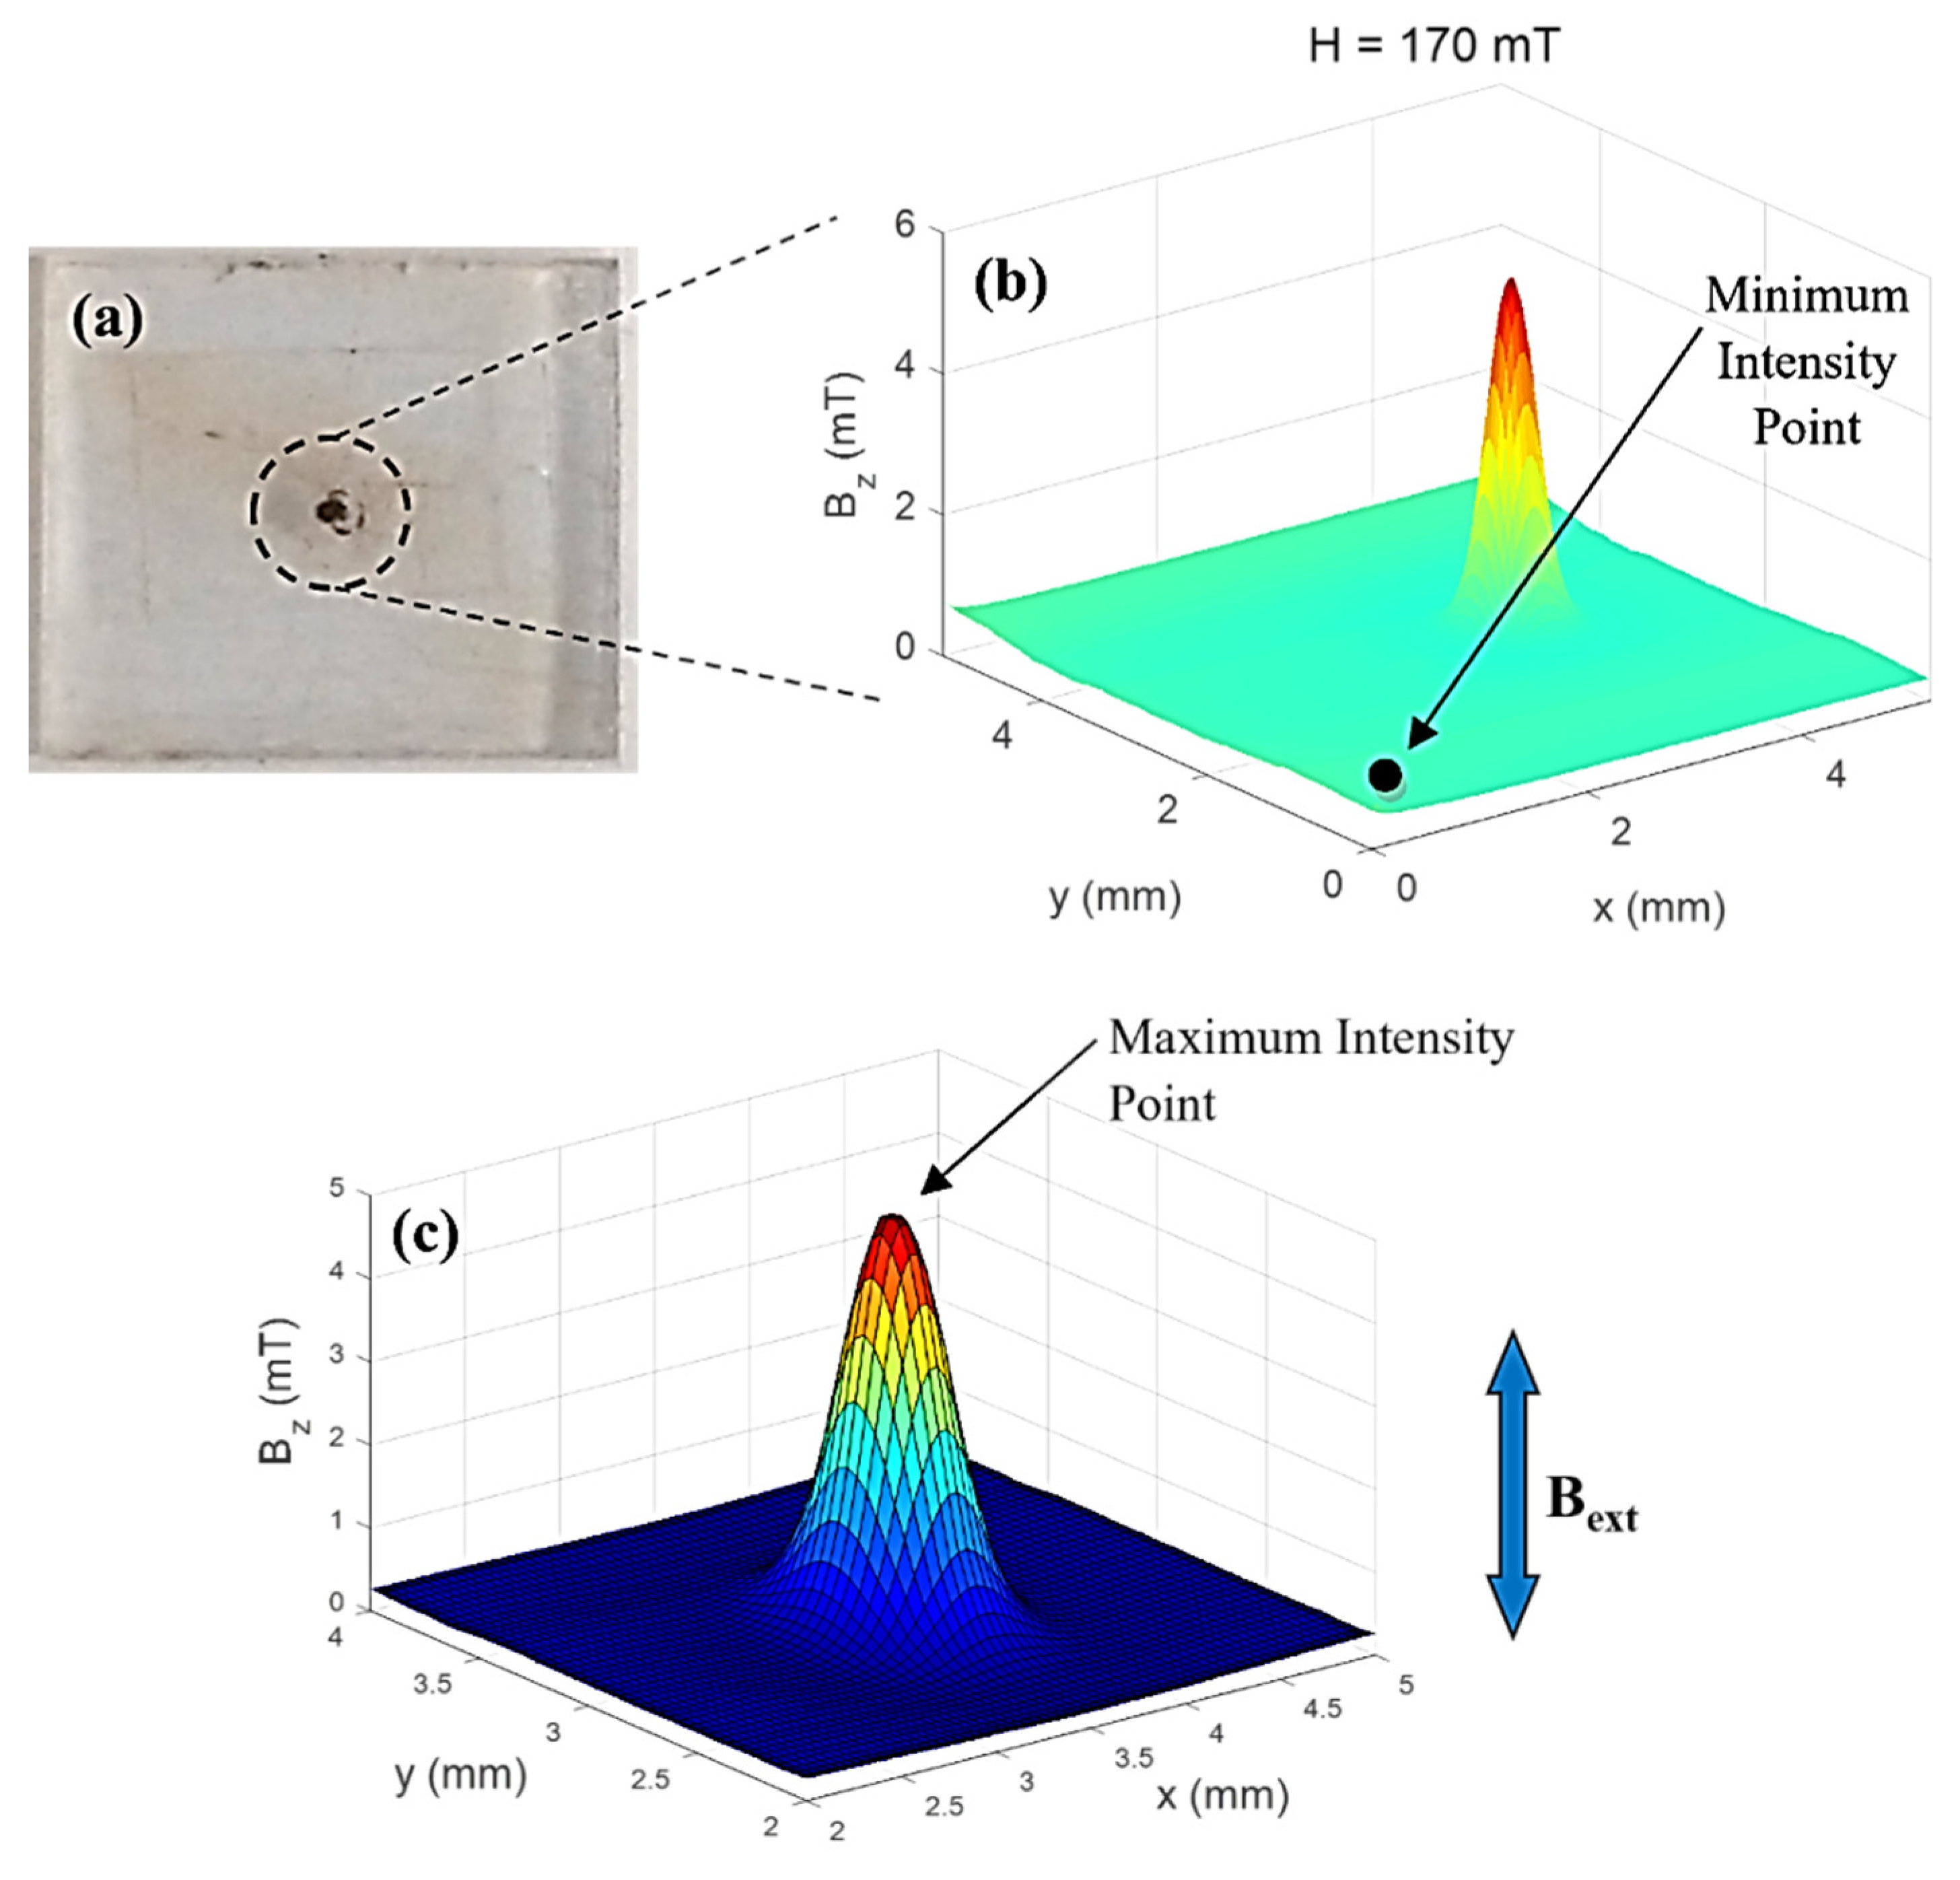
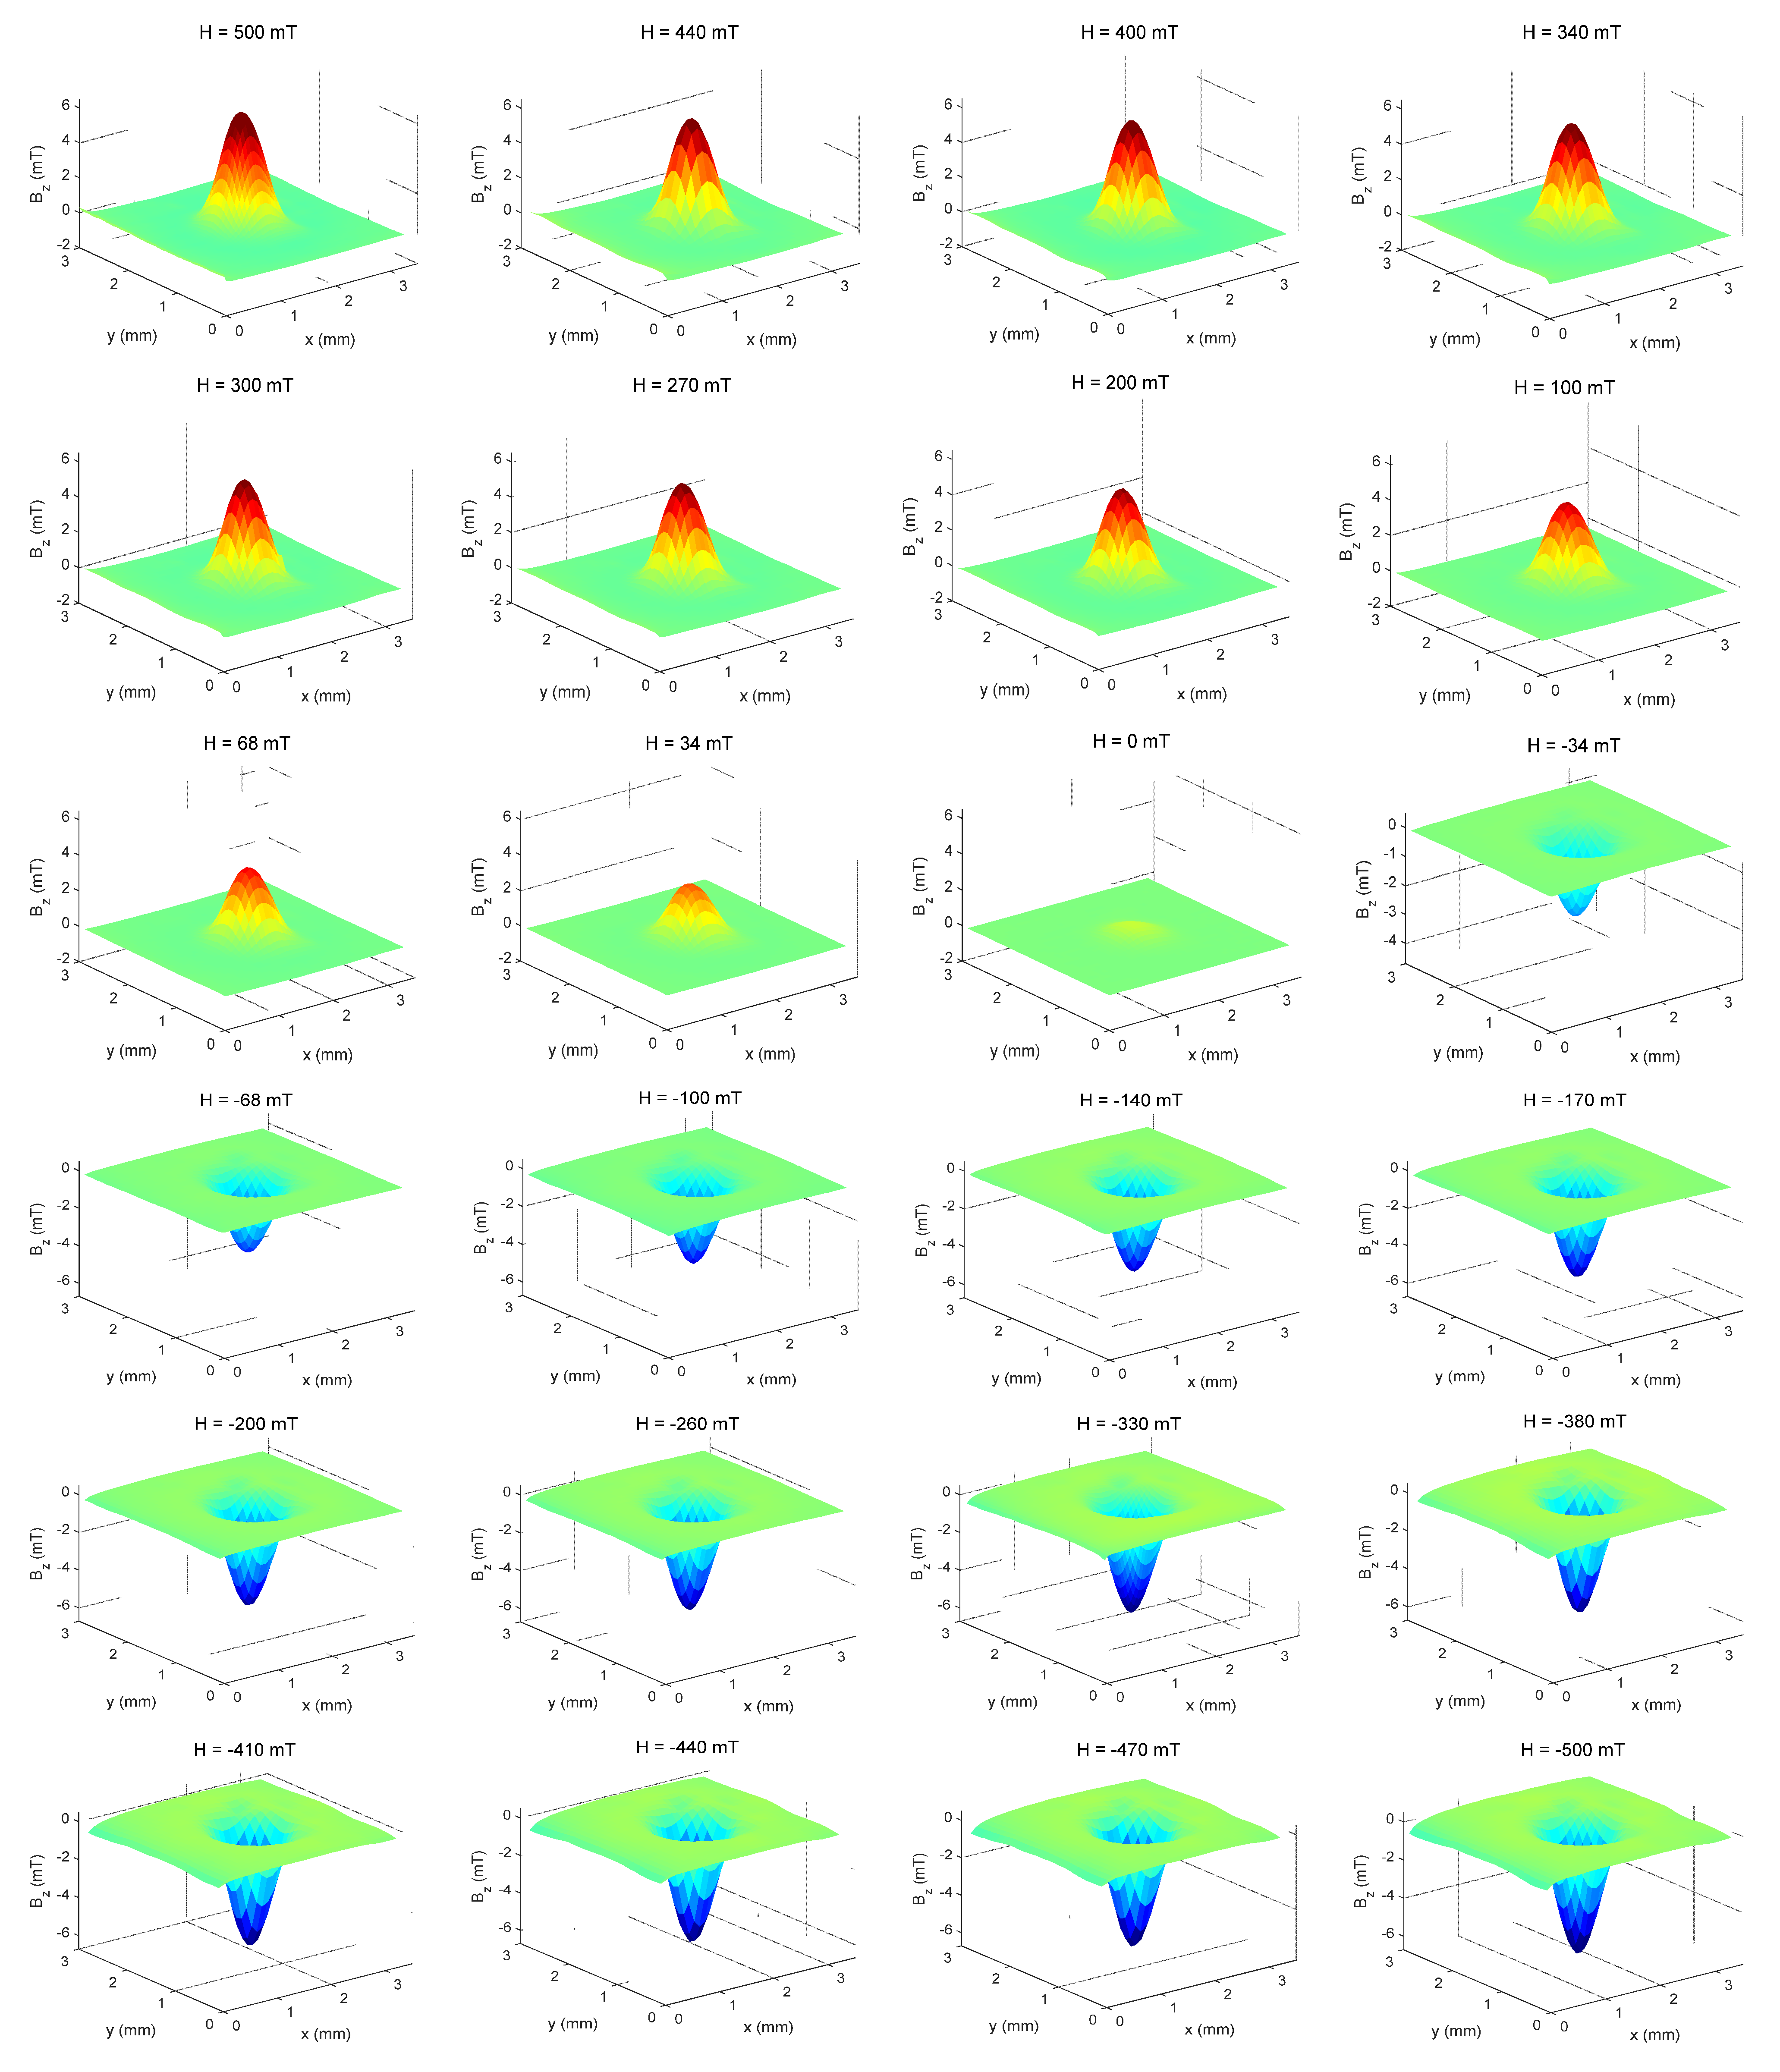
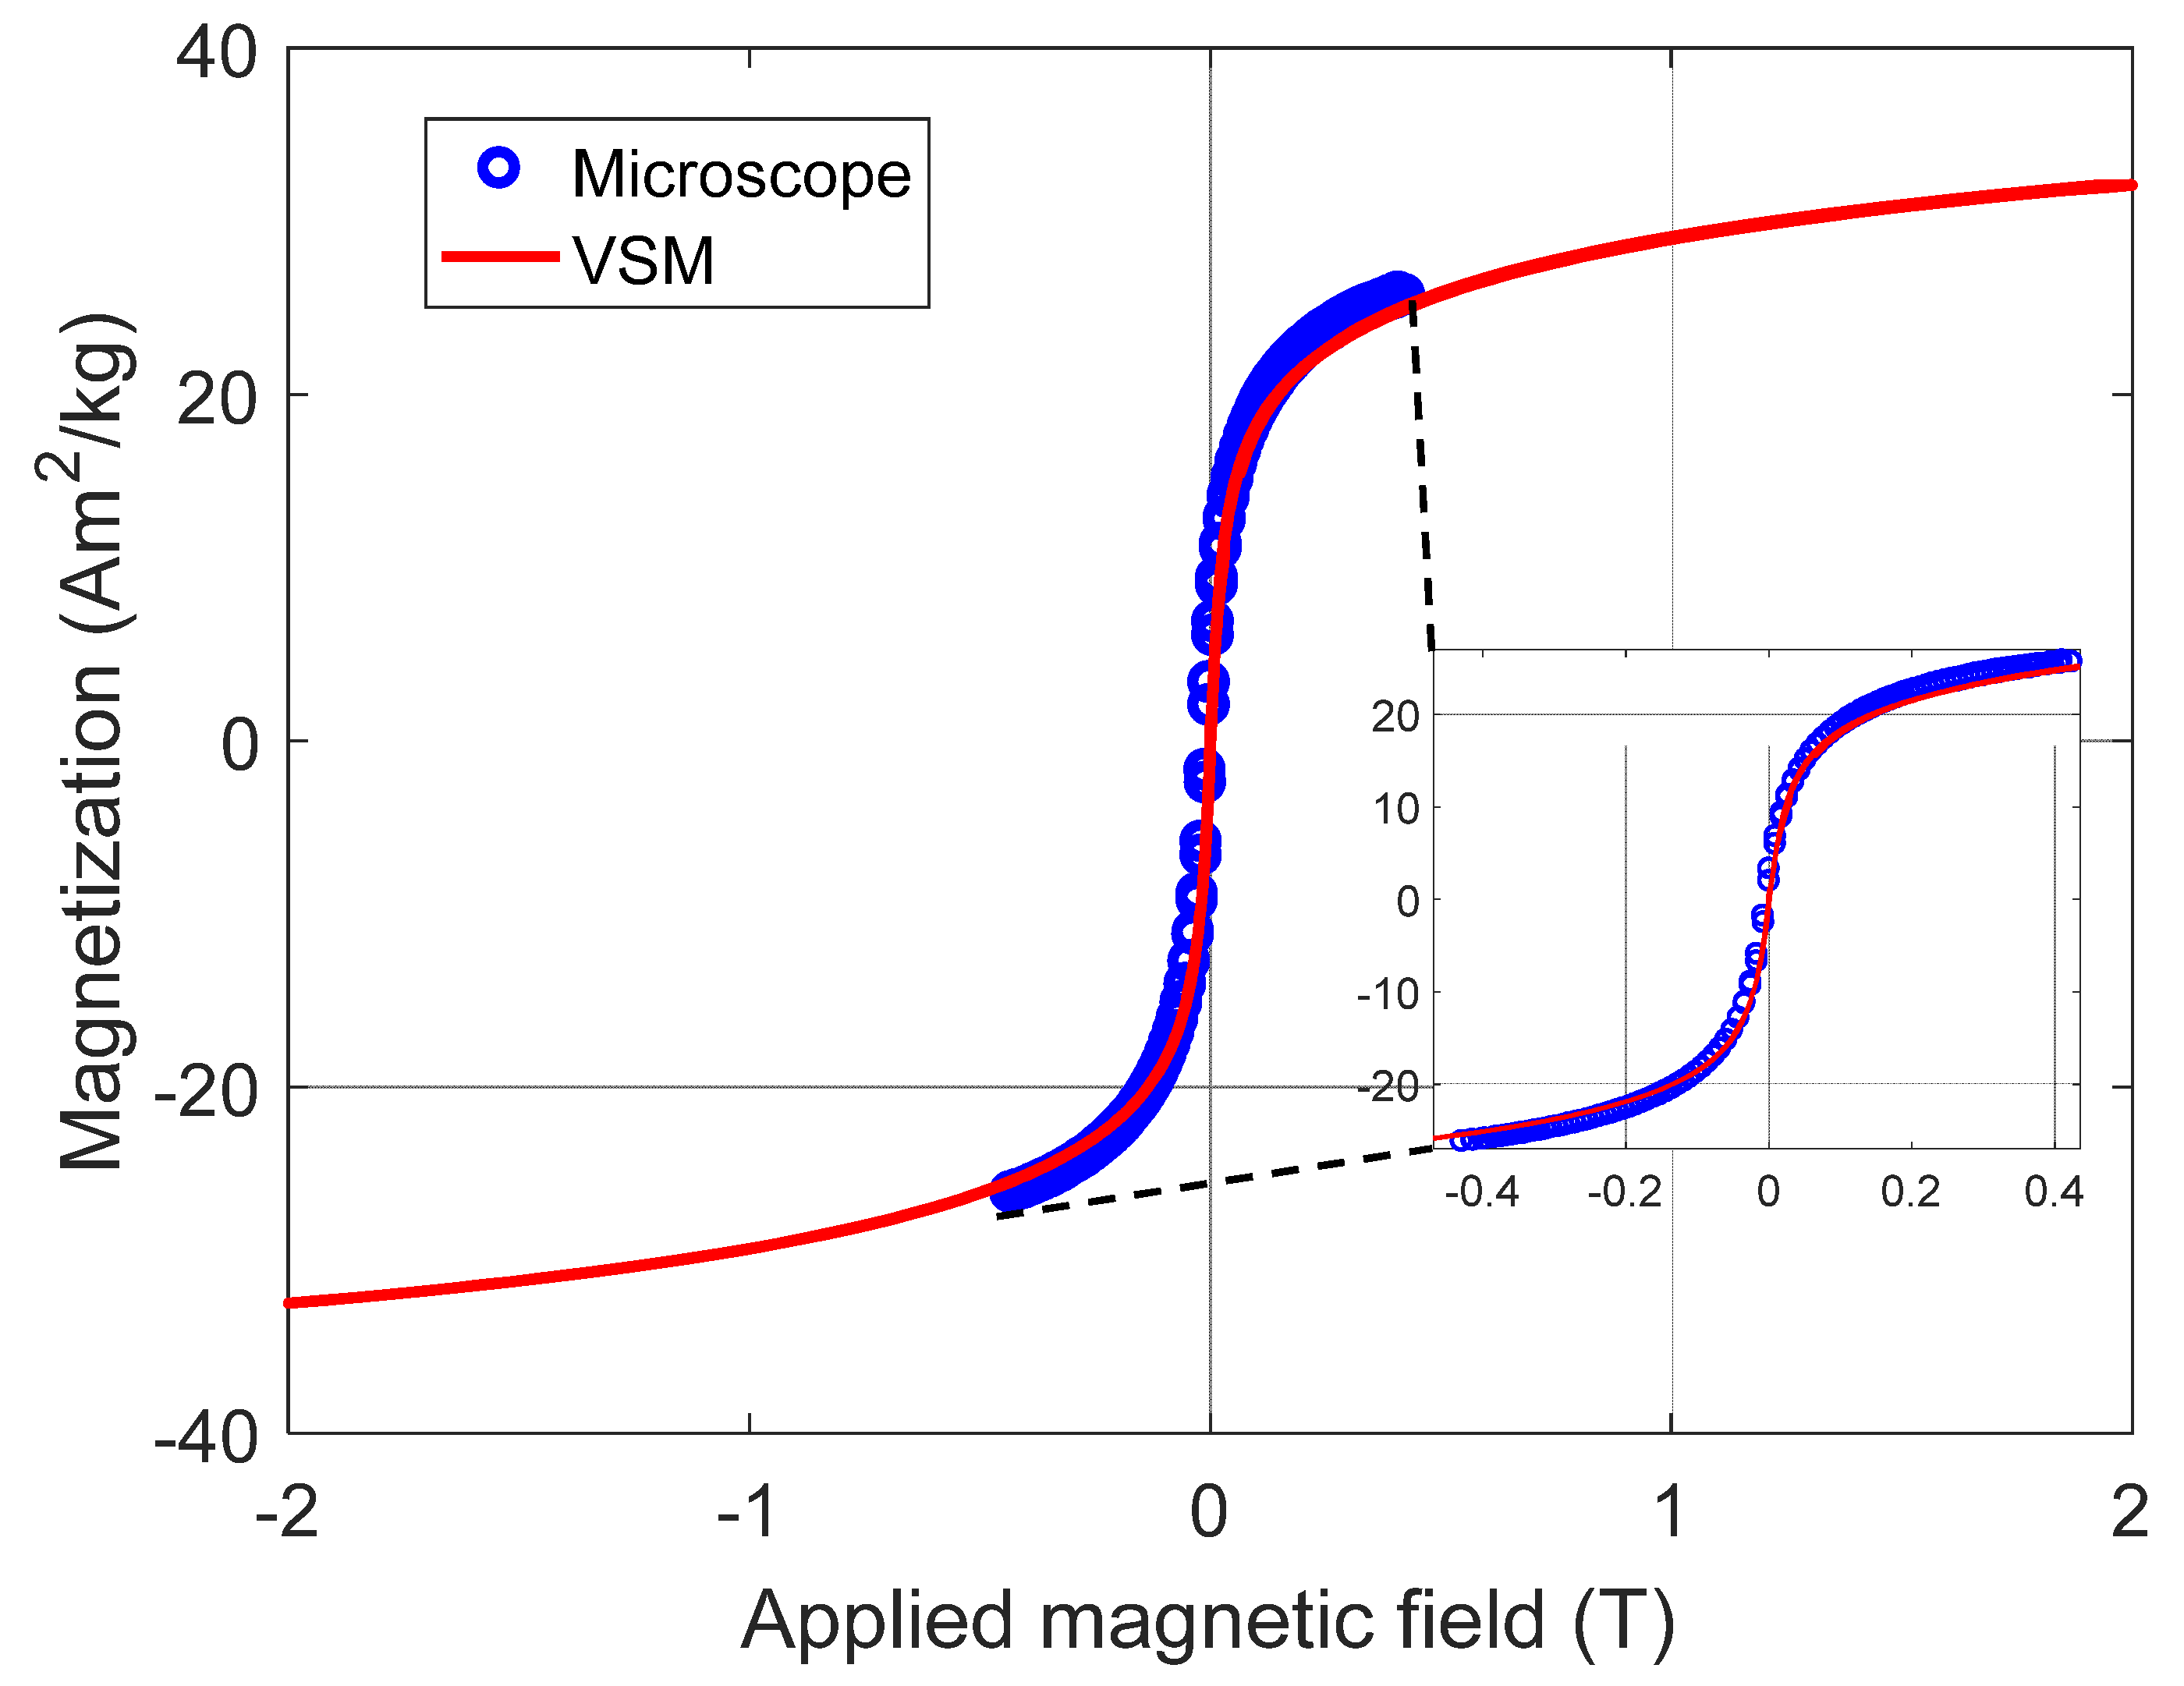
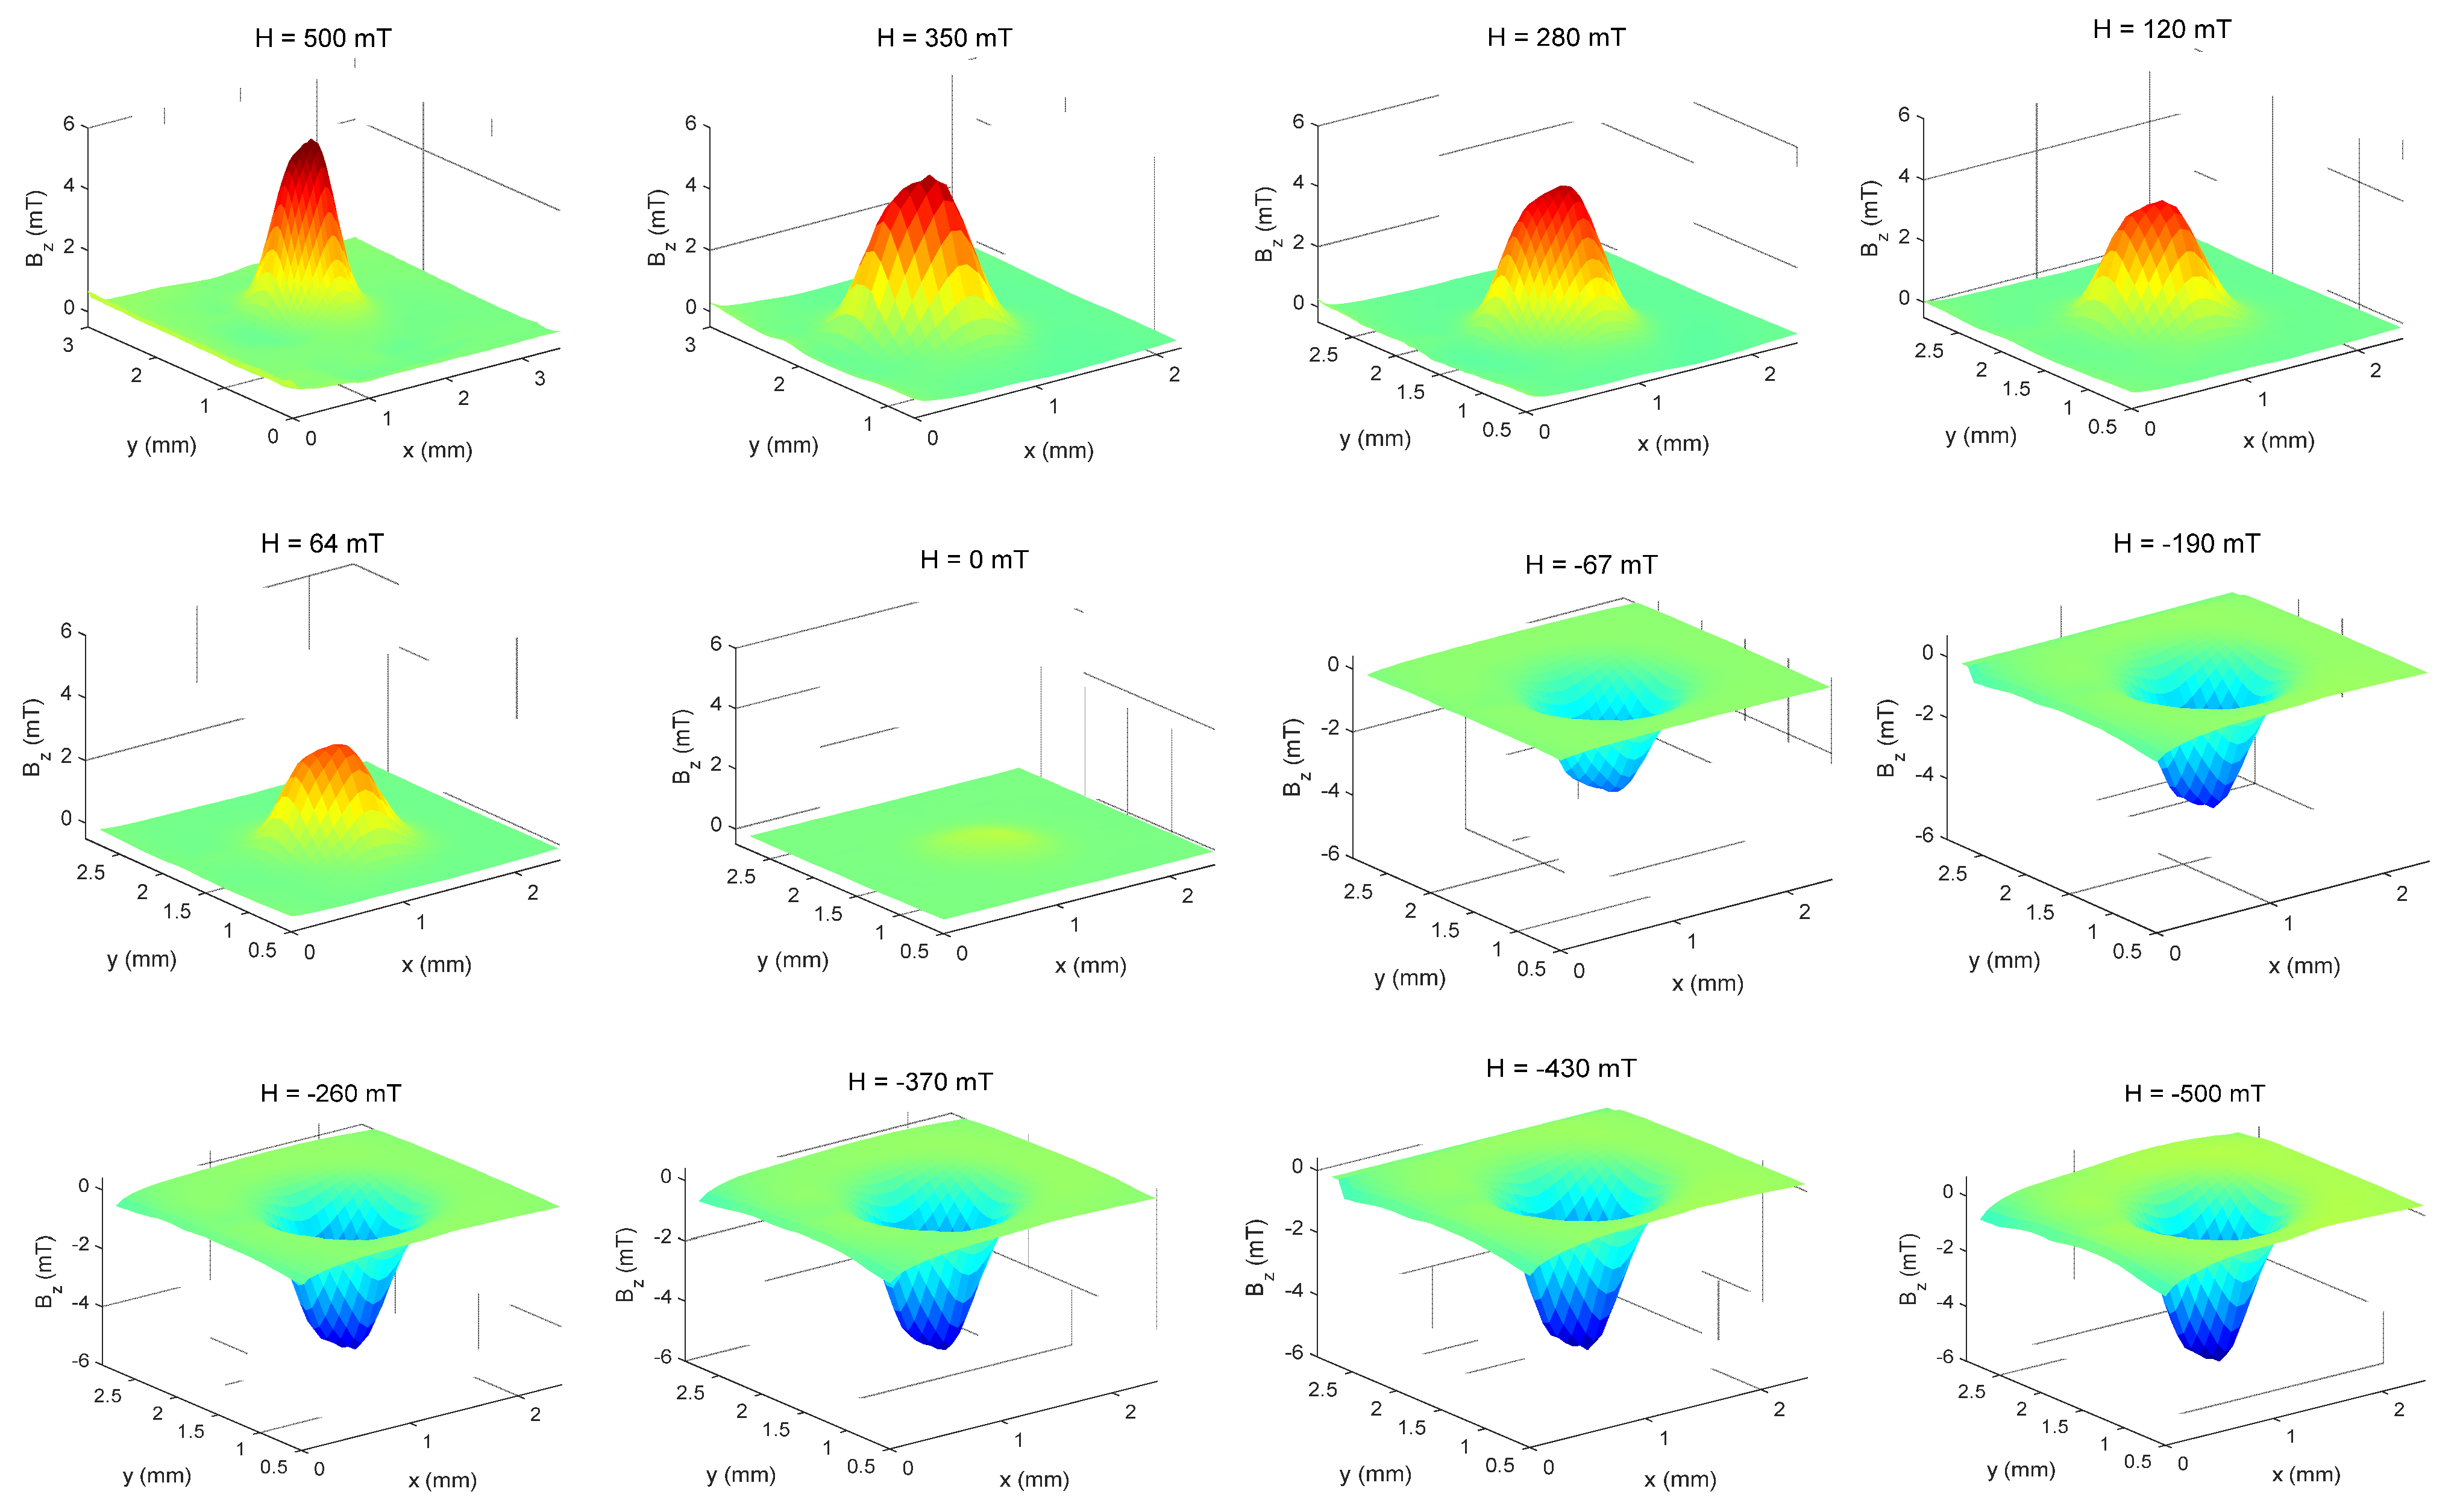
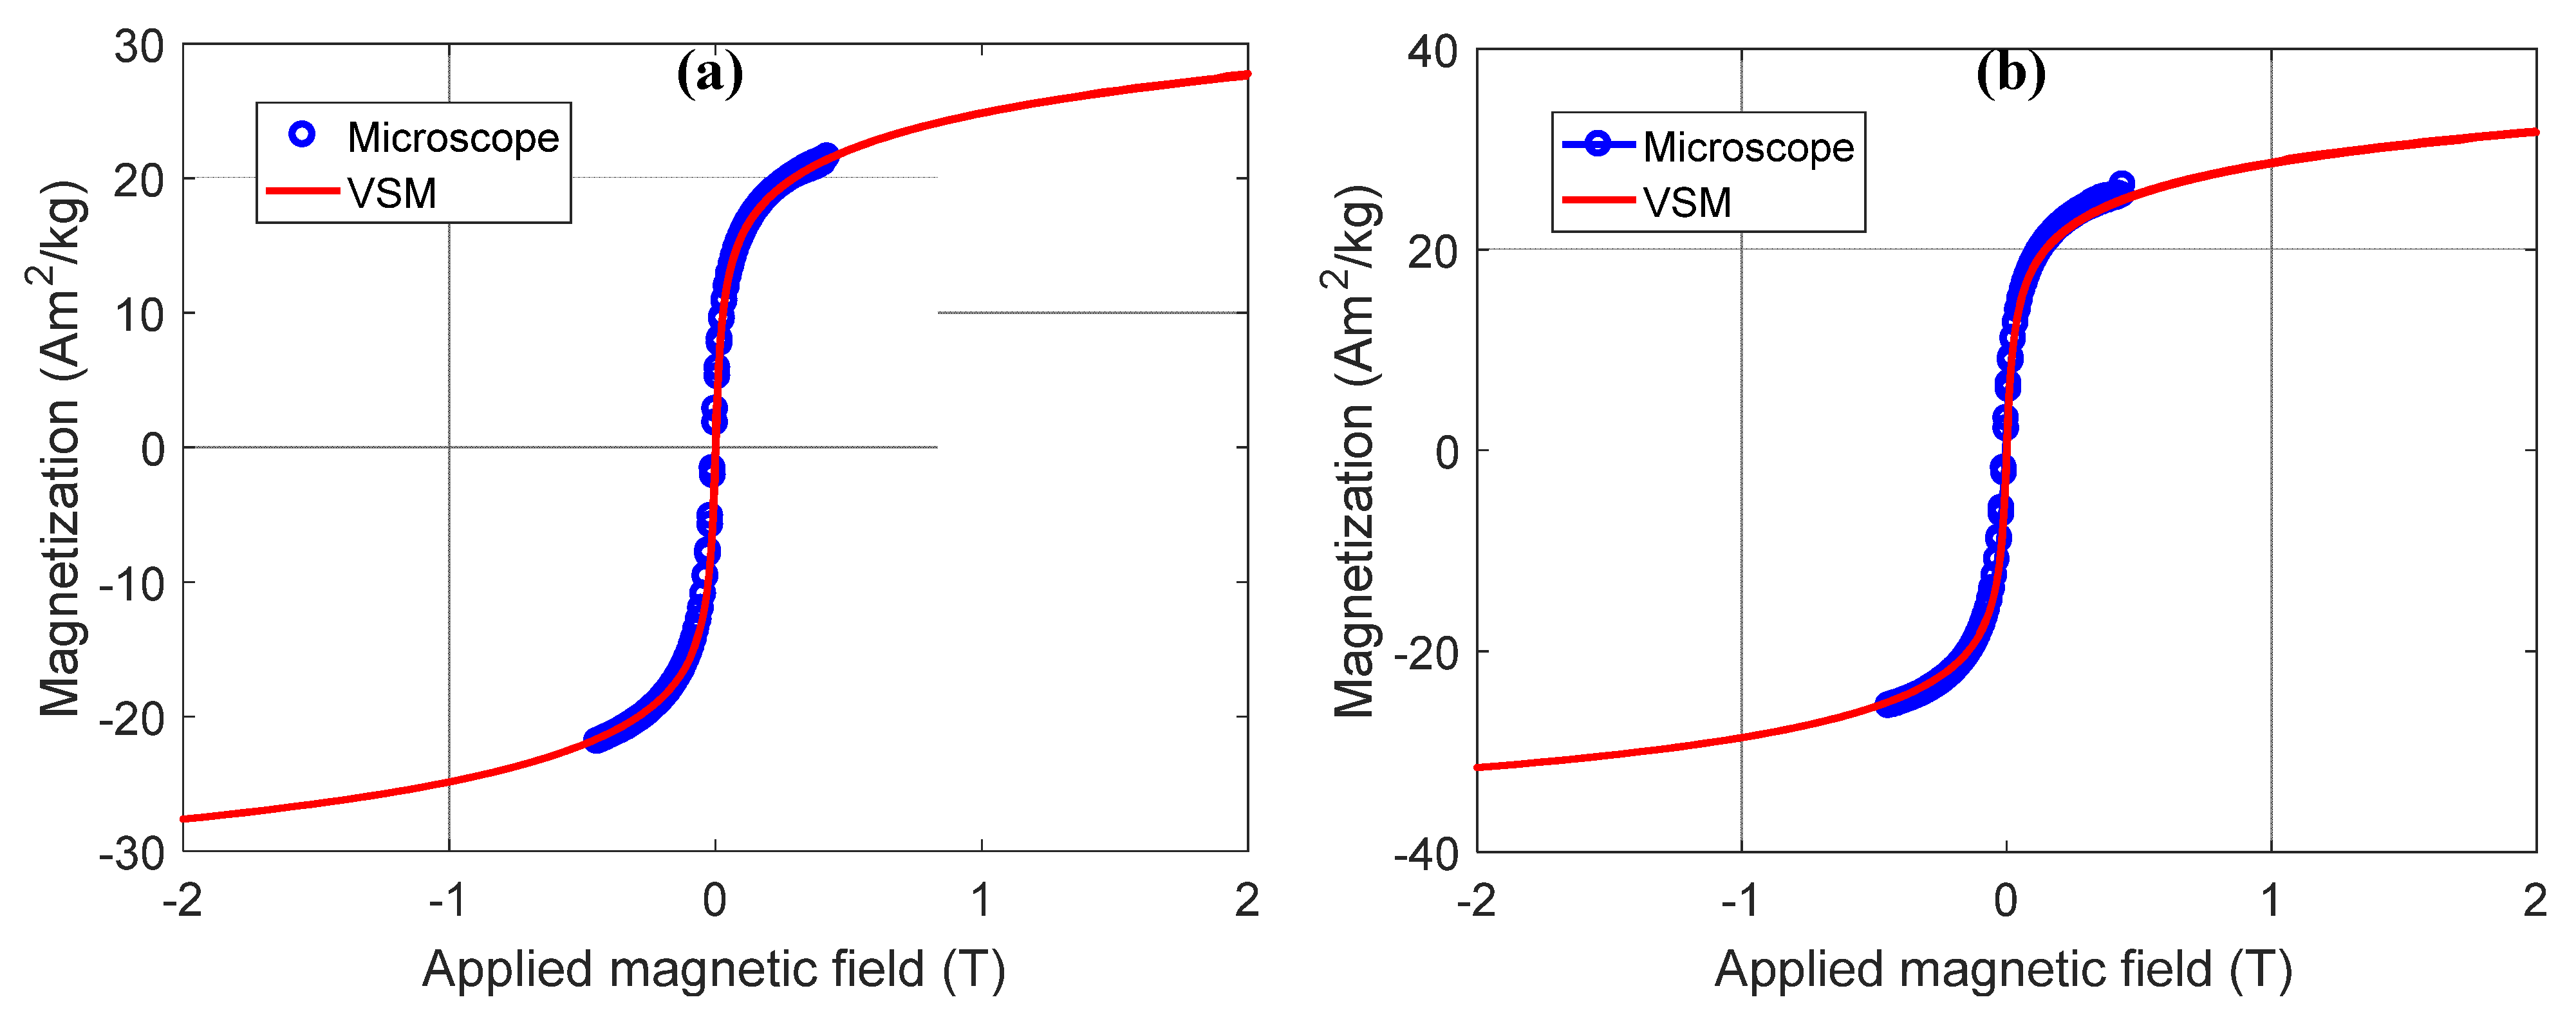
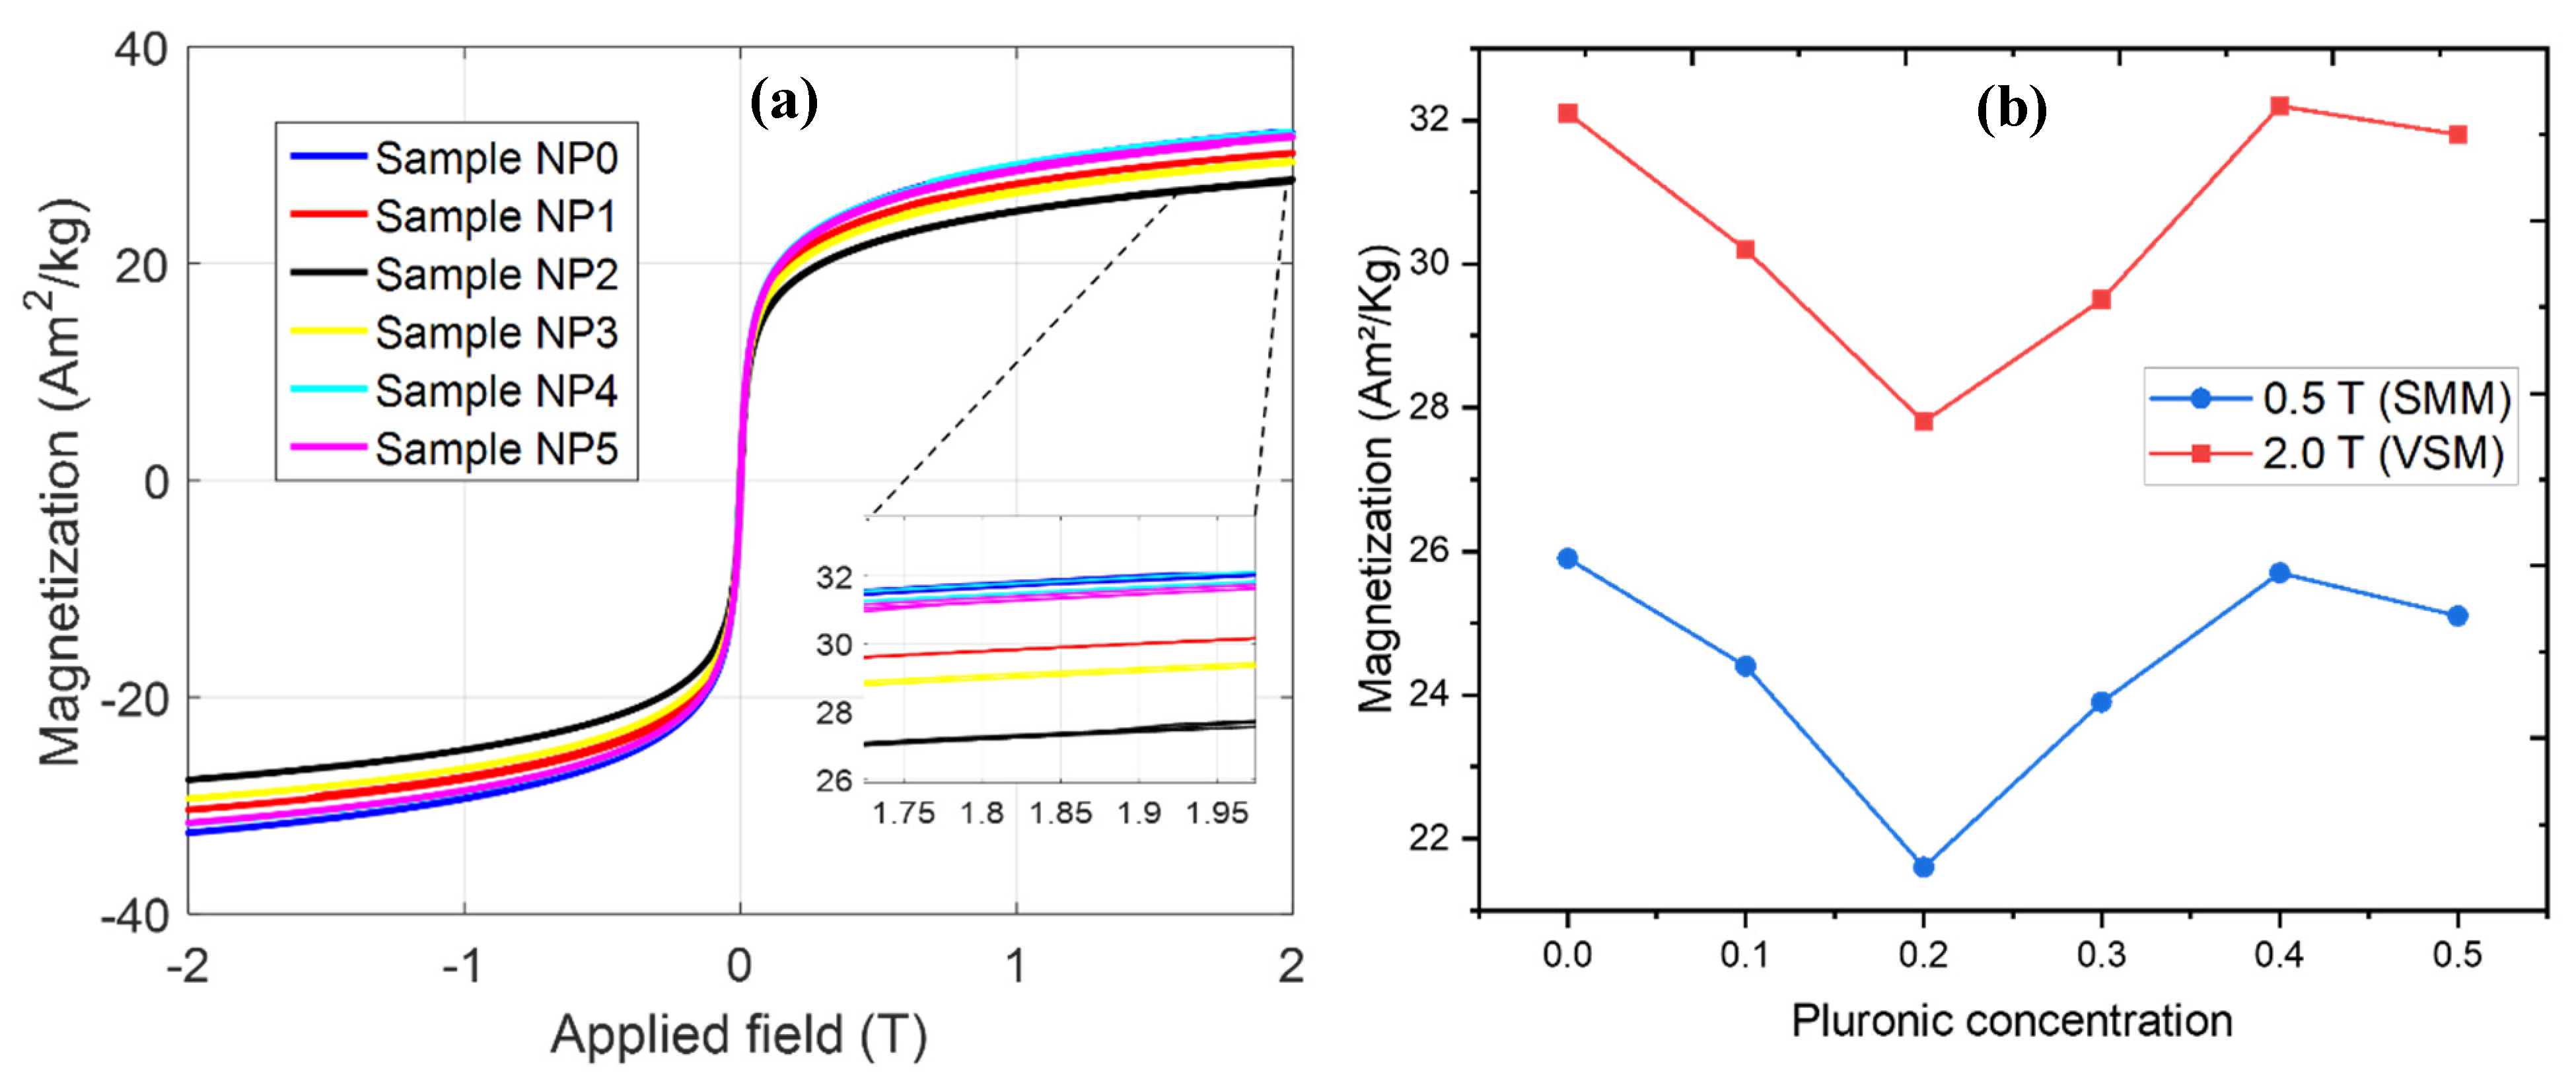
3.3. Magnetometer and Scanning Magnetic Microscope
4. Conclusions
Author Contributions
Funding
Data Availability Statement
Acknowledgments
Conflicts of Interest
References
- Shi, D. NanoScience in Biomedicine; Springer: Berlin/Heidelberg, Germany, 2009. [Google Scholar]
- Beachley, V.; Wen, X. Stem Cells and Nanostructured Materials. In NanoScience in Biomedicine; Shi, D., Ed.; Springer: Berlin/Heidelberg, Germany, 2009. [Google Scholar]
- Park, K.; Park, W.H.; Son, J.S.; Han, D.K. Biomedical Polymer Nanofibers for Emerging Technology. In NanoScience in Biomedicine; Shi, D., Ed.; Springer: Berlin/Heidelberg, Germany, 2009. [Google Scholar]
- Sui, Z.; Murphy, W.L. Nanoscale Mechanisms for Assembly of Biomaterials. In NanoScience in Biomedicine; Shi, D., Ed.; Springer: Berlin/Heidelberg, Germany, 2009. [Google Scholar]
- Arsalani, S.; Guidelli, E.J.; Silveira, M.A.; Salmon, C.E.G.; Araujo, J.F.D.F.; Bruno, A.C.; Baffa, O. Magnetic Fe3O4 nanoparticles coated by natural rubber latex as MRI contrast agent. J. Magn. Magn. Mater. 2019, 475, 458–464. [Google Scholar] [CrossRef]
- Eivazzadeh-Keihan, R.; Bahreinizad, H.; Amiri, Z.; Aliabadi, H.A.M.; Salimi-Bani, M.; Nakisa, A.; Davoodi, F.; Tahmasebi, B.; Ahmadpour, F.; Radinekiyan, F.; et al. Functionalized magnetic nanoparticles for the separation and purification of proteins and peptides. Trends Anal. Chem. 2021, 141, 116291. [Google Scholar] [CrossRef]
- Ivanova, A.V.; Nikitin, A.A.; Gabashvily, A.N.; Vishnevskiy, D.A.; Abakumov, M.A. Synthesis and intensive analysis of antibody labeled single core magnetic nanoparticles for targeted delivery to the cell membrane. J. Magn. Magn. Mater. 2021, 521, 167487. [Google Scholar] [CrossRef]
- Katz, E. Synthesis, Properties and Applications of Magnetic Nanoparticles and Nanowires—A Brief Introduction. Magnetochemistry 2019, 5, 61. [Google Scholar] [CrossRef] [Green Version]
- Ohki, A.; Saito, S.; Fukuchi, K. Magnetic resonance imaging of umbilical cord stem cells labeled with superparamagnetic iron oxide nanoparticles: Effects of labelling and transplantation parameters. Sci. Rep. 2020, 10, 13684. [Google Scholar] [CrossRef]
- Vasilichin, V.A.; Tsymbal, S.A.; Fakhardo, A.F.; Anastasova, E.I.; Marchenko, A.S.; Shtil, A.A.; Vinogradov, V.V.; Koshel, E.I. Effects of Metal Oxide Nanoparticles on Toll-Like Receptor mRNAs in Human Monocytes. Nanomaterials 2020, 10, 127. [Google Scholar] [CrossRef] [Green Version]
- Zeleňáková, A.; Szűcsová, J.; Nagy, Ľ.; Girman, V.; Zeleňák, V.; Huntošová, V. Magnetic Characterization and Moderate Cytotoxicity of Magnetic Mesoporous Silica Nanocomposite for Drug Delivery of Naproxen. Nanomaterials 2021, 11, 901. [Google Scholar] [CrossRef] [PubMed]
- Bernad, S.I.; Craciunescu, I.; Sandhu, G.S.; Dragomir-Daescu, D.; Tombacz, E.; Vekas, L.; Turcu, R. Fluid targeted delivery of functionalized magnetoresponsive nanocomposite particles to a ferromagnetic stent. J. Magn. Magn. Mater. 2021, 519, 167489. [Google Scholar] [CrossRef]
- Gomes, H.I.O.; Martins, C.S.M.; Prior, J.A.V. Silver Nanoparticles as Carriers of Anticancer Drugs for Efficient Target Treatment of Cancer Cells. Nanomaterials 2021, 11, 964. [Google Scholar] [CrossRef]
- Liu, Y.-L.; Chen, D.; Shang, P.; Yin, D.-C. A review of magnet systems for targeted drug delivery. J. Control. Release 2019, 302, 90–104. [Google Scholar] [CrossRef]
- Nguyen, K.; Nuß, B.; Mühlberger, M.; Unterweger, H.; Friedrich, R.; Alexiou, C.; Janko, C. Superparamagnetic Iron Oxide Nanoparticles Carrying Chemotherapeutics Improve Drug Efficacy in Monolayer and Spheroid Cell Culture by Enabling Active Accumulation. Nanomaterials 2020, 10, 1577. [Google Scholar] [CrossRef]
- Favela-Camacho, S.E.; Samaniego-Benítez, E.J.; Godínez-García, A.; Avilés-Arellano, L.M.; Pérez-Robles, J.F. How to decrease the agglomeration of magnetite nanoparticles and increase their stability using surface properties. Colloids Surf. A Physicochem. Eng. Asp. 2019, 574, 29–35. [Google Scholar] [CrossRef]
- Arsalani, S.; Guidelli, E.J.; Araujo, J.F.D.F.; Bruno, A.C.; Baffa, O. Green Synthesis and Surface Modification of Iron Oxide Nanoparticles with Enhanced Magnetization Using Natural Rubber Latex. ACS Sustain. Chem. Eng. 2018, 6, 13756–13765. [Google Scholar] [CrossRef]
- Diaz-Diestra, D.; Thapa, B.; Badillo-Diaz, D.; Beltran-Huarac, J.; Morell, G.; Weiner, B. Graphene Oxide/ZnS:Mn Nanocomposite Functionalized with Folic Acid as a Nontoxic and Effective Theranostic Platform for Breast Cancer Treatment. Nanomaterials 2018, 8, 484. [Google Scholar] [CrossRef] [PubMed] [Green Version]
- Laurent, S.; Forge, D.; Port, M.; Roch, A.; Robic, C.; Vander Elst, L.; Muller, R.N. Magnetic Iron Oxide Nanoparticles: Synthesis, Stabilization, Vectorization, Physicochemical Characterizations, and Biological Applications. Chem. Rev. 2008, 108, 2064–2110. [Google Scholar] [CrossRef]
- Vayssières, L.; Chanéac, C.; Tronc, E.; Jolivet, J.P. Size Tailoring of Magnetite Particles Formed by Aqueous Precipitation: An Example of Thermodynamic Stability of Nanometric Oxide Particles. J. Colloid Interface Sci. 1998, 205, 205–212. [Google Scholar] [CrossRef]
- Cushing, B.L.; Kolesnichenko, V.L.; O’Connor, C.J. Recent Advances in the Liquid-Phase Syntheses of Inorganic Nanoparticles. Chem. Rev. 2004, 104, 3893–3946. [Google Scholar] [CrossRef] [PubMed]
- De Faria, D.L.A.; Venâncio Silva, S.; de Oliveira, M.T. Raman microspectroscopy of some iron oxides and oxyhydroxides. J. Raman Spectrosc. 1997, 28, 873–878. [Google Scholar] [CrossRef]
- Ram, J.; Singh, R.G.; Gupta, R.; Kumar, V.; Singh, F.; Kumar, R. Effect of Annealing on the Surface Morphology, Optical and and Structural Properties of Nanodimensional Tungsten Oxide Prepared by Coprecipitation Technique. J. Electron. Mater. 2019, 48, 1174–1183. [Google Scholar] [CrossRef]
- Alula, M.T.; Mengesha, Z.T.; Mwenesongole, E. Advances in surface-enhanced Raman spectroscopy for analysis of pharmaceuticals: A review. Vib. Spectrosc. 2018, 98, 50–63. [Google Scholar] [CrossRef]
- Khan, M.A.M.; Kumar, S.; Alhazaa, A.N.; Al-Gawati, M.A. Modifications in structural, morphological, optical and photocatalytic properties of ZnO:Mn nanoparticles by sol-gel protocol. Mater. Sci. Semicond. Process. 2018, 87, 134–141. [Google Scholar] [CrossRef]
- Kusior, A.; Banas, J.; Trenczek-Zajac, A.; Zubrzycka, P.; Micek-Ilnicka, A.; Radecka, M. Structural properties of TiO2 nanomaterials. J. Mol. Struct. 2018, 1157, 327–336. [Google Scholar] [CrossRef]
- Patil, M.K.; Gaikwad, S.H.; Mukherjee, S.P. Phase- and Morphology-Controlled Synthesis of Tunable Plasmonic MoO3–x Nanomaterials for Ultrasensitive Surface-Enhanced Raman Spectroscopy Detection. J. Phys. Chem. C 2020, 124, 21082–21093. [Google Scholar] [CrossRef]
- Lima, C.D.A.; Moura, J.V.B.; Pinheiro, G.S.; Araujo, J.F.D.F.; Gusmão, S.B.S.; Viana, B.C.; Freire, P.T.C.; Luz-Lima, C. Co-doped α-MoO3 hierarchical microrods: Synthesis, structure and phonon properties. Ceram. Int. 2021, 47, 27778–27788. [Google Scholar] [CrossRef]
- Hossain, M.; Wu, J.; Wen, W.; Liu, H.; Wang, X.; Xie, L. Chemical Vapor Deposition of 2D Vanadium Disulfide and Diselenide and Raman Characterization of the Phase Transitions. Adv. Mater. Interfaces 2018, 5, 1800528. [Google Scholar] [CrossRef]
- Carvalho, I.P.; Sousa, R.B.; Matos, J.M.E.; Moura, J.V.B.; Freire, P.T.C.; Pinheiro, G.S.; Luz-Lima, C. Low-temperature induced phase transitions in BaWO4:Er3+ microcrystals: A Raman scattering study. J. Mol. Struct. 2020, 1204, 127498. [Google Scholar] [CrossRef]
- Shebanova, O.N.; Lazor, P. Raman study of magnetite (Fe3O4): Laser-induced thermal effects and oxidation. J. Raman Spectrosc. 2003, 34, 845–852. [Google Scholar] [CrossRef]
- El Mendili, Y.; Bardeau, J.-F.; Randrianantoandro, N.; Greneche, J.-M.; Grasset, F. Structural behavior of laser-irradiated γ-Fe2O3 nanocrystals dispersed in porous silica matrix : γ-Fe2O3 to α-Fe2O3 phase transition and formation of ε-Fe2O3. Sci. Technol. Adv. Mater. 2016, 17, 597–609. [Google Scholar] [CrossRef] [PubMed] [Green Version]
- Araujo, J.F.D.F.; Tahir; Arsalani, S.; Freire, F.L.; Mariotto, G.; Cremona, M.; Mendoza, L.A.F.; Luz-Lima, C.; Zaman, Q.; Del Rosso, T.; et al. Novel scanning magnetic microscopy method for the characterization of magnetic nanoparticles. J. Magn. Magn. Mater. 2020, 499, 166300. [Google Scholar] [CrossRef]
- Araujo, J.; Reis, A.; Oliveira, V.; Santos, A.; Luz-Lima, C.; Yokoyama, E.; Mendoza, L.; Pereira, J.; Bruno, A. Characterizing Complex Mineral Structures in Thin Sections of Geological Samples with a Scanning Hall Effect Microscope. Sensors 2019, 19, 1636. [Google Scholar] [CrossRef] [PubMed] [Green Version]
- Araujo, J.F.D.F.; Reis, A.L.A.; Correa, A.A.P.; Yokoyama, E.; Oliveira, V.C.; Mendoza, L.A.F.; Pacheco, M.A.C.; Luz-Lima, C.; Santos, A.F.; Osorio, F.G.; et al. Scanning Magnetic Microscope Using a Gradiometric Configuration for Characterization of Rock Samples. Materials 2019, 12, 4154. [Google Scholar] [CrossRef] [Green Version]
- Ramazanov, S.; Sobola, D.; Orudzhev, F.; Knápek, A.; Polčák, J.; Potoček, M.; Kaspar, P.; Dallaev, R. Surface modification and enhancement of ferromagnetism in BiFeO3 nanofilms deposited on HOPG. Nanomaterials 2020, 10, 1990. [Google Scholar] [CrossRef] [PubMed]
- Iconaru, S.L.; Guégan, R.; Popa, C.L.; Motelica-Heino, M.; Ciobanu, C.S.; Predoi, D. Magnetite (Fe3O4) nanoparticles as adsorbents for As and Cu removal. Appl. Clay Sci. 2016, 134, 128–135. [Google Scholar] [CrossRef]
- Torres-Gómez, N.; Nava, O.; Argueta-Figueroa, L.; García-Contreras, R.; Baeza-Barrera, A.; Vilchis-Nestor, A.R. Shape Tuning of Magnetite Nanoparticles Obtained by Hydrothermal Synthesis: Effect of Temperature. J. Nanomater. 2019, 2019, 7921273. [Google Scholar] [CrossRef] [Green Version]
- Benhammada, A.; Trache, D.; Kesraoui, M.; Chelouche, S. Hydrothermal Synthesis of Hematite Nanoparticles Decorated on Carbon Mesospheres and Their Synergetic Action on the Thermal Decomposition of Nitrocellulose. Nanomaterials 2020, 10, 968. [Google Scholar] [CrossRef]
- Chandramohan, P.; Srinivasan, M.P.; Velmurugan, S.; Narasimhan, S.V. Cation distribution and particle size effect on Raman spectrum of CoFe2O4. J. Solid State Chem. 2011, 184, 89–96. [Google Scholar] [CrossRef]
- Zhang, X.; Qiao, X.-F.; Shi, W.; Wu, J.-B.; Jiang, D.-S.; Tan, P.-H. Phonon and Raman scattering of two-dimensional transition metal dichalcogenides from monolayer, multilayer to bulk material. Chem. Soc. Rev. 2015, 44, 2757–2785. [Google Scholar] [CrossRef] [PubMed] [Green Version]
- Mansour, H.; Letifi, H.; Bargougui, R.; de Almeida-Didry, S.; Negulescu, B.; Autret-Lambert, C.; Gadri, A.; Ammar, S. Structural, optical, magnetic and electrical properties of hematite (α-Fe2O3) nanoparticles synthesized by two methods: Polyol and precipitation. Appl. Phys. A Mater. Sci. Process. 2017, 123, 787. [Google Scholar] [CrossRef]
- Fouad, D.E.; Zhang, C.; El-Didamony, H.; Yingnan, L.; Mekuria, T.D.; Shah, A.H. Improved size, morphology and crystallinity of hematite (α-Fe2O3) nanoparticles synthesized via the precipitation route using ferric sulfate precursor. Results Phys. 2019, 12, 1253–1261. [Google Scholar] [CrossRef]
- Fouad, D.E.; Zhang, C.; Mekuria, T.D.; Bi, C.; Zaidi, A.A.; Shah, A.H. Effects of sono-assisted modified precipitation on the crystallinity, size, morphology, and catalytic applications of hematite (α-Fe2O3) nanoparticles: A comparative study. Ultrason. Sonochem. 2019, 59, 104713. [Google Scholar] [CrossRef]
- Show, B.; Mukherjee, N.; Mondal, A. α-Fe2O3 nanospheres: Facile synthesis and highly efficient photo-degradation of organic dyes and surface activation by nano-Pt for enhanced methanol sensing. RSC Adv. 2016, 6, 75347–75358. [Google Scholar] [CrossRef]
- Chernyshova, I.V.; Hochella, M.F., Jr.; Madden, A.S. Size-dependent structural transformations of hematite nanoparticles. 1. Phase transition. Phys. Chem. Chem. Phys. 2007, 9, 1736. [Google Scholar] [CrossRef] [PubMed]
- Chen, D.-X.; Sanchez, A.; Taboada, E.; Roig, A.; Sun, N.; Gu, H.-C. Size determination of superparamagnetic nanoparticles from magnetization curve. J. Appl. Phys. 2009, 105, 083924. [Google Scholar] [CrossRef]
- Cullity, B.D.; Graham, C.D. Introduction to Magnetic Materials, 2nd ed.; Wiley: Hoboken, NJ, USA, 2009; p. 391. [Google Scholar]
- Dunlop, D.J.; Özdemir, Ö. Rock Magnetism; Cambridge University Press: Cambridge, UK, 1997; p. 51. [Google Scholar]


| Sample Code | Pluronic F-127 Concentration | Pluronic F-127 (mL) | H2O (mL) | Aqueous Solution NH4OH (mL) |
|---|---|---|---|---|
| NP5 | 0.500 | 10 | 0 | 50 |
| NP4 | 0.400 | 8 | 2 | 50 |
| NP3 | 0.300 | 6 | 4 | 50 |
| NP2 | 0.200 | 4 | 6 | 50 |
| NP1 | 0.100 | 2 | 8 | 50 |
| NP0 | 0.000 | 0 | 10 | 50 |
| Sample | Position (cm−1) | FWHM (cm−1) | Size (nm) | Standard Error (nm) |
|---|---|---|---|---|
| NP0 | 690.1 | 109.3 | 7.8 | ±0.3 |
| NP1 | 687.3 | 102.8 | 8.5 | |
| NP2 | 689.9 | 108.9 | 7.9 | |
| NP3 | 691.6 | 106.0 | 8.1 | |
| NP4 | 691.0 | 100.8 | 8.7 | |
| NP5 | 686.9 | 102.3 | 8.5 |
| Sample | N | Mean (nm) | SD | SE | Min (nm) | Max (nm) | Range |
|---|---|---|---|---|---|---|---|
| NP0 | 1000 | 5.37 | 3.17 | 0.1002 | 1.51 | 39.69 | 38.18 |
| NP1 | 1000 | 5.51 | 3.61 | 0.1142 | 1.65 | 30.93 | 29.28 |
| NP2 | 1000 | 4.89 | 2.95 | 0.0934 | 1.83 | 28.33 | 26.49 |
| NP3 | 1000 | 5.24 | 2.94 | 0.0930 | 1.09 | 35.63 | 34.53 |
| NP4 | 1000 | 5.75 | 3.30 | 0.1045 | 1.35 | 29.75 | 28.41 |
| NP5 | 1000 | 4.79 | 3.32 | 0.1051 | 1.36 | 41.00 | 39.64 |
| NP0 | Diameter (nm) | SD (nm) |
|---|---|---|
| Raman | 7.8 | 0.3 |
| TEM | 5.4 | 3.2 |
| SMM | 4.4 | 2.9 |
| Samples | NP0 | NP1 | NP2 | NP3 | NP4 | NP5 |
|---|---|---|---|---|---|---|
| Magnetization at 0.5 T (Am2/kg) | 25.9 | 24.4 | 21.6 | 23.9 | 25.7 | 25.1 |
| Magnetization at 2.0 T (Am2/kg) | 32.1 | 30.2 | 27.8 | 29.5 | 32.2 | 31.8 |
Publisher’s Note: MDPI stays neutral with regard to jurisdictional claims in published maps and institutional affiliations. |
© 2021 by the authors. Licensee MDPI, Basel, Switzerland. This article is an open access article distributed under the terms and conditions of the Creative Commons Attribution (CC BY) license (https://creativecommons.org/licenses/by/4.0/).
Share and Cite
Gutierrez, F.V.; De Falco, A.; Yokoyama, E.; Mendoza, L.A.F.; Luz-Lima, C.; Perez, G.; Loreto, R.P.; Pottker, W.E.; La Porta, F.A.; Solorzano, G.; et al. Magnetic Characterization by Scanning Microscopy of Functionalized Iron Oxide Nanoparticles. Nanomaterials 2021, 11, 2197. https://doi.org/10.3390/nano11092197
Gutierrez FV, De Falco A, Yokoyama E, Mendoza LAF, Luz-Lima C, Perez G, Loreto RP, Pottker WE, La Porta FA, Solorzano G, et al. Magnetic Characterization by Scanning Microscopy of Functionalized Iron Oxide Nanoparticles. Nanomaterials. 2021; 11(9):2197. https://doi.org/10.3390/nano11092197
Chicago/Turabian StyleGutierrez, Frederico V., Anna De Falco, Elder Yokoyama, Leonardo A. F. Mendoza, Cleanio Luz-Lima, Geronimo Perez, Renan P. Loreto, Walmir E. Pottker, Felipe A. La Porta, Guillermo Solorzano, and et al. 2021. "Magnetic Characterization by Scanning Microscopy of Functionalized Iron Oxide Nanoparticles" Nanomaterials 11, no. 9: 2197. https://doi.org/10.3390/nano11092197
APA StyleGutierrez, F. V., De Falco, A., Yokoyama, E., Mendoza, L. A. F., Luz-Lima, C., Perez, G., Loreto, R. P., Pottker, W. E., La Porta, F. A., Solorzano, G., Arsalani, S., Baffa, O., & Araujo, J. F. D. F. (2021). Magnetic Characterization by Scanning Microscopy of Functionalized Iron Oxide Nanoparticles. Nanomaterials, 11(9), 2197. https://doi.org/10.3390/nano11092197