
Iron Modified Titanate Nanotube Arrays for Photoelectrochemical Removal of E. coli

 ,
, 
Abstract
:1. Introduction
2. Materials and Methods
2.1. Preparation of Fe Modified Titanium Dioxide Nanotube Arrays (Fe/TNAs)
2.2. Characterization of Nanotube Arrays
2.3. PEC and Electrochemical Measurements
3. Results and Discussions
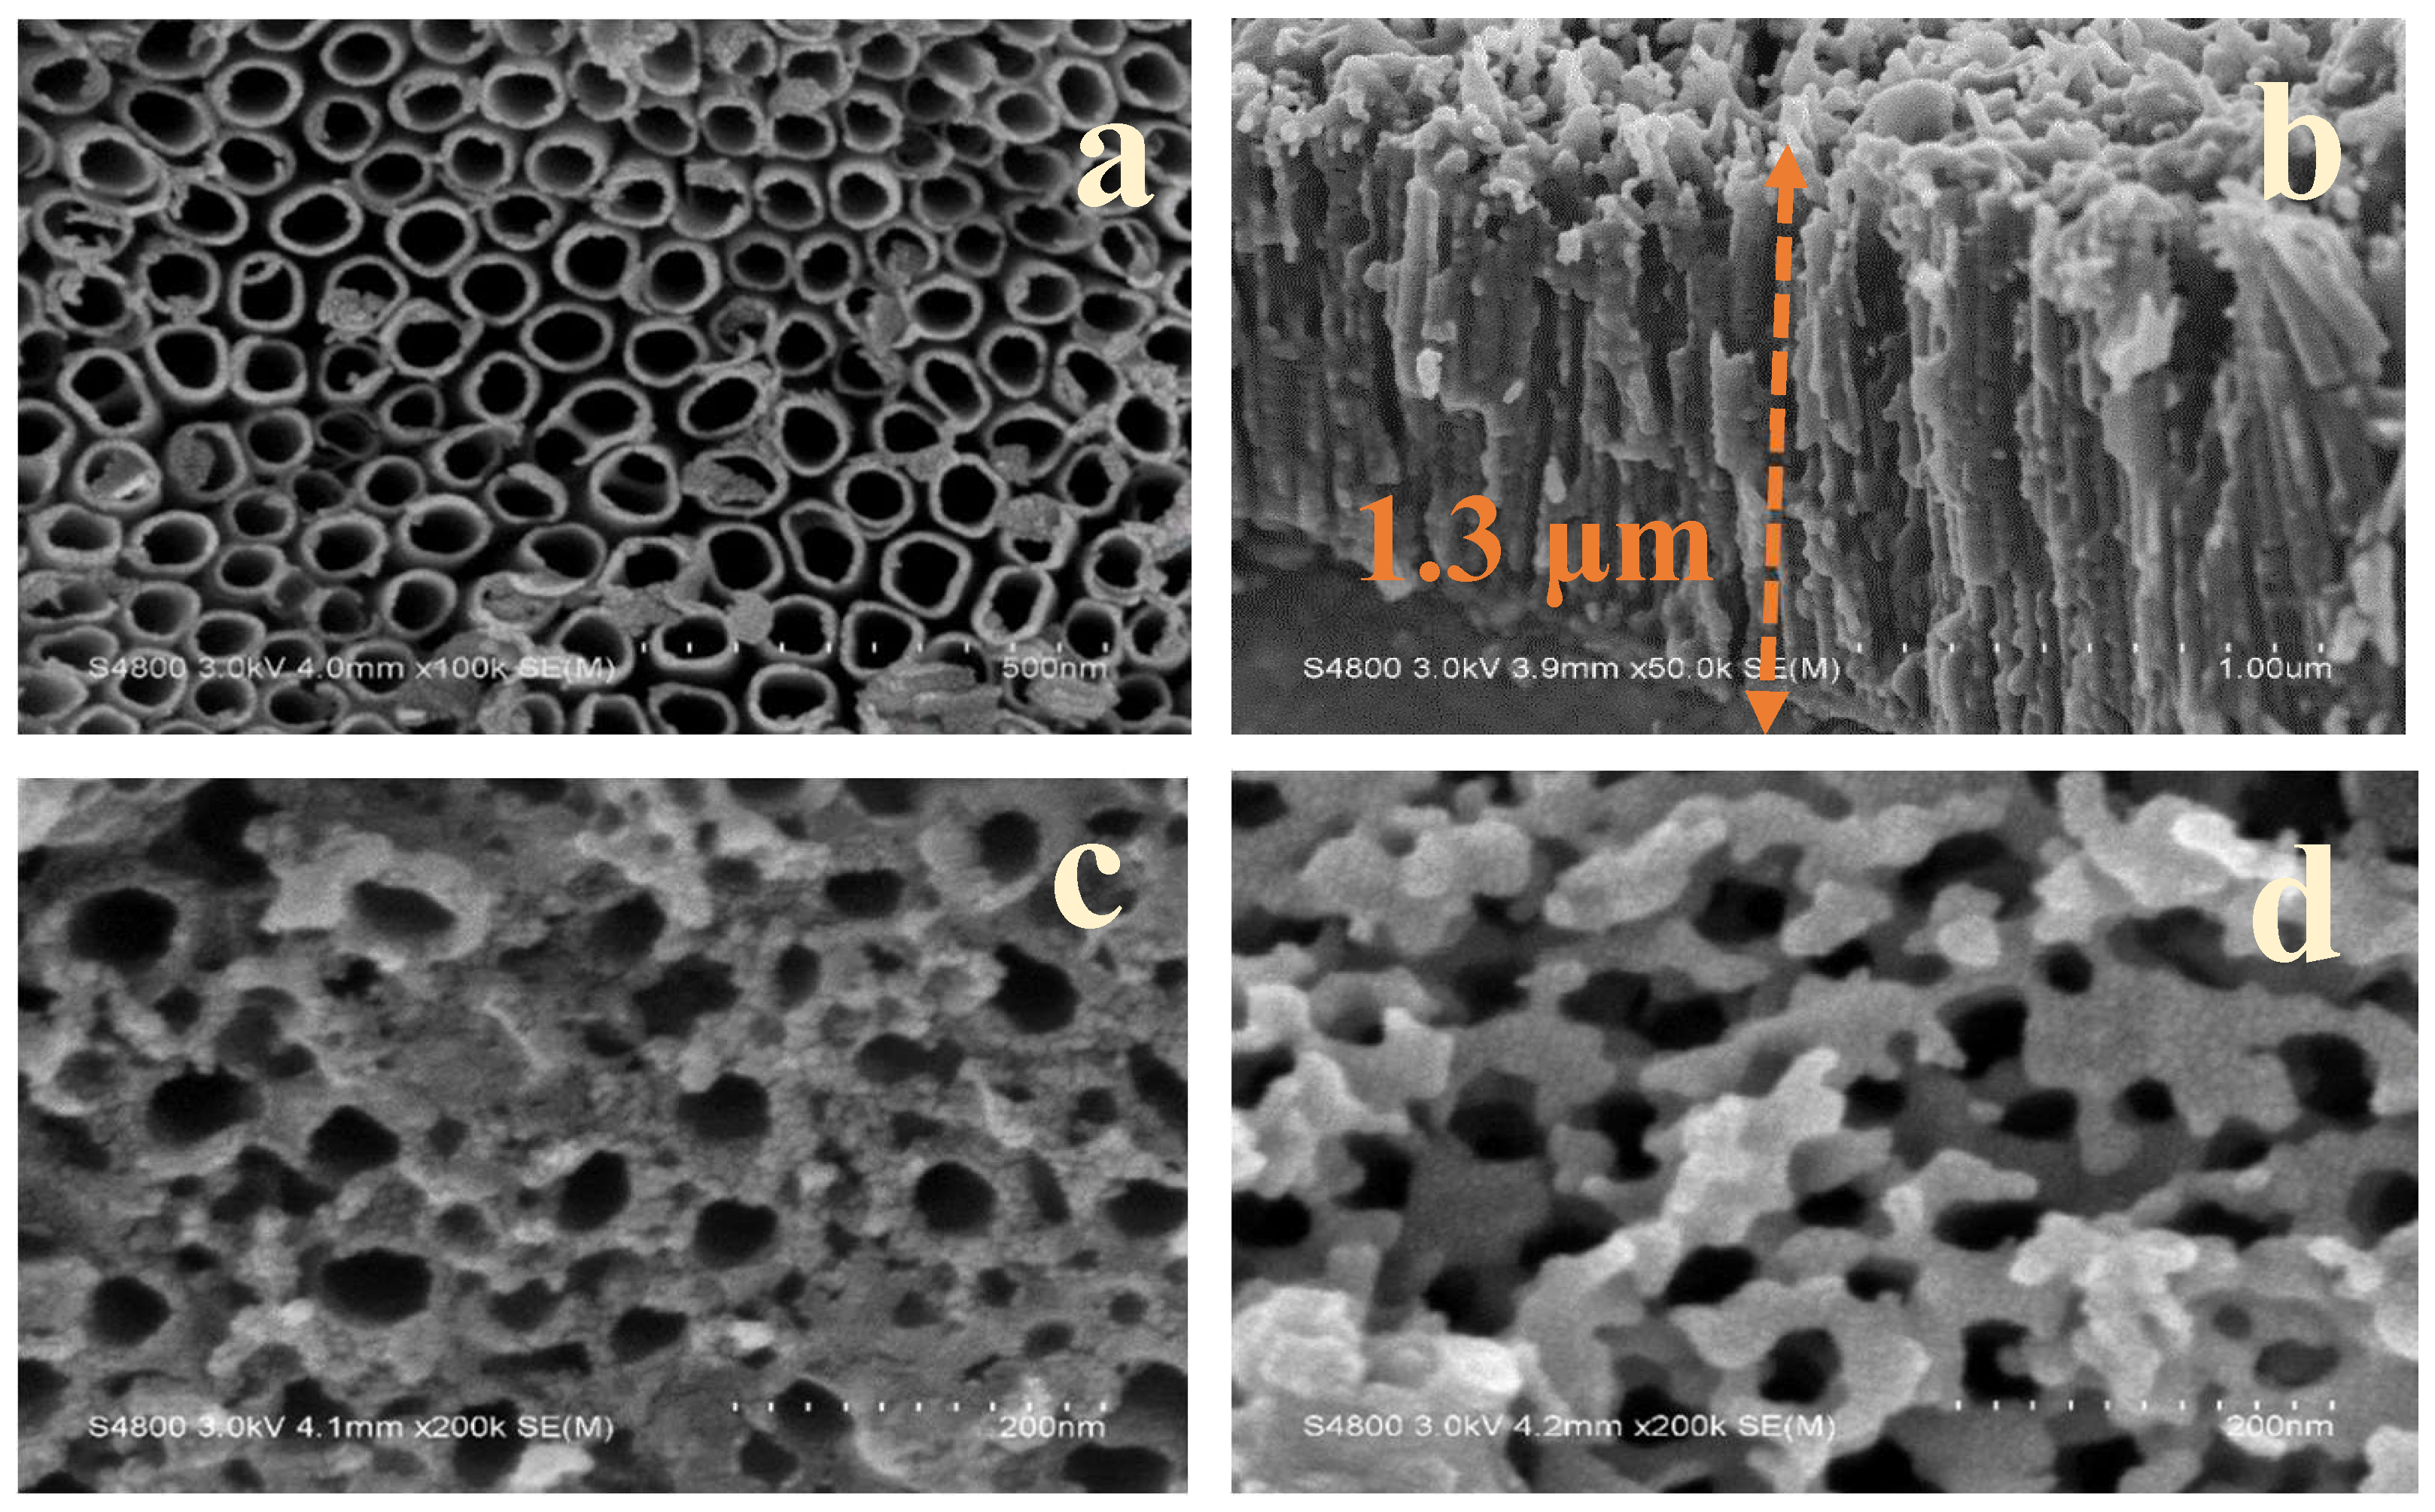
3.1. Surface Morphology of TNAs and Fe/TNAs
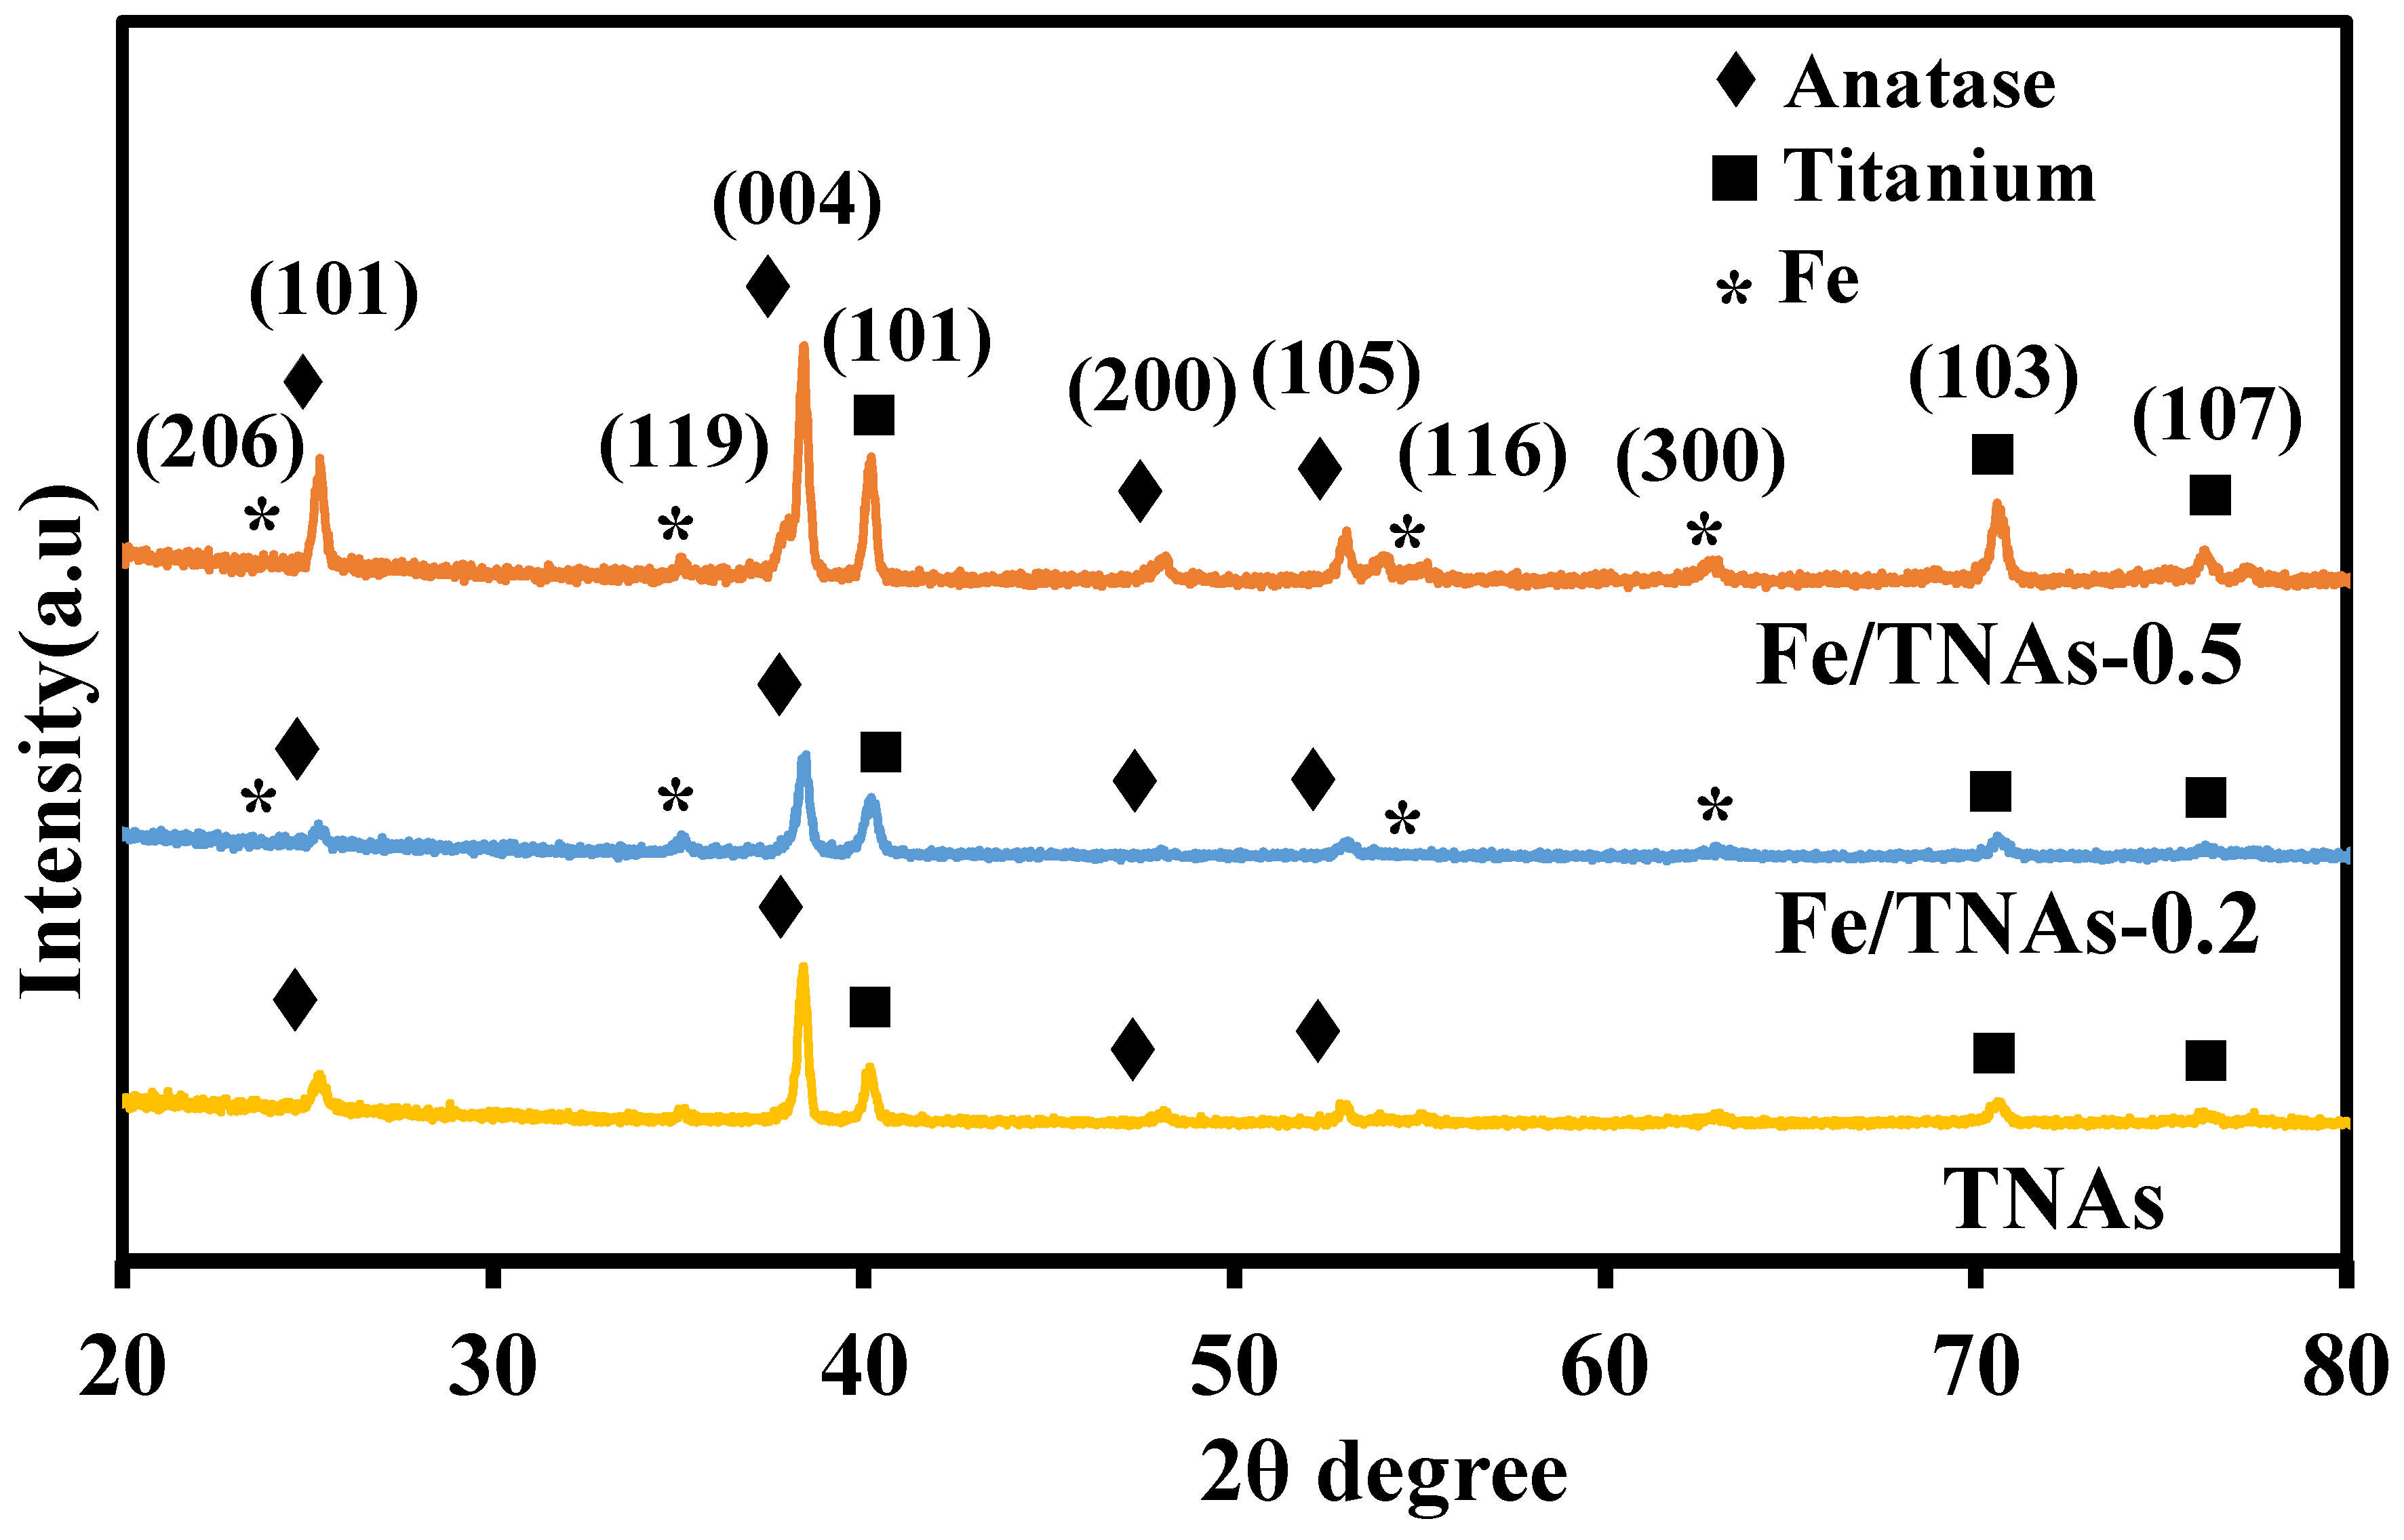
3.2. XRD Analyses
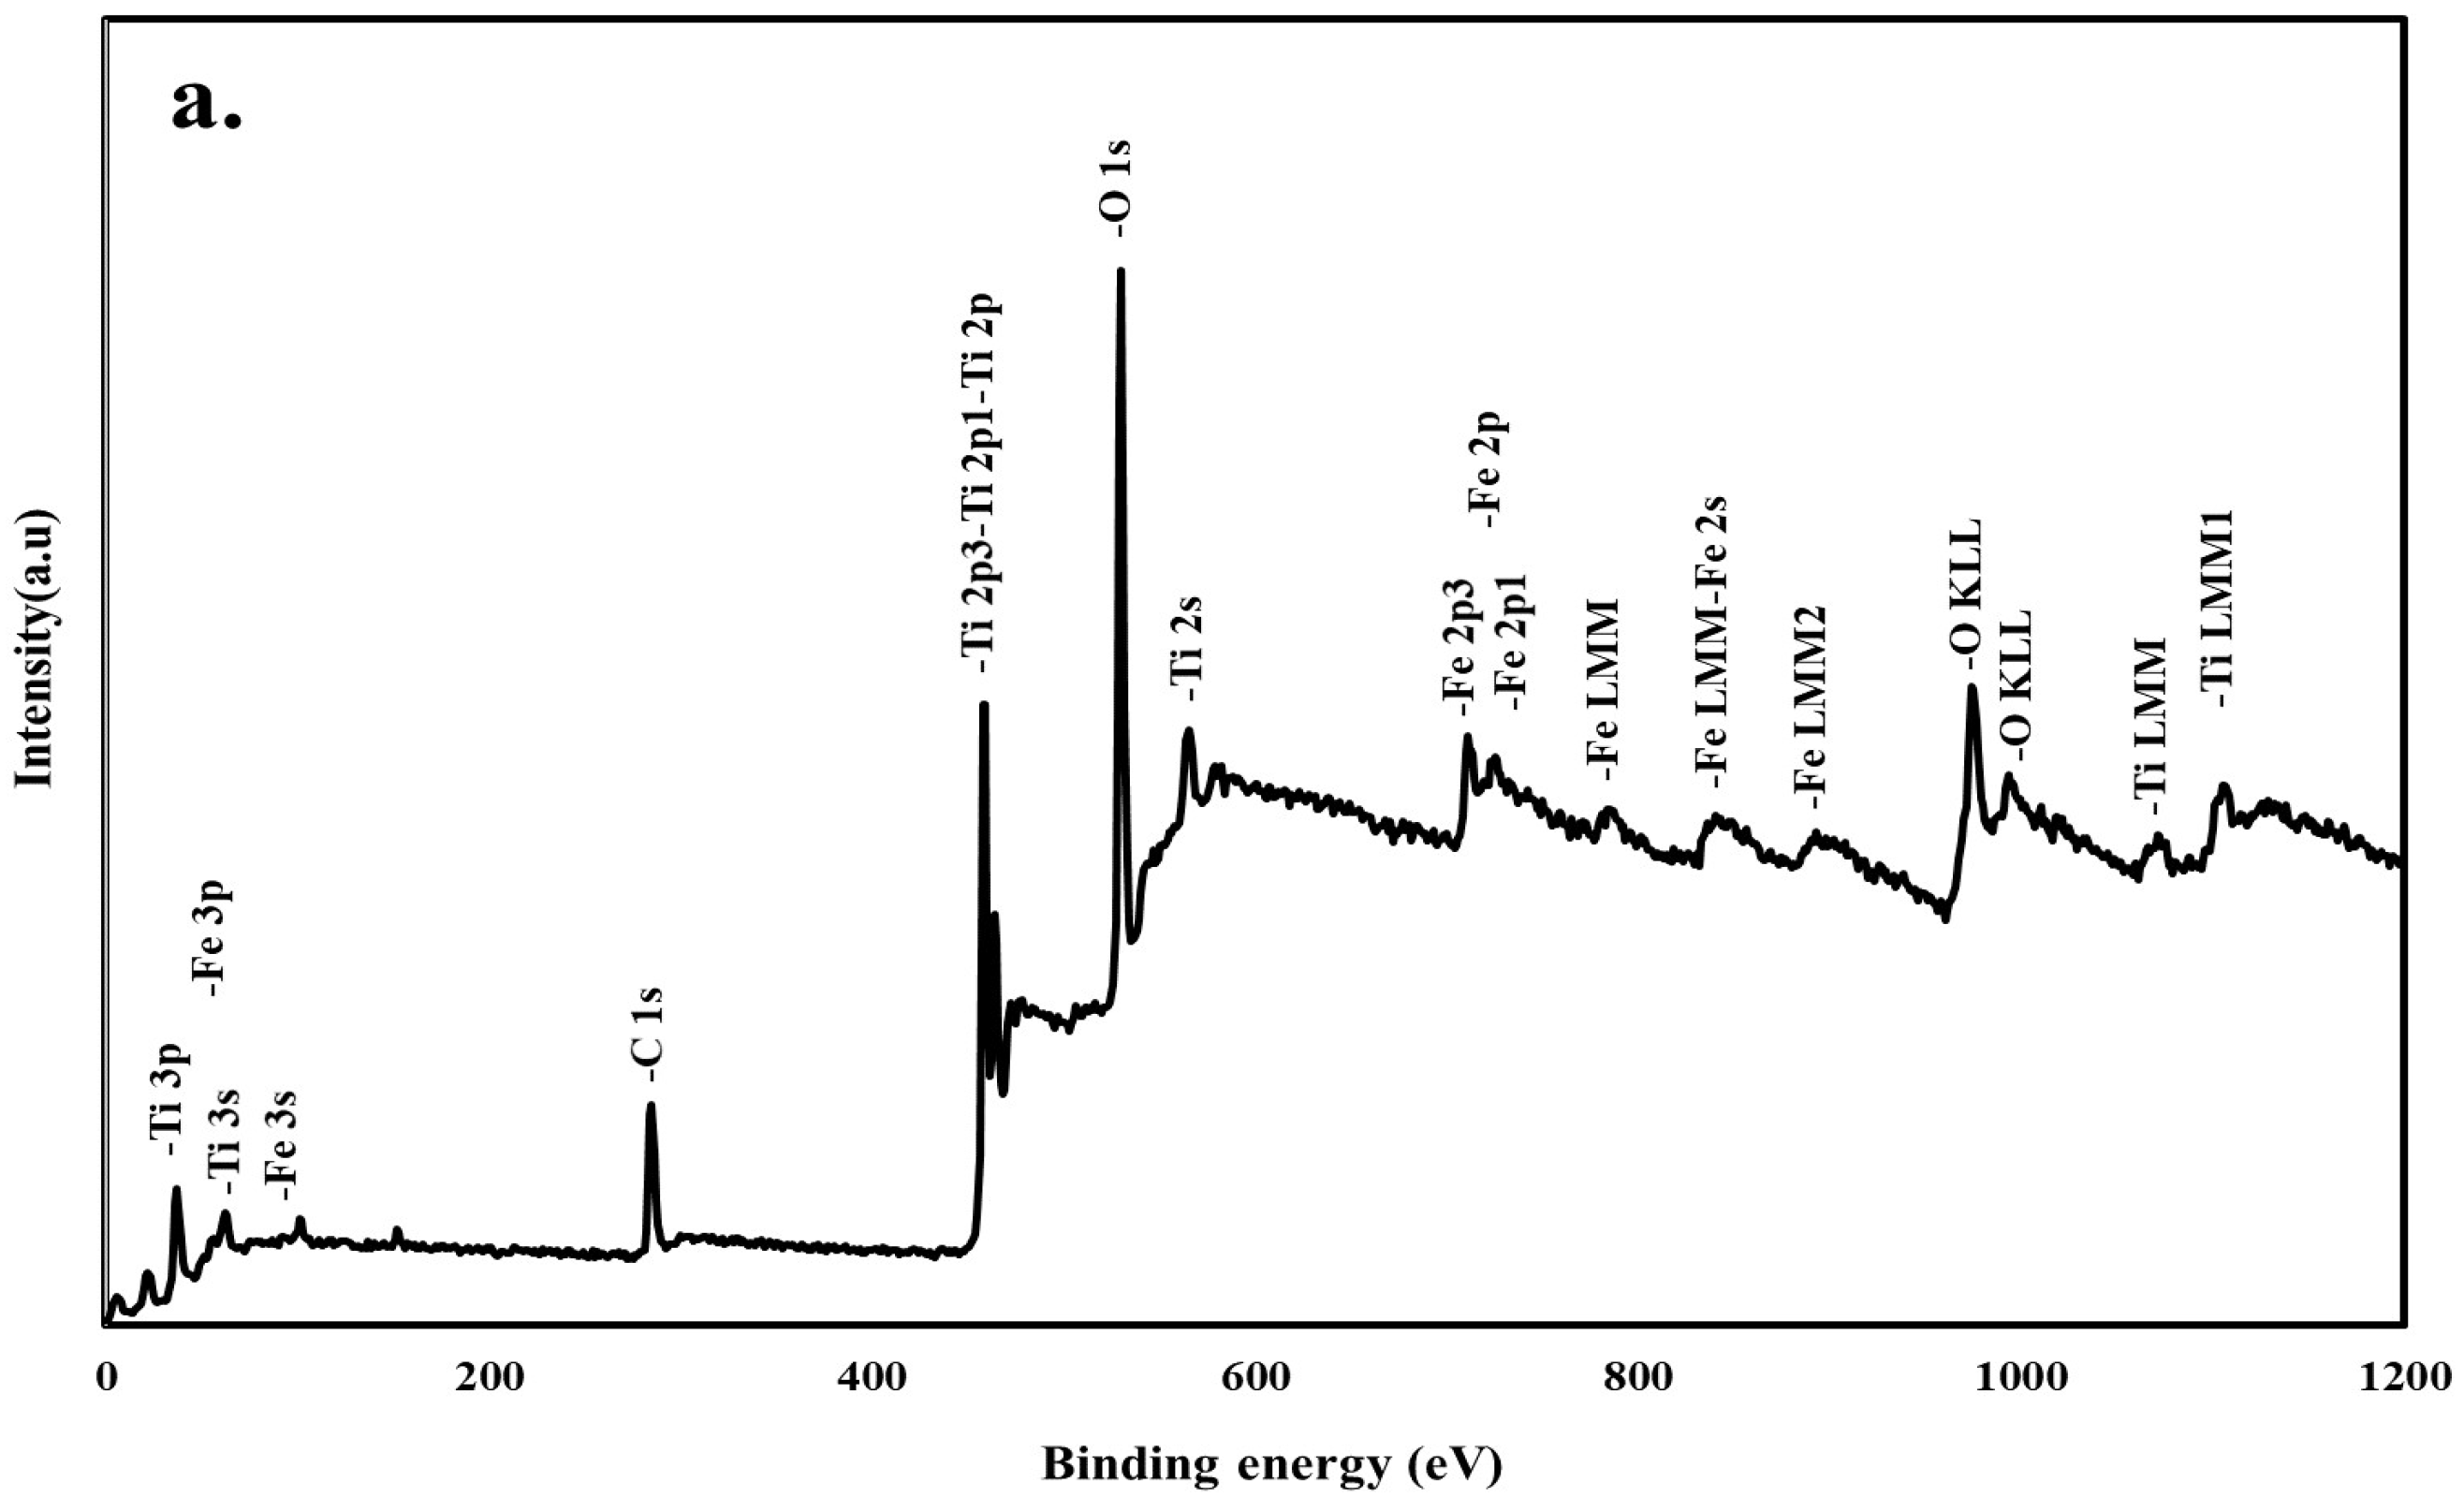
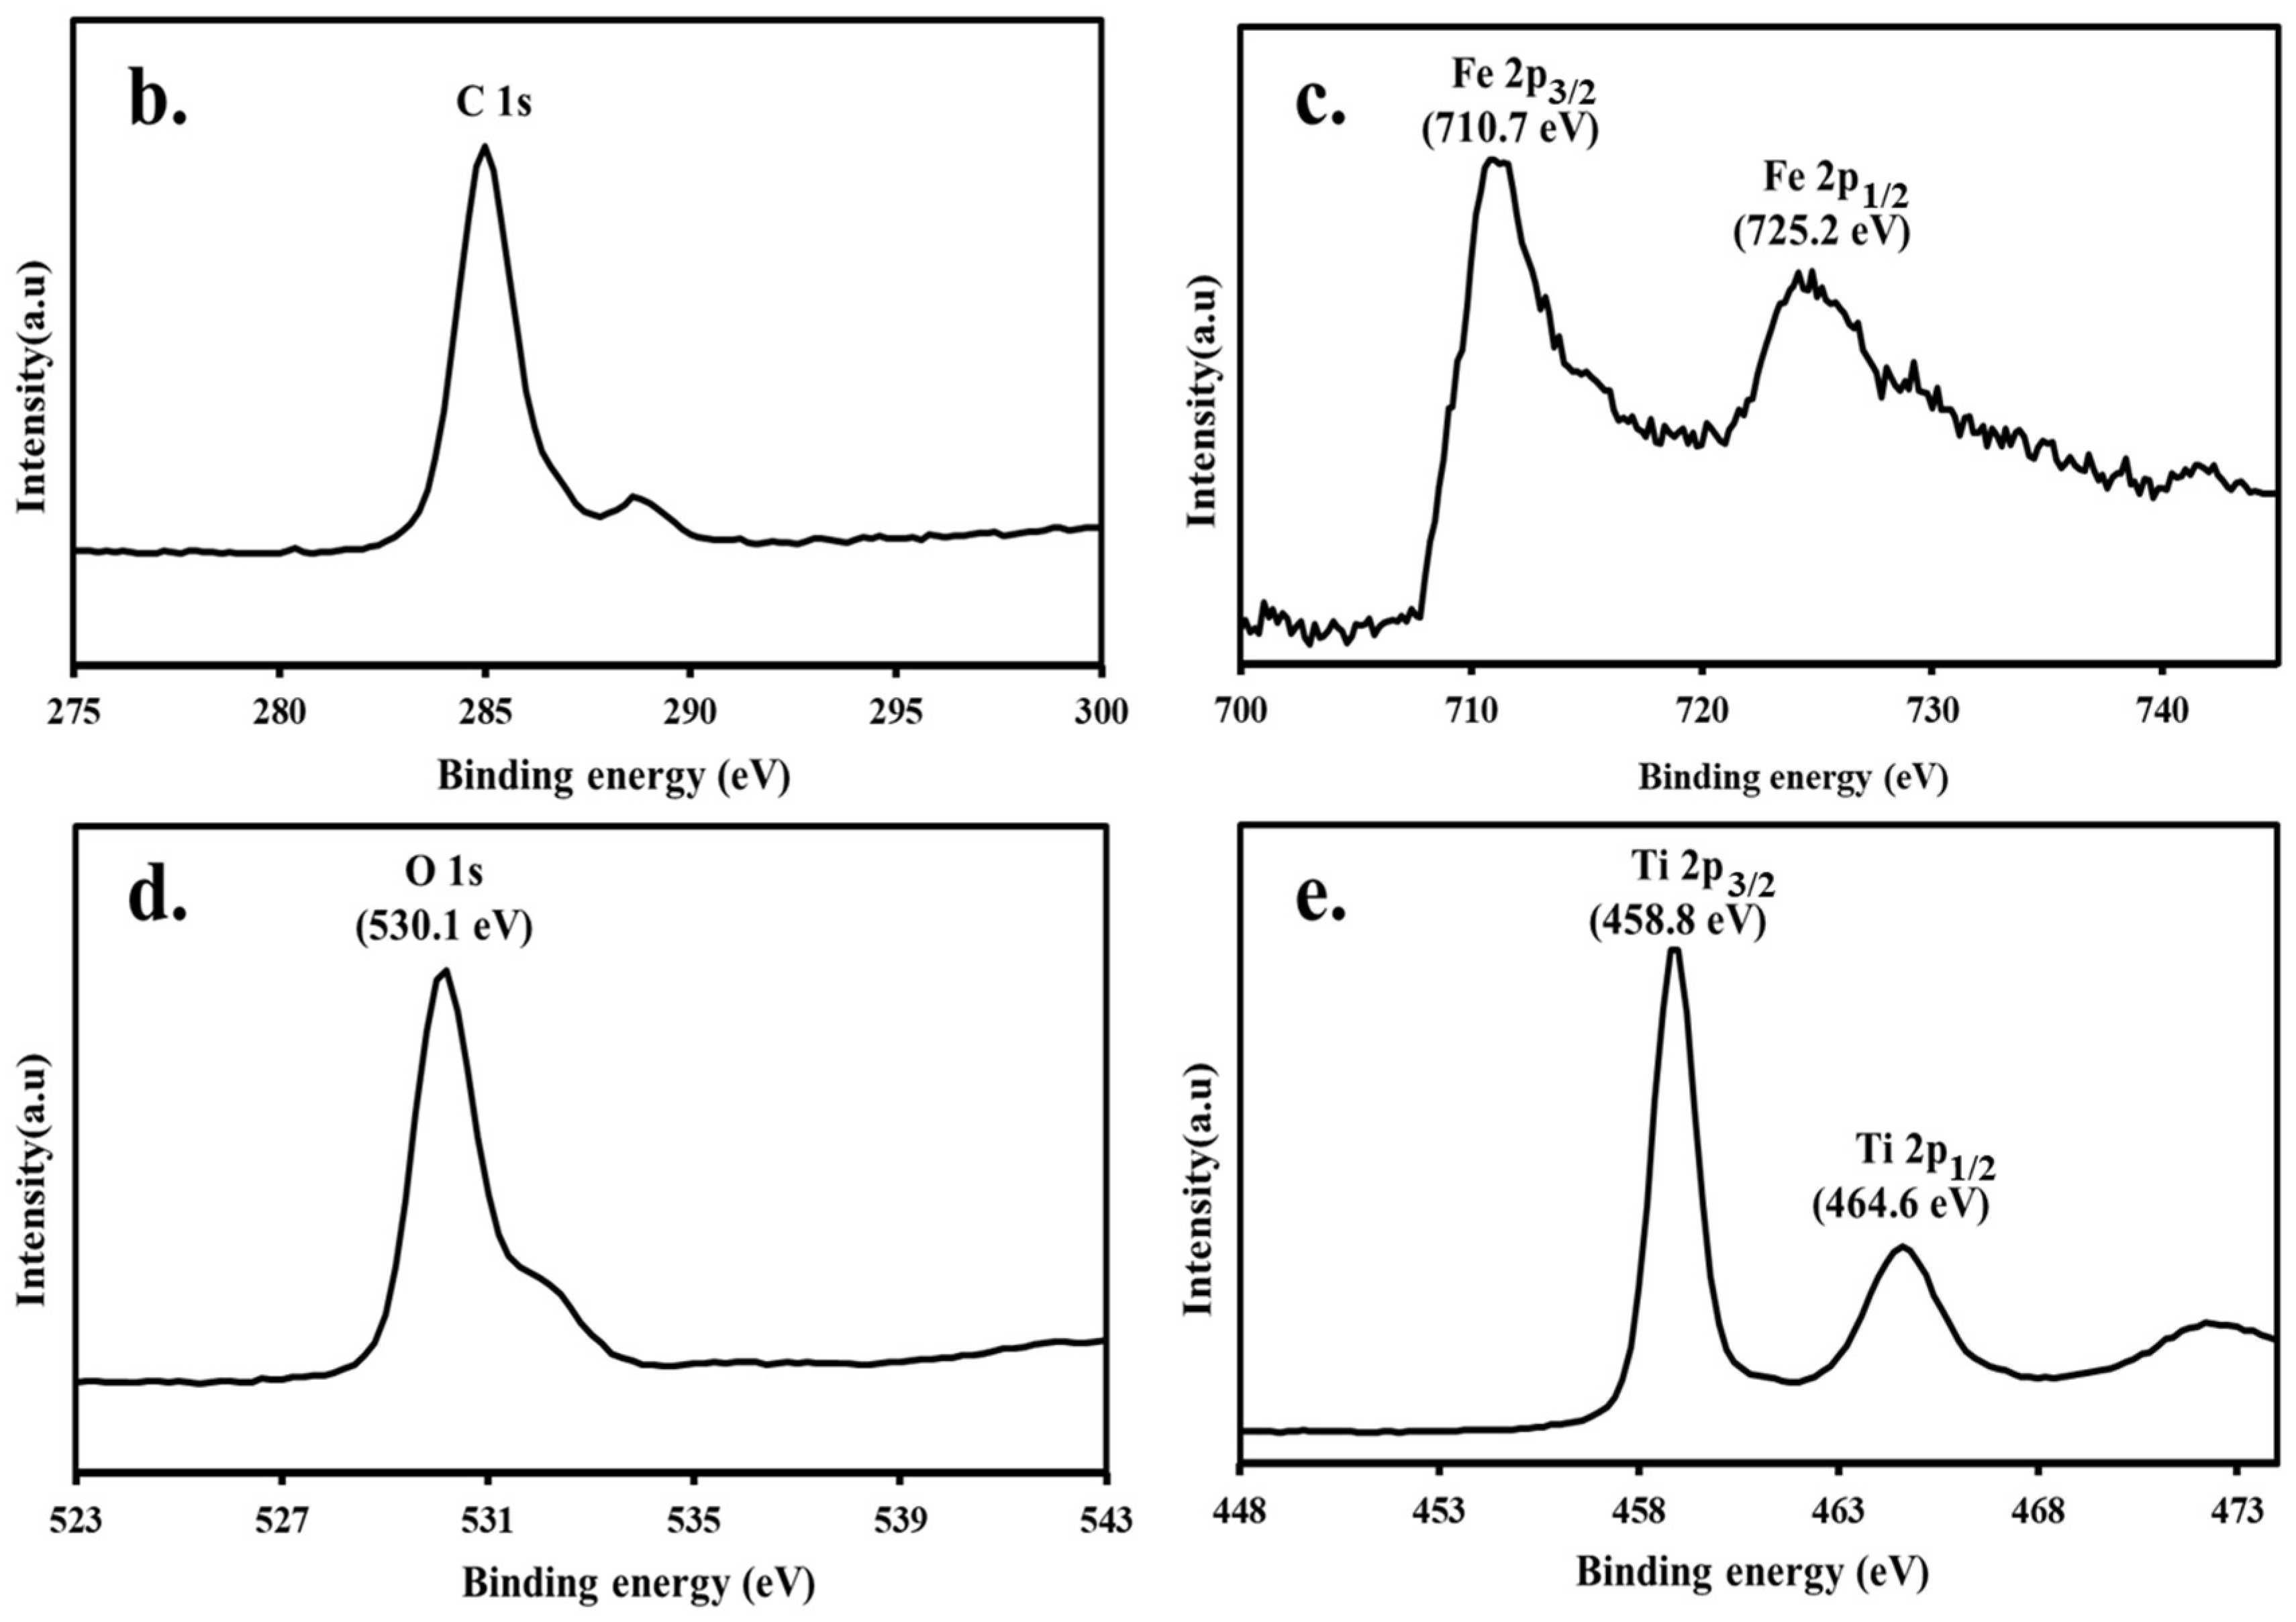
3.3. XPS Analyses
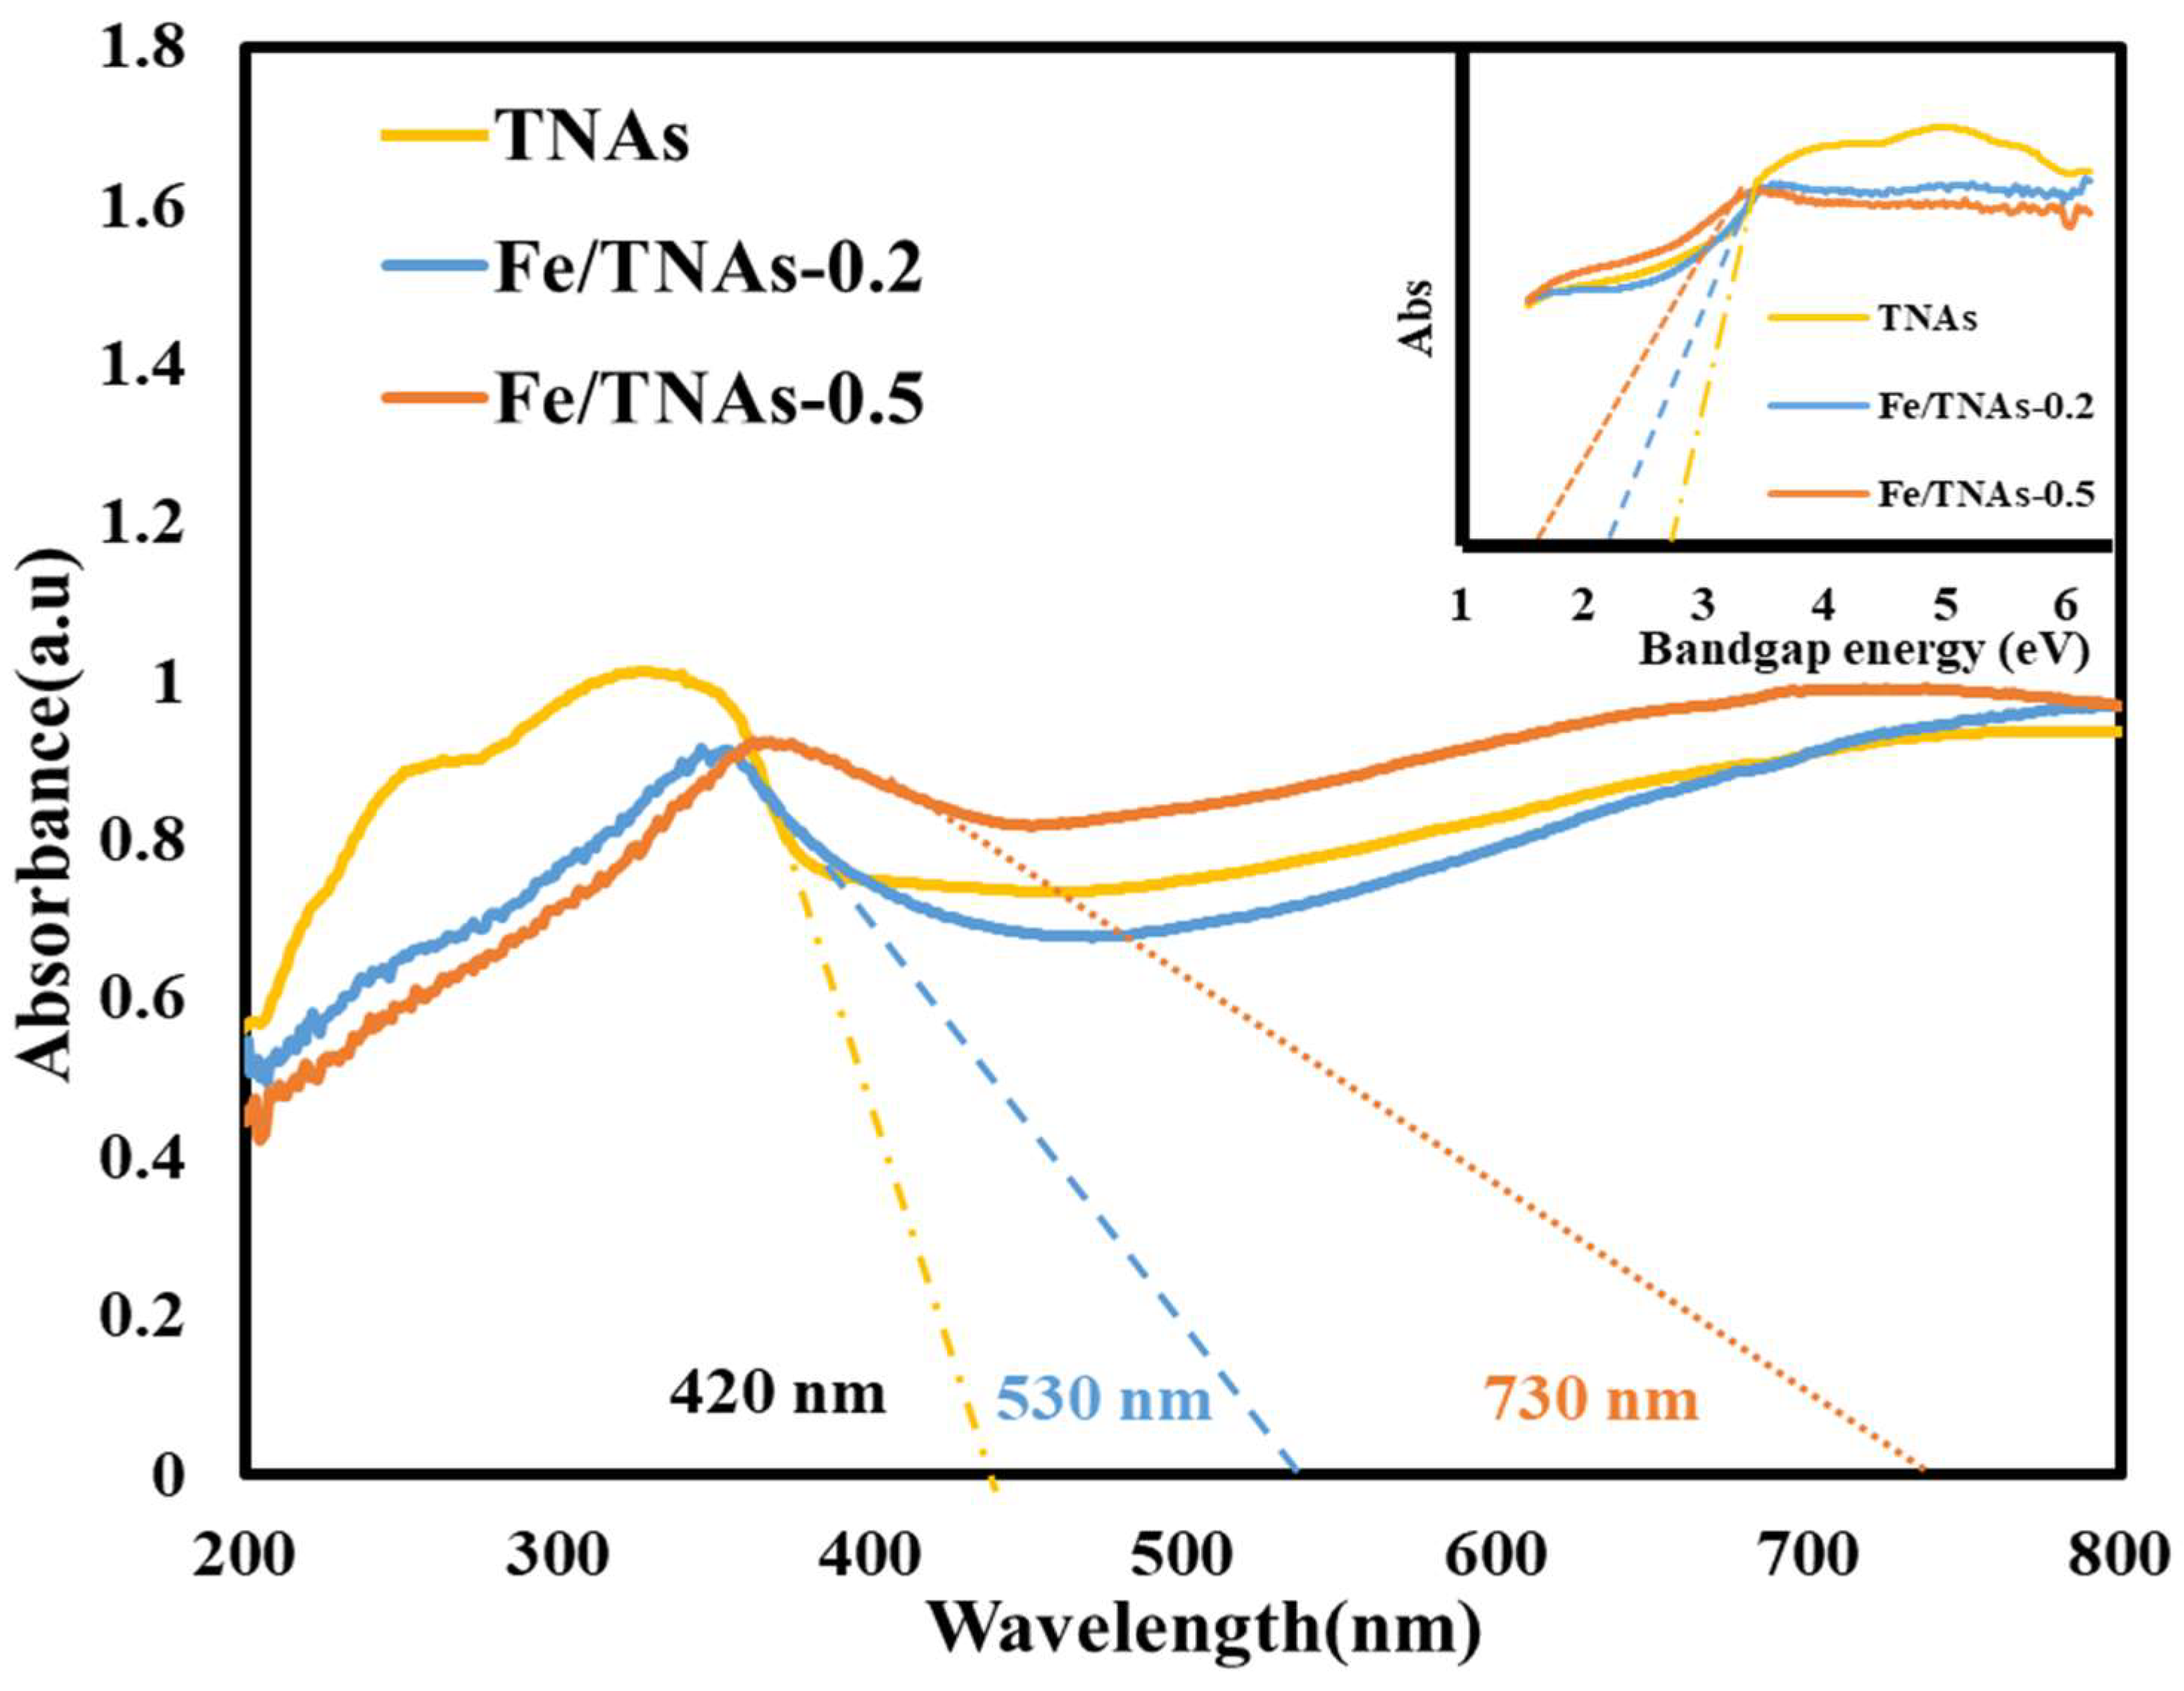
3.4. UV-Vis DRS Analyses
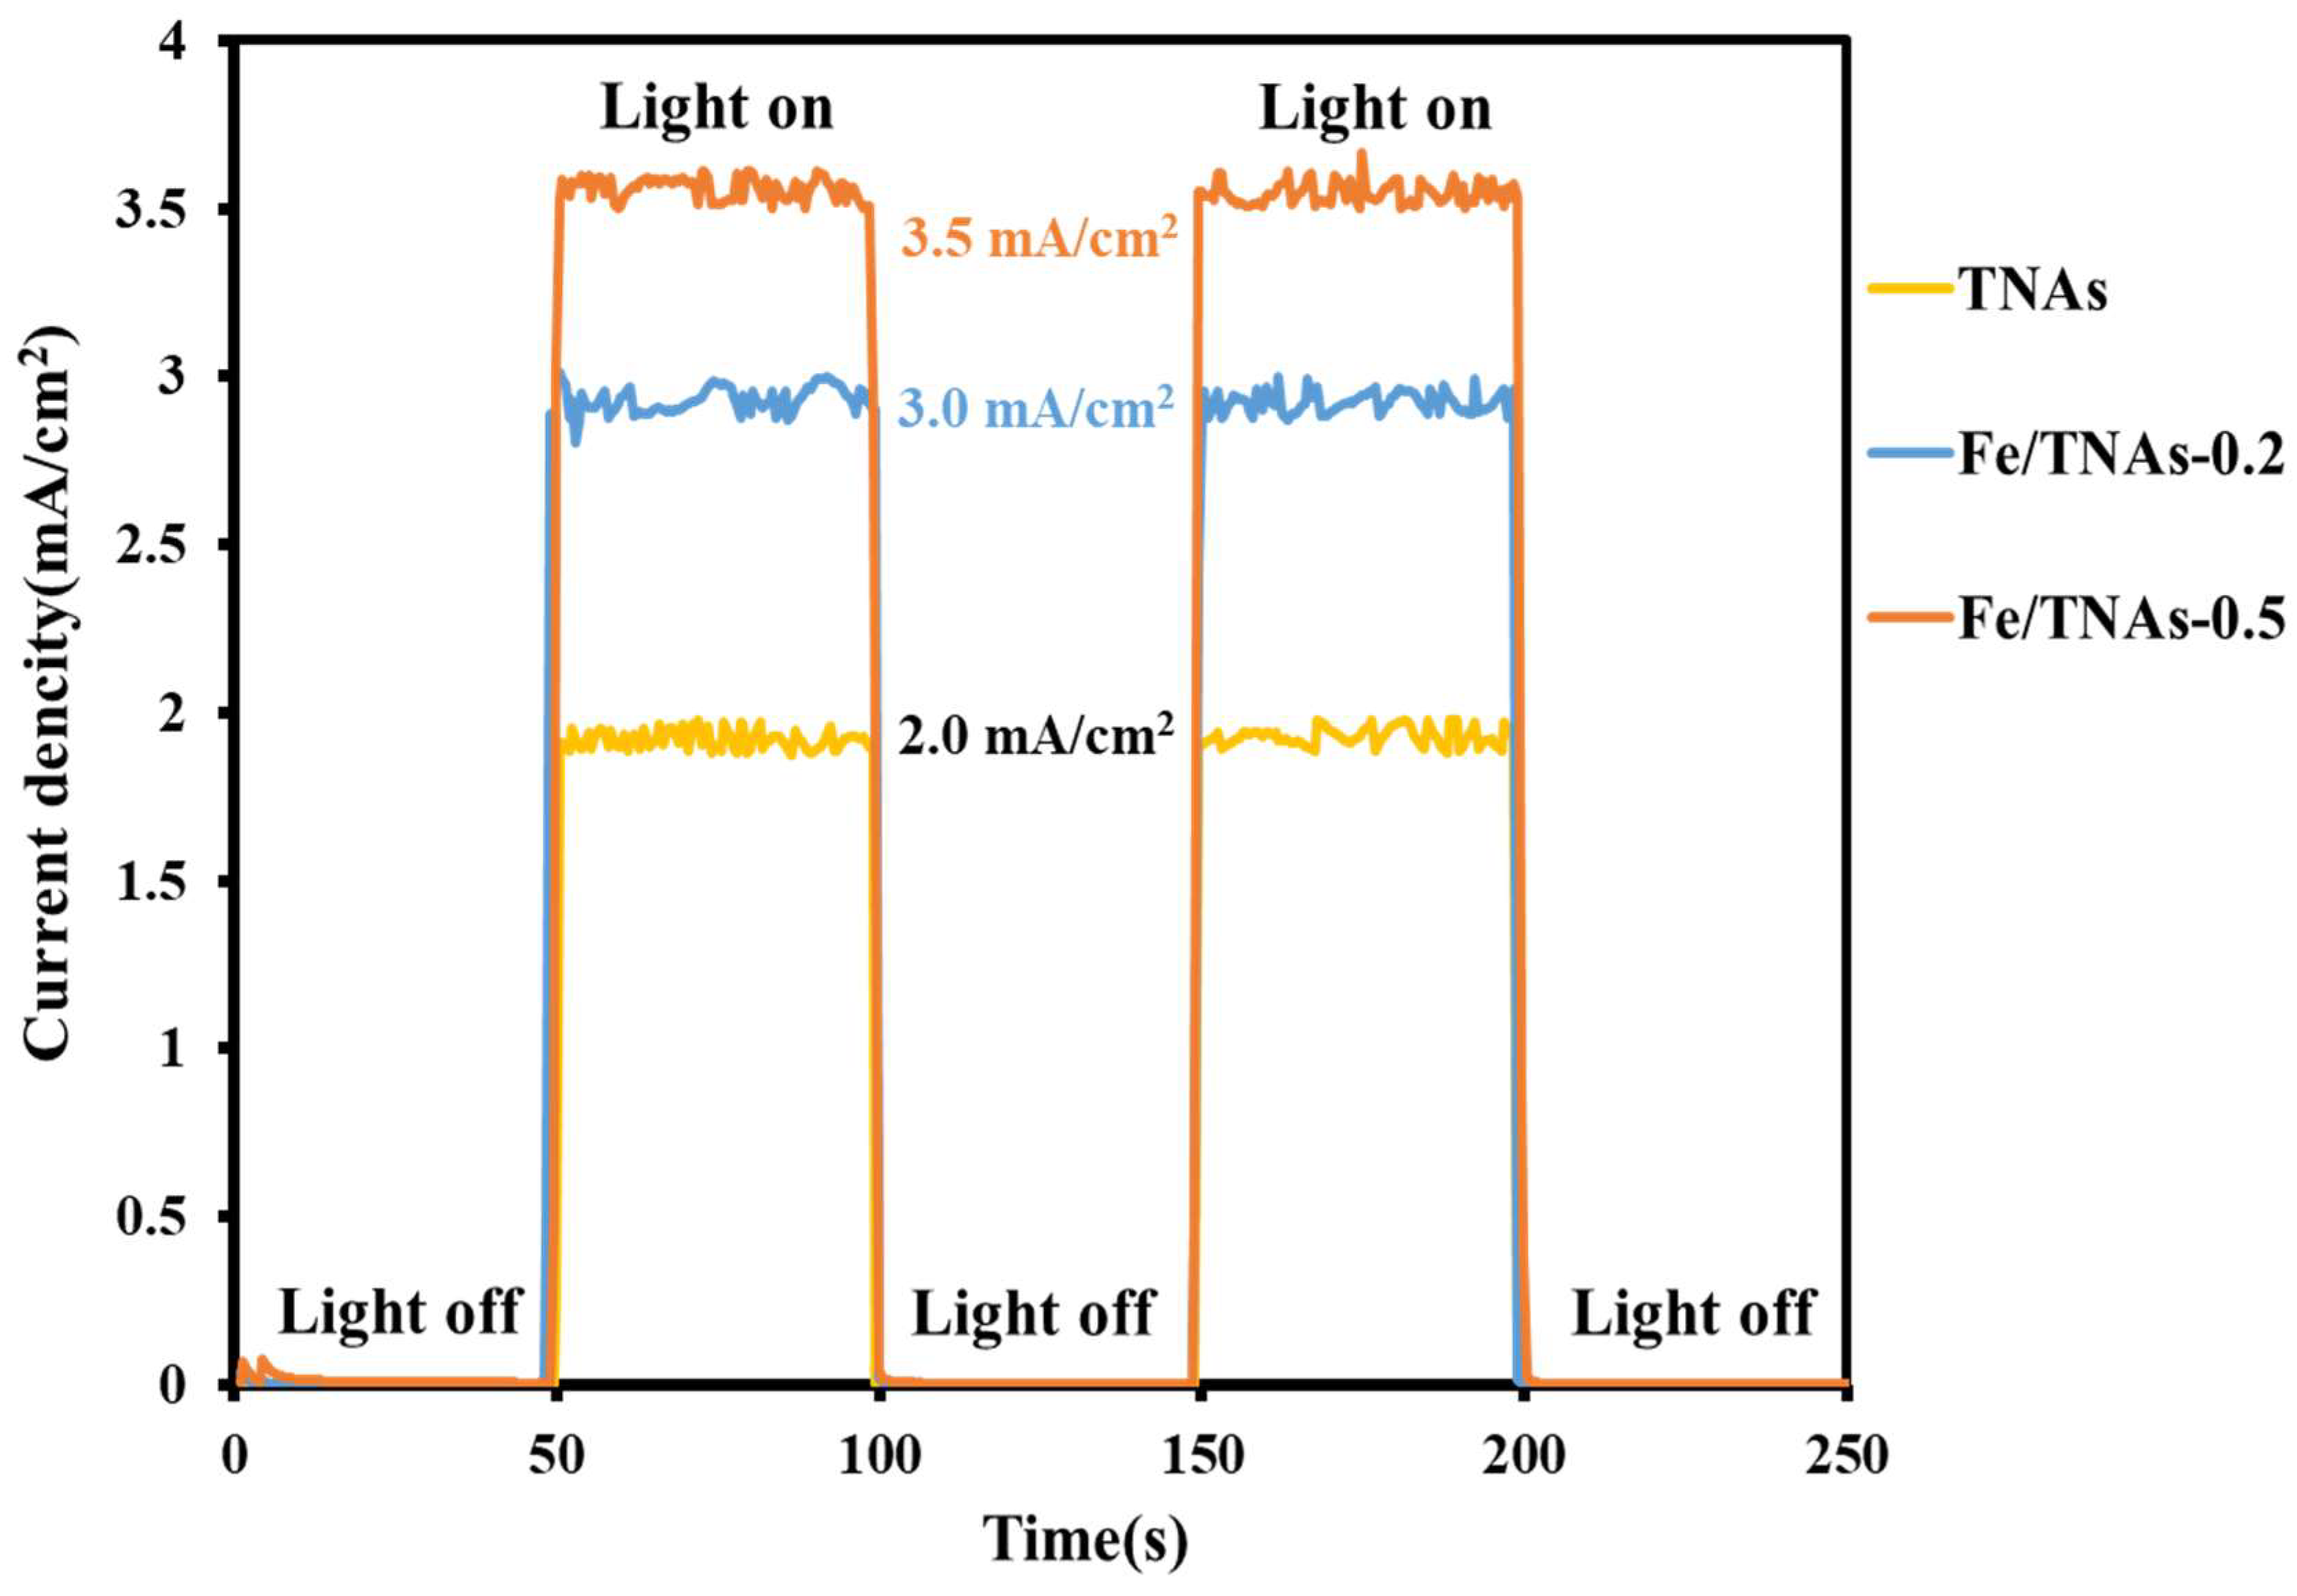
3.5. Photocurrent Measurement
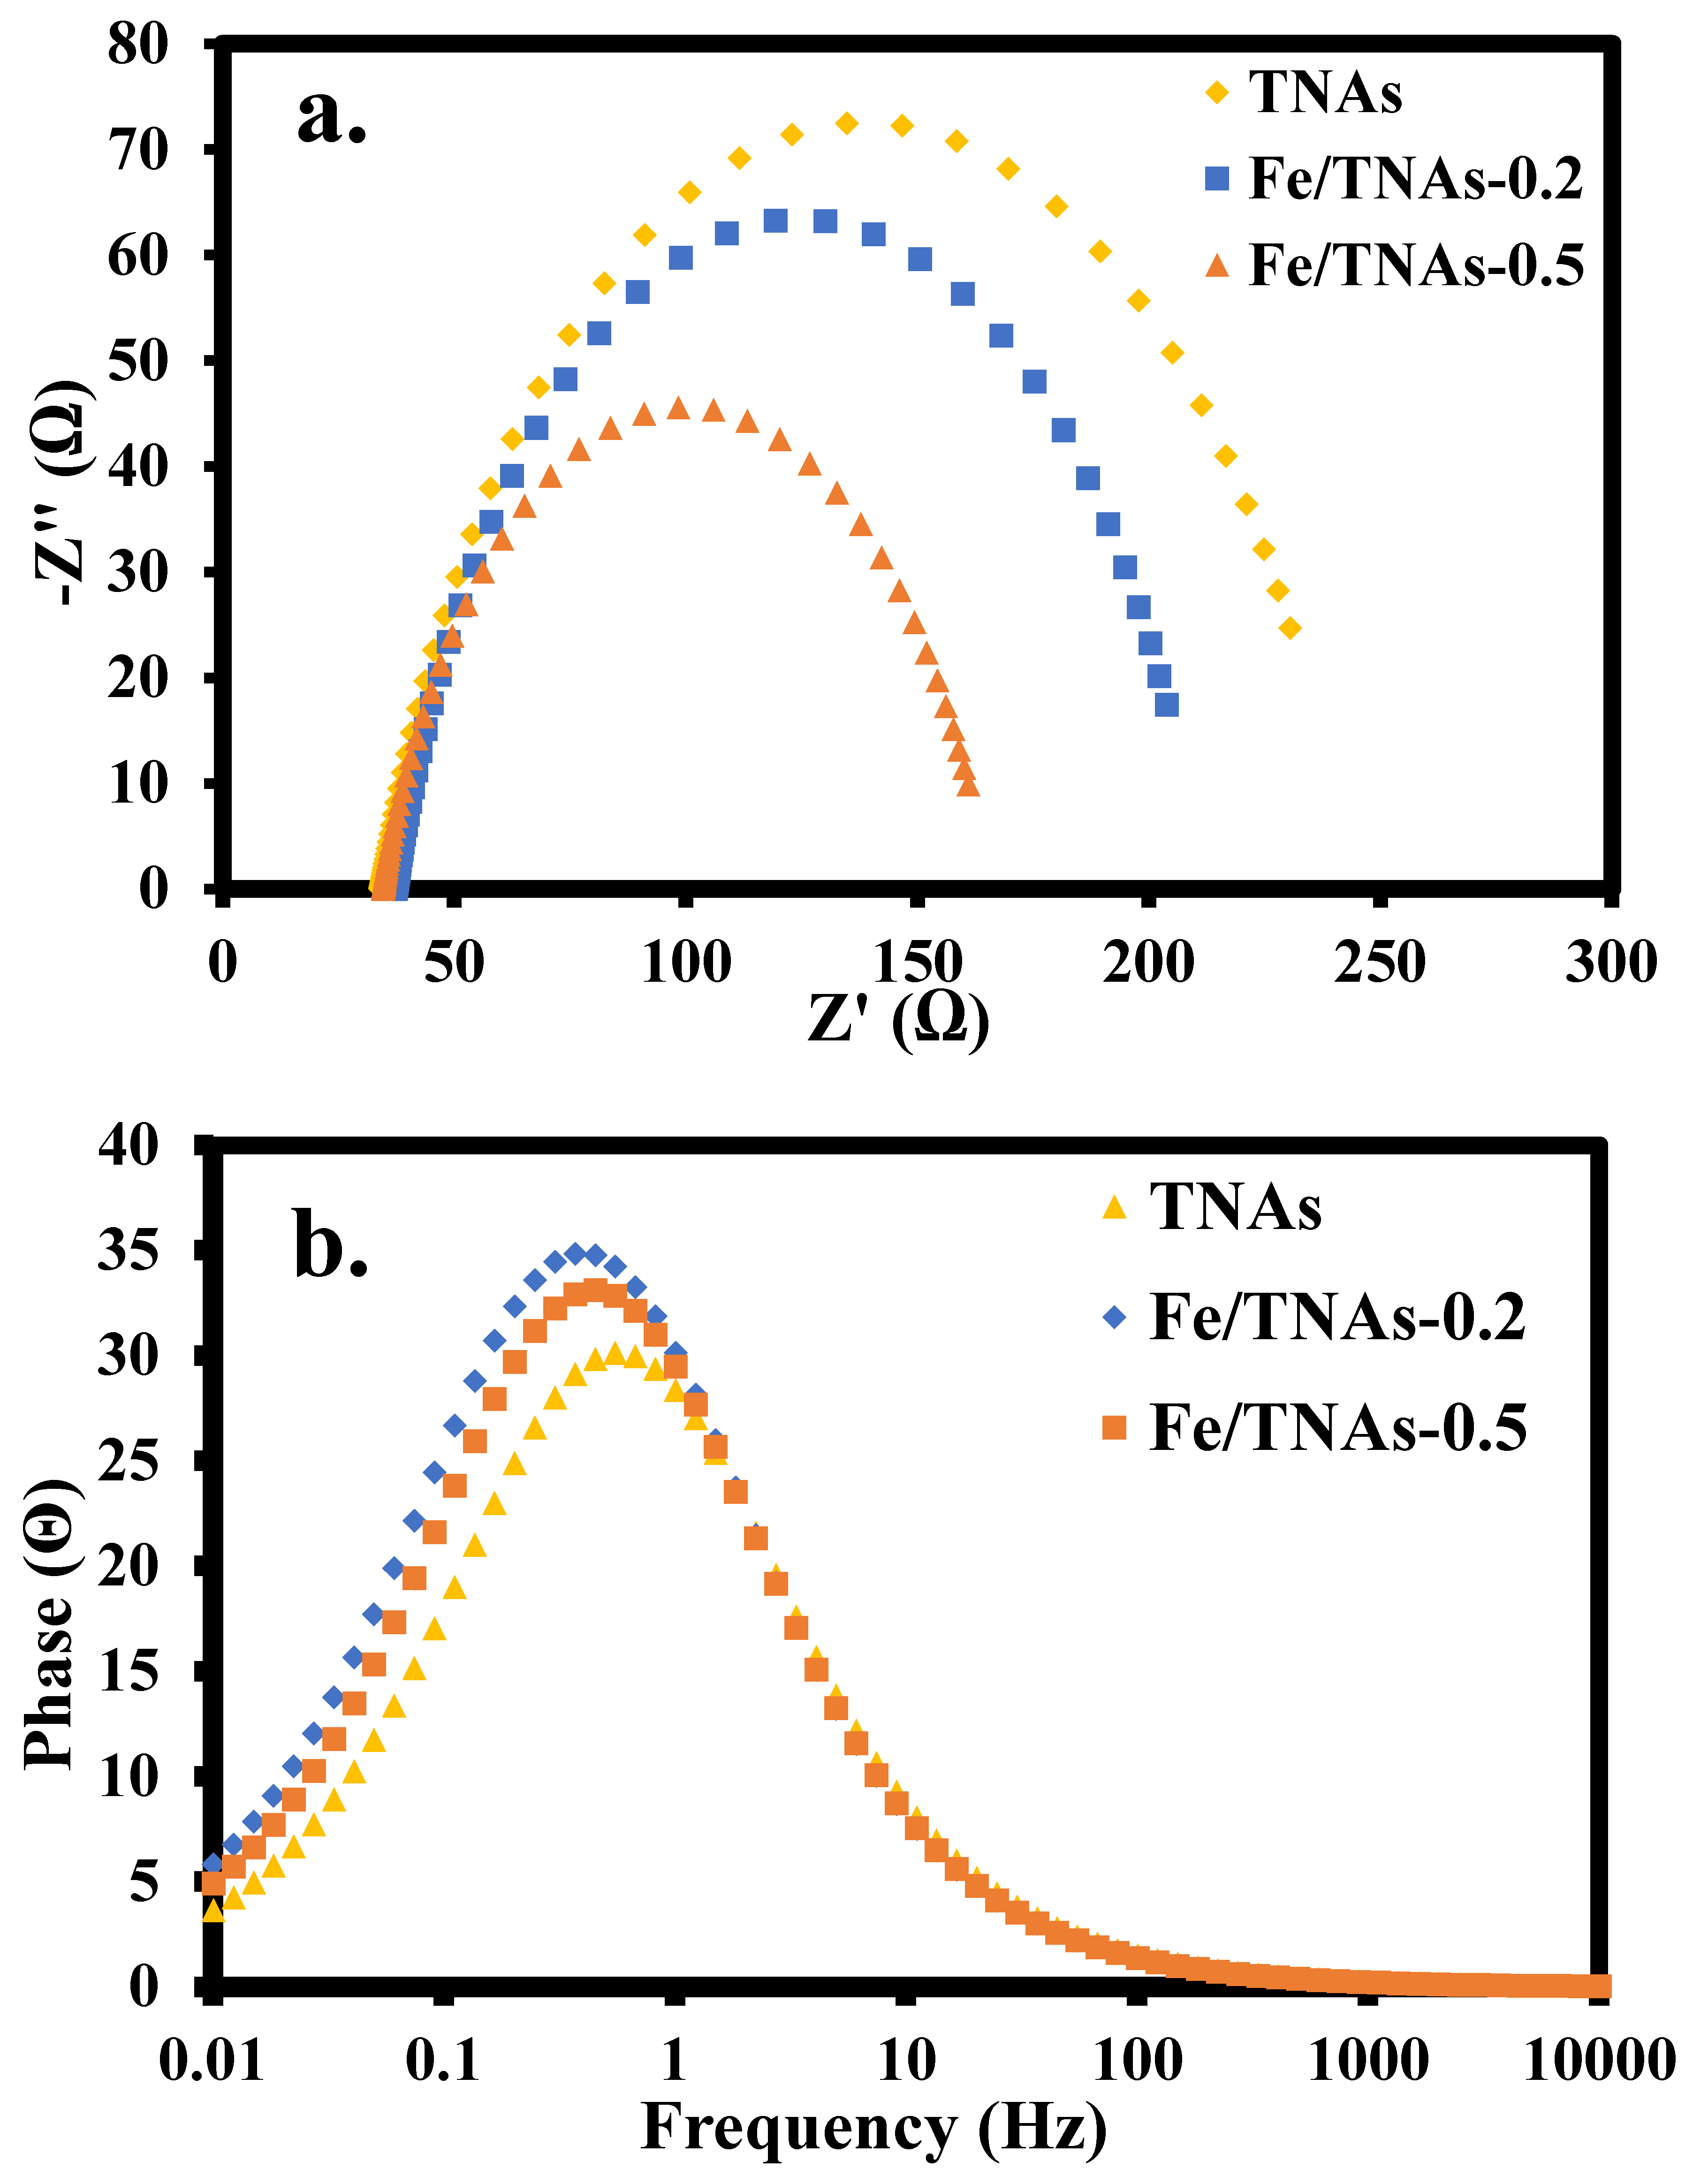
3.6. Electrochemical Impedance Spectrum
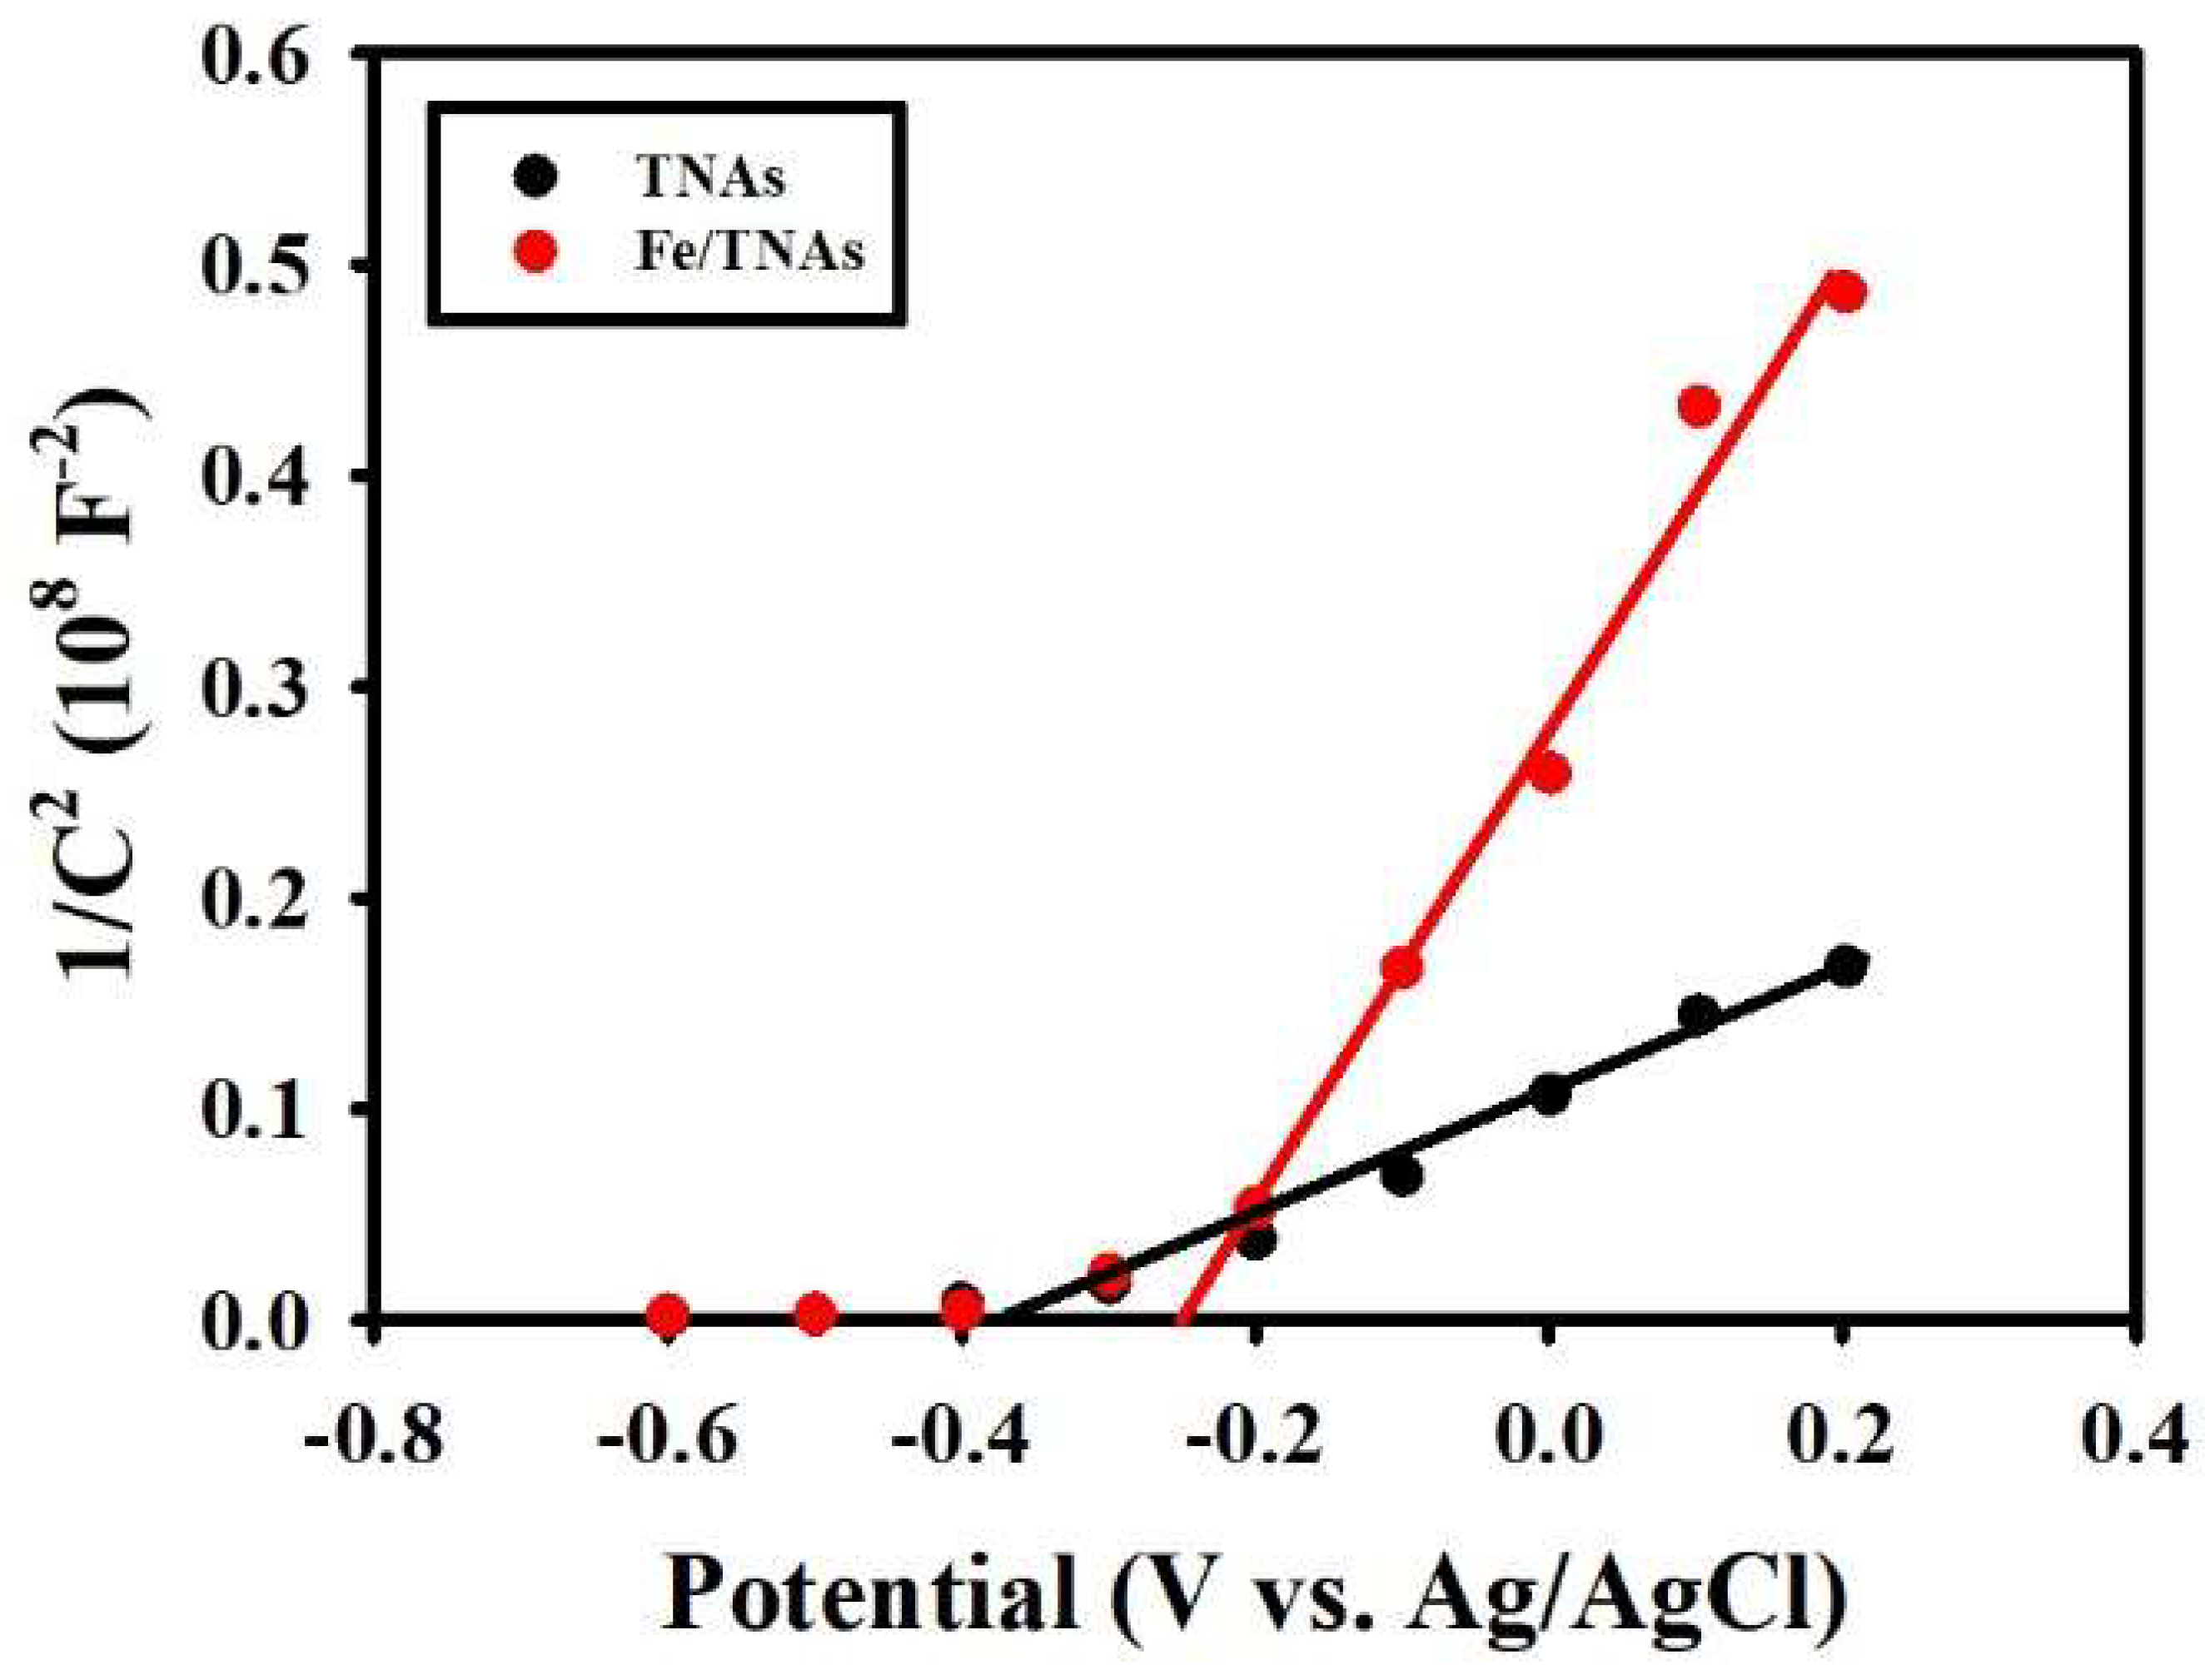
3.7. Mott-Schottky Plot for TNAs and Fe/TNAs
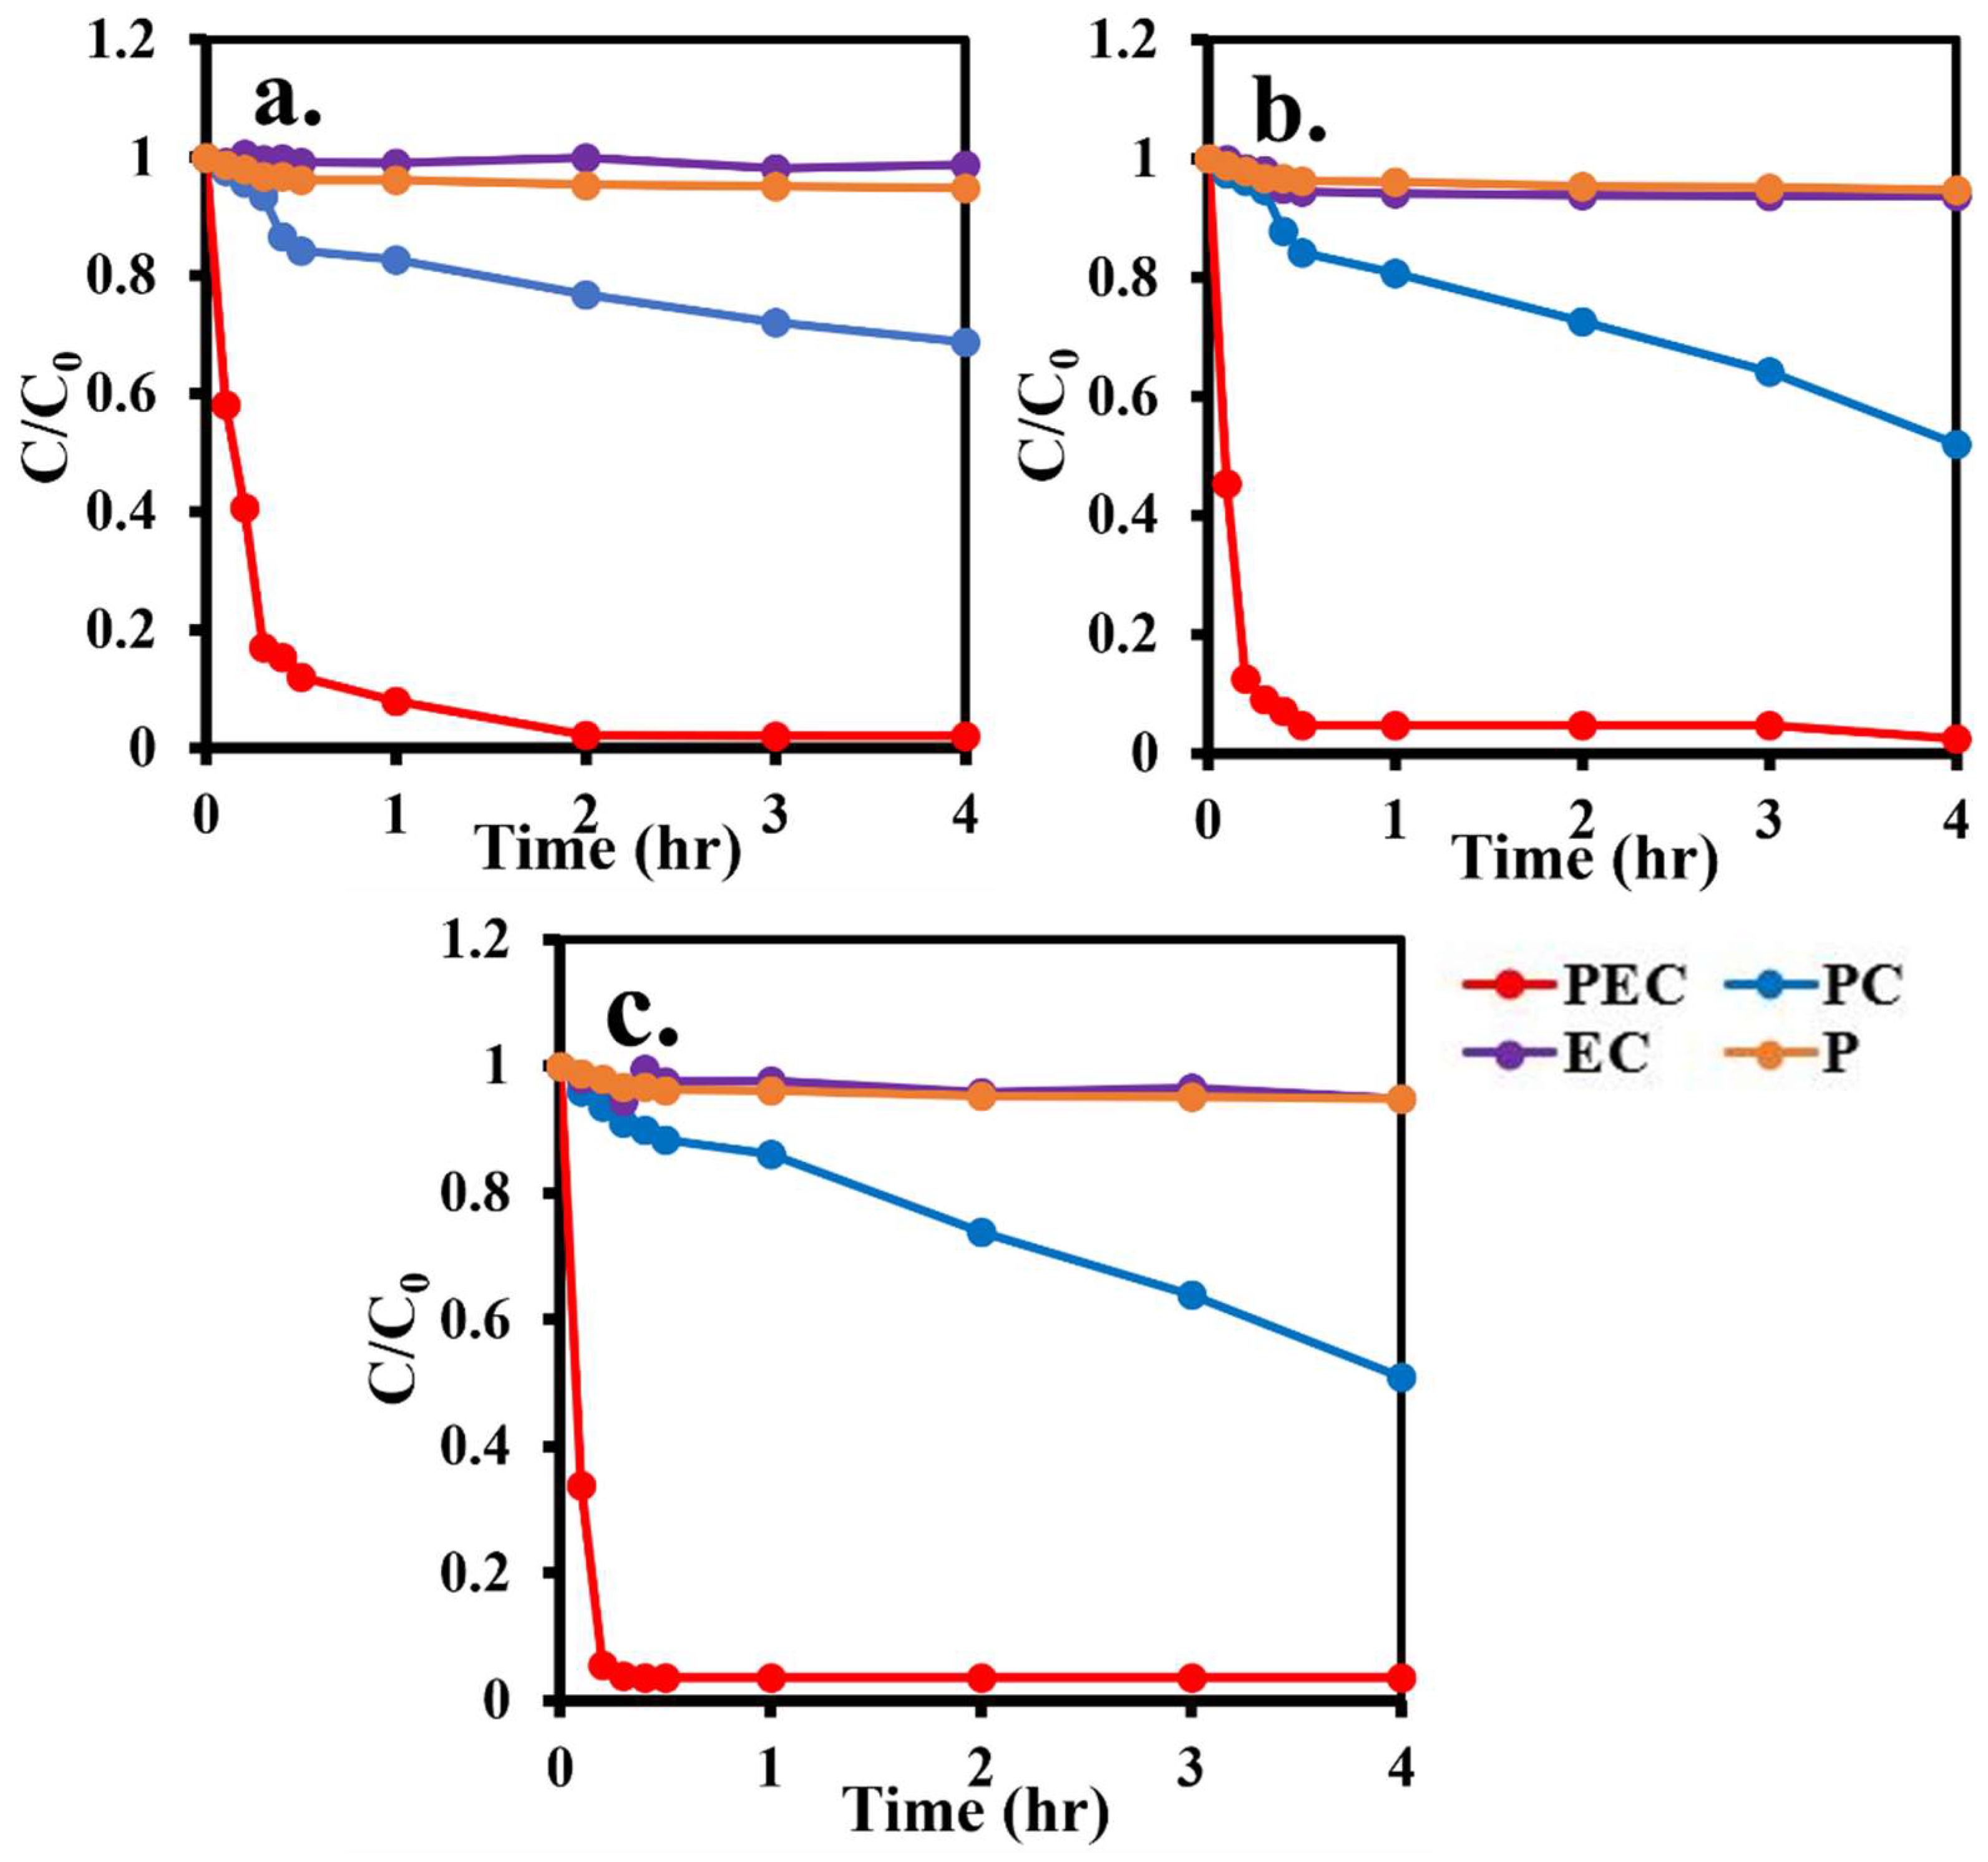
3.8. Methyl Orange Removal
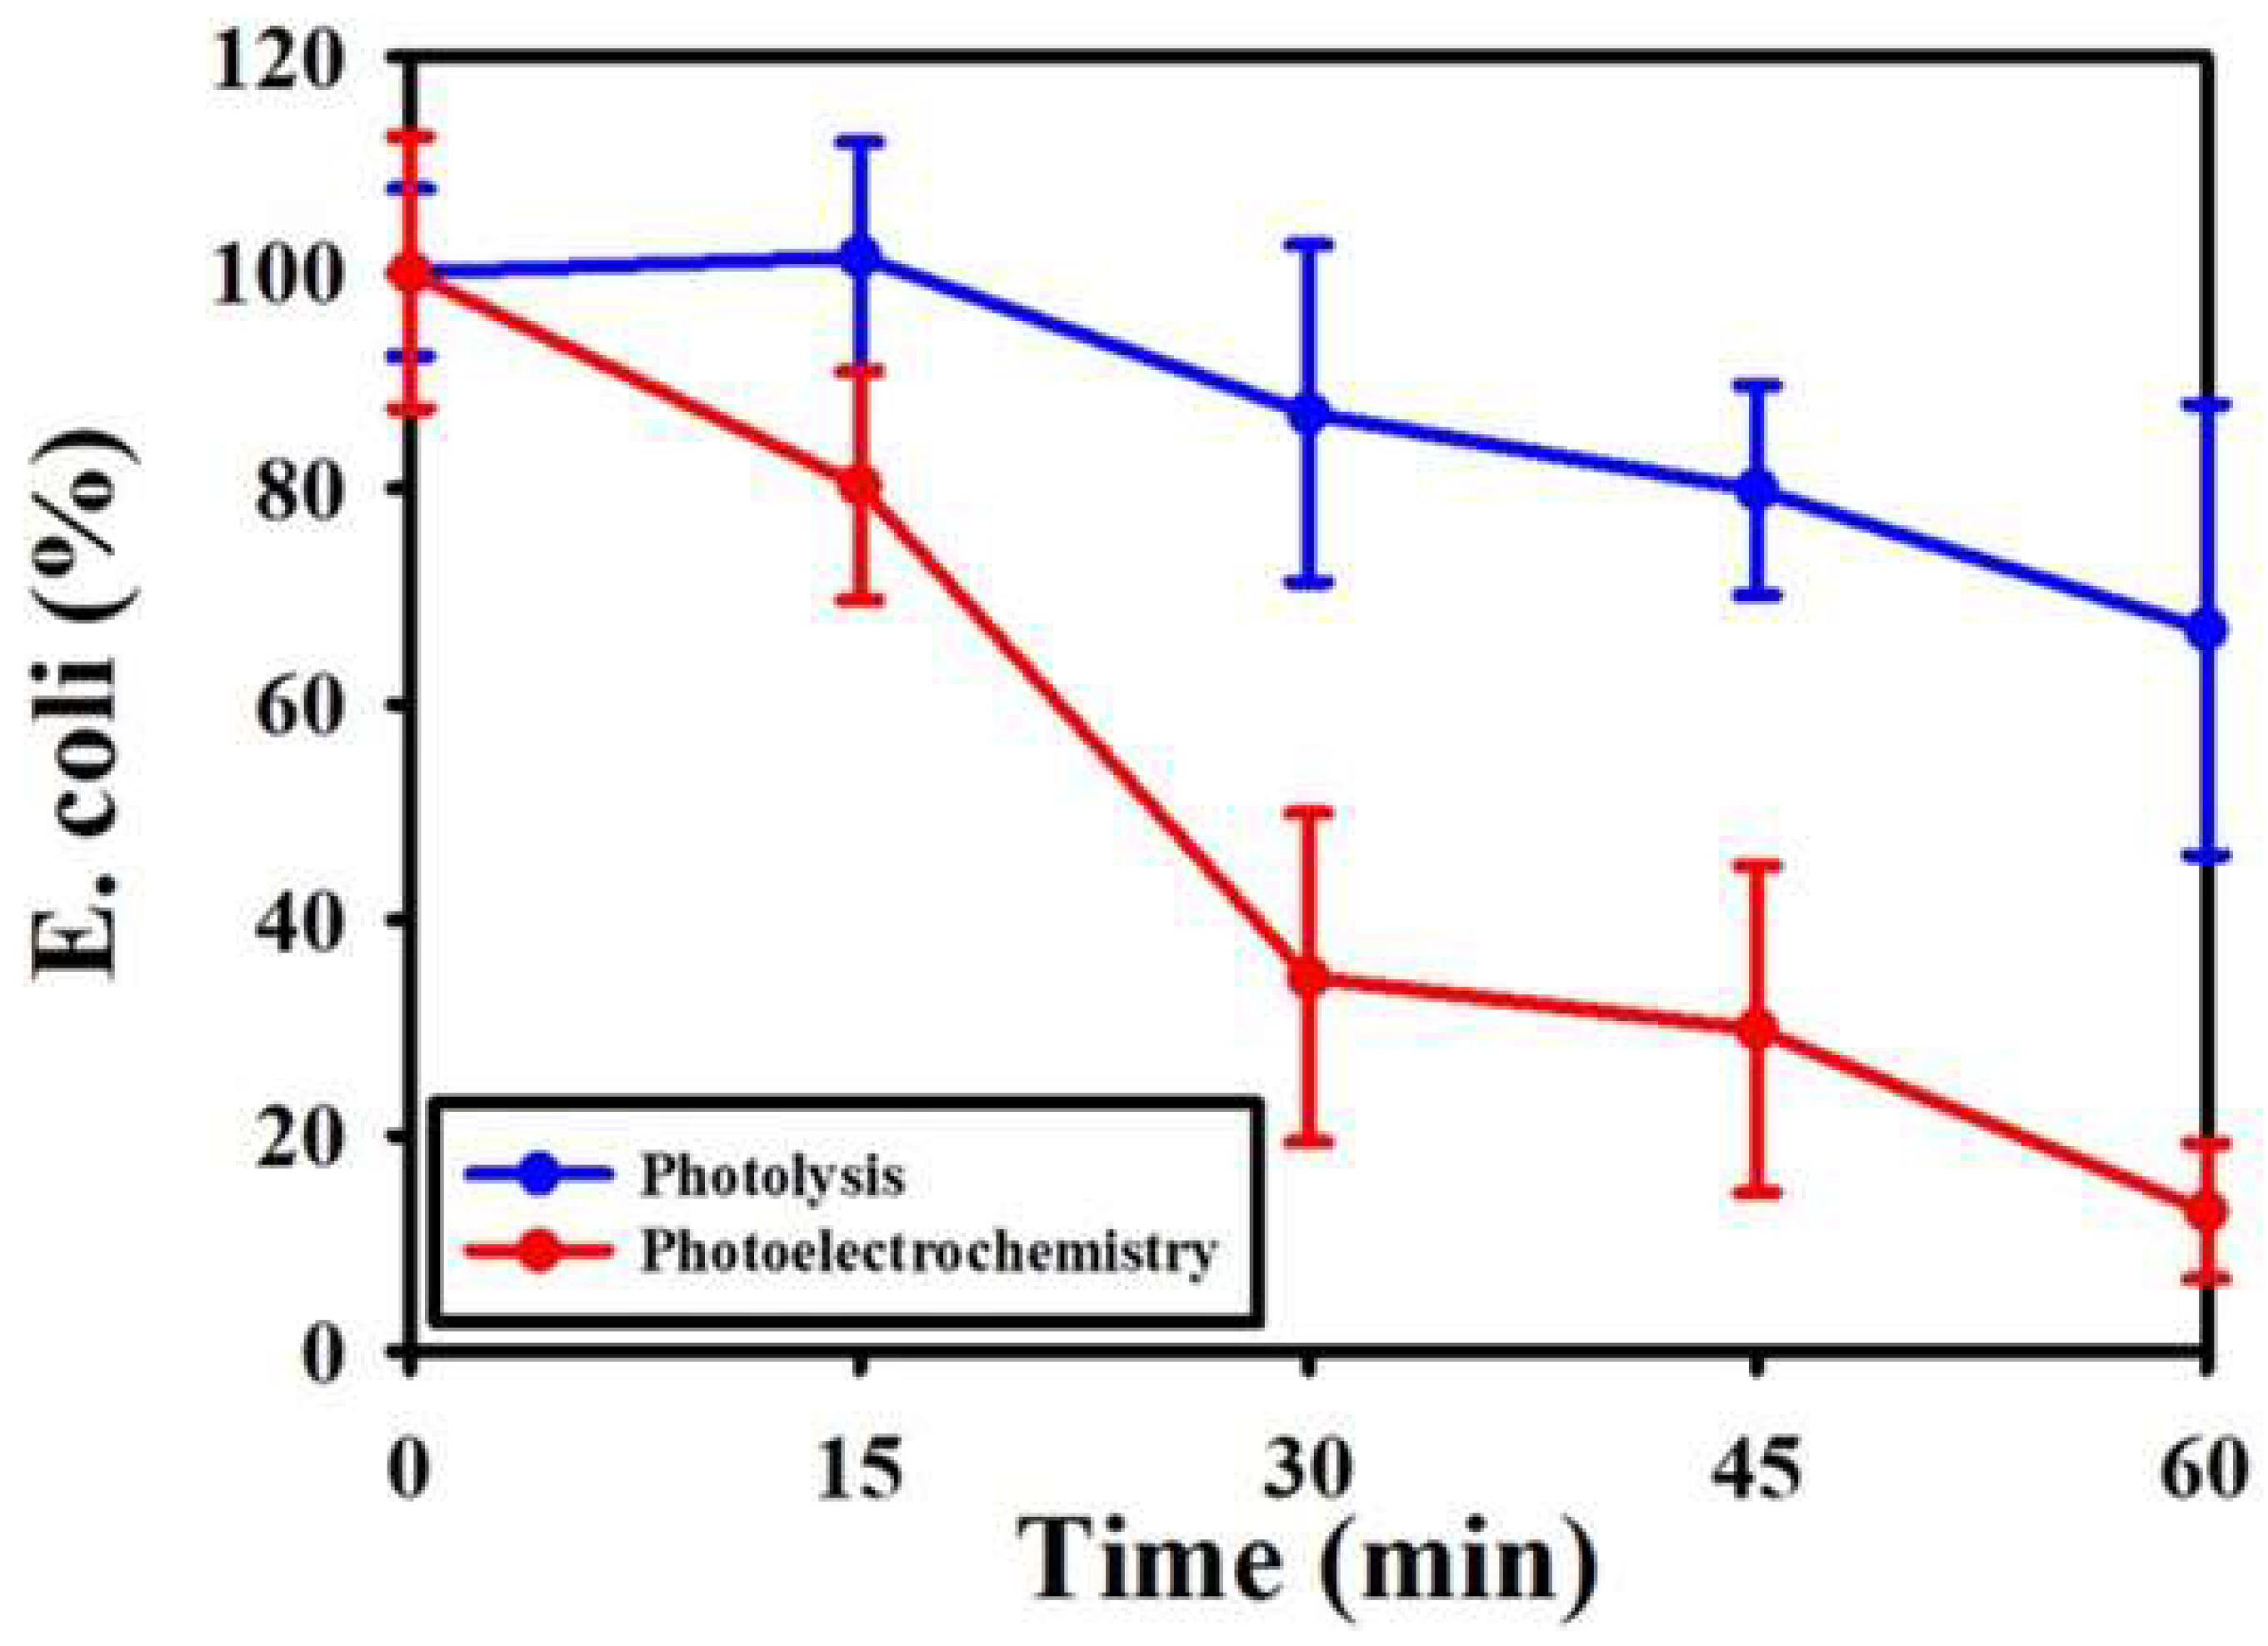
3.9. E. coli Removal by Fe/TNAs PEC System
4. Conclusions
Supplementary Materials
Author Contributions
Funding
Institutional Review Board Statement
Informed Consent Statement
Data Availability Statement
Acknowledgments
Conflicts of Interest
References
- Lee, S.-Y.; Park, S.-J. TiO2 photocatalyst for water treatment applications. J. Ind. Eng. Chem. 2013, 19, 1761–1769. [Google Scholar] [CrossRef]
- Zou, L.; Luo, Y.; Hooper, M.; Hu, E. Removal of VOCs by photocatalysis process using adsorption enhanced TiO2–SiO2 catalyst. Chem. Eng. Process. Process Intensif. 2006, 45, 959–964. [Google Scholar] [CrossRef]
- Tosa, K.; Hirata, T. Photoreactivation of enterohemorrhagic Escherichia coli following UV disinfection. Water Res. 1999, 33, 361–366. [Google Scholar] [CrossRef]
- Liu, P.; Duan, W.; Wang, Q.; Li, X. The damage of outer membrane of Escherichia coli in the presence of TiO2 combined with UV light. Coll. Surf. B Biointerfaces 2010, 78, 171–176. [Google Scholar] [CrossRef]
- Sun, Q.; Peng, Y.-P.; Chen, H.; Chang, K.-L.; Qiu, Y.-N.; Lai, S.-W. Photoelectrochemical oxidation of ibuprofen via Cu2O-doped TiO2 nanotube arrays. J. Hazard. Mater. 2016, 319, 121–129. [Google Scholar] [CrossRef]
- Peng, Y.-P.; Liu, C.-C.; Chen, K.-F.; Huang, C.-P.; Chen, C.-H. Green synthesis of nano-silver–titanium nanotube array (Ag/TNA) composite for concurrent ibuprofen degradation and hydrogen generation. Chemosphere 2021, 264, 128407. [Google Scholar] [CrossRef]
- Üzer, E.; Kumar, P.; Kisslinger, R.; Kar, P.; Thakur, U.K.; Zeng, S.; Shankar, K.; Nilges, T.J. Vapor deposition of semiconducting phosphorus allotropes into TiO2 nanotube arrays for photoelectrocatalytic water splitting. ACS Appl. Nano Mater. 2019, 2, 3358–3367. [Google Scholar] [CrossRef]
- Zeng, S.; Vahidzadeh, E.; VanEssen, C.G.; Kar, P.; Kisslinger, R.; Goswami, A.; Zhang, Y.; Mahdi, N.; Riddell, S.; Kobryn, A.E. Optical control of selectivity of high rate CO2 photoreduction via interband-or hot electron Z-scheme reaction pathways in Au-TiO2 plasmonic photonic crystal photocatalyst. Appl. Catal. B Environ. 2020, 267, 118644. [Google Scholar] [CrossRef]
- Lee, K.-H.; Han, S.-H.; Chuquer, A.; Yang, H.-Y.; Kim, J.; Pham, X.-H.; Yun, W.-J.; Jun, B.-H.; Rho, W.-Y. Effect of Au Nanoparticles and Scattering Layer in Dye-Sensitized Solar Cells Based on Freestanding TiO2 Nanotube Arrays. Nanomaterials 2021, 11, 328. [Google Scholar] [CrossRef]
- Mor, G.K.; Shankar, K.; Paulose, M.; Varghese, O.K.; Grimes, C.A. Use of highly-ordered TiO2 nanotube arrays in dye-sensitized solar cells. Nano Lett. 2006, 6, 215–218. [Google Scholar] [CrossRef] [PubMed]
- Zarifi, M.; Mohammadpour, A.; Farsinezhad, S.; Wiltshire, B.; Nosrati, M.; Askar, A.; Daneshmand, M.; Shankar, K. Time-resolved microwave photoconductivity (TRMC) using planar microwave resonators: Application to the study of long-lived charge pairs in photoexcited titania nanotube arrays. J. Phys. Chem. C 2015, 119, 14358–14365. [Google Scholar] [CrossRef]
- Chen, H.; Peng, Y.-P.; Chen, T.-Y.; Chen, K.-F.; Chang, K.-L.; Dang, Z.; Lu, G.-N.; He, H. Enhanced photoelectrochemical degradation of Ibuprofen and generation of hydrogen via BiOI-deposited TiO2 nanotube arrays. Sci. Total Environ. 2018, 633, 1198–1205. [Google Scholar] [CrossRef] [PubMed]
- Weber, R.; Sakurai, T.; Hagenmaier, H. Low temperature decomposition of PCDD/PCDF, chlorobenzenes and PAHs by TiO2-based V2O5–WO3 catalysts. Appl. Catal. B Environ. 1999, 20, 249–256. [Google Scholar] [CrossRef]
- Gallastegi-Villa, M.; Aranzabal, A.; Gonzalez-Marcos, J.; Gonzalez-Velasco, J. Tailoring dual redox-acid functionalities in VOx/TiO2/ZSM5 catalyst for simultaneous abatement of PCDD/Fs and NOx from municipal solid waste incineration. Appl. Catal. B Environ. 2017, 205, 310–318. [Google Scholar] [CrossRef]
- Peng, Y.-P.; Peng, L.-C.; Chen, K.-F.; Chen, C.-H.; Chang, K.-L.; Chen, K.-S.; Dang, Z.; Lu, G.-N.; Sun, J. Degradation of trichloroethylene by photoelectrochemically activated persulfate. Chemosphere 2020, 254, 126796. [Google Scholar] [CrossRef]
- Komova, O.; Simagina, V.; Kayl, N.; Odegova, G.; Netskina, O.; Chesalov, Y.; Ozerova, A. Improved low-temperature hydrogen generation from NH3BH3 and TiO2 composites pretreated with water. Int. J. Hydrogen Energy 2013, 38, 6442–6449. [Google Scholar] [CrossRef]
- Peng, Y.-P.; Lo, S.-L.; Ou, H.-H.; Lai, S.-W. Microwave-assisted hydrothermal synthesis of N-doped titanate nanotubes for visible-light-responsive photocatalysis. J. Hazard. Mater. 2010, 183, 754–758. [Google Scholar] [CrossRef] [PubMed]
- Vaiano, V.; Sacco, O.; Sannino, D.; Ciambelli, P. Photocatalytic removal of spiramycin from wastewater under visible light with N-doped TiO2 photocatalysts. Chem. Eng. J. 2015, 261, 3–8. [Google Scholar] [CrossRef]
- Wang, H.; Lewis, J.P. Effects of dopant states on photoactivity in carbon-doped TiO2. J. Phys. Condens. Matter 2005, 17, L209. [Google Scholar] [CrossRef]
- Samsudin, E.M.; Abd Hamid, S.B.; Juan, J.C.; Basirun, W.J.; Centi, G. Synergetic effects in novel hydrogenated F-doped TiO2 photocatalysts. Appl. Surf. Sci. 2016, 370, 380–393. [Google Scholar] [CrossRef]
- Ohno, T.; Akiyoshi, M.; Umebayashi, T.; Asai, K.; Mitsui, T.; Matsumura, M. Preparation of S-doped TiO2 photocatalysts and their photocatalytic activities under visible light. Appl. Catal. A Gen. 2004, 265, 115–121. [Google Scholar] [CrossRef]
- Chan, S.C.; Barteau, M.A. Preparation of highly uniform Ag/TiO2 and Au/TiO2 supported nanoparticle catalysts by photodeposition. Langmuir 2005, 21, 5588–5595. [Google Scholar] [CrossRef]
- Kar, P.; Zhang, Y.; Mahdi, N.; Thakur, U.K.; Wiltshire, B.D.; Kisslinger, R.; Shankar, K. Heterojunctions of mixed phase TiO2 nanotubes with Cu, CuPt, and Pt nanoparticles: Interfacial band alignment and visible light photoelectrochemical activity. Nanotechnology 2017, 29, 014002. [Google Scholar] [CrossRef]
- Li, H.; Bian, Z.; Zhu, J.; Huo, Y.; Li, H.; Lu, Y. Mesoporous Au/TiO2 nanocomposites with enhanced photocatalytic activity. J. Am. Chem. Soc. 2007, 129, 4538–4539. [Google Scholar] [CrossRef]
- Lin, Y.-C.; Chen, C.-H.; Chen, K.-S.; Peng, Y.-P.; Lin, Y.-C.; Huang, S.-W.; Huang, C.-E.; Lai, H.-W.; Li, H.-W. Green Synthesized Palladium Coated Titanium Nanotube Arrays for Simultaneous Azo-Dye Degradation and Hydrogen Production. Catalysts 2020, 10, 1330. [Google Scholar] [CrossRef]
- Dolat, D.; Mozia, S.; Ohtani, B.; Morawski, A. Nitrogen, iron-single modified (N-TiO2, Fe-TiO2) and co-modified (Fe, N-TiO2) rutile titanium dioxide as visible-light active photocatalysts. Chem. Eng. J. 2013, 225, 358–364. [Google Scholar] [CrossRef]
- Arana, J.; Dıaz, O.G.; Saracho, M.M.; Rodrıguez, J.D.; Melián, J.H.; Peña, J.P. Photocatalytic degradation of formic acid using Fe/TiO2 catalysts: The role of Fe3+/Fe2+ ions in the degradation mechanism. Appl. Catal. B Environ. 2001, 32, 49–61. [Google Scholar] [CrossRef]
- Liu, Y.; Zhou, S.; Yang, F.; Qin, H.; Kong, Y. Degradation of phenol in industrial wastewater over the F–Fe/TiO2 photocatalysts under visible light illumination. Chin. J. Chem. Eng. 2016, 24, 1712–1718. [Google Scholar] [CrossRef]
- Zafar, Z.; Fatima, R.; Kim, J.-O.J.E.R. Experimental studies on water matrix and influence of textile effluents on photocatalytic degradation of organic wastewater using Fe–TiO2 nanotubes: Towards commercial application. Environ. Res. 2021, 197, 111120. [Google Scholar] [CrossRef] [PubMed]
- Mor, G.K.; Varghese, O.K.; Paulose, M.; Shankar, K.; Grimes, C.A. A review on highly ordered, vertically oriented TiO2 nanotube arrays: Fabrication, material properties, and solar energy applications. Sol. Energy Mater. Sol. Cells 2006, 90, 2011–2075. [Google Scholar] [CrossRef]
- Federation, W.E. Water Environment Federation Ultraviolet Disinfection; Federation, W.E., Ed.; Water Environment Federation: Alexandria, VA, USA, 1996; pp. 227–291. [Google Scholar]
- Chen, W.-H.; Wang, Y.-H.; Hsu, T.-H. The competitive effect of different chlorination disinfection methods and additional inorganic nitrogen on nitrosamine formation from aromatic and heterocyclic amine-containing pharmaceuticals. Chemosphere 2021, 267, 128922. [Google Scholar] [CrossRef] [PubMed]
- Bialka, K.L.; Demirci, A.J. Decontamination of Escherichia coli O157: H7 and Salmonella enterica on blueberries using ozone and pulsed UV-light. J. Food Sci. 2007, 72, M391–M396. [Google Scholar] [CrossRef] [PubMed]
- Ukuku, D.O.; Geveke, D.J. A combined treatment of UV-light and radio frequency electric field for the inactivation of Escherichia coli K-12 in apple juice. Int. J. Food Microbiol. 2010, 138, 50–55. [Google Scholar] [CrossRef] [PubMed]
- Cao, C.; Zhang, G.; Ye, J.; Hua, R.; Sun, Z.; Cui, J. Fast growth of self-aligned titania nanotube arrays with excellent transient photoelectric responses. Electrochim. Acta 2016, 211, 552–560. [Google Scholar] [CrossRef]
- Choi, H.; Al-Abed, S.R.; Agarwal, S.; Dionysiou, D.D. Synthesis of reactive nano-Fe/Pd bimetallic system-impregnated activated carbon for the simultaneous adsorption and dechlorination of PCBs. Chem. Mater. 2008, 20, 3649–3655. [Google Scholar] [CrossRef]
- Sharma, B.; Boruah, P.K.; Yadav, A.; Das, M.R. TiO2–Fe2O3 nanocomposite heterojunction for superior charge separation and the photocatalytic inactivation of pathogenic bacteria in water under direct sunlight irradiation. J. Environ. Chem. Eng. 2018, 6, 134–145. [Google Scholar] [CrossRef]
- Solano, R.A.; Herrera, A.P.; Maestre, D.; Cremades, A. Fe-TiO2 nanoparticles synthesized by green chemistry for potential application in waste water photocatalytic treatment. J. Nanotechnol. 2019, 2019, 4571848. [Google Scholar] [CrossRef] [Green Version]
- Zhu, J.; Chen, F.; Zhang, J.; Chen, H.; Anpo, M. Fe3+-TiO2 photocatalysts prepared by combining sol–gel method with hydrothermal treatment and their characterization. J. Photochem. Photobiol. A Chem. 2006, 180, 196–204. [Google Scholar] [CrossRef]
- Huerta-Flores, A.M.; Chávez-Angulo, G.; Carrasco-Jaim, O.A.; Torres-Martínez, L.M.; Garza-Navarro, M. Enhanced photoelectrochemical water splitting on heterostructured α-Fe2O3-TiO2: X (X = Co, Cu, Bi) photoanodes: Role of metal doping on charge carrier dynamics improvement. J. Photochem. Photobiol. A Chem. 2021, 410, 113077. [Google Scholar] [CrossRef]
- Wang, X.; Wang, A.; Lu, M.; Ma, J. Synthesis of magnetically recoverable Fe0/graphene-TiO2 nanowires composite for both reduction and photocatalytic oxidation of metronidazole. Chem. Eng. J. 2018, 337, 372–384. [Google Scholar] [CrossRef]
- Hsieh, W.-P.; Pan, J.R.; Huang, C.; Su, Y.-C.; Juang, Y.-J. Enhance the photocatalytic activity for the degradation of organic contaminants in water by incorporating TiO2 with zero-valent iron. Sci. Total. Environ. 2010, 408, 672–679. [Google Scholar] [CrossRef] [PubMed]
- Xia, H.; Xiong, W.; Lim, C.K.; Yao, Q.; Wang, Y.; Xie, J. Hierarchical TiO2-B nanowire@ α-Fe2O3 nanothorn core-branch arrays as superior electrodes for lithium-ion microbatteries. Nano Res. 2014, 7, 1797–1808. [Google Scholar] [CrossRef]
- Zhu, X.; Xu, H.; Yao, Y.; Liu, H.; Wang, J.; Pu, Y.; Feng, W.; Chen, S. Effects of Ag 0-modification and Fe3+-doping on the structural, optical and photocatalytic properties of TiO2. RSC Adv. 2019, 9, 40003–40012. [Google Scholar] [CrossRef] [Green Version]
- Tauc, J. Absorption edge and internal electric fields in amorphous semiconductors. Mater. Res. Bull. 1970, 5, 721–729. [Google Scholar] [CrossRef]
- Arellano, U.; Asomoza, M.; Ramirez, F. Antimicrobial activity of Fe–TiO2 thin film photocatalysts. J. Photochem. Photobiol. A Chem. 2011, 222, 159–165. [Google Scholar] [CrossRef]
- Zeng, G.; Zhang, Q.; Liu, Y.; Zhang, S.; Guo, J. Preparation of TiO2 and Fe-TiO2 with an impinging stream-rotating packed bed by the precipitation method for the photodegradation of gaseous toluene. Nanomaterials 2019, 9, 1173. [Google Scholar] [CrossRef] [Green Version]
- Chakhari, W.; Naceur, J.B.; Taieb, S.B.; Assaker, I.B.; Chtourou, R. Fe-doped TiO2 nanorods with enhanced electrochemical properties as efficient photoanode materials. J. Alloy. Compd. 2017, 708, 862–870. [Google Scholar] [CrossRef]
- Liu, Q.-P. Analysis on dye-sensitized solar cells based on Fe-doped TiO2 by intensity-modulated photocurrent spectroscopy and Mott–Schottky. Chin. Chem. Lett. 2014, 25, 953–956. [Google Scholar] [CrossRef]
- Tang, H.; Prasad, K.; Sanjines, R.; Schmid, P.; Levy, F. Electrical and optical properties of TiO2 anatase thin films. J. Appl. Phys. 1994, 75, 2042–2047. [Google Scholar] [CrossRef]
- Cui, H.; Zhao, W.; Yang, C.; Yin, H.; Lin, T.; Shan, Y.; Xie, Y.; Gu, H.; Huang, F. Black TiO2 nanotube arrays for high-efficiency photoelectrochemical water-splitting. J. Mater. Chem. A 2014, 2, 8612–8616. [Google Scholar] [CrossRef]
- Sahoo, P.P.; Zoellner, B.; Maggard, P.A. Optical, electronic, and photoelectrochemical properties of the p-type Cu3−xVO4 semiconductor. J. Mater. Chem. A 2015, 3, 4501–4509. [Google Scholar] [CrossRef]
- Seger, B.; Tilley, S.D.; Pedersen, T.; Vesborg, P.C.; Hansen, O.; Grätzel, M.; Chorkendorff, I. Silicon protected with atomic layer deposited TiO2: Conducting versus tunnelling through TiO2. J. Mater. Chem. A 2013, 1, 15089–15094. [Google Scholar] [CrossRef]
- Freitas, R.; Santanna, M.; Pereira, E. Preparation and characterization of TiO2 nanotube arrays in ionic liquid for water splitting. Electrochim. Acta 2014, 136, 404–411. [Google Scholar] [CrossRef]
- Kormann, C.; Bahnemann, D.W.; Hoffmann, M.R. Preparation and characterization of quantum-size titanium dioxide. J. Phys. Chem. 1988, 92, 5196–5201. [Google Scholar] [CrossRef]
- Ma, B.; Yu, N.; Xin, S.; Xin, Y.; Zhang, C.; Ma, X.; Gao, M. Photoelectrocatalytic degradation of p-chloronitrobenzene by g-C3N4/TiO2 nanotube arrays photoelectrodes under visible light irradiation. Chemosphere 2021, 267, 129242. [Google Scholar] [CrossRef]

| Elements | C (Atomict %) | O (Atomict %) | Ti (Atomict %) | Fe (Atomict %) | Total | |
|---|---|---|---|---|---|---|
| Sample | ||||||
| TNAs | 2.03 | 63.82 | 34.15 | 0.00 | 100.0 | |
| Fe/TNAs-0.2 | 1.97 | 63.25 | 33.84 | 0.93 | 100.0 | |
| Fe/TNAs-0.5 | 9.96 | 66.08 | 16.51 | 7.44 | 100.0 | |
| Elements | C (Atomict %) | O (Atomict %) | Ti (Atomict %) | Fe (Atomict %) | |
|---|---|---|---|---|---|
| Sample | |||||
| Fe/TNAs-0.2 | 50.9 | 45.1 | 3 | 0.9 | |
| Fe/TNAs-0.5 | 53.4 | 27.7 | 16 | 2.9 | |
| Rs(Ω) | Rp(Ω) | CPE(Ω) | fmaz | τt (ms) | |
|---|---|---|---|---|---|
| TNAs | 38.93 | 209.50 | 0.0057 | 0.5484 | 290.3 |
| Fe/TNAs-0.2 | 35.68 | 143.33 | 0.0066 | 0.4489 | 354.7 |
| Fe/TNAs-0.5 | 34.56 | 130.97 | 0.0056 | 0.3674 | 433.3 |
Publisher’s Note: MDPI stays neutral with regard to jurisdictional claims in published maps and institutional affiliations. |
© 2021 by the authors. Licensee MDPI, Basel, Switzerland. This article is an open access article distributed under the terms and conditions of the Creative Commons Attribution (CC BY) license (https://creativecommons.org/licenses/by/4.0/).
Share and Cite
Chen, C.-H.; Peng, Y.-P.; Lin, M.-H.; Chang, K.-L.; Lin, Y.-C.; Sun, J. Iron Modified Titanate Nanotube Arrays for Photoelectrochemical Removal of E. coli. Nanomaterials 2021, 11, 1944. https://doi.org/10.3390/nano11081944
Chen C-H, Peng Y-P, Lin M-H, Chang K-L, Lin Y-C, Sun J. Iron Modified Titanate Nanotube Arrays for Photoelectrochemical Removal of E. coli. Nanomaterials. 2021; 11(8):1944. https://doi.org/10.3390/nano11081944
Chicago/Turabian StyleChen, Chia-Hung, Yen-Ping Peng, Ming-Hsun Lin, Ken-Lin Chang, Yung-Chang Lin, and Jian Sun. 2021. "Iron Modified Titanate Nanotube Arrays for Photoelectrochemical Removal of E. coli" Nanomaterials 11, no. 8: 1944. https://doi.org/10.3390/nano11081944
APA StyleChen, C.-H., Peng, Y.-P., Lin, M.-H., Chang, K.-L., Lin, Y.-C., & Sun, J. (2021). Iron Modified Titanate Nanotube Arrays for Photoelectrochemical Removal of E. coli. Nanomaterials, 11(8), 1944. https://doi.org/10.3390/nano11081944