
Synthesis and Characterization of Photoluminescent Ce(III) and Ce(IV) Substituted Hydroxyapatite Nanomaterials by Co-Precipitation Method: Cytotoxicity and Biocompatibility Evaluation


 , , ,
, , ,  and
and
Abstract
:1. Introduction
2. Materials and Methods
2.1. Chemical Materials
2.2. Syhthesis of Pure HAp, Ce3+-Doped Hydroxyapatite and Ce4+-Doped Hydroxyapatite by the Co-Precipitation Method
2.3. Sample Characterization
2.4. Cellular Viability Assays
2.4.1. MTT Assay
2.4.2. GSH-Glo Glutathione Assay
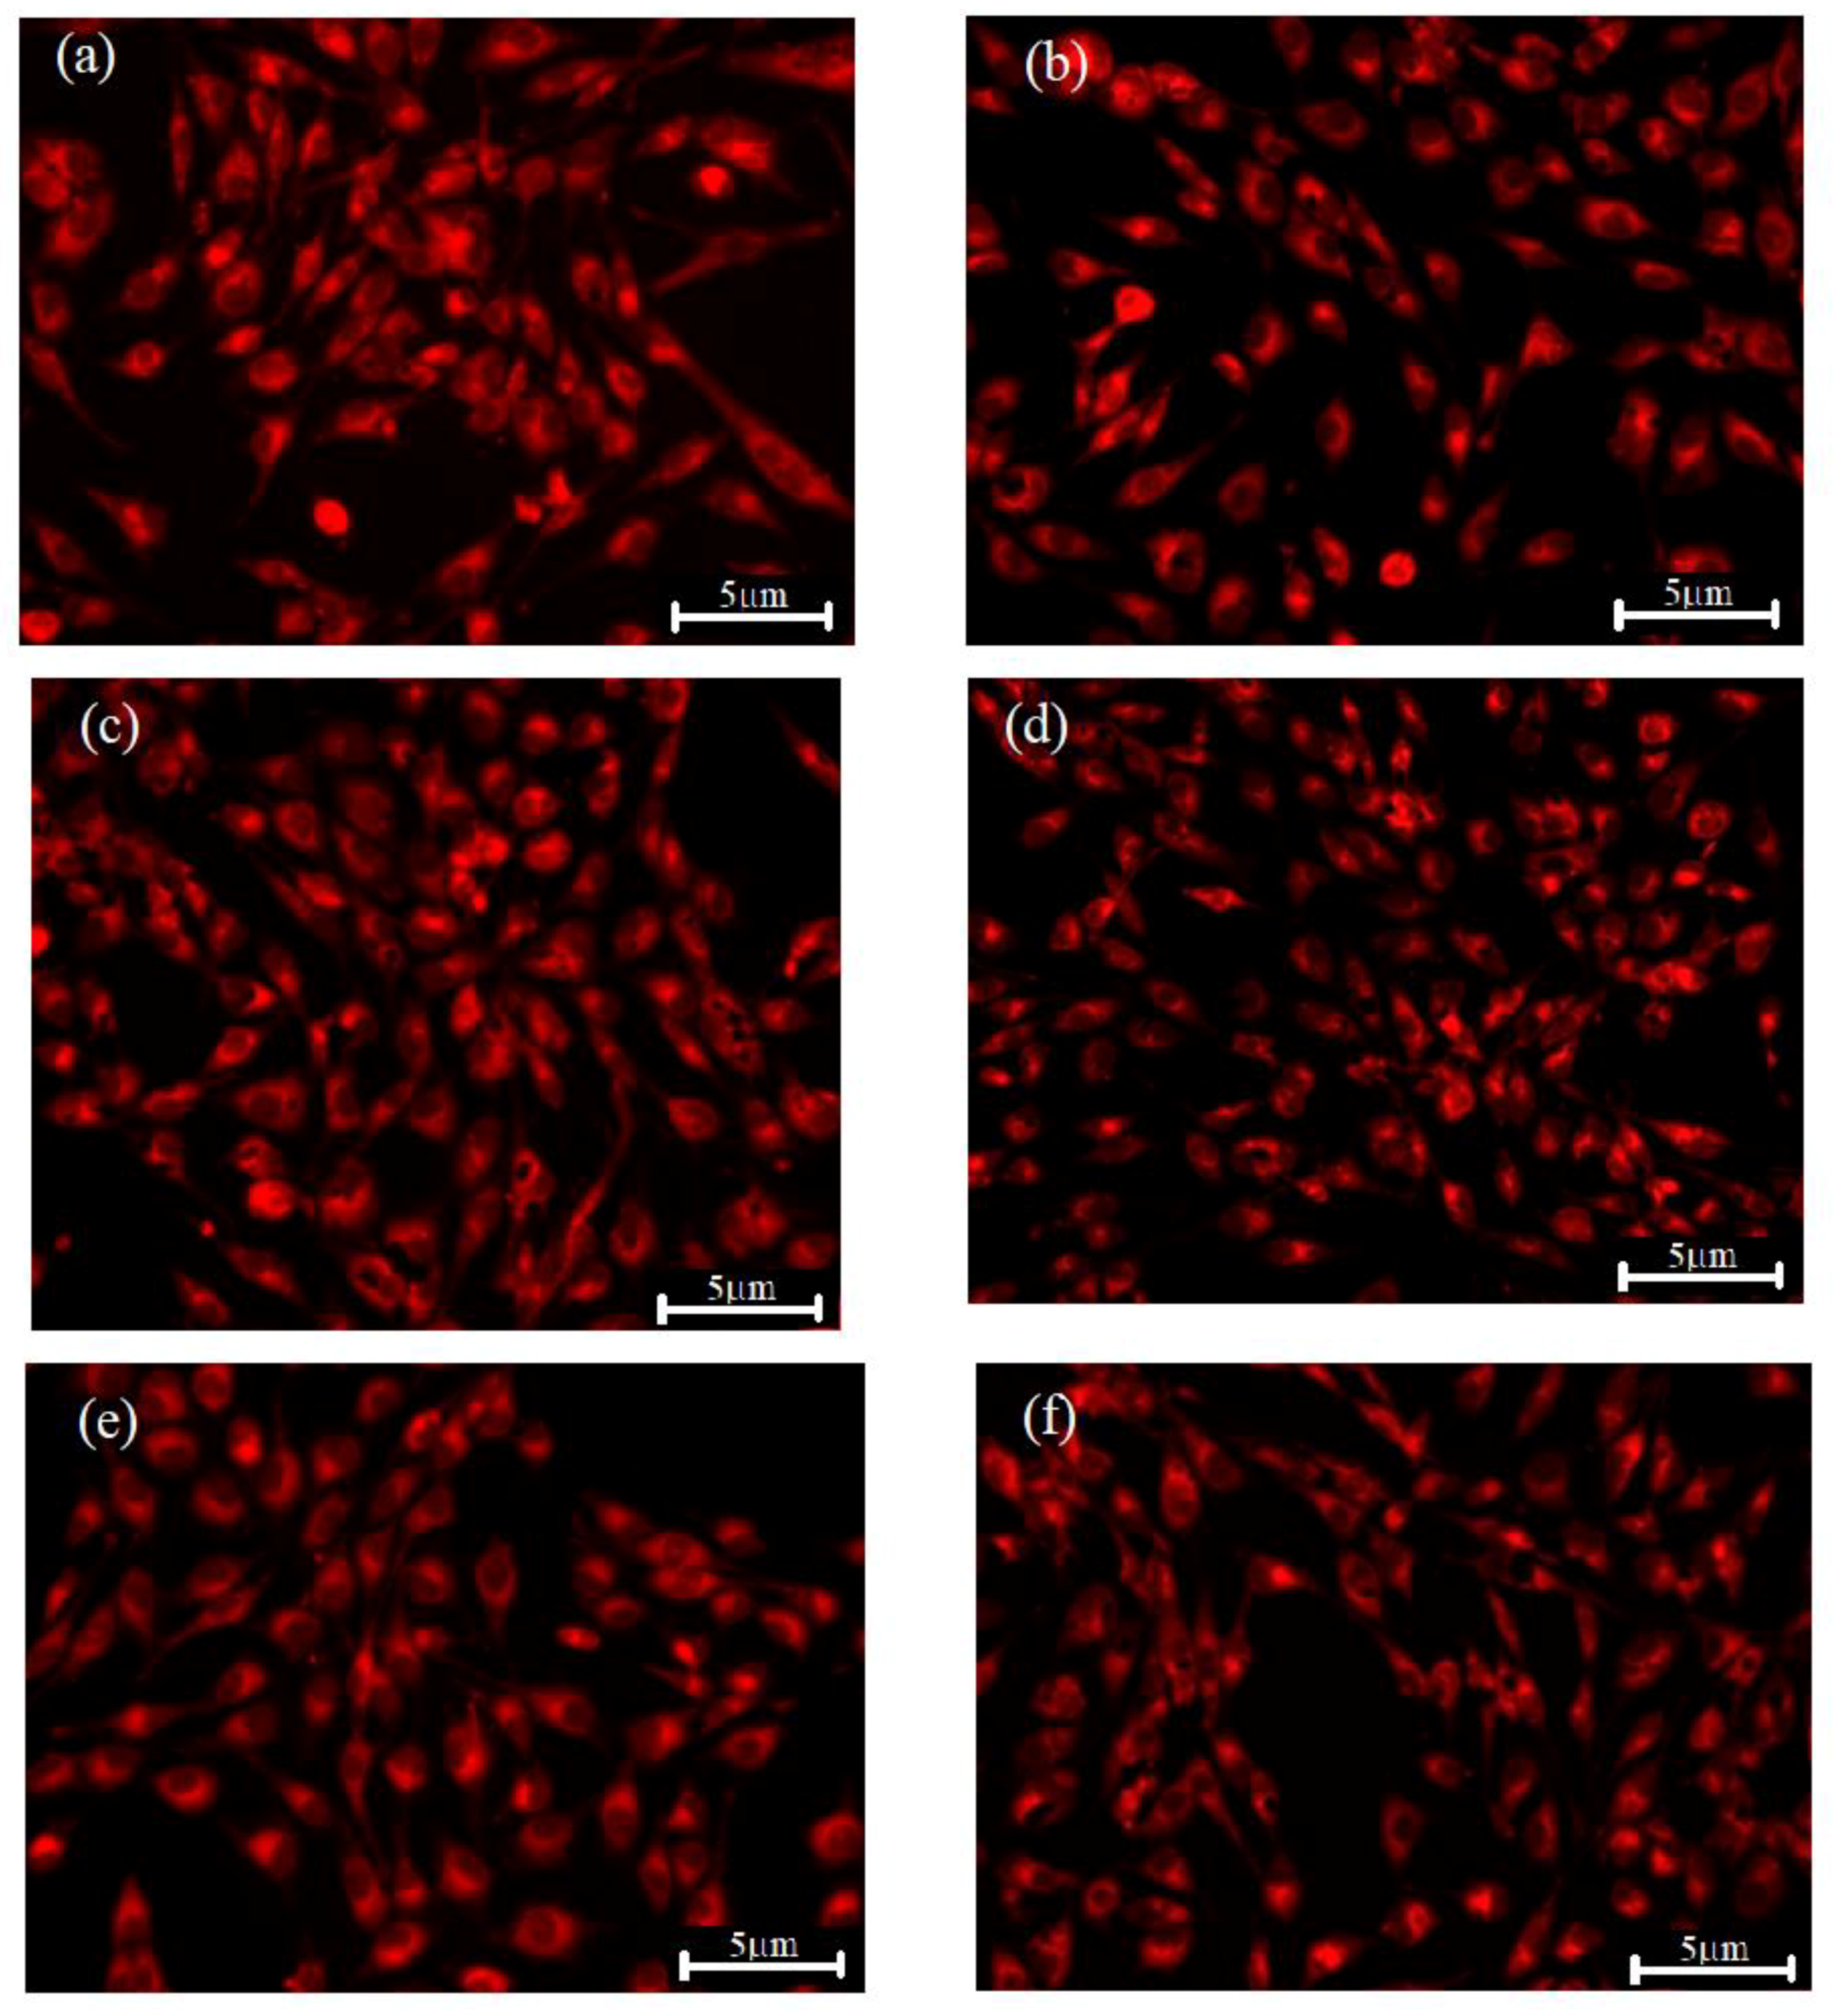
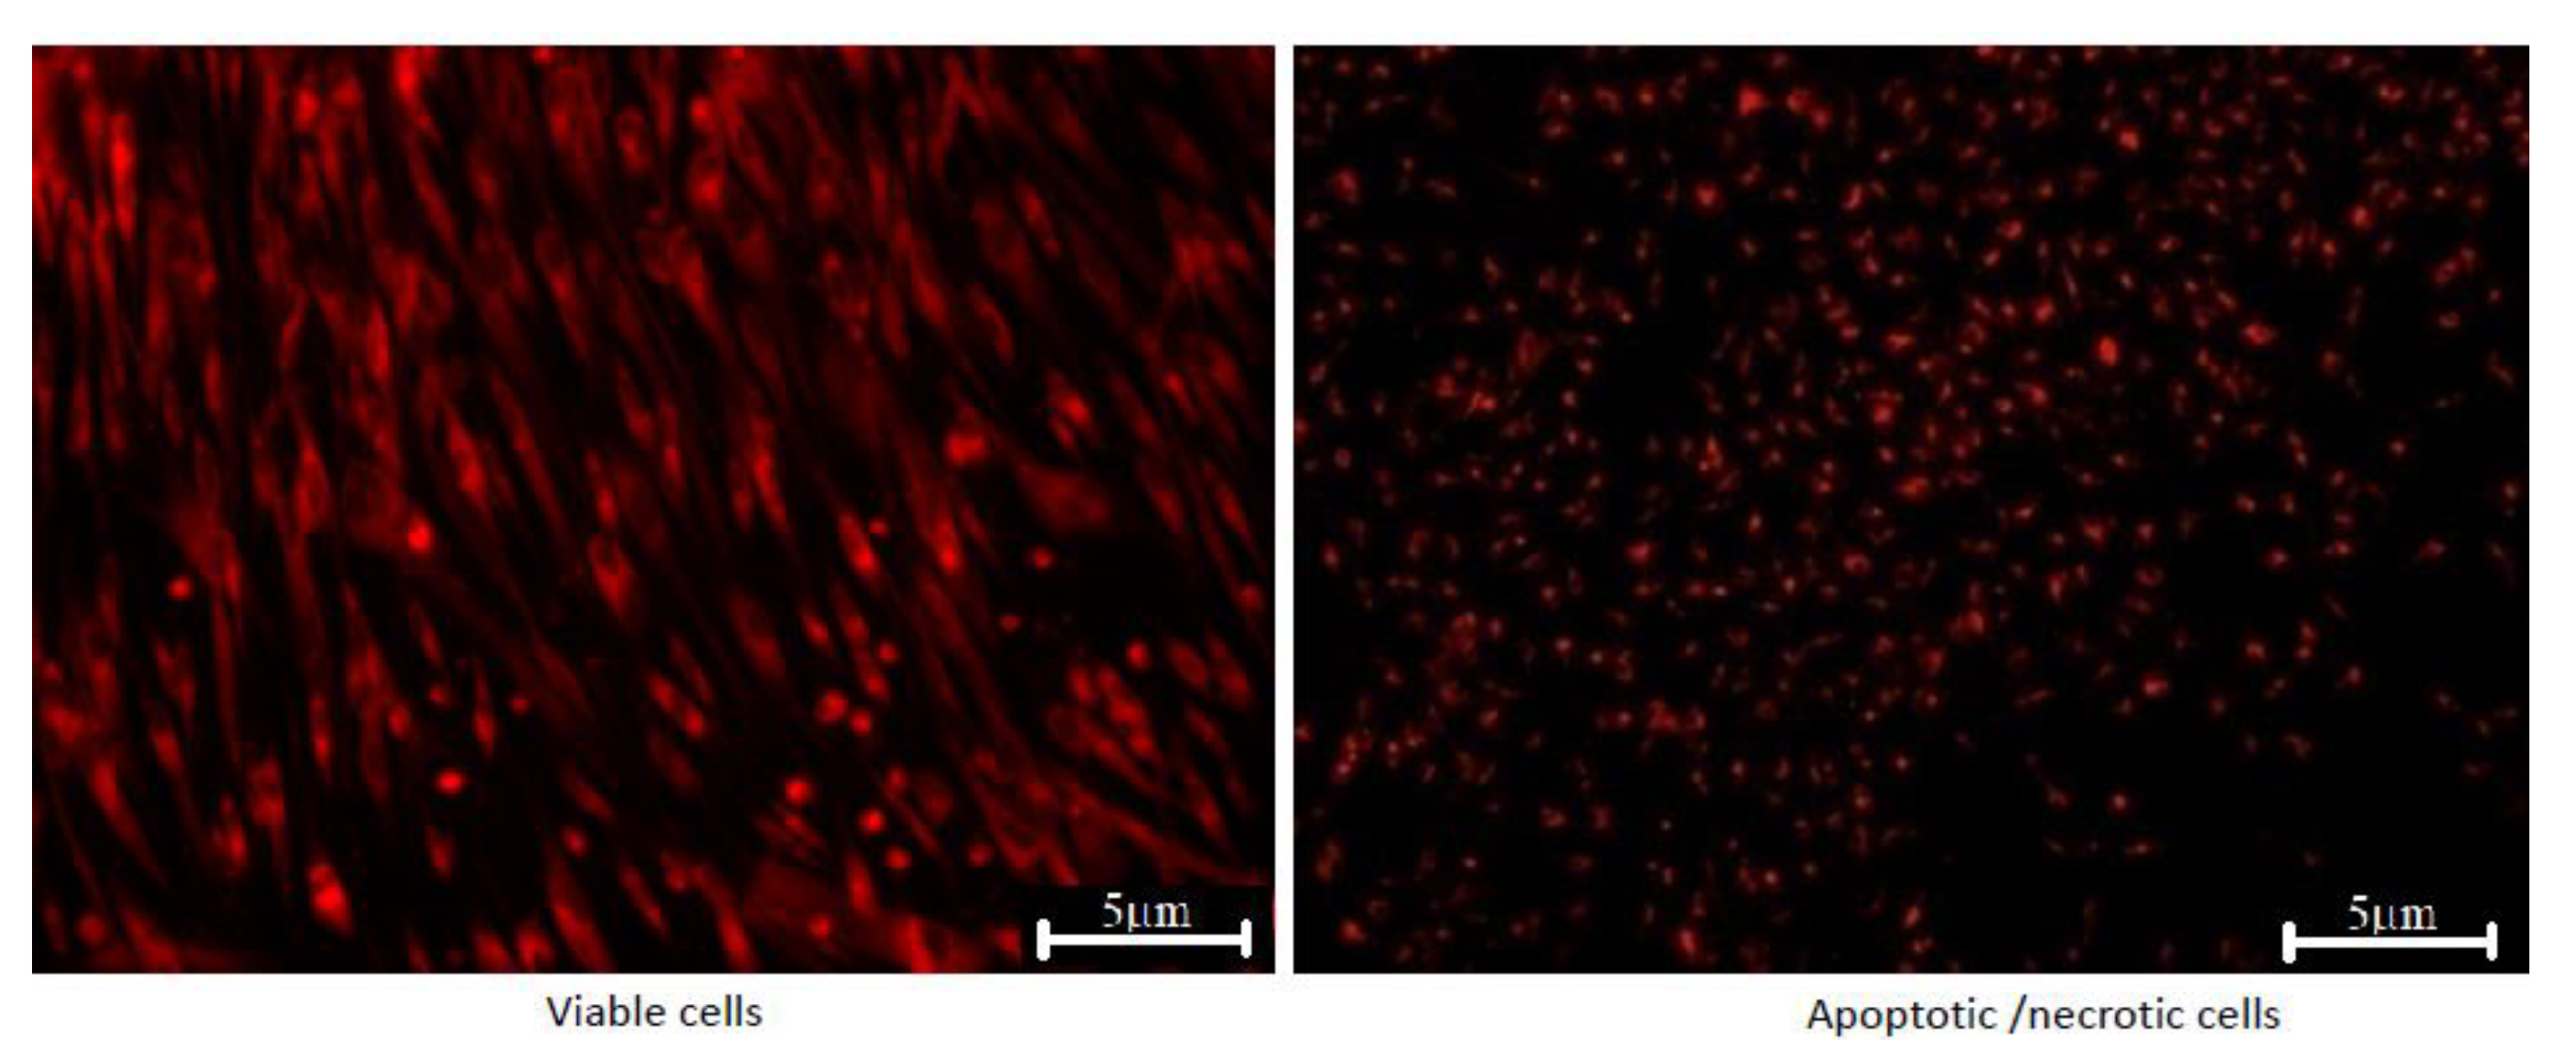
2.4.3. Cell Morphology and Viability Evaluation—Fluorescence Microscopy
3. Results and Discussion
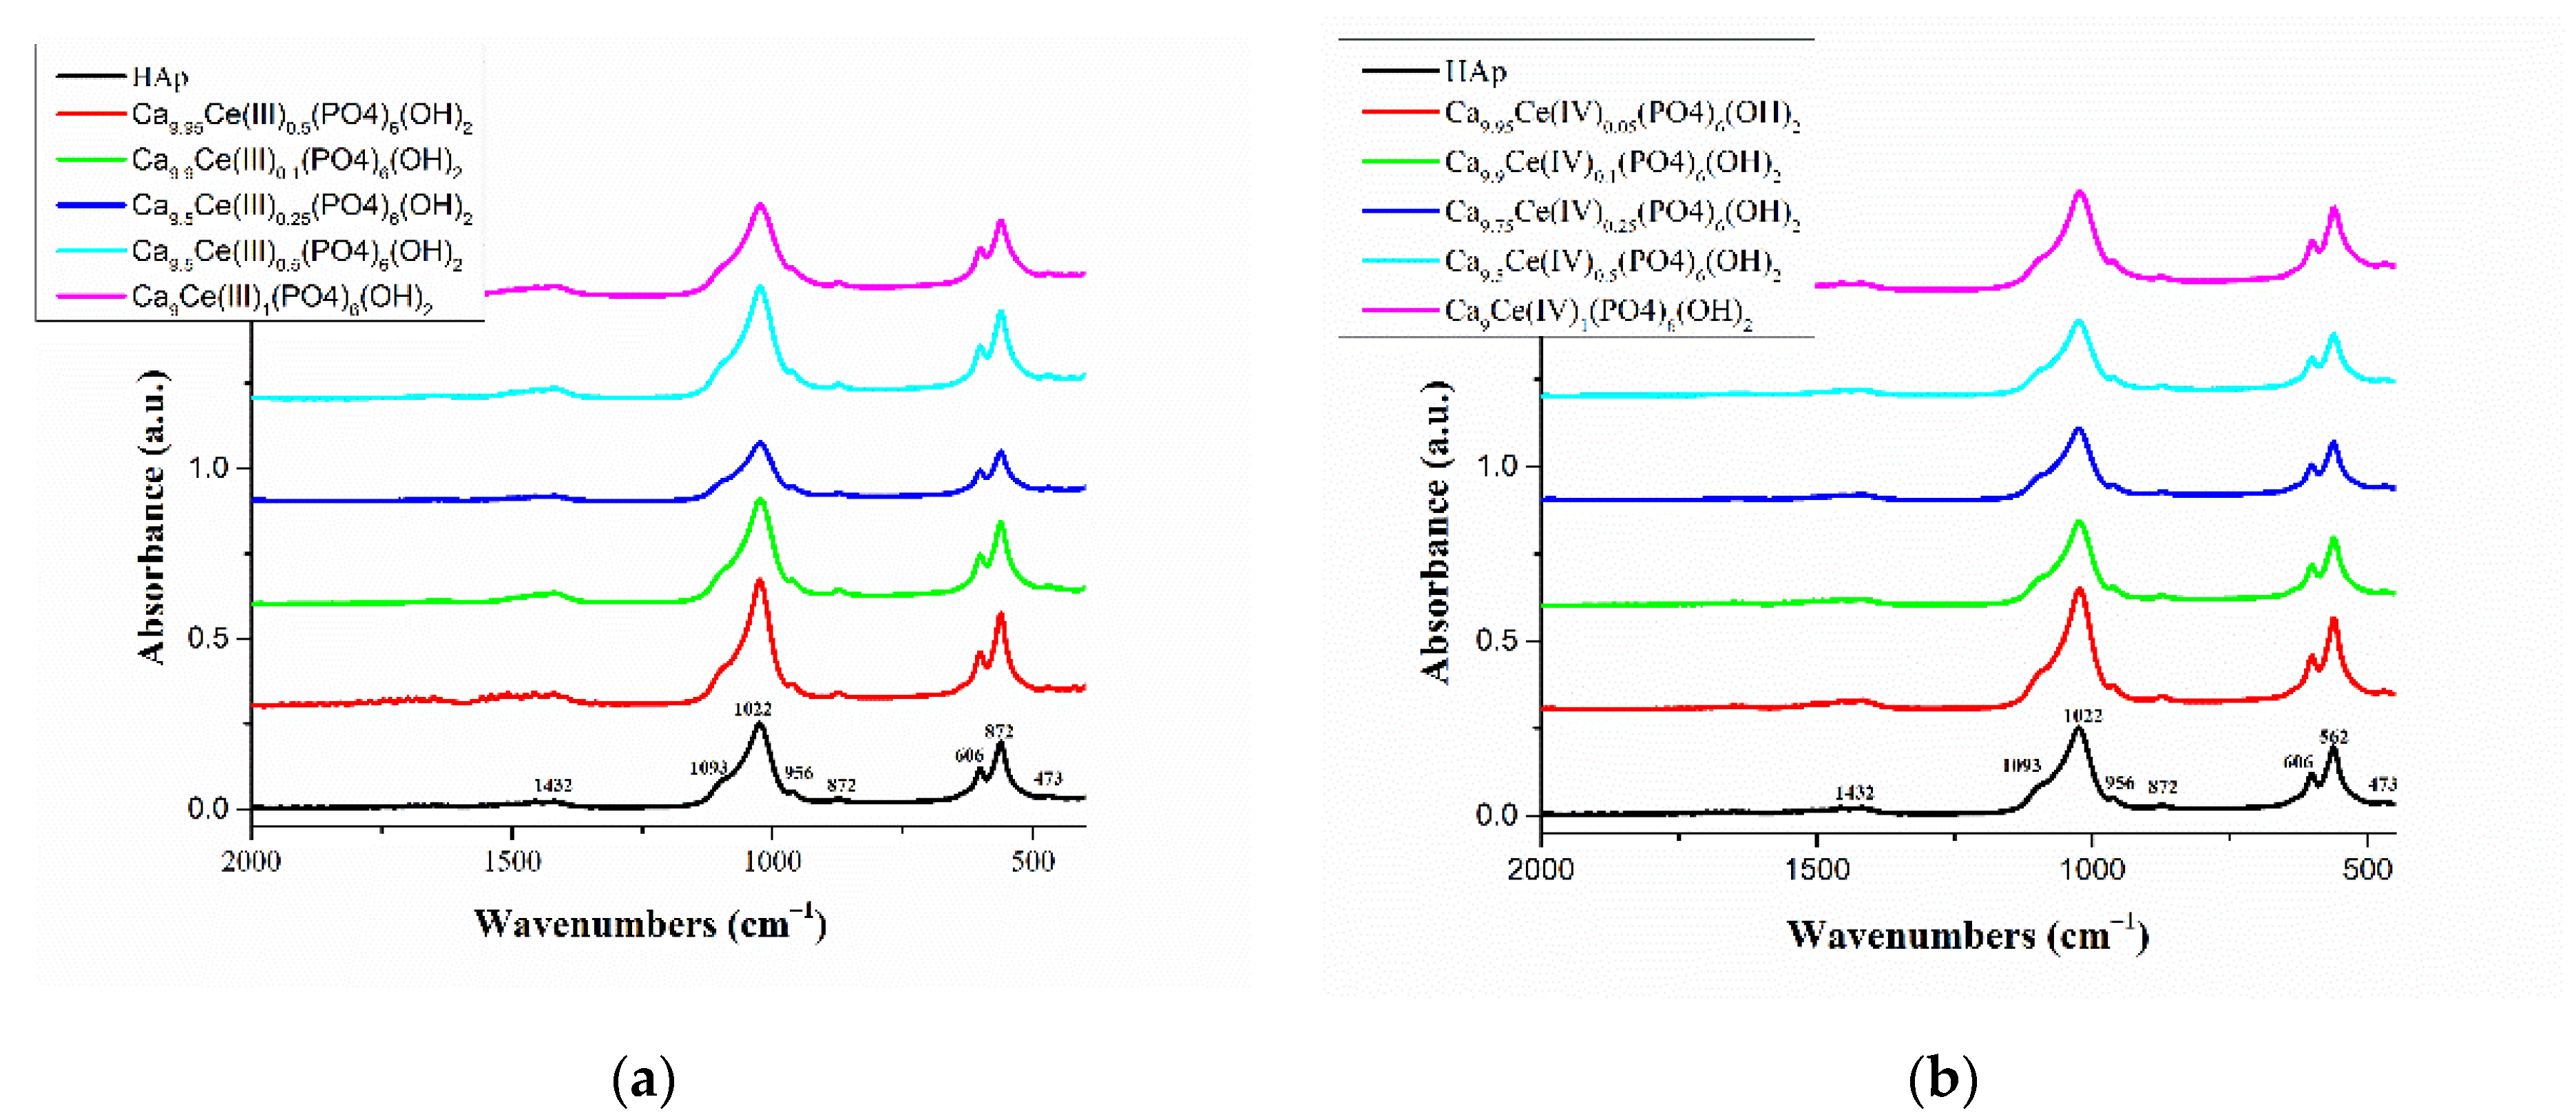
3.1. FTIR Analysis
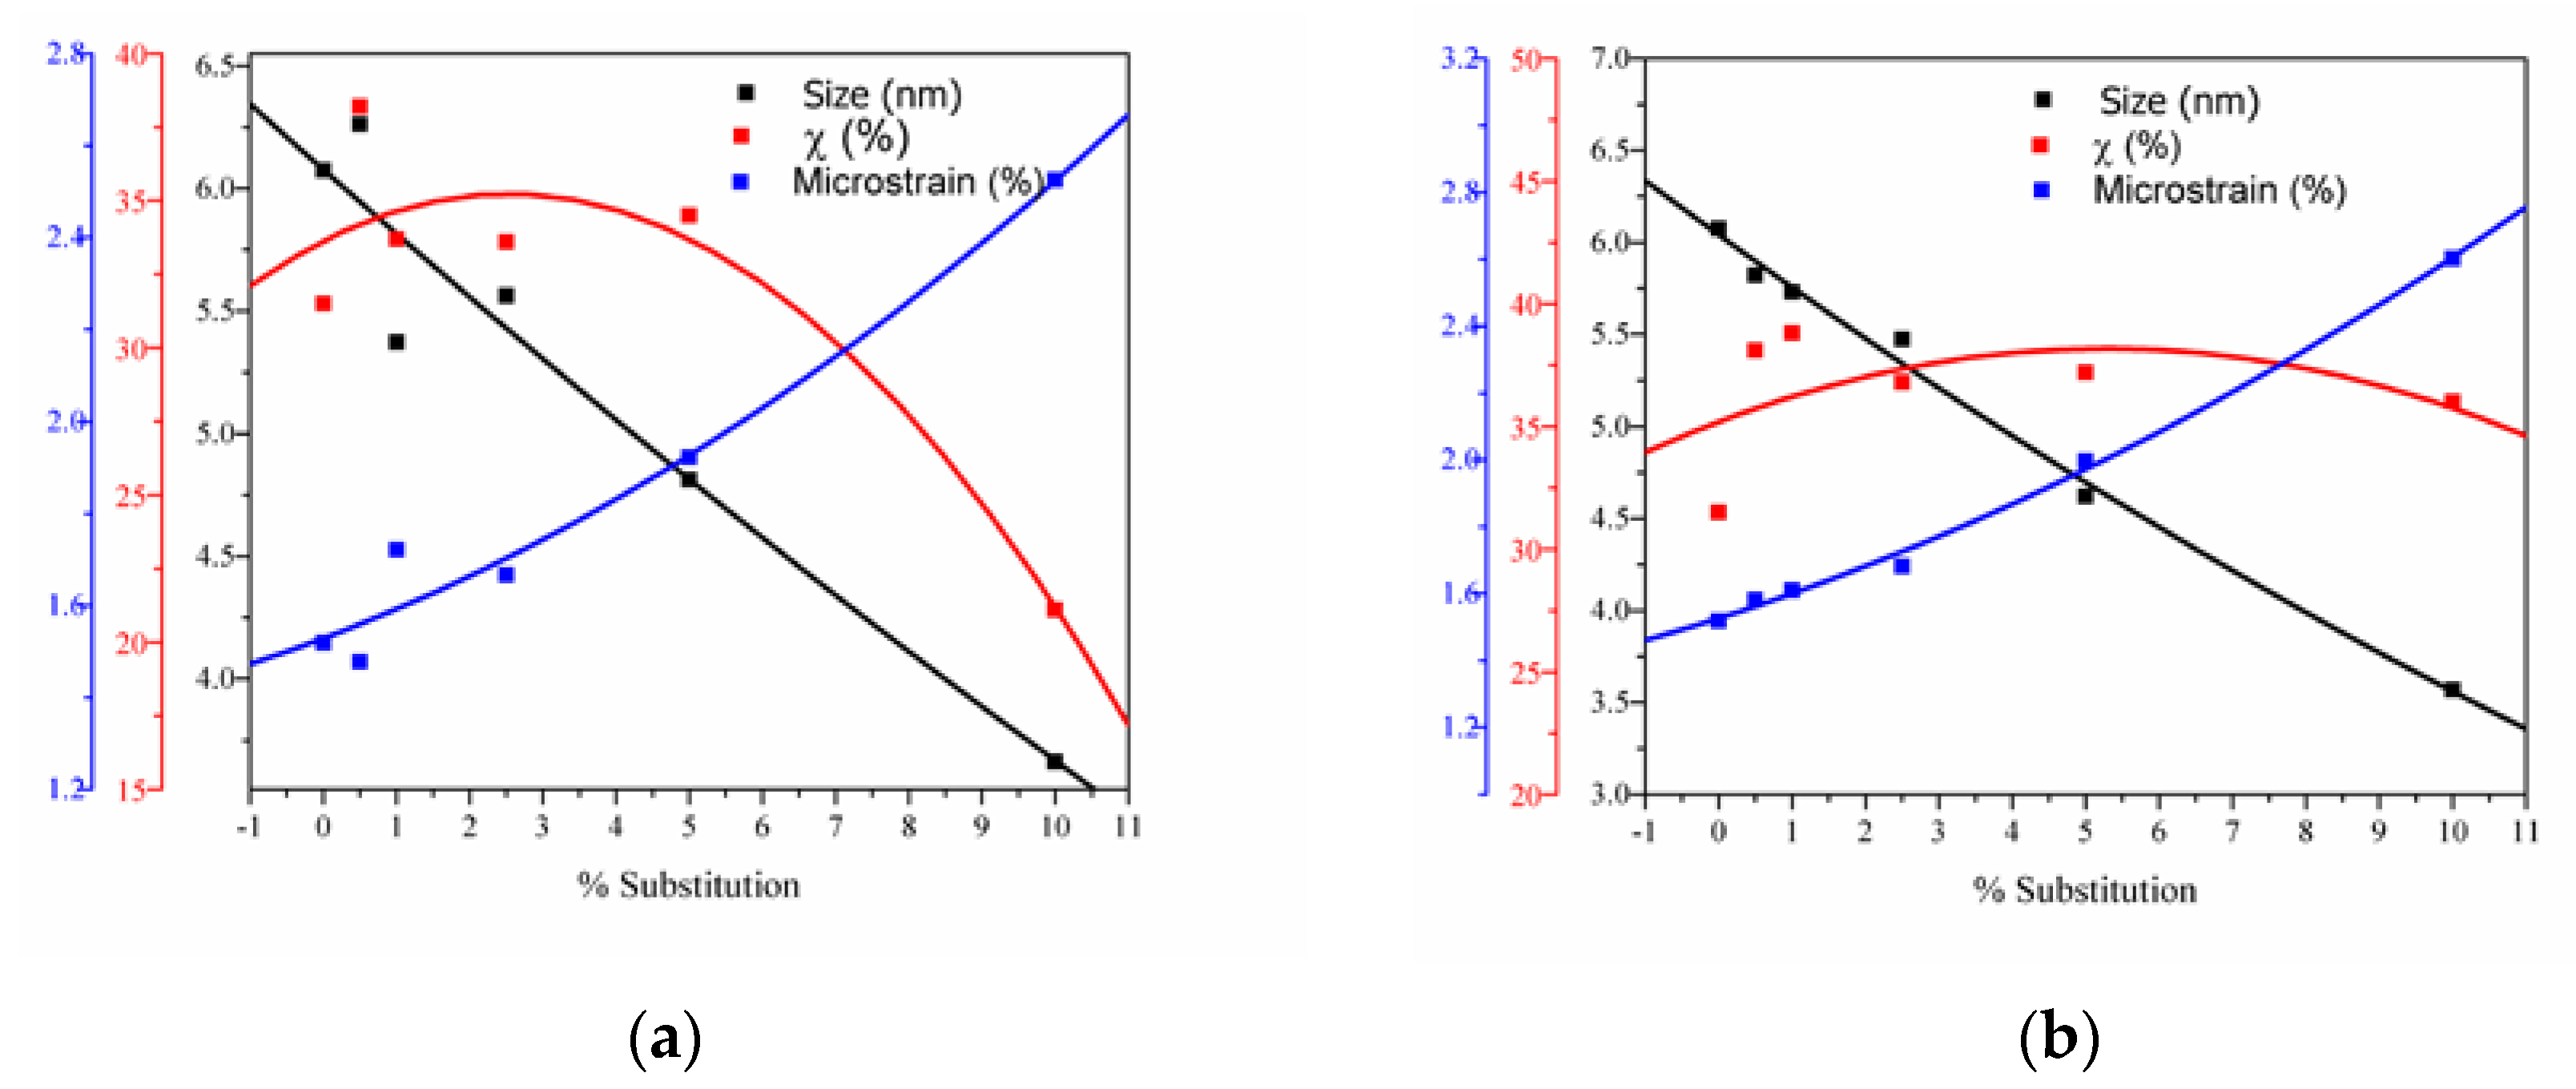
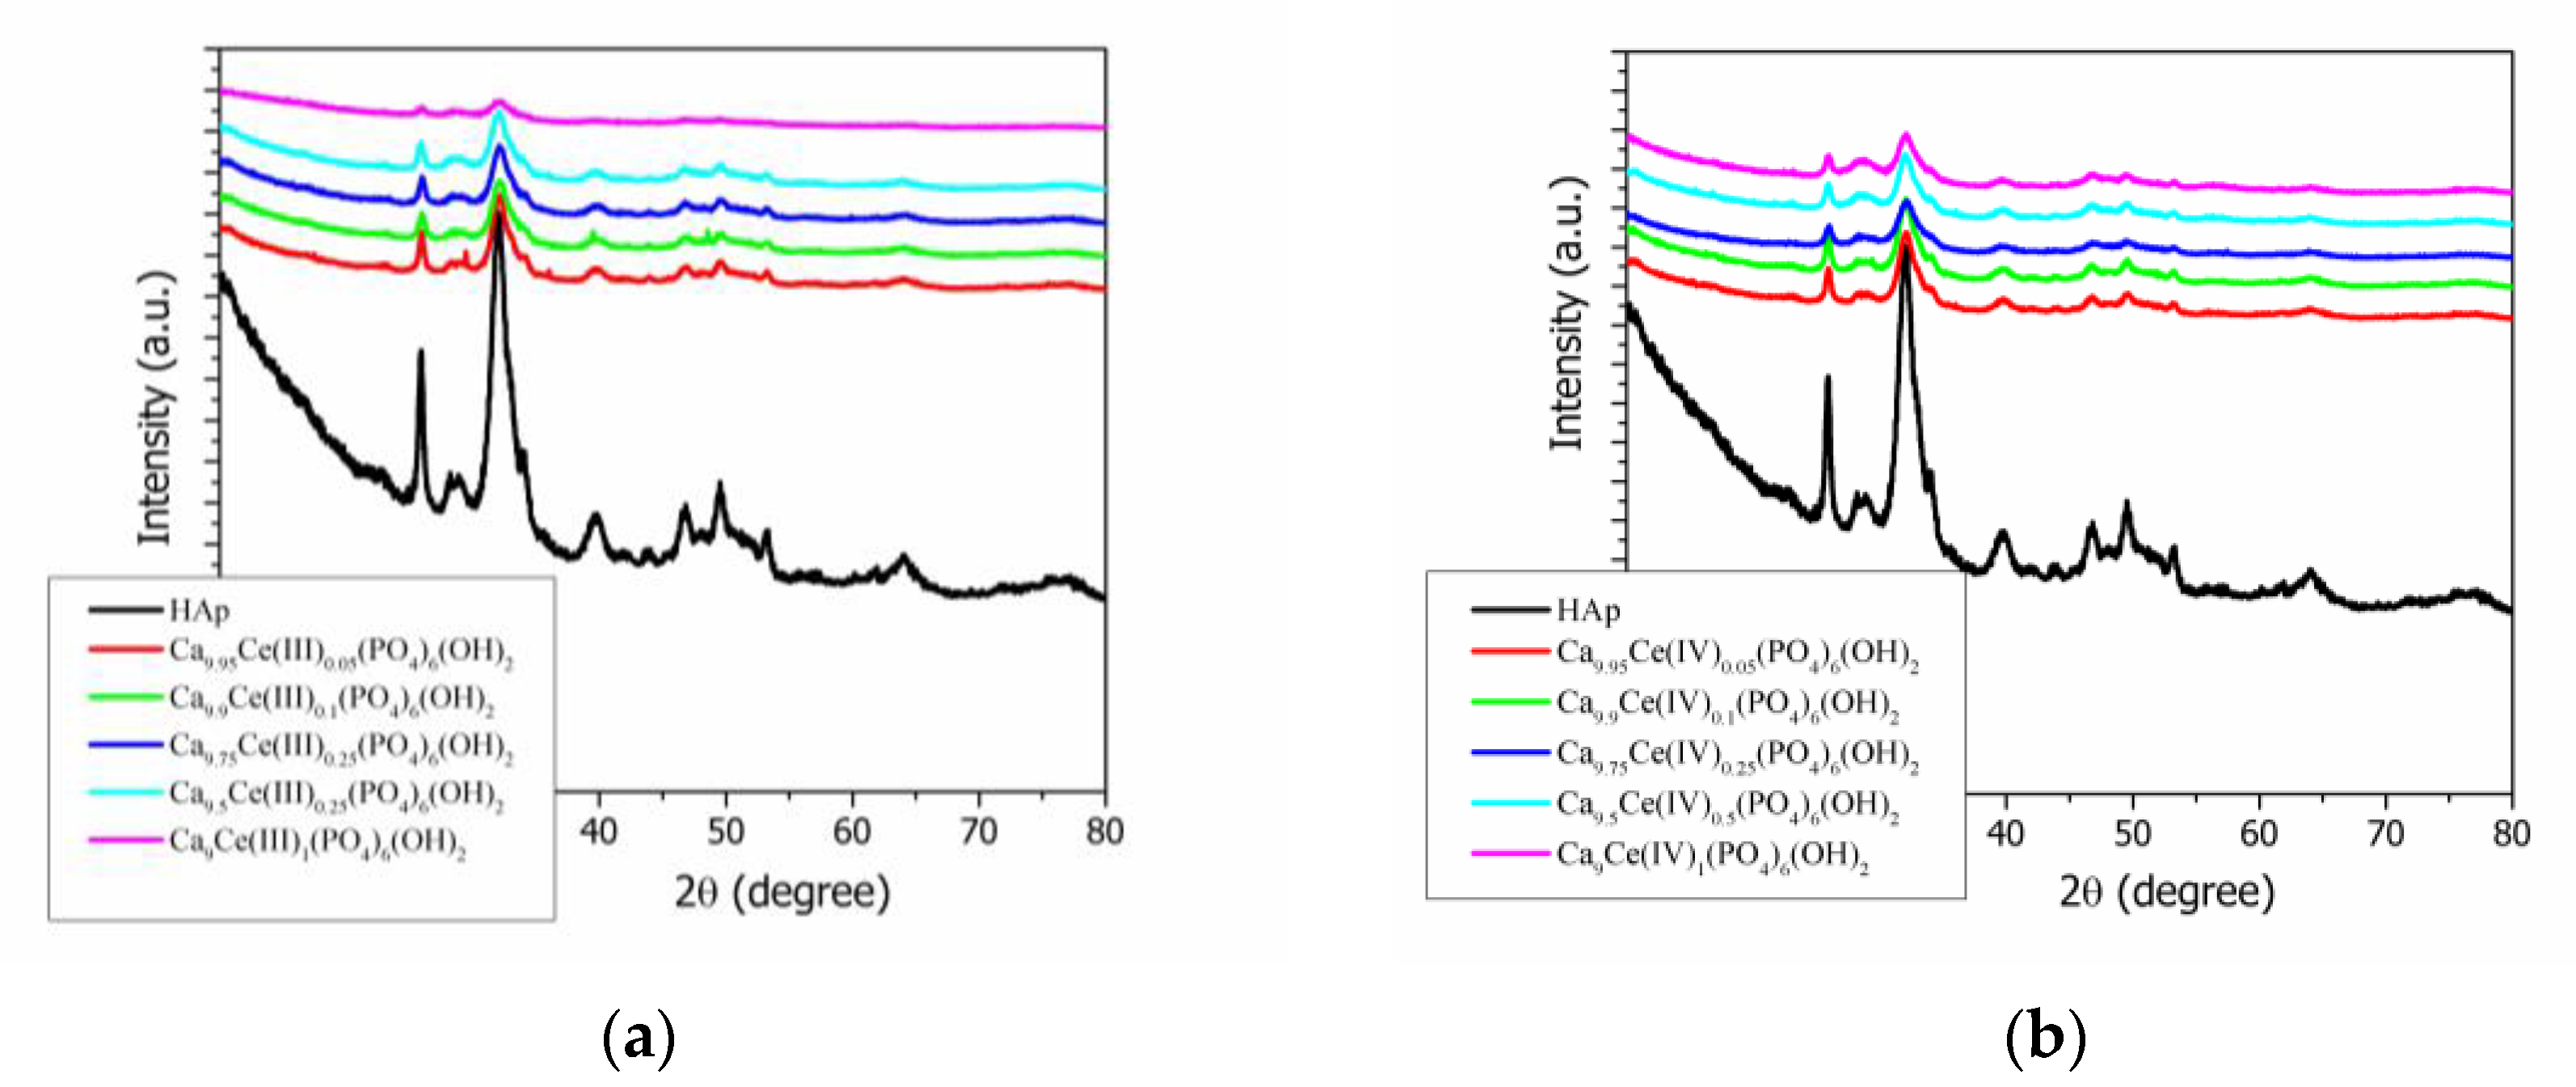
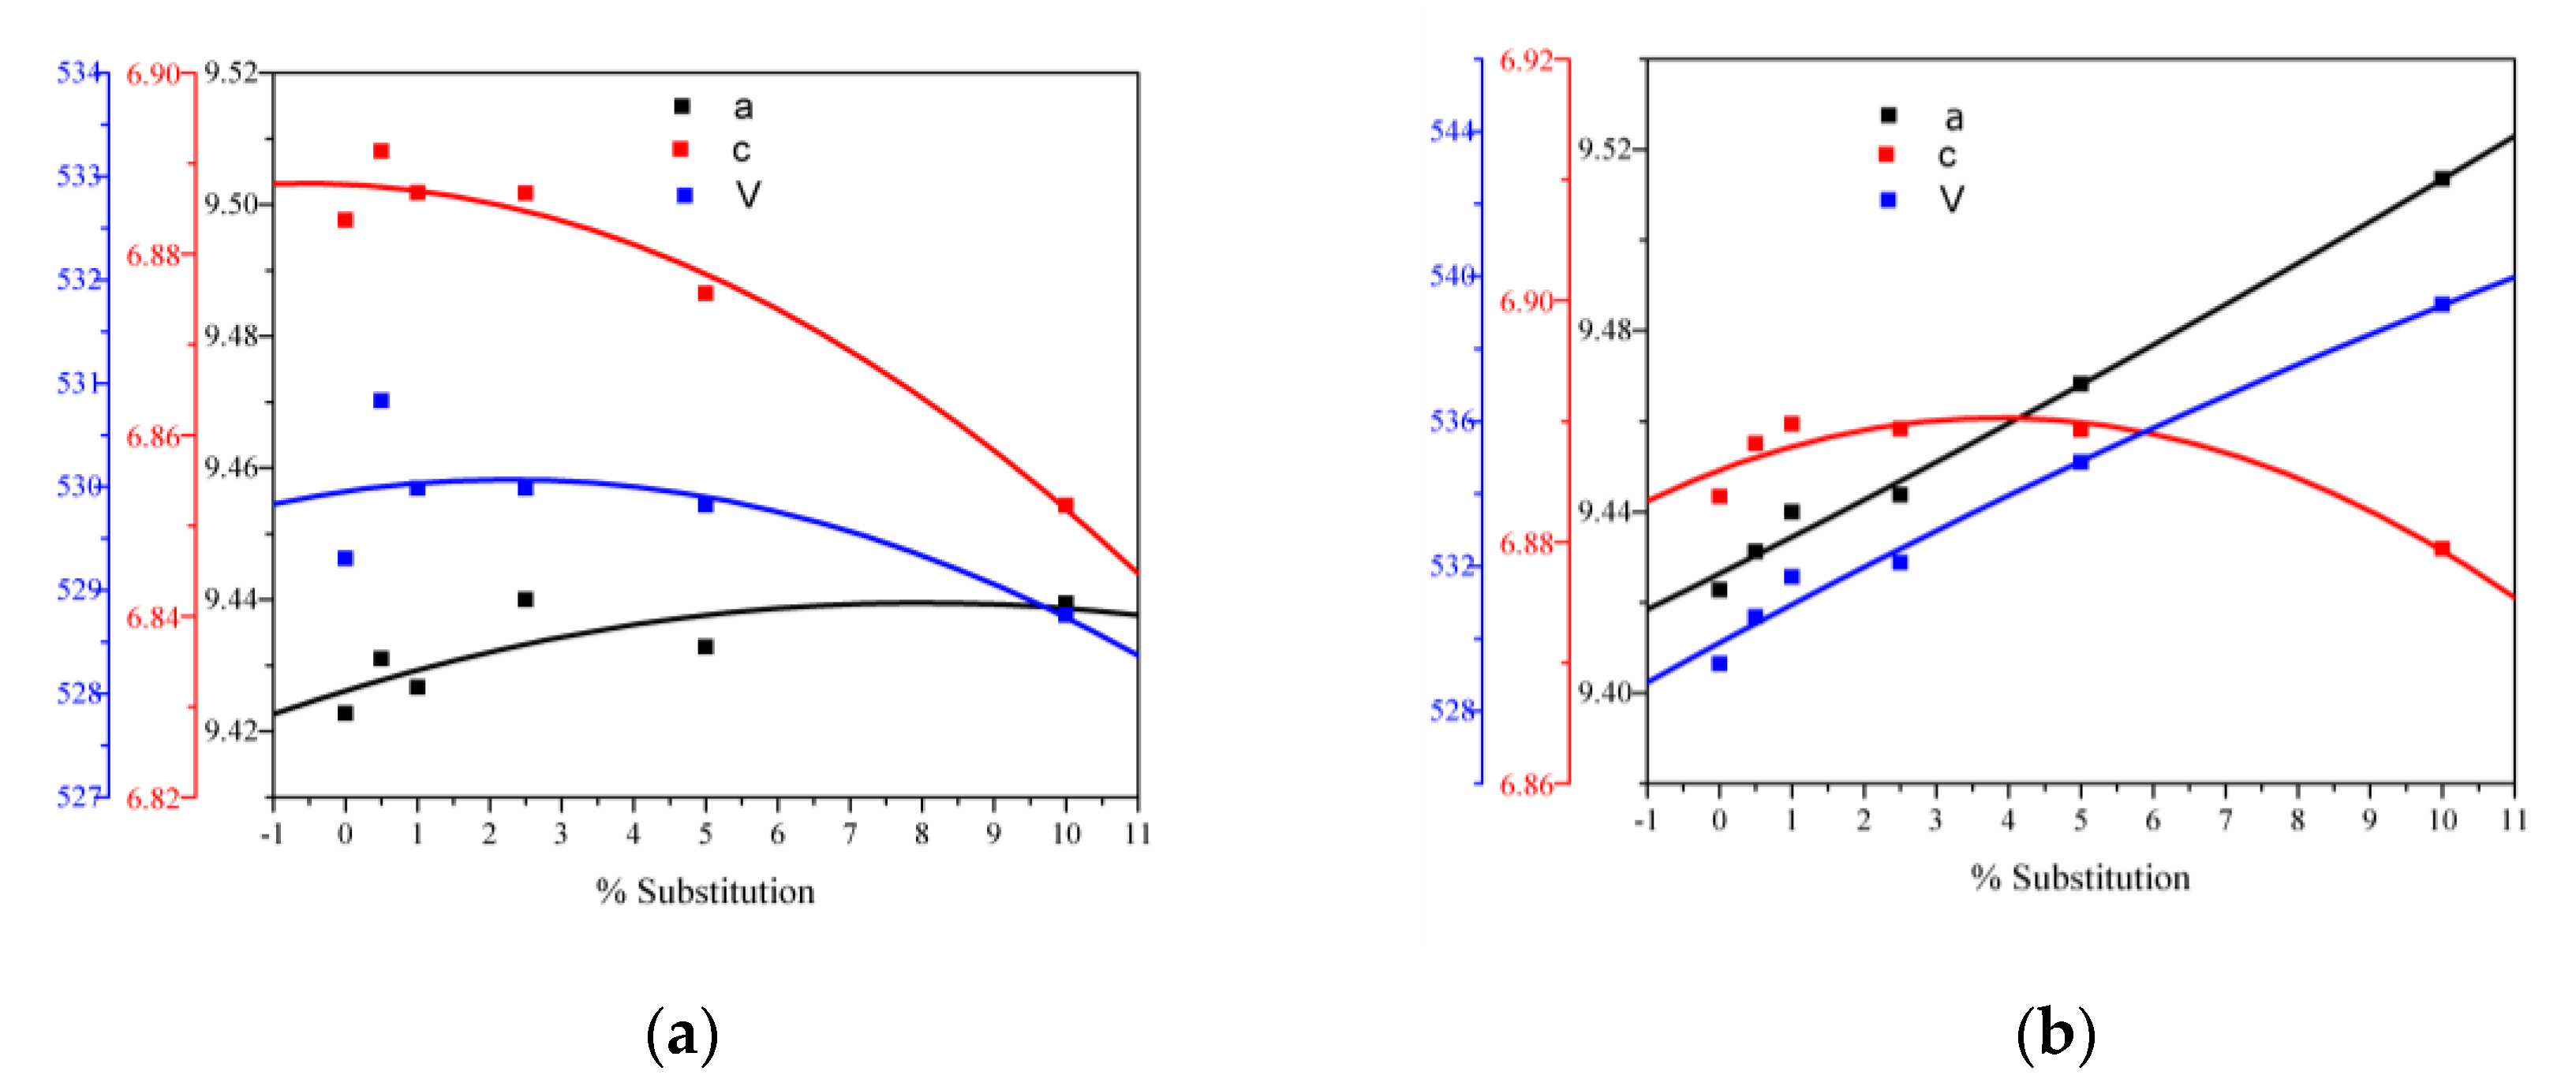
3.2. X-ray Analysis
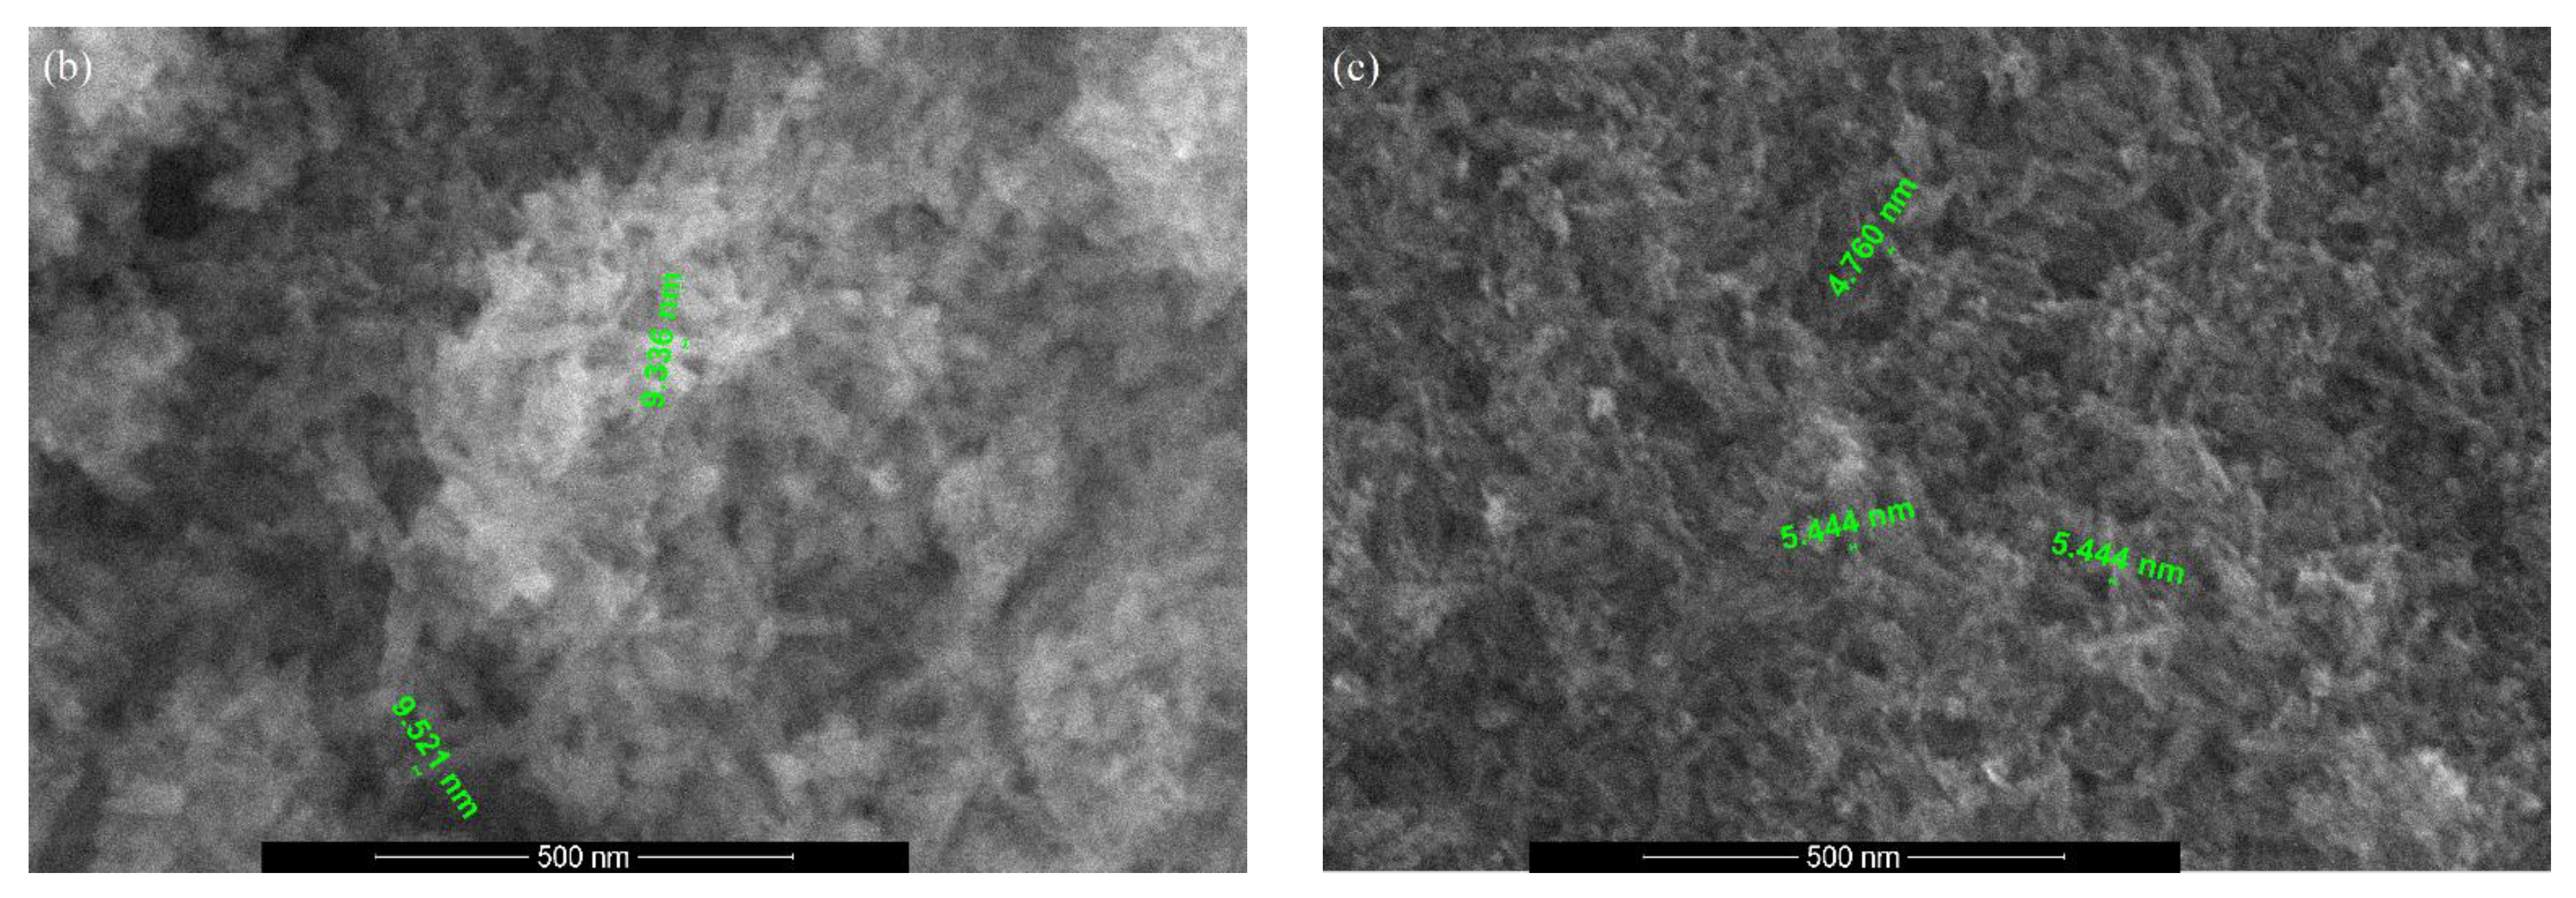
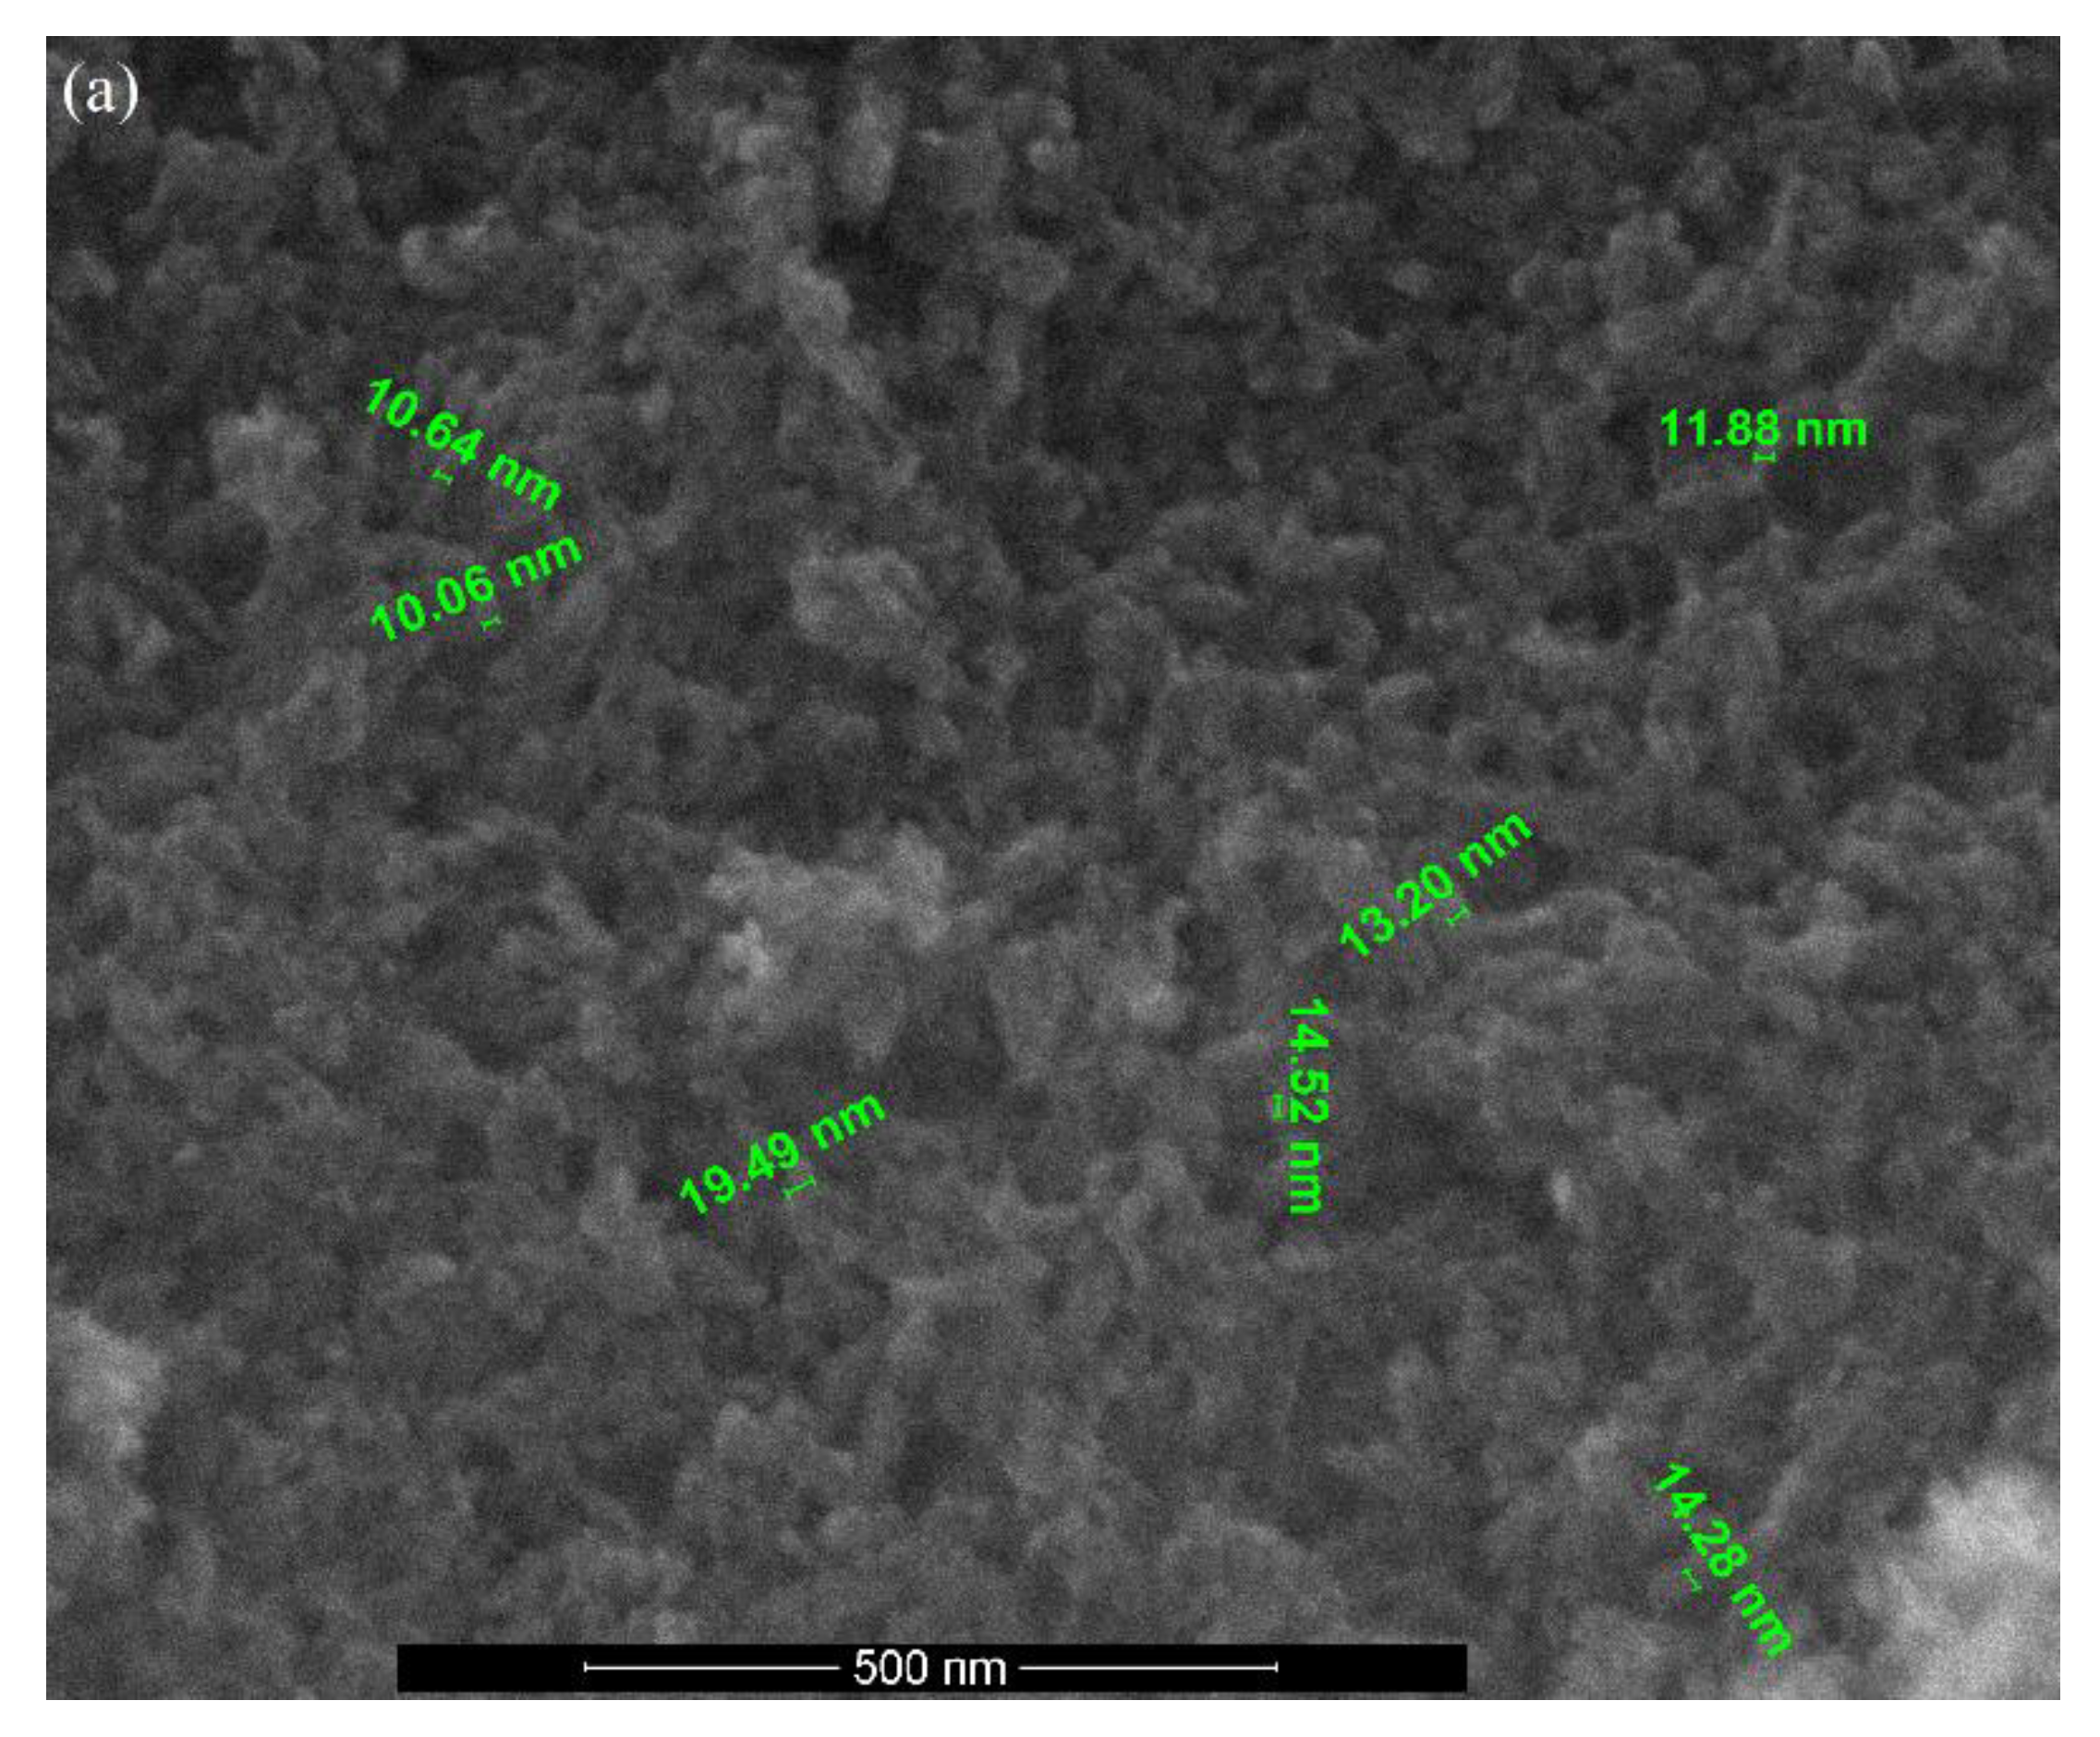
3.3. SEM Analysis
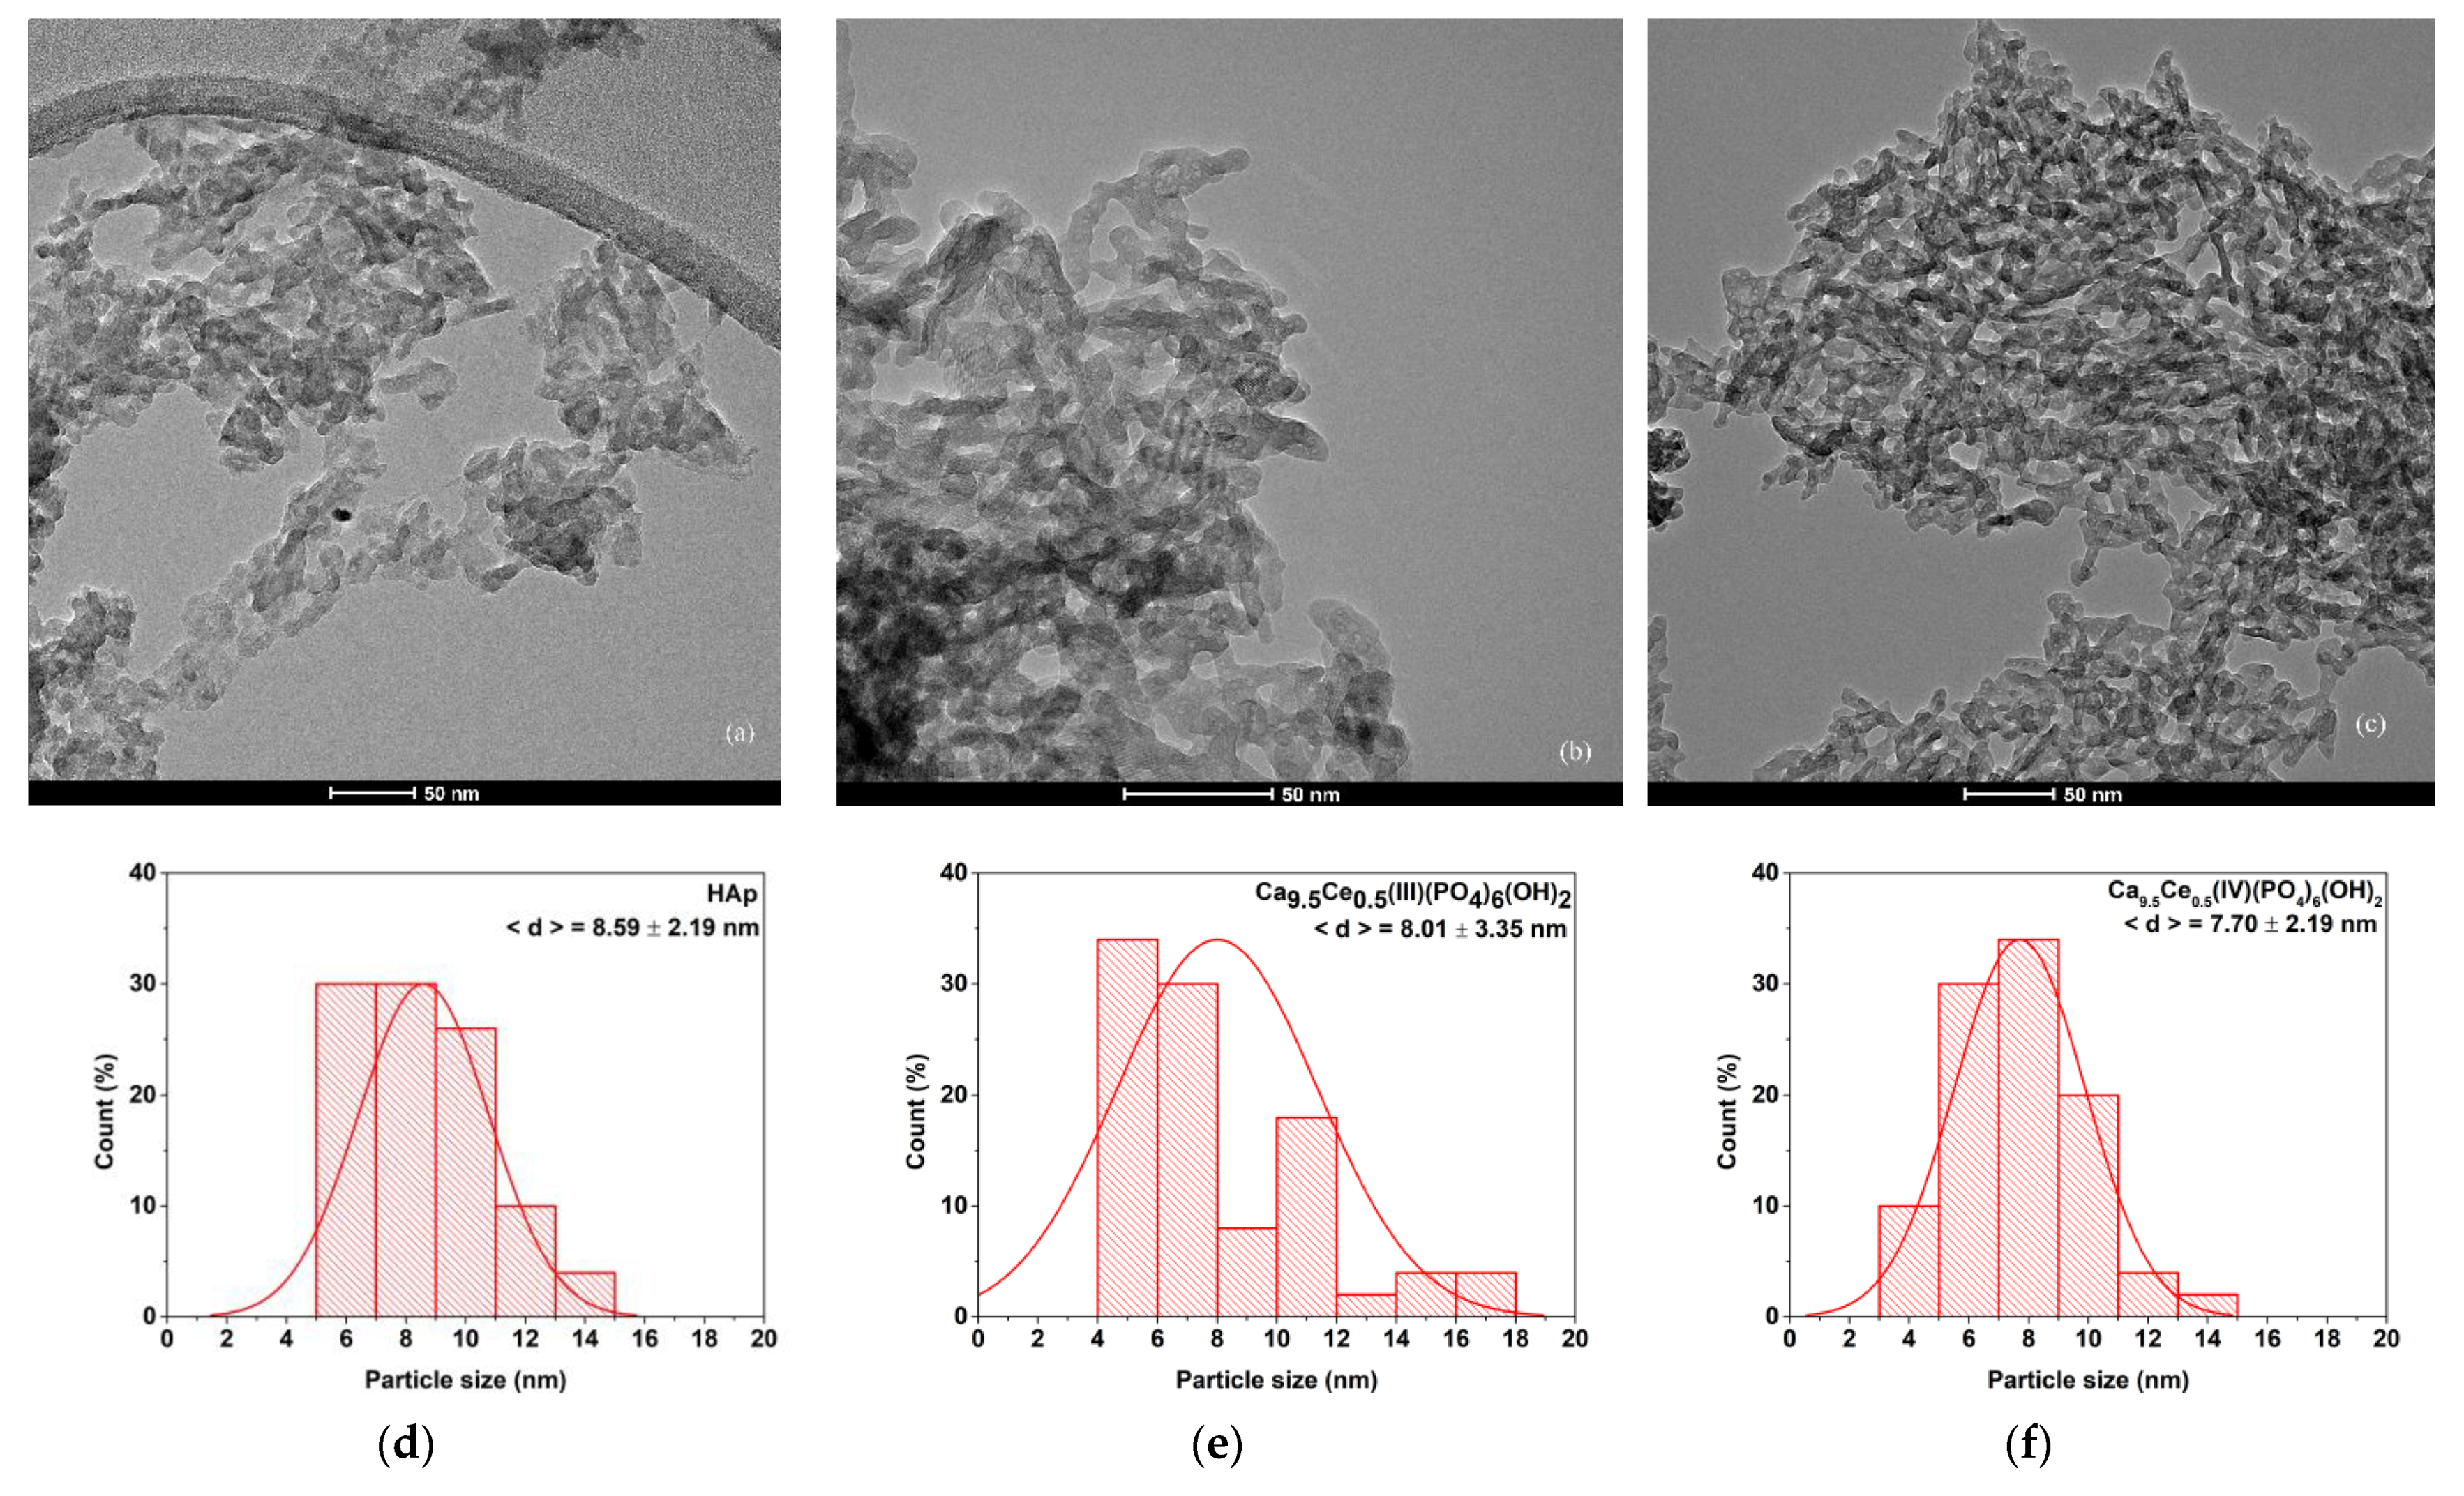
3.4. TEM Analysis
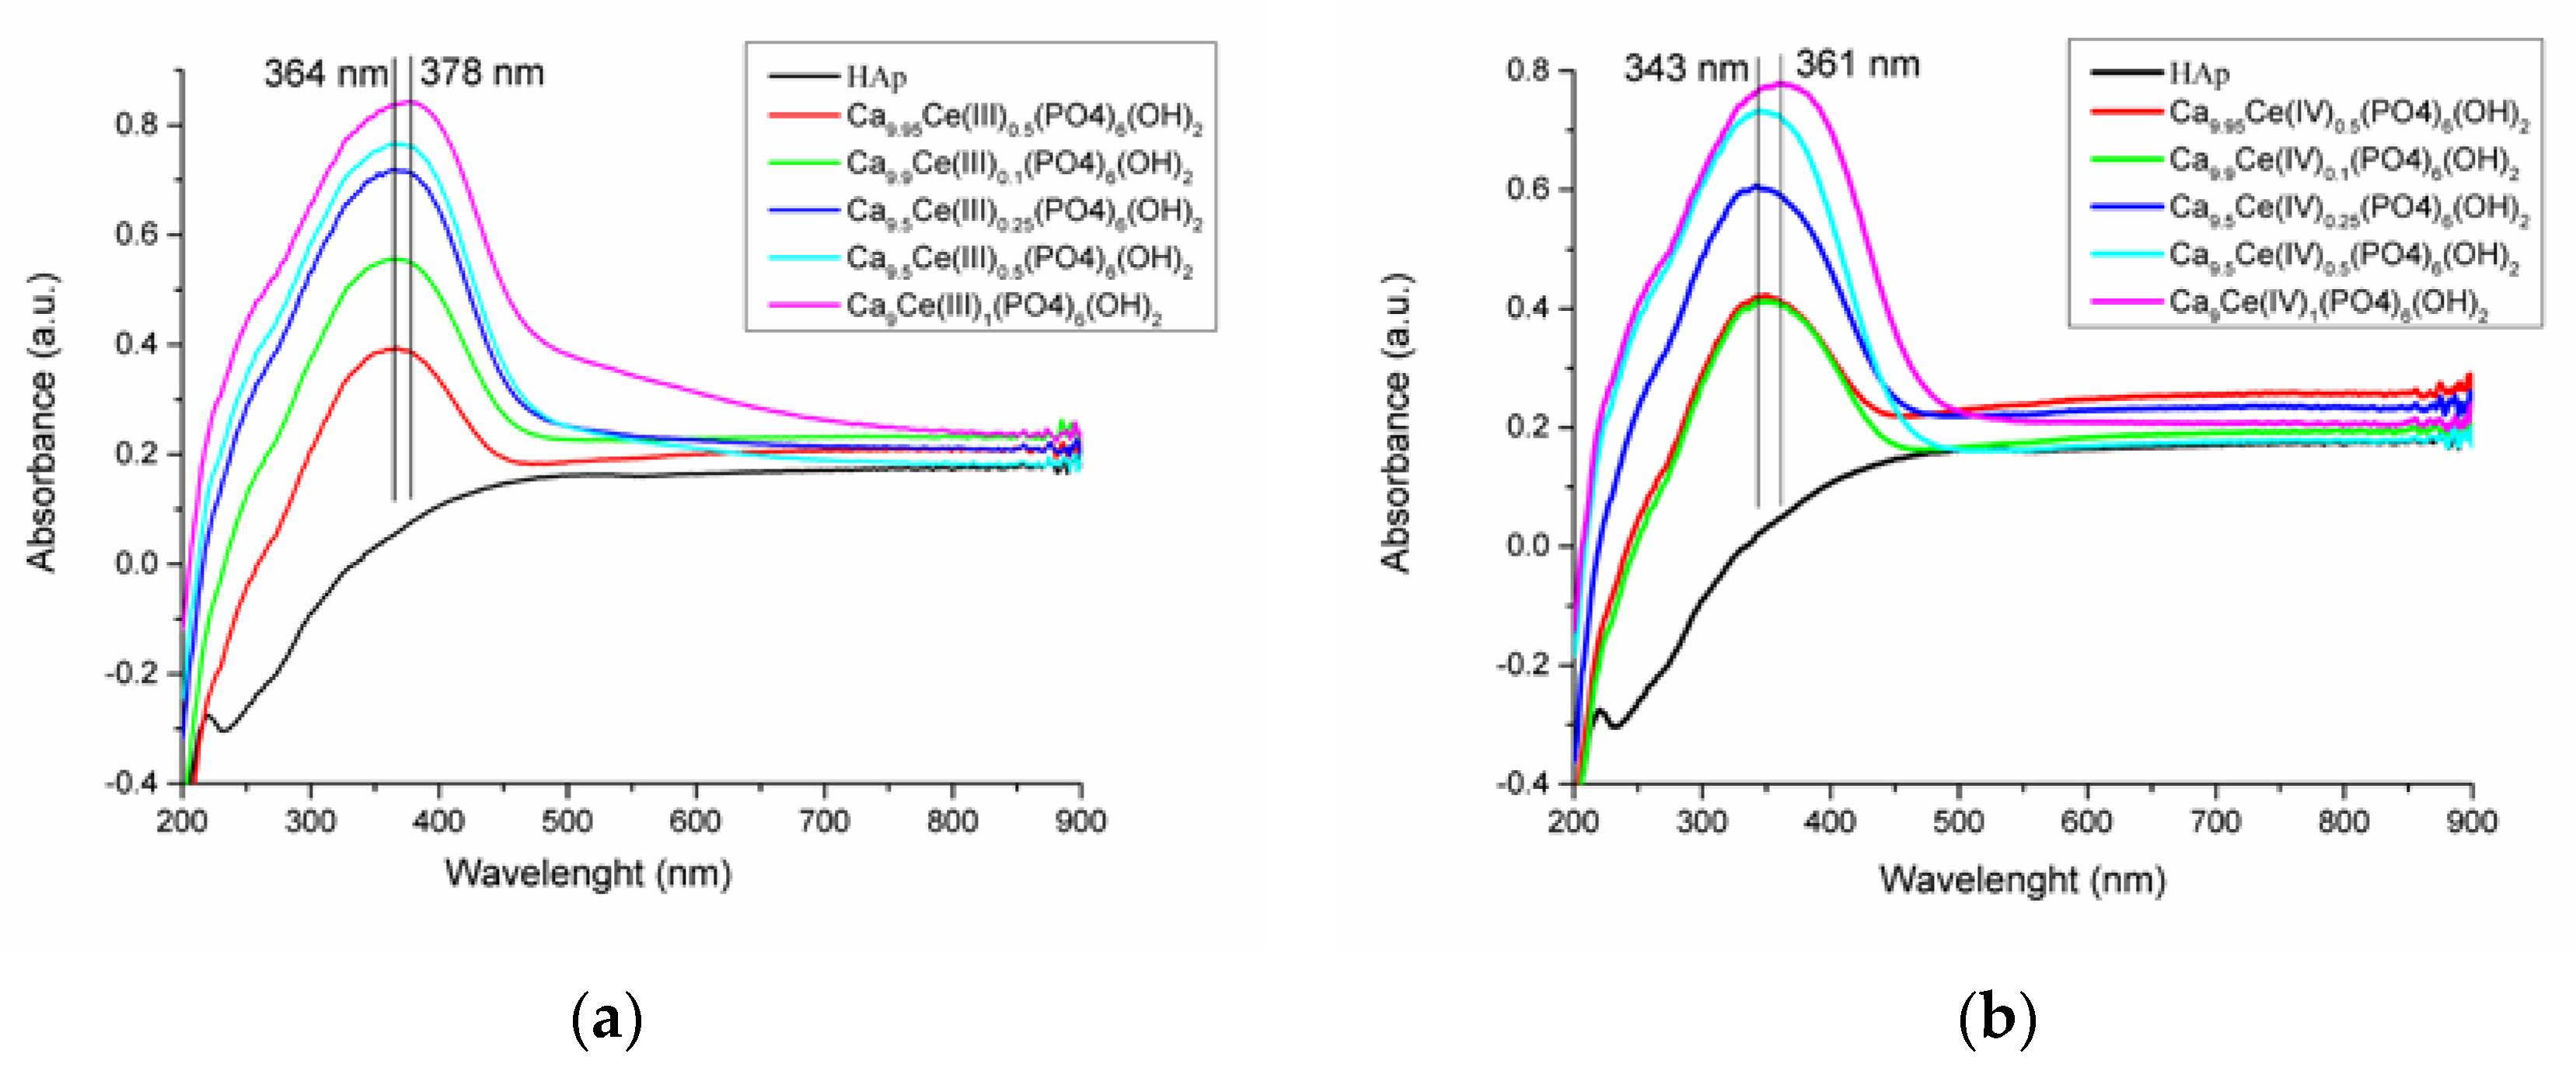
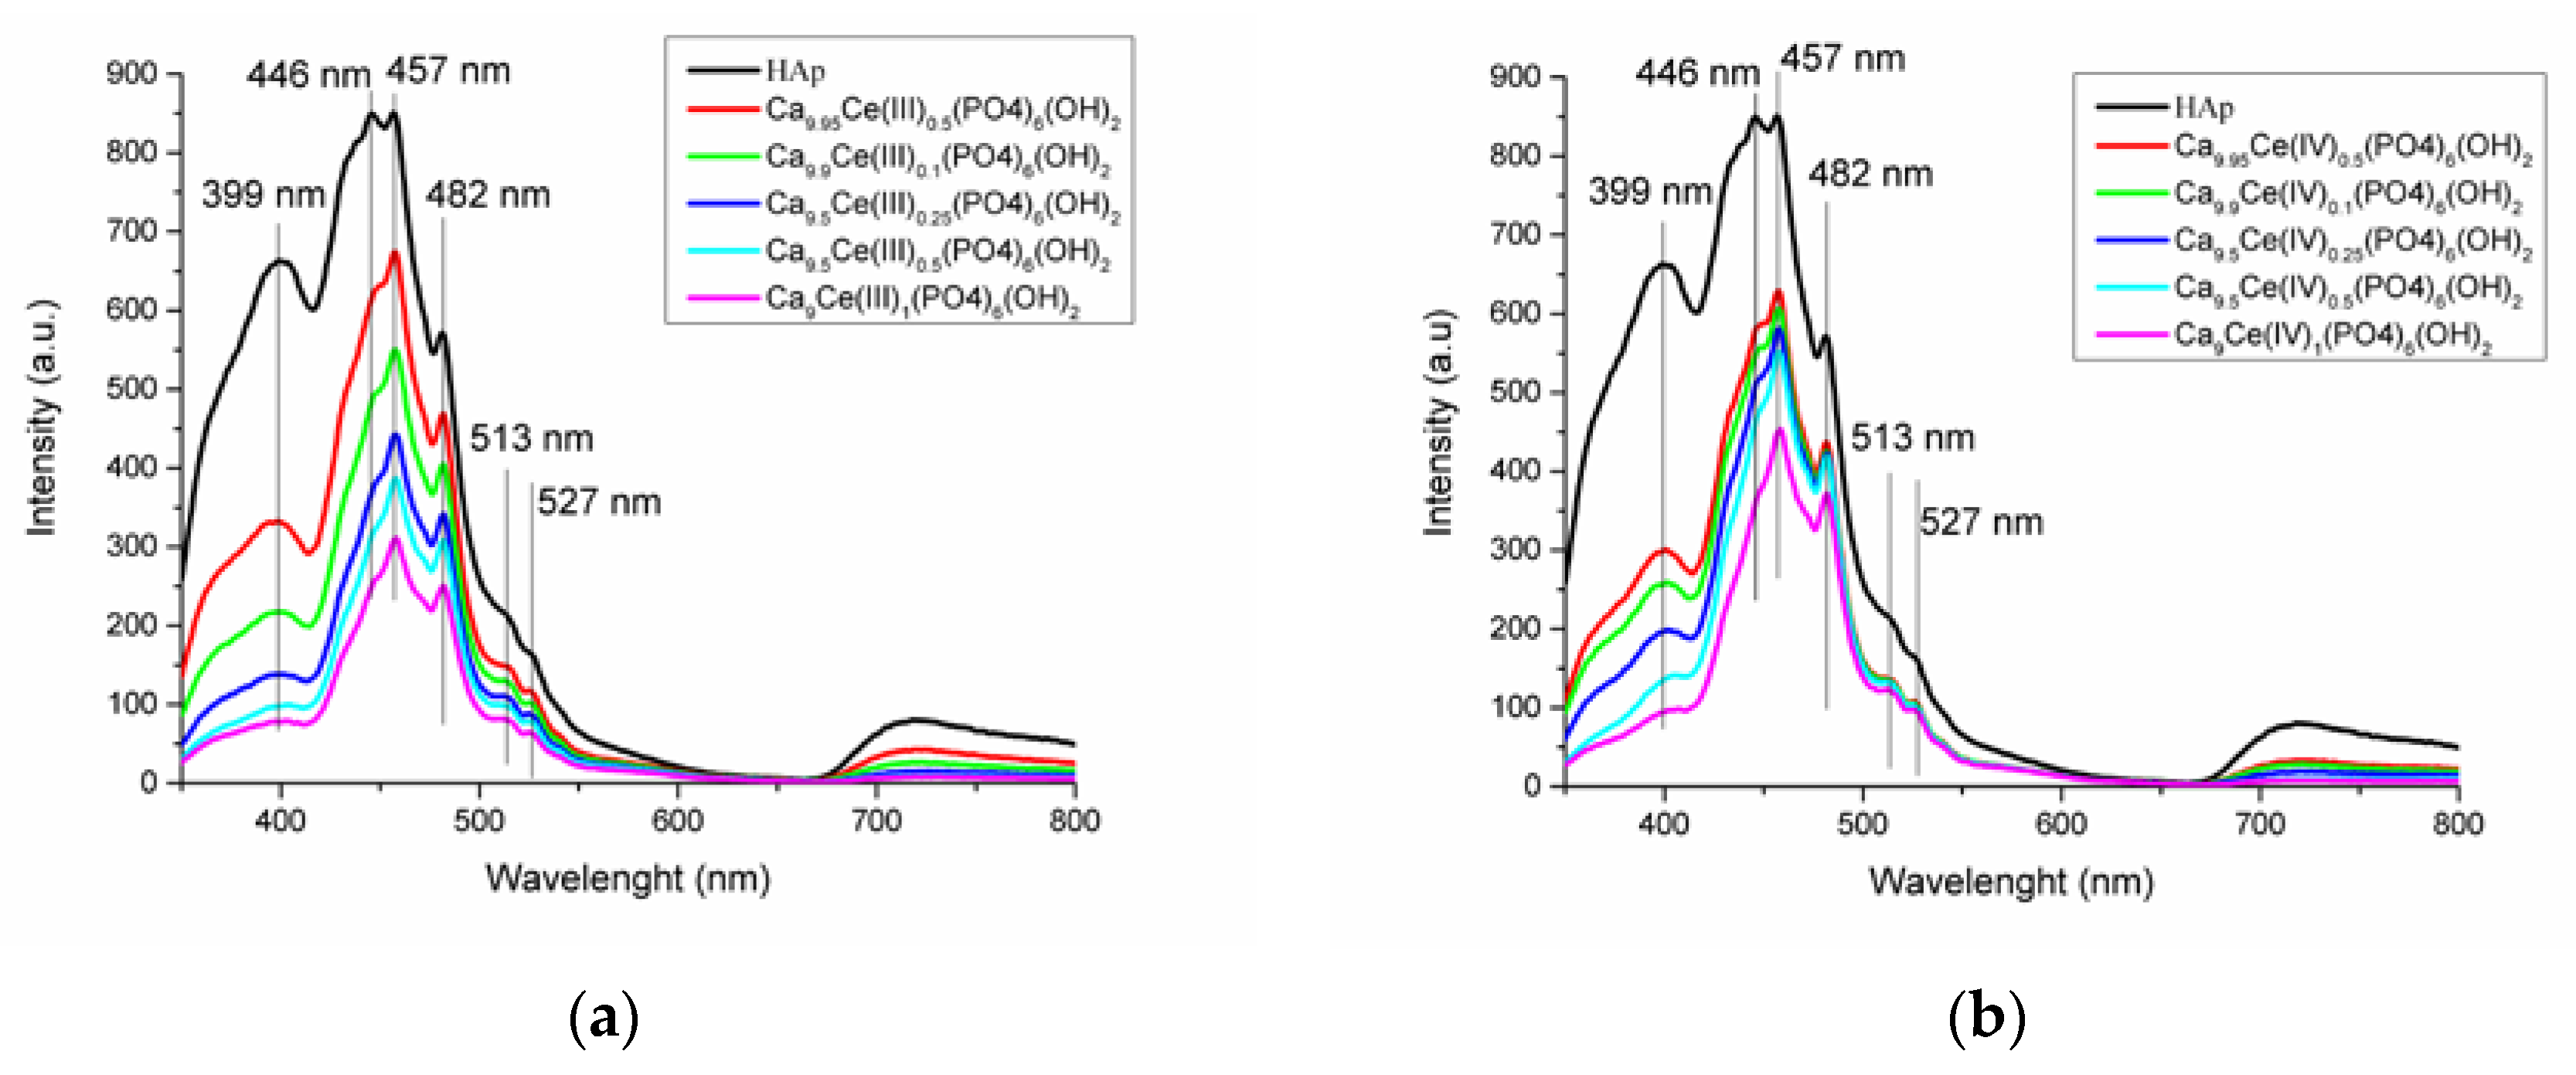
3.5. UV-Vis and PL Spectra
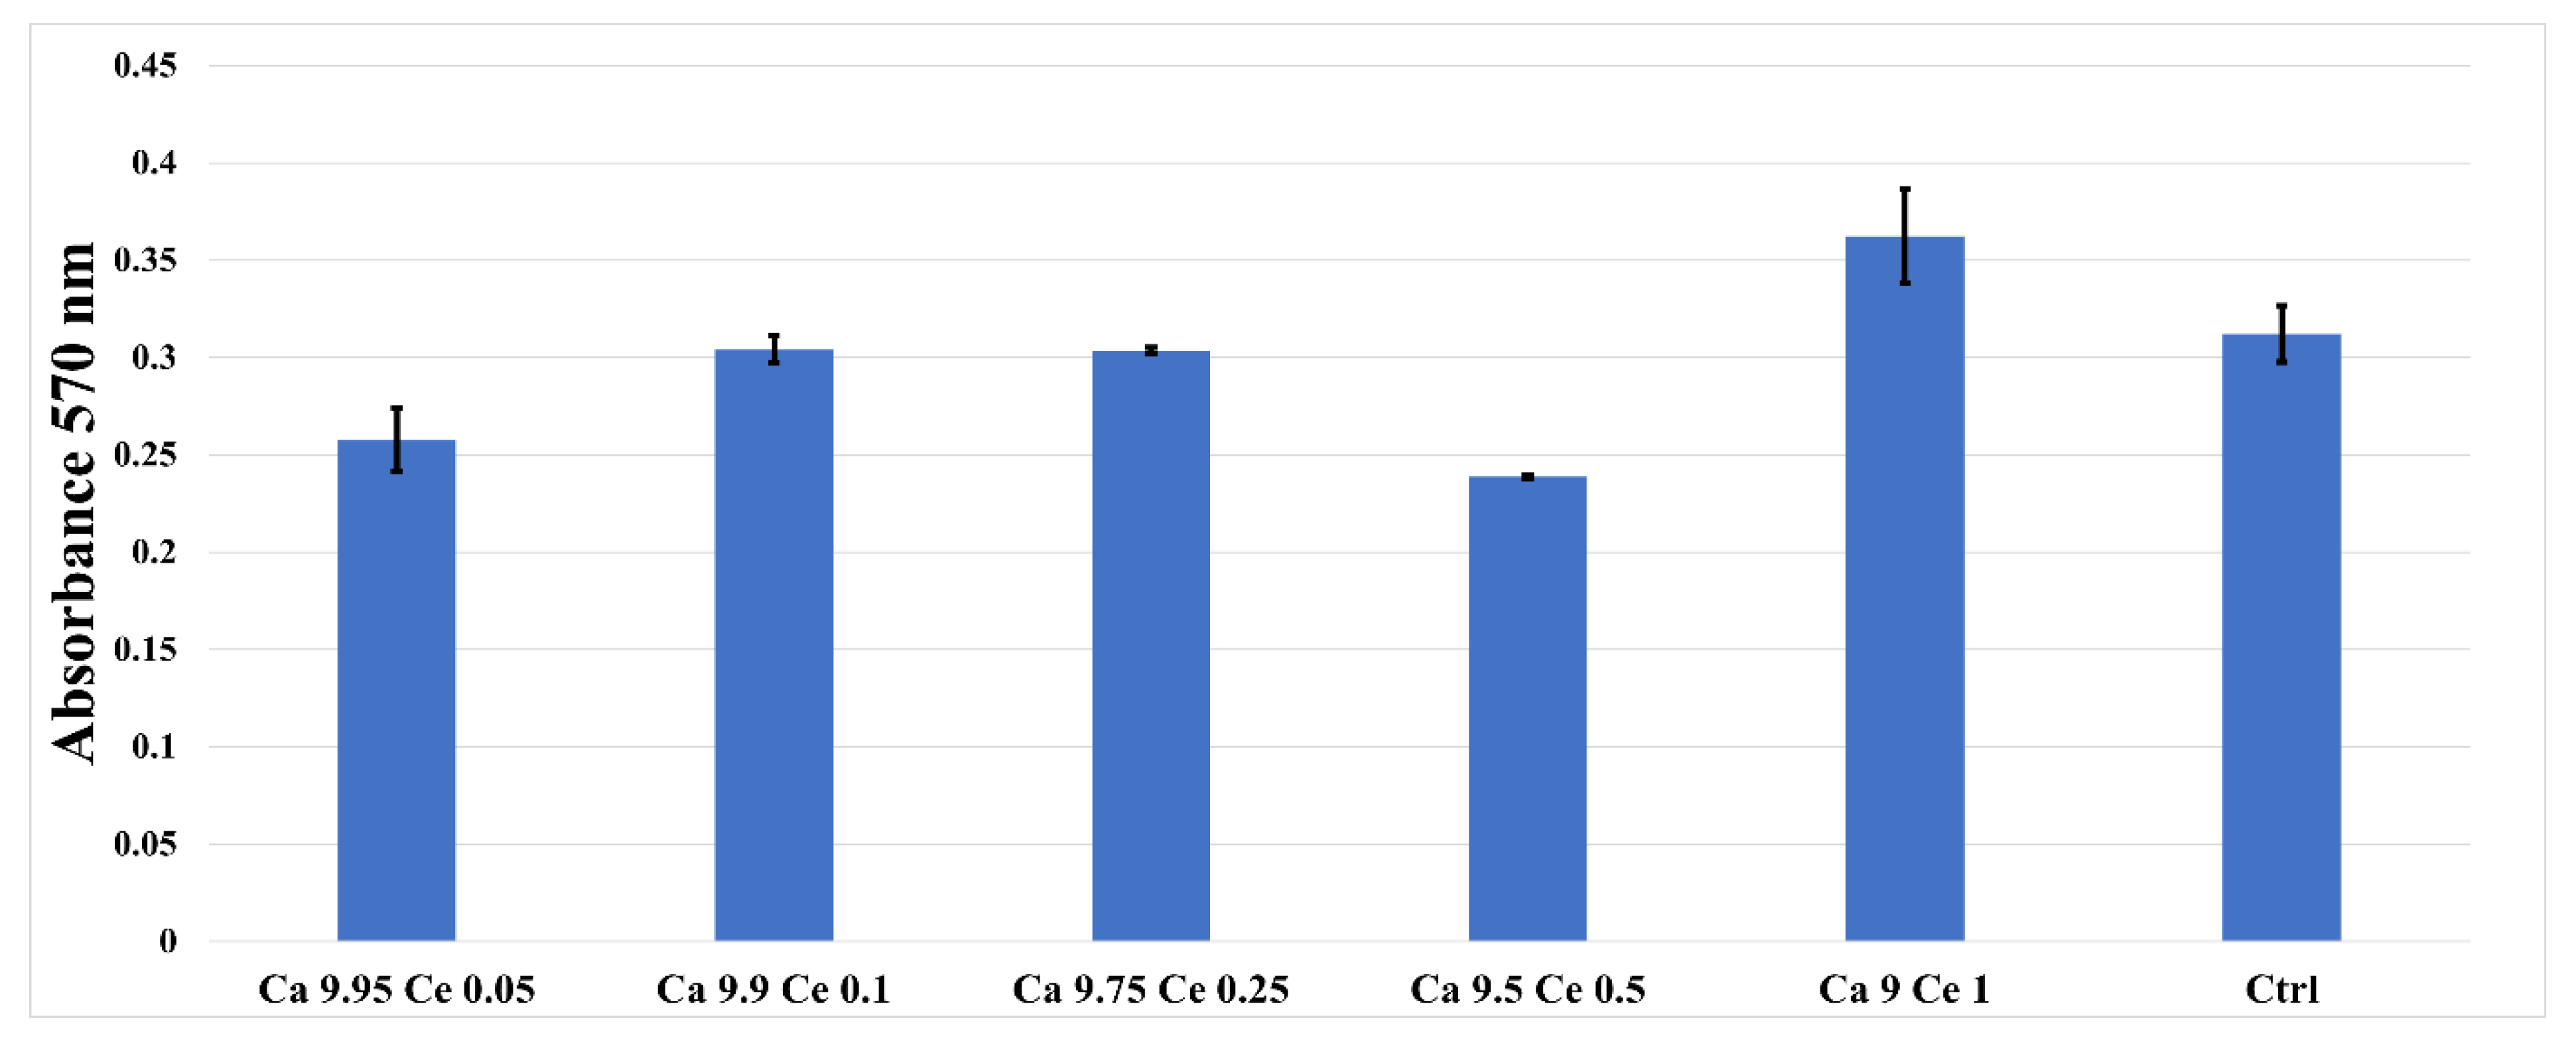
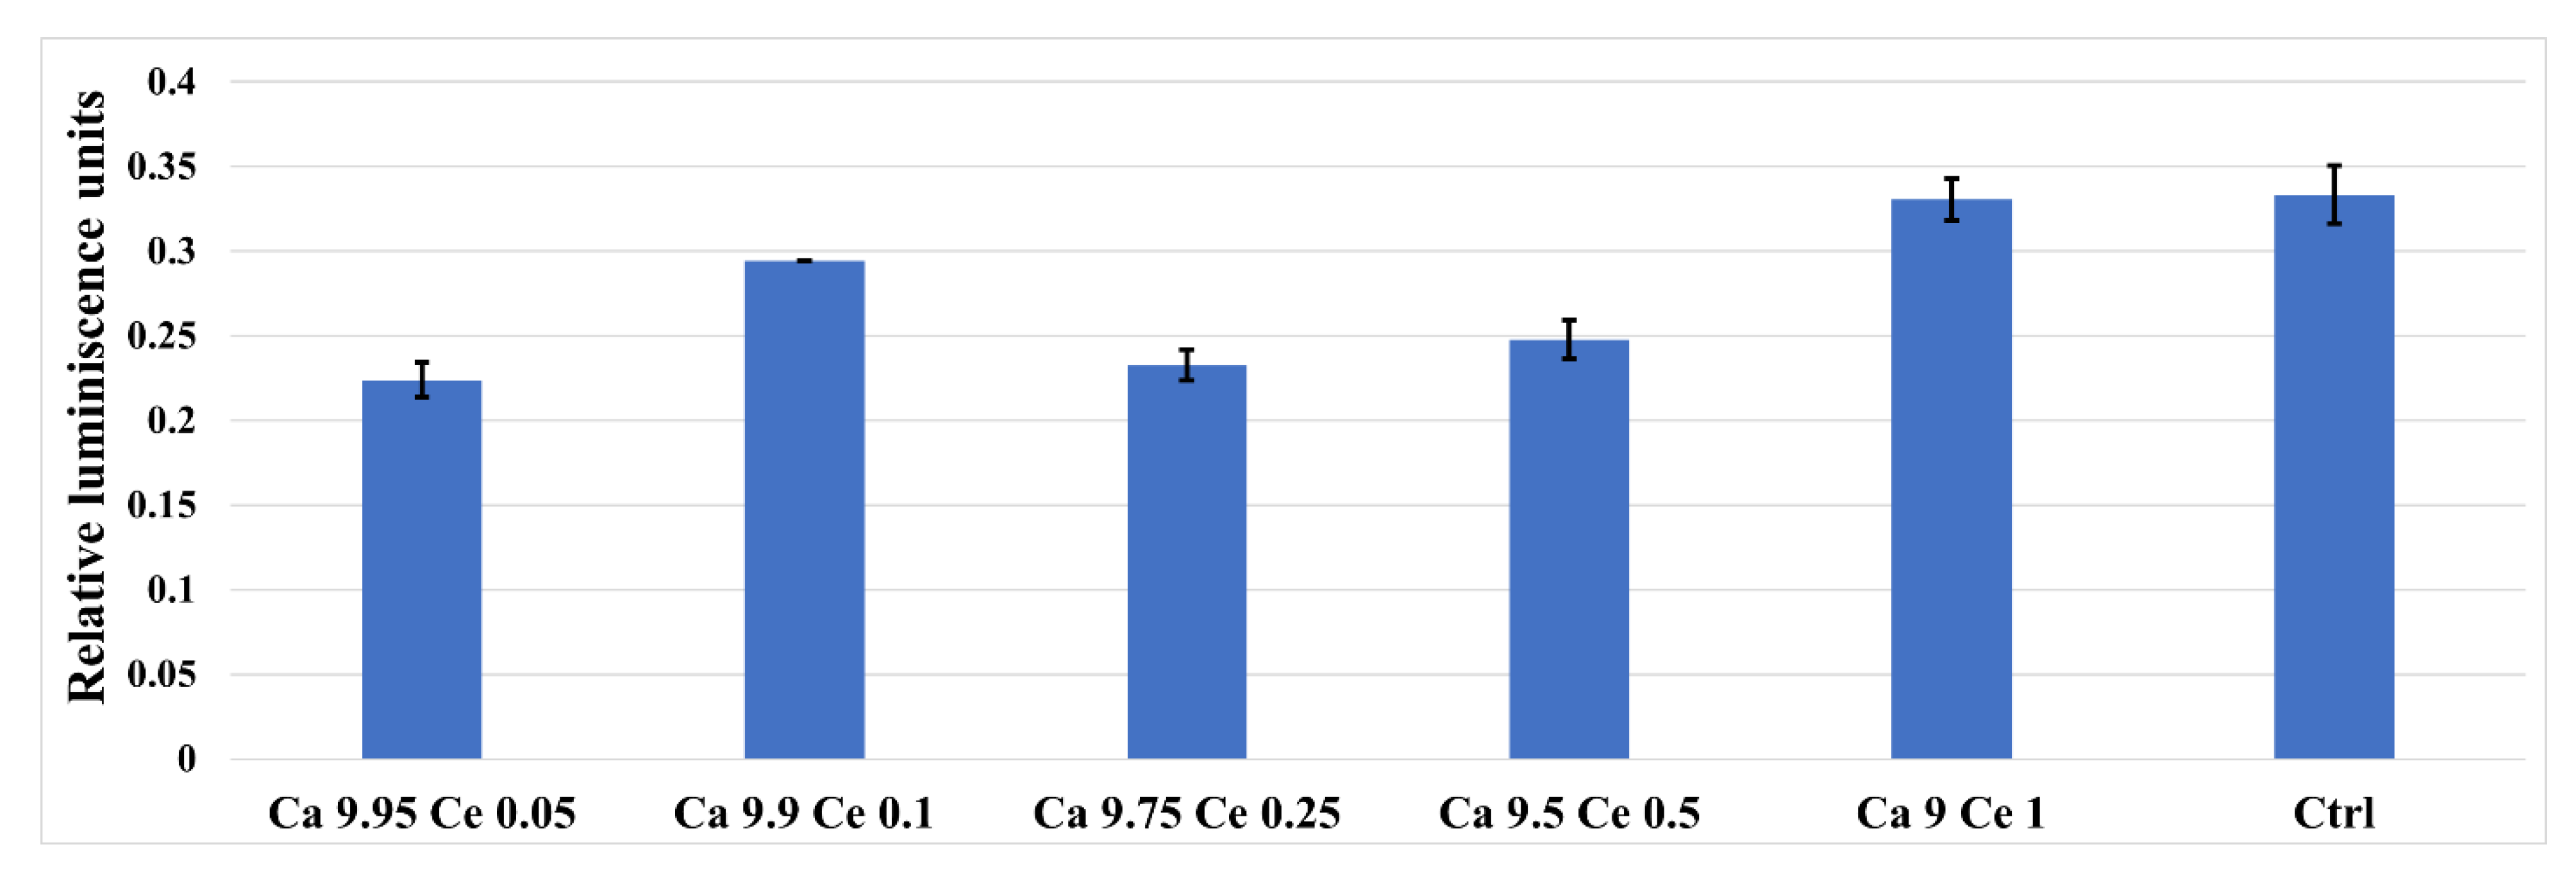
3.6. MTT Assay
4. Conclusions
Author Contributions
Funding
Data Availability Statement
Conflicts of Interest
References
- Dorozhkin, S.V. Calcium orthophosphates: Occurrence, properties, biomineralization, pathological calcification and biomimetic applications. Biomatter 2011, 1, 121–164. [Google Scholar] [CrossRef] [PubMed]
- Oryan, A.; Alidadi, S.; Moshiri, A.; Maffulli, N. Bone regenerative medicine: Classic options, novel strategies, and future directions. Journal of orthopaedic surgery and research. J. Orthop. Surg. Res. 2014, 9, 1–27. [Google Scholar] [CrossRef] [Green Version]
- Chung, R.J. Study of hydroxyapatite nano composites with photoluminescence properties. Biomed. Eng. Appl. Basis Commun. 2011, 23, 107–112. [Google Scholar] [CrossRef]
- Dasgupta, S.; Banerjee, S.S.; Bandyopadhyay, A.; Bose, S. Zn- and Mg-doped hydroxyapatite nanoparticles for controlled release of protein. Langmuir 2010, 26, 4958–4964. [Google Scholar] [CrossRef] [Green Version]
- Talal, A.; Hamid, S.K.; Khan, M.; Khan, A.S. Structure of Biological Apatite: Bone and Tooth. Bone and Tooth; Elsevier Ltd.: Cambridge, UK, 2019; Volume 10. [Google Scholar]
- Dorozhkin, S.V. Nanodimensional and nanocrystalline hydroxyapatite and other calcium orthophosphates. Hydroxyapatite Synth. Prop. Appl. 2013, 2, 1–90. [Google Scholar]
- Ma, M.Y.; Zhu, Y.J.; Li, L.; Cao, S.W. Nanostructured porous hollow ellipsoidal capsules of hydroxyapatite and calcium silicate: Preparation and application in drug delivery. J. Mater. Chem. 2008, 18, 2722–2727. [Google Scholar] [CrossRef]
- Li, L.; Liu, Y.; Tao, J.; Zhang, M.; Pan, H.; Xu, X.; Tang, R. Surface modification of hydroxyapatite nanocrystallite by a small amount of terbium provides a biocompatible fluorescent probe. J. Phys. Chem. C 2008, 112, 12219–12224. [Google Scholar] [CrossRef]
- Chane-Ching, J.Y.; Lebugle, A.; Rousselot, I.; Pourpoint, A.; Pellé, F. Colloidal synthesis, and characterization of monocrystalline apatite nanophosphors. J. Mater. Chem. 2007, 17, 2904–2913. [Google Scholar] [CrossRef] [Green Version]
- Yang, Z.; Huang, Y.; Chen, S.T.; Zhao, Y.Q.; Li, H.L.; Hu, Z.A. Template synthesis of highly ordered hydroxyapatite nanowire arrays. J. Mater. Sci. 2005, 40, 1121–1125. [Google Scholar] [CrossRef]
- Liu, C.; Ji, X.; Cheng, G. Template synthesis and characterization of highly ordered lamellar hydroxyapatite. Appl. Surf. Sci. 2007, 253, 6840–6843. [Google Scholar] [CrossRef]
- Liu, Y.; Hou, D.; Wang, G. A simple wet chemical synthesis and characterization of hydroxyapatite nanorods. Mater. Chem. Phys. 2004, 86, 69–73. [Google Scholar] [CrossRef]
- Ripamonti, U. The morphogenesis of bone in replicas of porous hydroxyapatite obtained from conversion of calcium carbonate exoskeletons of coral. J. Bone Jt. Surg. Ser. A 1991, 73, 692–706. [Google Scholar] [CrossRef] [Green Version]
- Ripamonti, U.; Ma, S.-S.; van der Heever, B.; Reddi, A.H. Osteogenin, a bone morphogenetic protein, absorbed on porous hydroxyapatite substrata, induces rapid bone differentiation in calvarial defects of adults primates. Plast. Reconstr. Surg. 1992, 90, 382–393. [Google Scholar] [CrossRef] [PubMed]
- Barbeck, M.; Udeabor, S.; Lorenz, J.; Schlee, M.; Holthaus, M.G.; Raetscho, N.; Choukroun, J.; Sader, R.; Kirkpatrick, C.J.; Ghanaati, S. High-Temperature sintering of xenogeneic bone substitutes leads to increased multinucleated giant cell formation: In vivo and preliminary clinical results. J. Oral Implantol. 2014, 41, e212–e222. [Google Scholar] [CrossRef]
- Wei, J.Q.; Liu, Y.; Zhang, X.H.; Liang, W.W.; Zhou, T.F.; Zhang, H.; Deng, X.L. Enhanced critical-sized bone defect repair efficiency by combining deproteinized antler cancellous bone and autologous BMSCs. Chin. Chem. Lett. 2017, 28, 845–850. [Google Scholar] [CrossRef]
- Pramanik, S.; Agarwal, A.K.; Rai, K.N.; Garg, A. Development of high strength hydroxyapatite by solid-state-sintering process. Ceram. Int. 2007, 33, 419–426. [Google Scholar] [CrossRef]
- Sadat-Shojai, M.; Khorasani, M.T.; Dinpanah-Khoshdargi, E.; Jamshidi, A. Synthesis methods for nanosized hydroxyapatite with diverse structures. Acta Biomater. 2013, 9, 7591–7621. [Google Scholar] [CrossRef] [PubMed]
- Pham, V.H.; Van, H.N.; Tam, P.D.; Ha, H.N.T. A novel 1540 nm light emission from erbium doped hydroxyapatite/β-tricalcium phosphate through co-precipitation method. Mater. Lett. 2016, 167, 145–147. [Google Scholar] [CrossRef]
- Mobasherpour, I.; Heshajin, M.S.; Kazemzadeh, A.; Zakeri, M. Synthesis of nanocrystalline hydroxyapatite by using precipitation method. J. Alloys Compd. 2007, 430, 330–333. [Google Scholar] [CrossRef]
- Bose, S.; Saha, S.K. Synthesis of hydroxyapatite nanopowders via sucrose-templated Sol-Gel method. J. Am. Ceram. Soc. 2003, 86, 1055–1057. [Google Scholar] [CrossRef]
- Bigi, A.; Boanini, E.; Rubini, K. Hydroxyapatite gels and nanocrystals prepared through a sol-gel process. J. Solid State Chem. 2004, 177, 3092–3098. [Google Scholar] [CrossRef]
- Asri, R.I.M.; Harun, W.S.W.; Hassan, M.A.; Ghani, S.A.C.; Buyong, Z. A review of hydroxyapatite-based coating techniques: Sol-gel and electrochemical depositions on biocompatible metals. J. Mech. Behav. Biomed. Mater. 2016, 57, 95–108. [Google Scholar] [CrossRef] [Green Version]
- Türk, S.; Altınsoy, I.; ÇelebiEfe, G.; Ipek, M.; Özacar, M.; Bindal, C. Microwave–Assisted biomimetic synthesis of hydroxyapatite using different sources of calcium. Mater. Sci. Eng. C 2017, 76, 528–535. [Google Scholar] [CrossRef] [PubMed]
- Hu, C.; Aindow, M.; Wei, M. Focused ion beam-sectioning studies of biomimetic hydroxyapatite coatings on Ti-6Al-4V substrates. Surf. Coat. Technol. 2017, 313, 255–262. [Google Scholar] [CrossRef]
- Yokota, T.; Ito, R.; Shimizu, Y.; Honda, M.; Aizawa, M. Fabrication of sodium-substituted hydroxyapatite ceramics via ultrasonic spray-pyrolysis route and their material properties. KEM Key Eng. Mater. 2017, 758, 166–171. [Google Scholar] [CrossRef]
- Cho, J.S.; Lee, J.C.; Rhee, S.H. Effect of precursor concentration and spray pyrolysis temperature upon hydroxyapatite particle size and density. J. Biomed. Mater. Res. Part B Appl. Biomater. 2016, 104, 422–430. [Google Scholar] [CrossRef] [PubMed]
- Consani, S.; Balić-Žunić, T.; Cardinale, A.M.; Sgroi, W.; Giuli, G.; Carbone, C. A novel synthesis routine for woodwardite and its affinity towards light (La, Ce, Nd) and heavy (Gd and Y) rare earth elements. Materials 2018, 11, 130. [Google Scholar] [CrossRef] [Green Version]
- Gad, S.C. Cerium. In Encyclopedia of Toxicology, 3rd ed.; Elsevier: Amsterdam, The Netherlands, 2014; Volume 1, pp. 773–775. [Google Scholar]
- Kolmas, J.; Groszyk, E.; Kwiatkowska-Rózycka, D. Substituted hydroxyapatite with antibacterial properties: A review article. BioMed Res. Int. 2014, 2014, 178123. [Google Scholar] [CrossRef]
- Chen, M.H.; Yoshioka, T.; Toshiyuki, I.; Hanagata, N.; Lin, F.H.; Tanaka, J. Photoluminescence and doping mechanism of theranostic Eu3+/Fe3+ dual-doped hydroxyapatite nanoparticles. Sci. Technol. Adv. Mater. 2014, 15, 055005. [Google Scholar] [CrossRef]
- Yingguang, L.; Zhuoru, Y.; Jiang, C. Preparation, characterization and antibacterial property of cerium substituted hydroxyapatite nanoparticles. J. Rare Earths 2007, 25, 452–456. [Google Scholar]
- Zhou, G.; Li, Y.; Zheng, B.; Wang, W.; Gao, J.; Wei, H.; Li, S.; Wang, S.; Zhang, J. Cerium oxide nanoparticles protect primary osteoblasts against hydrogen peroxide induced oxidative damage. Micro. Nano Lett. 2014, 9, 91–96. [Google Scholar] [CrossRef]
- Leonelli, C.; Lusvardi, G.; Malavasi, G.; Menabue, L.; Tonelli, M. Synthesis and characterization of cerium-doped glasses and in vitro evaluation of bioactivity. J. Non Cryst. Solids 2003, 316, 198–216. [Google Scholar] [CrossRef]
- Kaygili, O.; Dorozhkin, S.V.; Keser, S. Synthesis and characterization of Ce-substituted hydroxyapatite by sol-gel method. Mater. Sci. Eng. C 2014, 42, 78–82. [Google Scholar] [CrossRef] [PubMed]
- Peng, B.; Song, K.; Wang, H.; Zhang, S.; Su, W.; Cheng, Z. Investigation on Ce3+ luminescence from different crystallographic sites, self energy transfer and abnormal thermal stability of nitrided Ba9Y2Si6O24: Ce3+ phosphor for W-LEDs. Ceram. Int. 2018, 44, 6584–6589. [Google Scholar] [CrossRef]
- Andronescu, E.; Predoi, D.; Neacsu, I.A.; Paduraru, A.V.; Musuc, A.M.; Trusca, R.; Oprea, O.; Tanasa, E.; Vasile, O.R.; Nicoara, A.I.; et al. Photoluminescent Hydroxylapatite: Eu3+ Doping Effect on Biological Behaviour. Nanomaterials 2019, 9, 1187. [Google Scholar] [CrossRef] [Green Version]
- Nicoara, A.I.; Ene, V.L.; Voicu, B.B.; Bucur, M.A.; Neacsu, I.A.; Vasile, B.S.; Iordache, F. Biocompatible Ag/Fe-Enhanced TiO2 Nanoparticles as an Effective Compound in Sunscreens. Nanomaterials 2020, 10, 570. [Google Scholar] [CrossRef] [Green Version]
- Paduraru, A.; Ghitulica, C.; Trusca, R.; Surdu, V.A.; Neacsu, I.A.; Holban, A.; Bîrca, A.; Iordache, F.; Vasile, B.S. Antimicrobial Wound Dressings as Potential Materials for Skin Tissue Regeneration. Materials 2019, 12, 1859. [Google Scholar] [CrossRef] [Green Version]
- Dhand, V.; Rhee, K.Y.; Park, S.J. The facile and low temperature synthesis of nanophase hydroxyapatite crystals using wet chemistry. Mater. Sci. Eng. C 2014, 36, 152–159. [Google Scholar] [CrossRef]
- Yuan, Q.; Qin, C.; Wu, J.; Xu, A.; Zhang, Z.; Liao, J.; Lin, S.; Ren, X.; Zhang, P. Synthesis and characterization of Cerium-doped hydroxyapatite/polylactic acid composite coatings on metal substrates. Mater. Chem. Phys. 2016, 182, 365–371. [Google Scholar] [CrossRef]
- Feng, Z.; Liao, Y.; Ye, M. Synthesis and structure of cerium-substituted hydroxyapatite. J. Mater. Sci. Mater. Med. 2005, 16, 417–421. [Google Scholar] [CrossRef] [PubMed]
- Priyadarshini, B.; Anjaneyulu, U.; Vijayalakshmi, U. Preparation and characterization of sol-gel derived Ce4+ doped hydroxyapatite and its in vitro biological evaluations for orthopedic applications. Mater. Des. 2017, 119, 446–455. [Google Scholar]
- Murugan, R.; Ramakrishna, S. Production of ultra-fine bioresorbable carbonated hydroxyapatite. Acta Biomater. 2006, 2, 201–206. [Google Scholar] [CrossRef]
- Veselinovic, L.; Karanovic, L.; Stojanovic, Z.; Bracko, I.; Markovic, S.; Ignjatovic, N.; Uskokovic, D. Crystal structure of cobalt-substituted calcium hydroxyapatite nanopowders prepared by hydrothermal processing. J. Appl. Crystallogr. 2010, 43, 320–327. [Google Scholar] [CrossRef]
- Lima, T.A.R.M.; Valerio, M.E.G. X-ray absorption fine structure spectroscopy and photoluminescence study of multifunctional europium (III)-doped hydroxyapatite in the presence of cationic surfactant medium. J. Lumin. 2018, 201, 70–76. [Google Scholar] [CrossRef]
- Elliott, J.C. Structure and Chemistry of the Apatites and Other Calcium Orthophosphates; Elsevier Press: Amsterdam, The Netherlands, 1994. [Google Scholar]
- Suzuki, T.; Hatsushika, T.; Miyake, M. Synthetic hydroxyapatites as inorganic cation exchangers. Part2. J. Chem. Soc. Faraday Trans. 1982, 178, 3605–3611. [Google Scholar] [CrossRef]
- Gaines, R.V.; Skinner, H.C.; Foord, E.E.; Mason, B.; Rosenzweig, A. Dana’s New Mineralogy; John Wiley&Sons Inc.: New York, NY, USA, 1997. [Google Scholar]
- Klein, C.; Dutrow, B. Mineral Science; John Wiley & Sons Inc.: New York, NY, USA, 2008. [Google Scholar]
- Shannon, R.D. Revised effective ionic radii and systematic studies of inter atomic distances in halides and chalcogenides. Acta Crystallogr. Sect. A Found. Crystallogr. 1976, 32, 751–767. [Google Scholar]
- Rameshbabu, N.; Sampath Kumar, T.S.; Prabhakar, T.G.; Sastry, V.S.; Murty, K.V.G.K.; Prasad Rao, K. Antibacterial nanosized silver substituted hydroxyapatite: Synthesis and characterization. J. Biomed. Mater. Res. A 2007, 80, 581–591. [Google Scholar] [CrossRef] [PubMed]
- Phataia, P.; Futalan, C.M.; Utara, S.; Khemthong, P.; Kamonwannasit, S. Structural characterization of cerium-doped hydroxyapatite nanoparticles synthesized by an ultrasonic-assisted sol-gel technique. Results Phys. 2018, 10, 956–963. [Google Scholar] [CrossRef]
- Ellis, D.E.; Terra, J.; Warschkow, O.; Jiang, M.; González, G.B.; Okasinski, J.S.; Bedzyk, M.J.; Rossi, A.M.; Eon, J.G. A theoretical and experimental study of lead substitution in calcium hydroxyapatite. Phys. Chem. Chem. Phys. 2006, 8, 967–976. [Google Scholar] [CrossRef] [PubMed]
- Getman, E.I.; Ignatov, A.V.; Loboda, S.N.; Abdul Jabar, M.A.B.; Zhegailo, A.O.; Gluhova, A.S. Substitution of samarium for strontium on the structure of hydroxyapatite. Funct. Mater. 2011, 18, 293–297. [Google Scholar]
- Cacciotti, I. Cationic and Anionic Substitutions in Hydroxyapatite. In Handbook of Bioceramics and Biocomposites; Antoniac, I., Ed.; Springer: Cham, Switzerland, 2016. [Google Scholar]
- Huang, W.J.; Mao, Z.; Chen, L.; Chi, Y.L.; Jiang, H.; Zimba, B.L.; Xiong, G.X.; Wu, Q.Z. Synthesis and characterisation of fluorescent and biocompatible hydroxyapatite nanoparticles with cerium doping. Micro Nano Lett. 2018, 13, 699–703. [Google Scholar] [CrossRef]


| Sample | D/nm | S/% | χc/% |
|---|---|---|---|
| Hap | 6.1 ± 0.8 | 1.5 ± 0.5 | 31.5 |
| Ca10−xCe(III)x(PO4)6(OH)2 | |||
| Ca9.95Ce(III)0.05(PO4)6(OH)2 | 6.3 ± 0.7 | 1.5 ± 0.6 | 38.2 |
| Ca9.9Ce(III)0.1(PO4)6(OH)2 | 5.4 ± 0.6 | 1.7 ± 0.6 | 33.7 |
| Ca9.75Ce(III)0.25(PO4)6(OH)2 | 5.6 ± 0.5 | 1.7 ± 0.6 | 33.6 |
| Ca9.5Ce(III)0.5(PO4)6(OH)2 | 4.8 ± 0.6 | 1.9 ± 0.7 | 34.5 |
| Ca9Ce(III)1(PO4)6(OH)2 | 3.7 ± 0.6 | 2.5 ± 0.9 | 21.1 |
| Ca10−xCe(IV)x(PO4)6(OH)2 | |||
| Ca9.95Ce(IV)0.05(PO4)6(OH)2 | 5.8 ± 0.8 | 1.6 ± 0.5 | 38.0 |
| Ca9.9Ce(IV)0.1(PO4)6(OH)2 | 5.7 ± 0.8 | 1.6 ± 0.6 | 38.8 |
| Ca9.75Ce(IV)0.25(PO4)6(OH)2 | 5.5 ± 0.8 | 1.7 ± 0.5 | 36.8 |
| Ca9.5Ce(IV)0.5(PO4)6(OH)2 | 4.6 ± 0.8 | 2.0 ± 0.6 | 37.2 |
| Ca9Ce(IV)1(PO4)6(OH)2 | 3.6 ± 0.5 | 2.6 ± 0.9 | 36.0 |
| Sample | a [Å] | c [Å] | V [Å3] | Rexp | Rp | Rwp | χ2 |
|---|---|---|---|---|---|---|---|
| Hap | 9.423 ± 0.003 | 6.884 ± 0.003 | 529.309 | 3.105 | 4.506 | 5.704 | 3.375 |
| Ca10−xCe(III)x(PO4)6(OH)2 | |||||||
| Ca9.95Ce(III)0.05(PO4)6(OH)2 | 9.431 ± 0.003 | 6.891 ± 0.002 | 530.832 | 3.660 | 4.186 | 5.724 | 2.447 |
| Ca9.9Ce(III)0.1(PO4)6(OH)2 | 9.427 ± 0.004 | 6.887 ± 0.003 | 529.987 | 3.736 | 3.985 | 5.182 | 1.924 |
| Ca9.75Ce(III)0.25(PO4)6(OH)2 | 9.440 ± 0.003 | 6.887 ± 0.003 | 531.485 | 3.680 | 3.934 | 5.099 | 1.920 |
| Ca9.5Ce(III)0.5(PO4)6(OH)2 | 9.433 ± 0.005 | 6.876 ± 0.004 | 529.823 | 3.601 | 4.544 | 6.005 | 2.781 |
| Ca9Ce(III)1(PO4)6(OH)2 | 9.439 ± 0.010 | 6.852 ± 0.008 | 528.761 | 5.011 | 4.929 | 6.126 | 1.494 |
| Ca10−xCe(IV)x(PO4)6(OH)2 | |||||||
| Ca9.95Ce(IV)0.05(PO4)6(OH)2 | 9.431 ± 0.0030 | 6.888 ± 0.0023 | 530.608 | 3.687 | 4.143 | 5.452 | 2.187 |
| Ca9.9Ce(IV)0.1(PO4)6(OH)2 | 9.440 ± 0.003 | 6.890 ± 0.003 | 531.711 | 3.662 | 4.351 | 5.790 | 2.501 |
| Ca9.75Ce(IV)0.25(PO4)6(OH)2 | 9.444 ± 0.004 | 6.889 ± 0.003 | 532.104 | 3.599 | 4.682 | 6.158 | 2.928 |
| Ca9.5Ce(IV)0.5(PO4)6(OH)2 | 9.468 ± 0.006 | 6.889 ± 0.005 | 534.867 | 3.773 | 5.942 | 7.942 | 4.431 |
| Ca9Ce(IV)1(PO4)6(OH)2 | 9.514 ± 0.0108 | 6.879 ± 0.009 | 539.224 | 3.772 | 7.137 | 9.886 | 6.868 |
Publisher’s Note: MDPI stays neutral with regard to jurisdictional claims in published maps and institutional affiliations. |
© 2021 by the authors. Licensee MDPI, Basel, Switzerland. This article is an open access article distributed under the terms and conditions of the Creative Commons Attribution (CC BY) license (https://creativecommons.org/licenses/by/4.0/).
Share and Cite
Paduraru, A.V.; Musuc, A.M.; Oprea, O.C.; Trusca, R.; Iordache, F.; Vasile, B.S.; Andronescu, E. Synthesis and Characterization of Photoluminescent Ce(III) and Ce(IV) Substituted Hydroxyapatite Nanomaterials by Co-Precipitation Method: Cytotoxicity and Biocompatibility Evaluation. Nanomaterials 2021, 11, 1911. https://doi.org/10.3390/nano11081911
Paduraru AV, Musuc AM, Oprea OC, Trusca R, Iordache F, Vasile BS, Andronescu E. Synthesis and Characterization of Photoluminescent Ce(III) and Ce(IV) Substituted Hydroxyapatite Nanomaterials by Co-Precipitation Method: Cytotoxicity and Biocompatibility Evaluation. Nanomaterials. 2021; 11(8):1911. https://doi.org/10.3390/nano11081911
Chicago/Turabian StylePaduraru, Andrei Viorel, Adina Magdalena Musuc, Ovidiu Cristian Oprea, Roxana Trusca, Florin Iordache, Bogdan Stefan Vasile, and Ecaterina Andronescu. 2021. "Synthesis and Characterization of Photoluminescent Ce(III) and Ce(IV) Substituted Hydroxyapatite Nanomaterials by Co-Precipitation Method: Cytotoxicity and Biocompatibility Evaluation" Nanomaterials 11, no. 8: 1911. https://doi.org/10.3390/nano11081911
APA StylePaduraru, A. V., Musuc, A. M., Oprea, O. C., Trusca, R., Iordache, F., Vasile, B. S., & Andronescu, E. (2021). Synthesis and Characterization of Photoluminescent Ce(III) and Ce(IV) Substituted Hydroxyapatite Nanomaterials by Co-Precipitation Method: Cytotoxicity and Biocompatibility Evaluation. Nanomaterials, 11(8), 1911. https://doi.org/10.3390/nano11081911