
Structure of Coal-Derived Metal-Supported Few-Layer Graphene Composite Materials Synthesized Using a Microwave-Assisted Catalytic Graphitization Process


Abstract
:1. Introduction
2. Materials and Methods
2.1. Materials and Sample Preparation
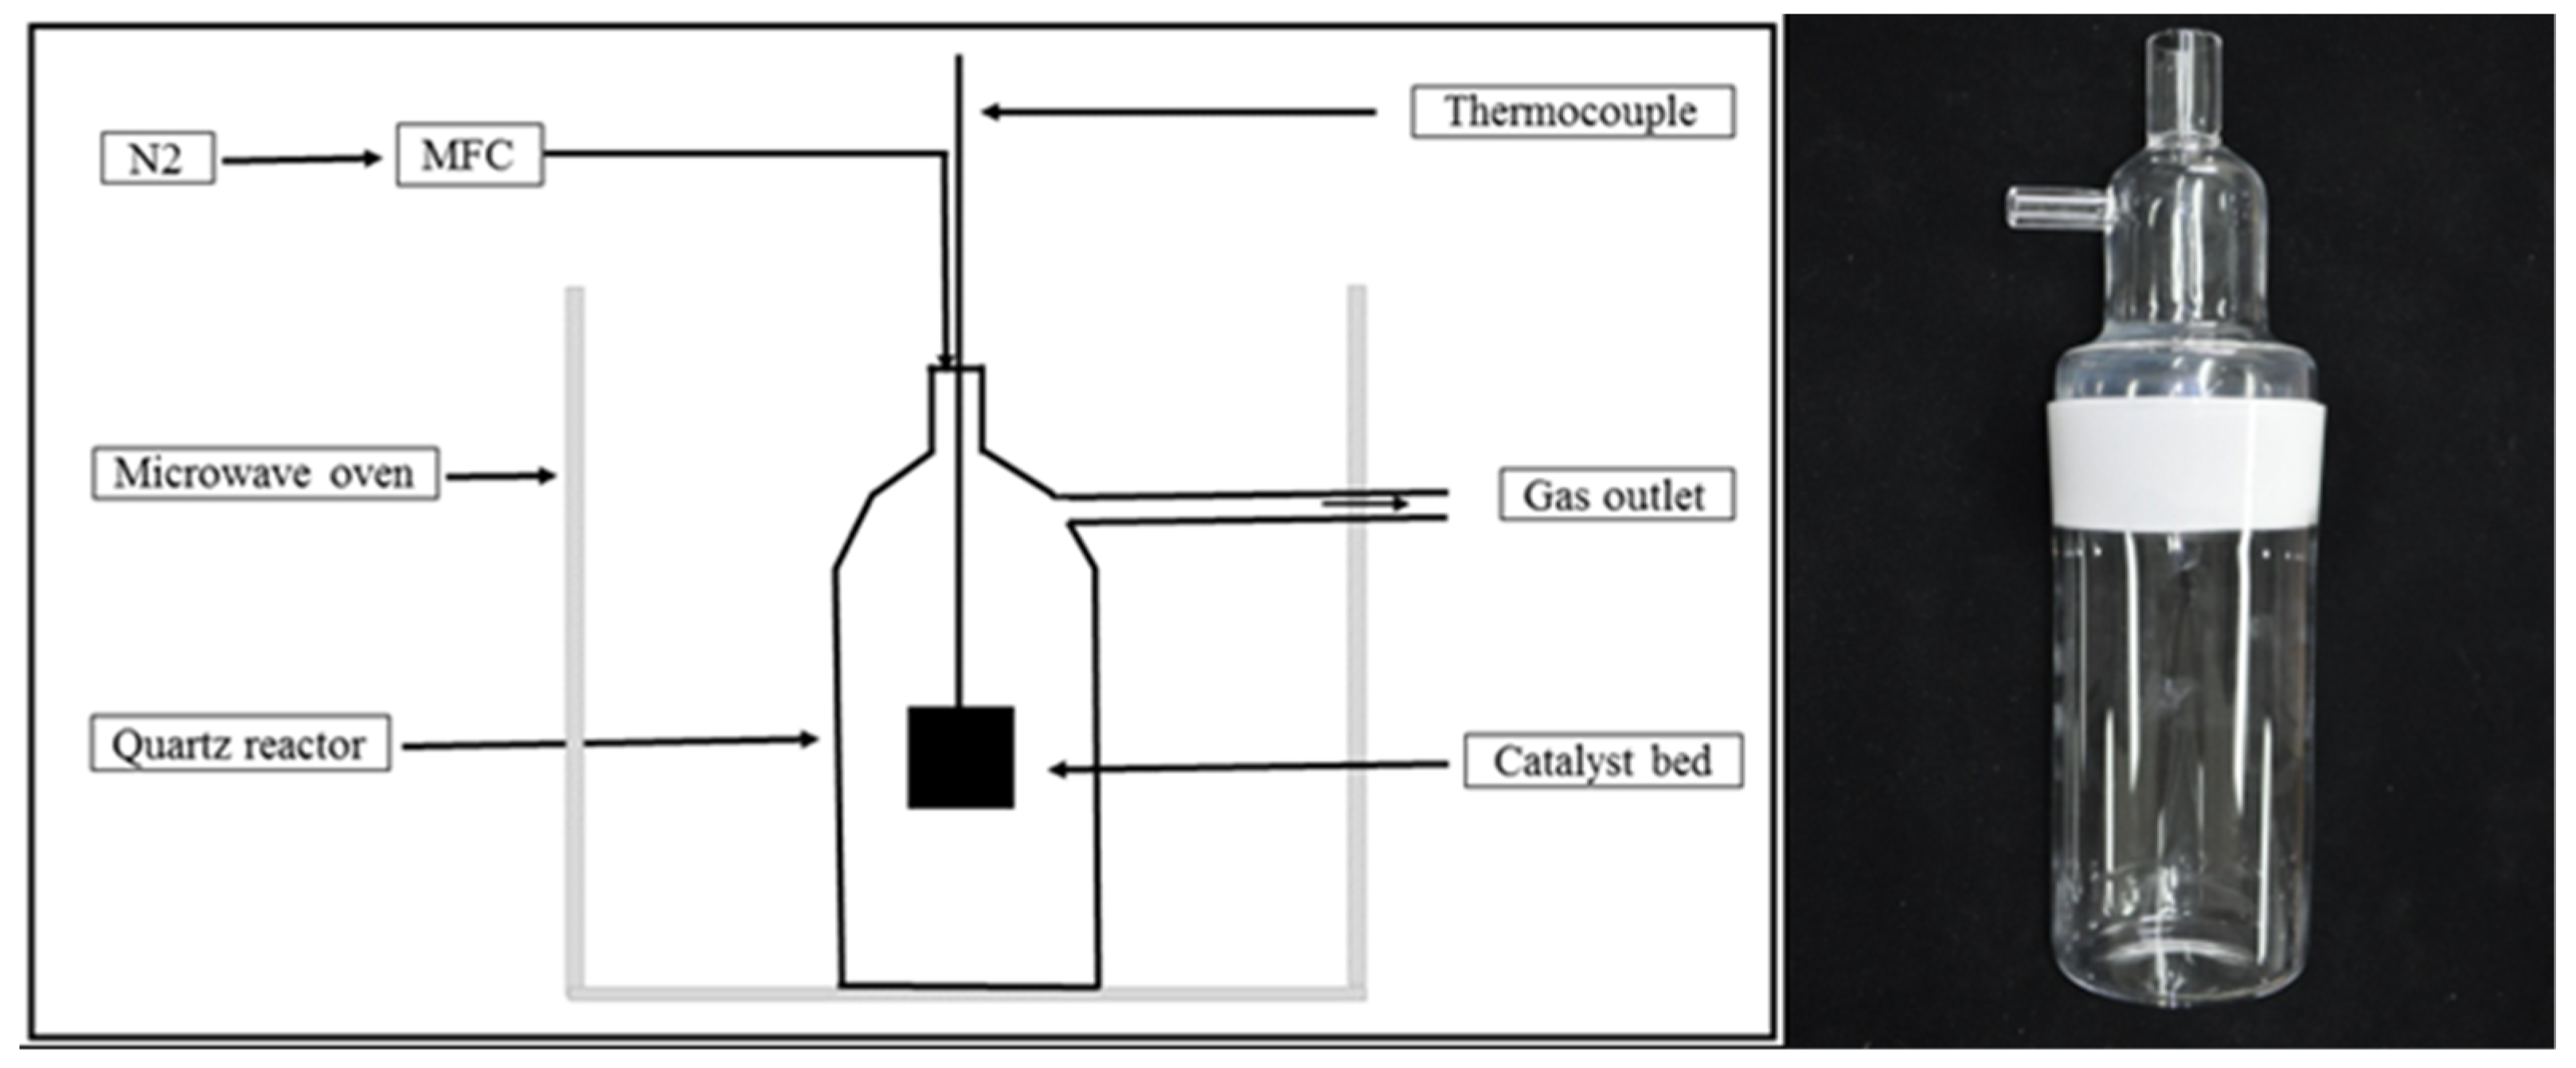
2.2. Microwave-Induced Graphitization
2.3. Characterization of Metal-Supported FLG Composite Materials
3. Results and Discussion
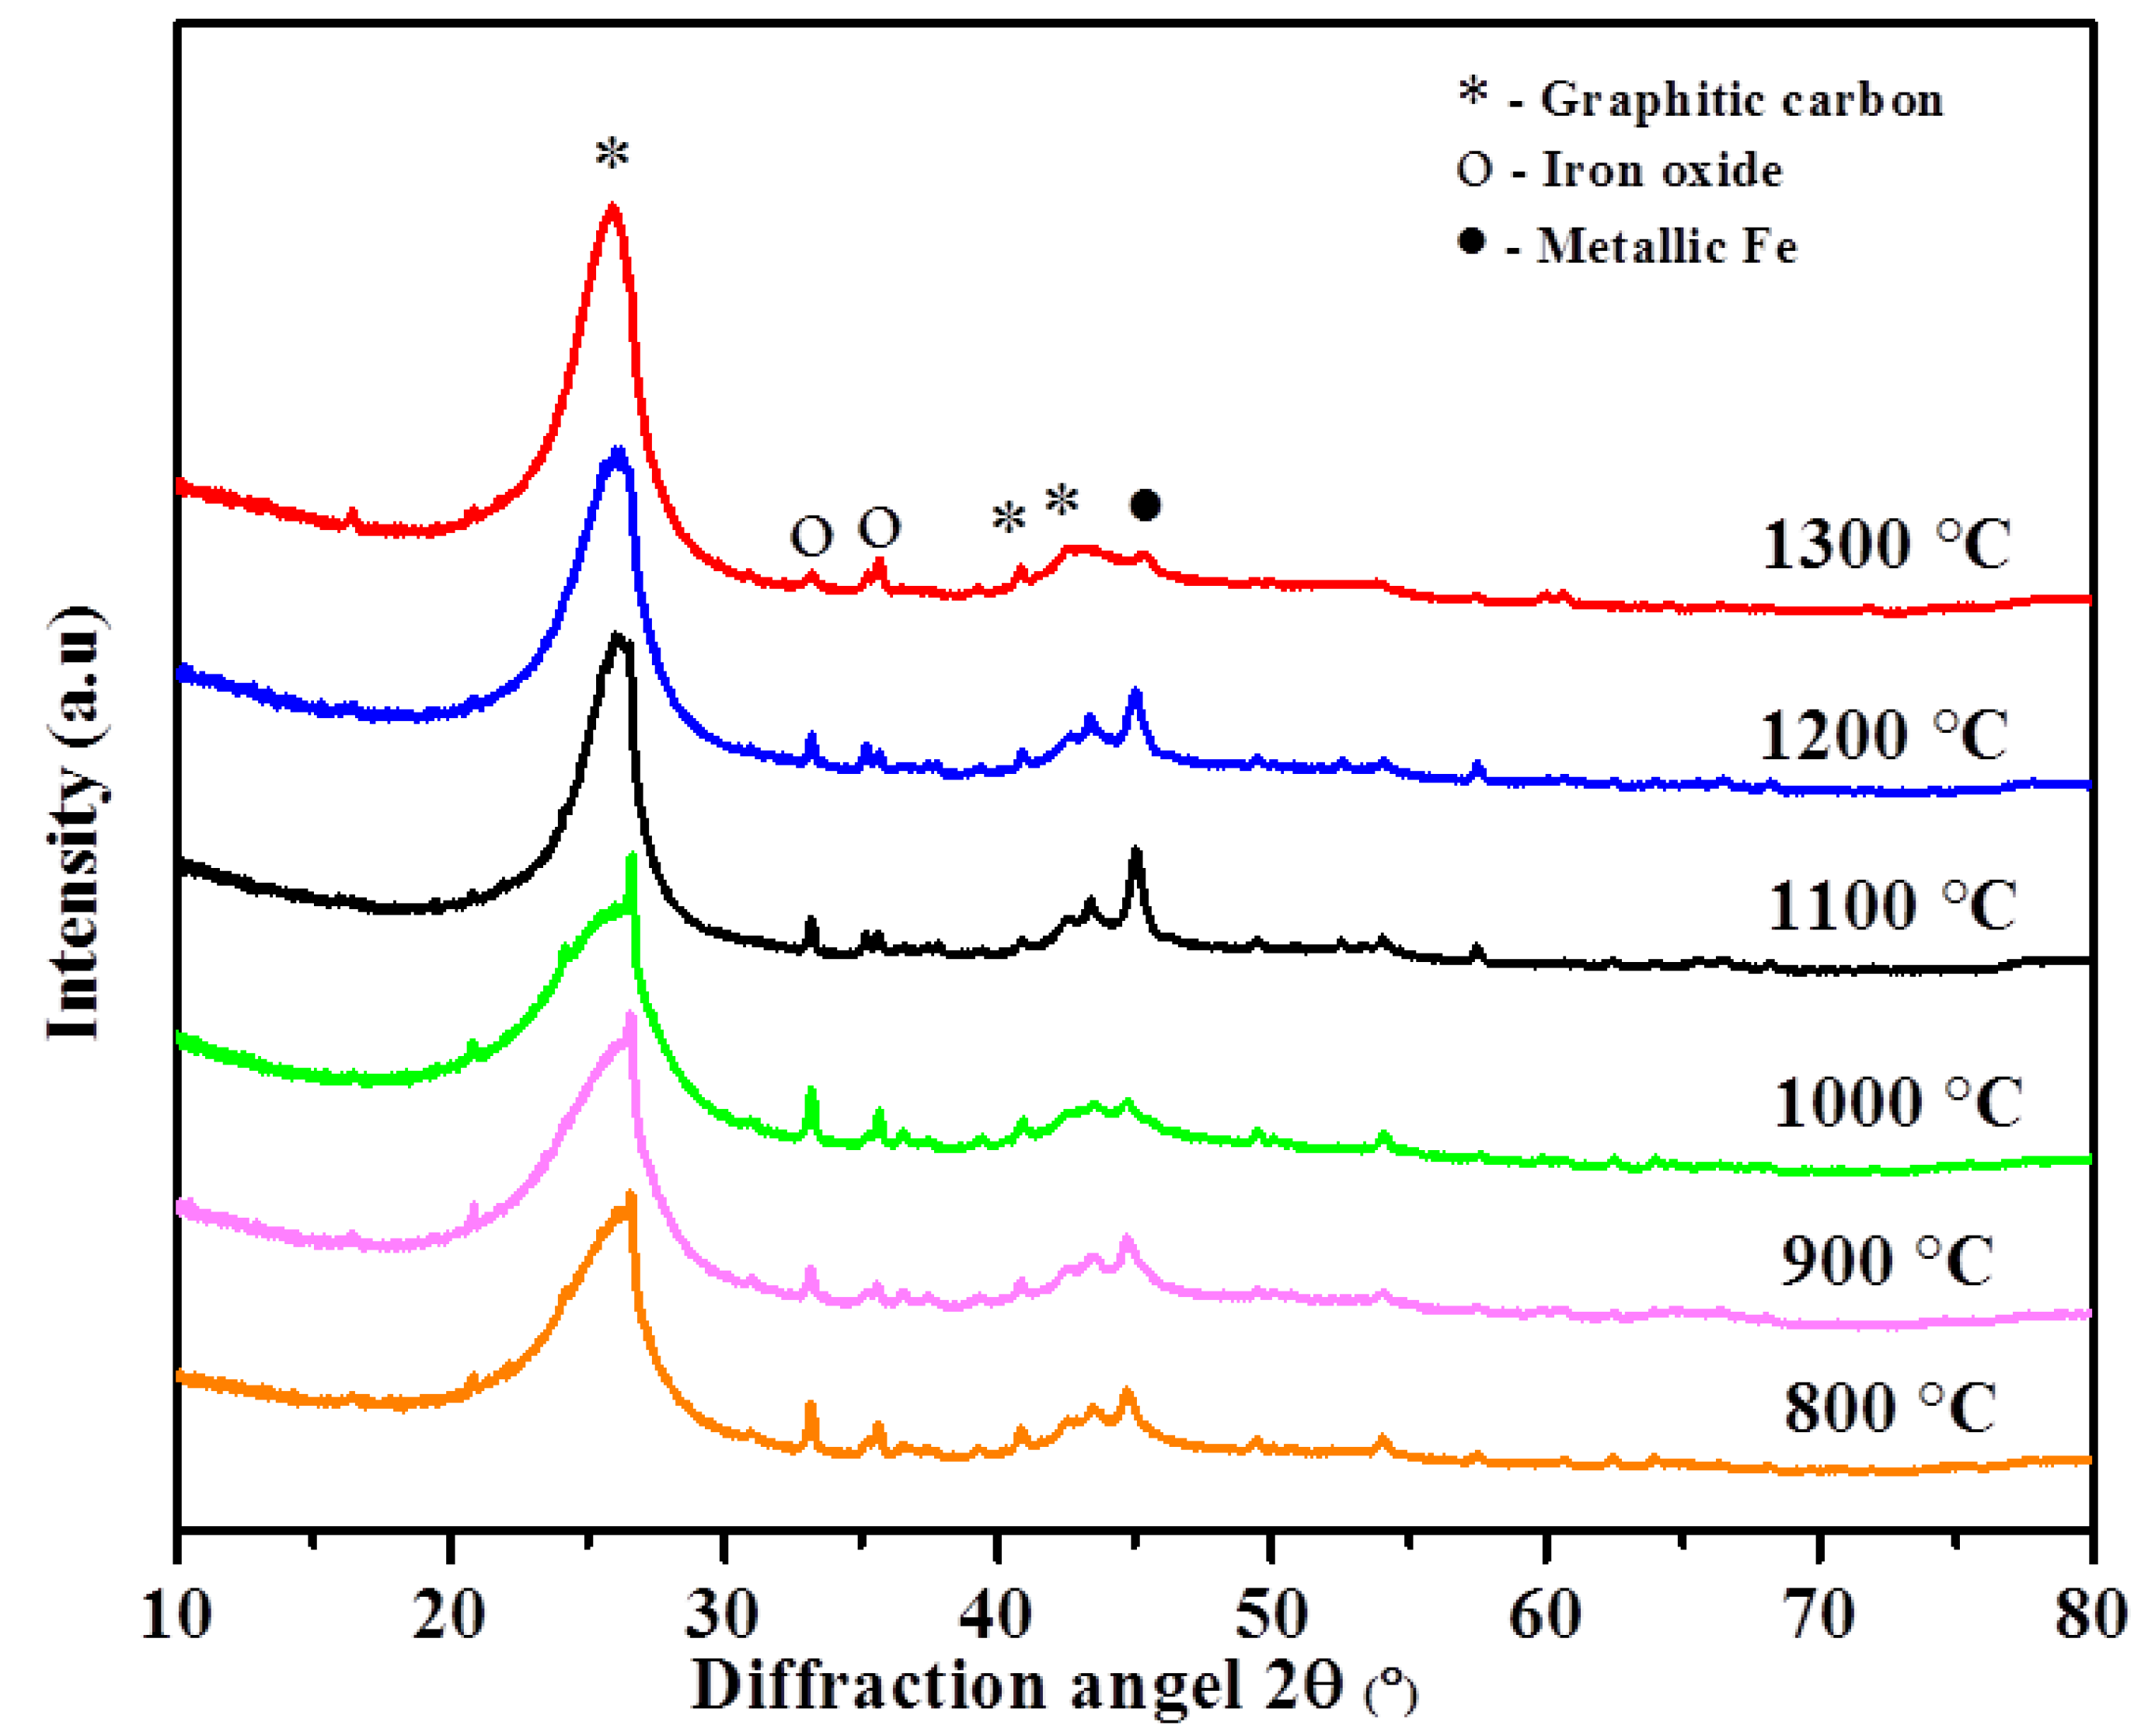
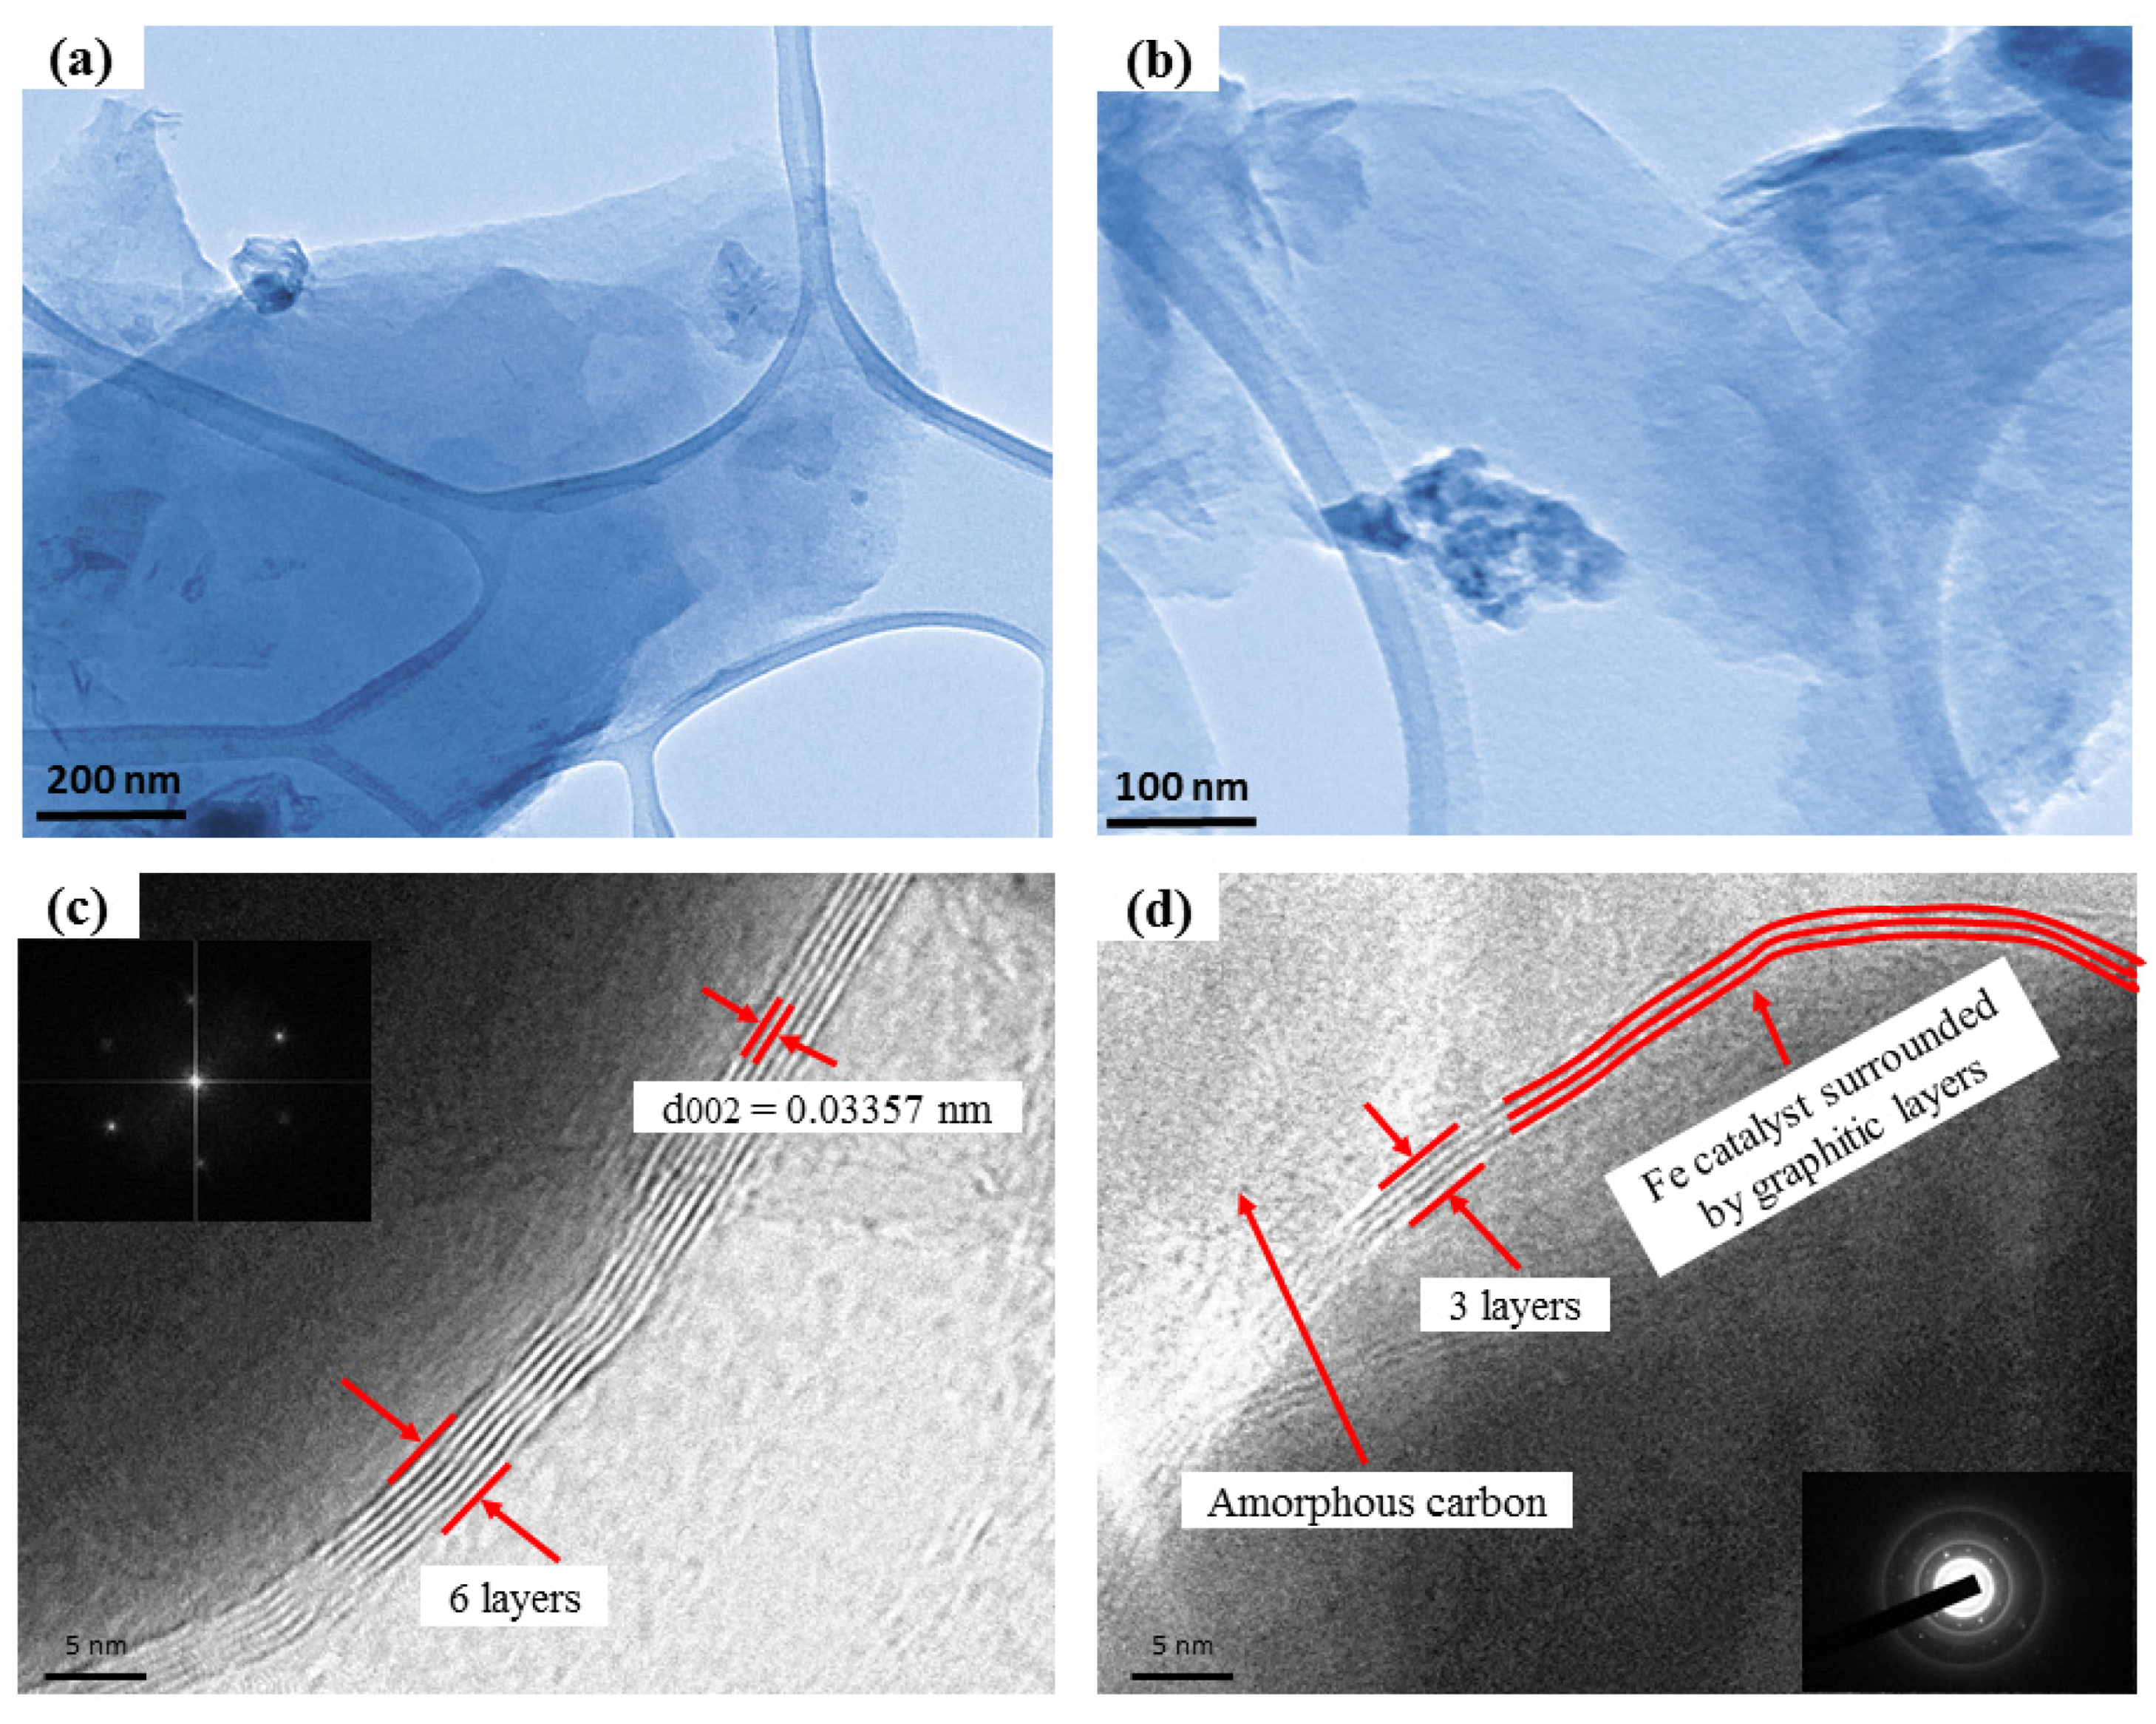
3.1. Morphology of Metal-Supported FLG Composite Materials
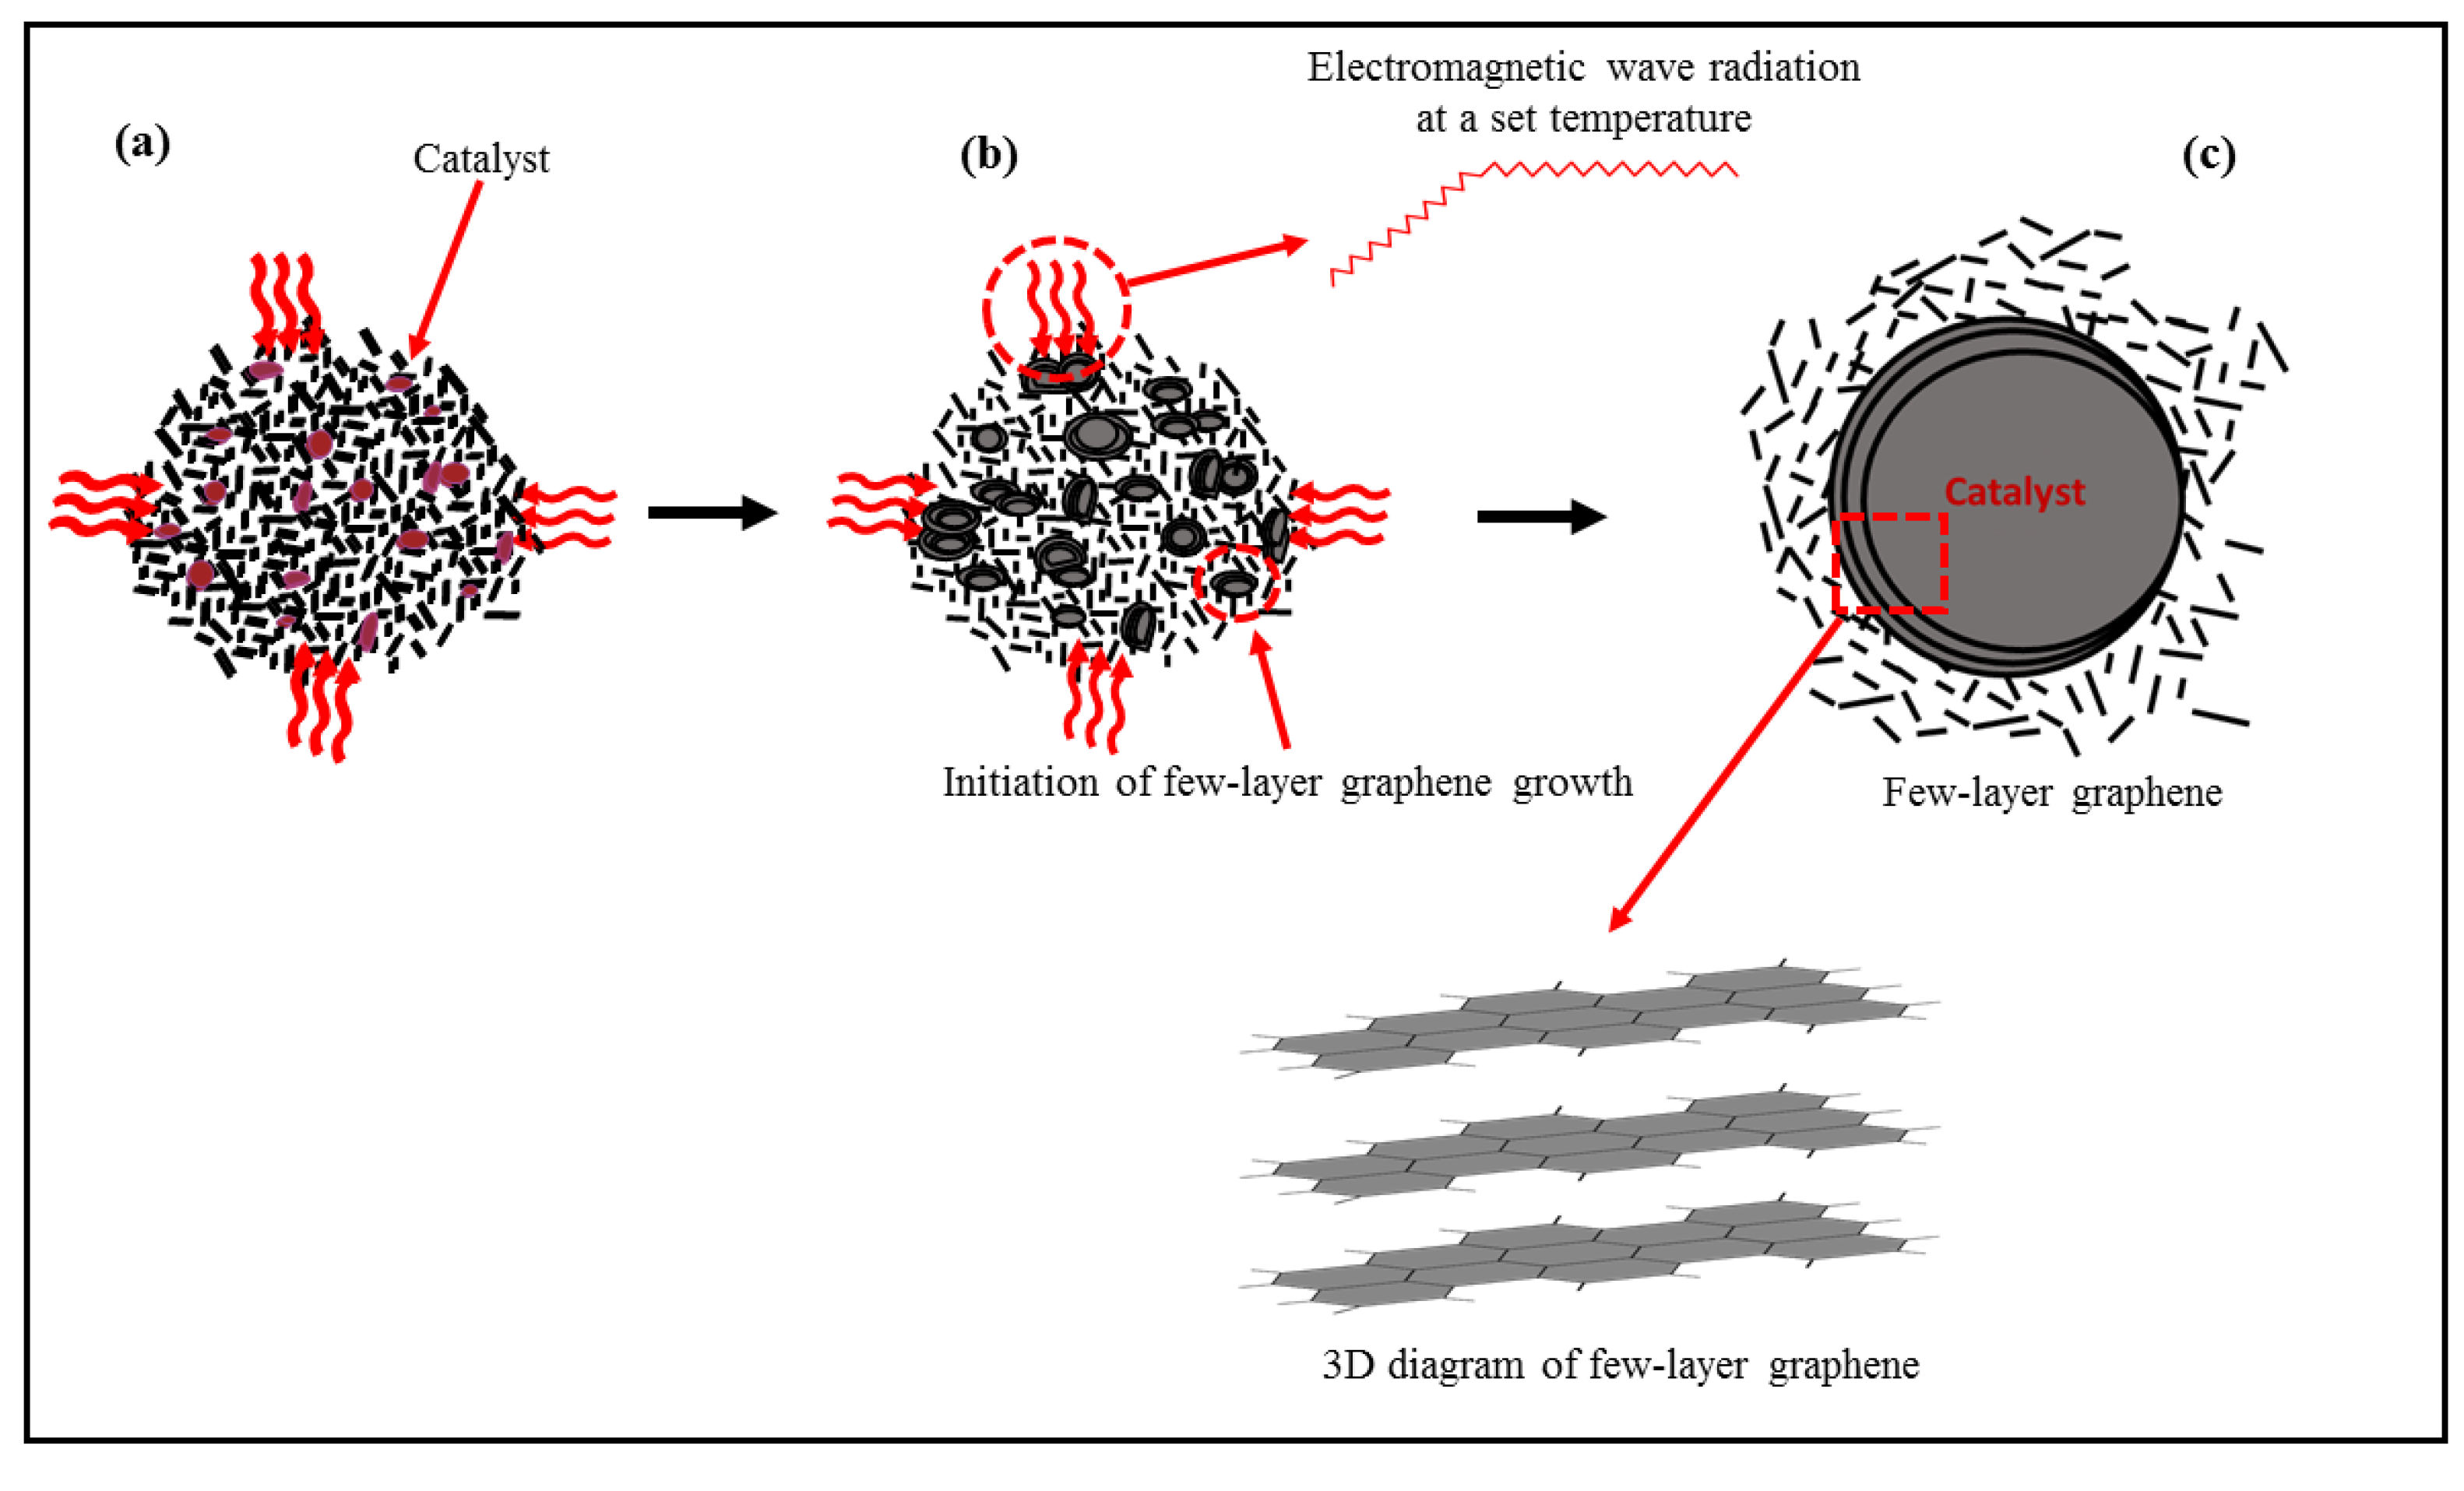
3.2. Proposed Mechanism of FLG Formation under Microwave Irradiation
4. Conclusions
Author Contributions
Funding
Institutional Review Board Statement
Informed Consent Statement
Data Availability Statement
Conflicts of Interest
References
- Tan, C.; Cao, X.; Wu, X.-J.; He, Q.; Yang, J.; Zhang, X.; Chen, J.; Zhao, W.; Han, S.; Nam, G.-H.; et al. Recent Advances in Ultrathin Two-Dimensional Nanomaterials. Chem. Rev. 2017, 117, 6225–6331. [Google Scholar] [CrossRef]
- Kim, K.S.; Zhao, Y.; Jang, H.; Lee, S.Y.; Kim, J.M.; Kim, K.S.; Ahn, J.H.; Kim, P.; Choi, J.Y.; Hong, B.H. Large-scale pattern growth of graphene films for stretchable transparent electrodes. Nature 2009, 457, 706–710. [Google Scholar] [CrossRef]
- Guo, H.-L.; Wang, X.-F.; Qian, Q.-Y.; Wang, F.-B.; Xia, X.-H. A Green Approach to the Synthesis of Graphene Nanosheets. ACS Nano 2009, 3, 2653–2659. [Google Scholar] [CrossRef] [PubMed]
- Presser, V.; Heon, M.; Gogotsi, Y. Carbide-Derived Carbons—From Porous Networks to Nanotubes and Graphene. Adv. Funct. Mater. 2011, 21, 810–833. [Google Scholar] [CrossRef]
- Stankovich, S.; Dikin, D.A.; Piner, R.D.; Kohlhaas, K.A.; Kleinhammes, A.; Jia, Y.; Wu, Y.; Nguyen, S.; Ruoff, R.S. Synthesis of graphene-based nanosheets via chemical reduction of exfoliated graphite oxide. Carbon 2007, 45, 1558–1565. [Google Scholar] [CrossRef]
- Cai, W.; Zhu, Y.; Li, X.; Piner, R.D.; Ruoff, R.S. Large area few-layer graphene/graphite films as transparent thin conducting electrodes. Appl. Phys. Lett. 2009, 95, 123115. [Google Scholar] [CrossRef]
- Vijapur, S.H.; Wang, D.; Botte, G.G. Raw Coal Derived Large Area and Transparent Graphene Films. ECS Solid State Lett. 2013, 2, M45–M47. [Google Scholar] [CrossRef]
- Letcher, T.M. Climate Change: Observed Impacts on Planet EARTH; Elsevier: Amsterdam, The Netherlands, 2015. [Google Scholar]
- Brunekreef, B.; Holgate, S.T. Air pollution and health. Lancet 2002, 360, 1233–1242. [Google Scholar] [CrossRef]
- Notarianni, M.; Liu, J.; Vernon, K.; Motta, N. Synthesis and applications of carbon nanomaterials for energy generation and storage. Beilstein J. Nanotechnol. 2016, 7, 149–196. [Google Scholar] [CrossRef] [Green Version]
- Wang, G.; Zhang, L.; Zhang, J. A review of electrode materials for electrochemical supercapacitors. Chem. Soc. Rev. 2012, 41, 797–828. [Google Scholar] [CrossRef] [Green Version]
- Qiu, T.; Yang, J.-G.; Bai, X.-J. Preparation of coal-based graphite with different microstructures by adjusting the con-tent of ash and volatile matter in raw coal. Energy Sources Part A Recovery Util. Environ. Eff. 2020, 42, 1874–1881. [Google Scholar] [CrossRef]
- Qiu, T.; Yang, J.G.; Bai, X.J.; Wang, Y.L. The preparation of synthetic graphite materials with hierarchical pores from lignite by one-step impregna-tion and their characterization as dye absorbents. RSC Adv. 2019, 9, 12737–12746. [Google Scholar] [CrossRef] [Green Version]
- Bi, H.; Wan, S.; Cao, X.; Wu, X.; Zhou, Y.; Yin, K.; Su, S.; Ma, Q.; Sindoro, M.; Zhu, J.; et al. A general and facile method for preparation of large-scale reduced graphene oxide films with controlled structures. Carbon 2019, 143, 162–171. [Google Scholar] [CrossRef]
- Xian, H.; Peng, T.; Sun, H.; Wang, J. Preparation of graphene nanosheets from microcrystalline graphite by low-temperature exfoliated meth-od and their supercapacitive behavior. J. Mater. Sci. 2015, 50, 4025–4033. [Google Scholar] [CrossRef]
- Xian, H.; Peng, T.; Sun, H.; Wang, J. Preparation, characterization and supercapacitive performance of graphene nanosheets from microcrys-talline graphite. J. Mater. Sci. Mater. Electron. 2015, 26, 242–249. [Google Scholar] [CrossRef]
- Chen, J.; Li, Y.; Huang, L.; Li, C.; Shi, G. High-yield preparation of graphene oxide from small graphite flakes via an improved Hummers method with a simple purification process. Carbon 2015, 81, 826–834. [Google Scholar] [CrossRef]
- Foo, K.Y.; Hameed, B.H. Preparation of oil palm (Elaeis) empty fruit bunch activated carbon by microwave-assisted KOH activation for the adsorption of methylene blue. Desalination 2011, 275, 302–305. [Google Scholar] [CrossRef]
- Liu, Q.S.; Zheng, T.; Li, N.; Wang, P.; Abulikemu, G. Modification of bamboo-based activated carbon using microwave radiation and its effects on the ad-sorption of methylene blue. Appl. Surf. Sci. 2010, 256, 3309–3315. [Google Scholar] [CrossRef]
- Tian, Z.Q.; Jiang, S.P.; Liang, Y.M.; Shen, P.K. Synthesis and Characterization of Platinum Catalysts on Multiwalled Carbon Nanotubes by Intermittent Microwave Irradiation for Fuel Cell Applications. J. Phys. Chem. B 2006, 110, 5343–5350. [Google Scholar] [CrossRef]
- Liu, X.; Quan, X.; Bo, L.; Chen, S.; Zhao, Y.; Chang, M. Temperature measurement of GAC and decomposition of PCP loaded on GAC and GAC-supported copper catalyst in microwave irradiation. Appl. Catal. A Gen. 2004, 264, 53–58. [Google Scholar] [CrossRef]
- Leonelli, C.; Lojkowski, W. Main development directions in the application of microwave irradiation to the synthesis of nanopowders. Chem. Today 2007, 25, 34–38. [Google Scholar]
- Leonelli, C.; Mason, T.J. Microwave and ultrasonic processing: Now a realistic option for industry. Chem. Eng. Process. Process. Intensif. 2010, 49, 885–900. [Google Scholar] [CrossRef]
- Schanche, J.-S. Microwave synthesis solutions from personal chemistry. Mol. Divers. 2003, 7, 291–298. [Google Scholar] [CrossRef]
- Wojnarowicz, J.; Chudoba, T.; Lojkowski, W. A Review of Microwave Synthesis of Zinc Oxide Nanomaterials: Re-actants, Process Parameters and Morphoslogies. Nanomaterials 2020, 10, 1086. [Google Scholar] [CrossRef] [PubMed]
- Singh, A. Microwave synthesis, optical, structural and magnetic characterization of ZnO/Mn doped ZnO nanoparticles. J. Optoelectron. Adv. Mater. 2010, 12, 2255–2260. [Google Scholar]
- Vasudev, H.; Singh, G.; Bansal, A.; Vardhan, S.; Thakur, L. Microwave heating and its applications in surface engineering: A review. Mater. Res. Express 2019, 6, 102001. [Google Scholar] [CrossRef]
- Gaba, M.; Dhingra, N. Microwave chemistry: General features and applications. Ind. J. Pharm. Edu. Res. 2011, 45, 175–183. [Google Scholar]
- Giberson, R.T. Vacuum-Assisted Microwave Processing of Animal Tissues for Electron Microscopy. In Springer Protocols Handbooks; Springer Science and Business Media LLC: Berlin/Heidelberg, Germany, 2001; pp. 13–23. [Google Scholar]
- Mishra, R.R.; Sharma, A.K. A review of research trends in microwave processing of metal-based materials and op-portunities in microwave metal casting. Crit. Rev. Solid State Mater. Sci. 2016, 41, 217–255. [Google Scholar] [CrossRef]
- Leonelli, C.; Veronesi, P.; Denti, L.; Gatto, A.; Iuliano, L. Microwave assisted sintering of green metal parts. J. Mater. Process. Technol. 2008, 205, 489–496. [Google Scholar] [CrossRef]
- Chandrasekaran, S.; Ramanathan, S.; Basak, T. Microwave food processing—A review. Food Res. Int. 2013, 52, 243–261. [Google Scholar] [CrossRef]
- Feng, H.; Yin, Y.; Tang, J. Microwave Drying of Food and Agricultural Materials: Basics and Heat and Mass Transfer Modeling. Food Eng. Rev. 2012, 4, 89–106. [Google Scholar] [CrossRef]
- Dąbrowska, S.; Chudoba, T.; Wojnarowicz, J.; Łojkowski, W. Current trends in the development of microwave reactors for the synthesis of nanomaterials in la-boratories and industries: A review. Crystals 2018, 8, 379. [Google Scholar] [CrossRef] [Green Version]
- Zhu, Y.; Murali, S.; Stoller, M.D.; Velamakanni, A.; Piner, R.D.; Ruoff, R.S. Microwave assisted exfoliation and reduction of graphite oxide for ultracapacitors. Carbon 2010, 48, 2118–2122. [Google Scholar] [CrossRef]
- Hu, H.; Zhao, Z.; Zhou, Q.; Gogotsi, Y.; Qiu, J. The role of microwave absorption on formation of graphene from graphite oxide. Carbon 2012, 50, 3267–3273. [Google Scholar] [CrossRef]
- Masi, C.A.; Schumacher, T.A.; Hilman, J.; Dulal, R.; Rimal, G.; Xu, B.; Leonard, B.; Tang, J.; Fan, M.; Chien, T. Converting raw coal powder into polycrystalline nano-graphite by metal-assisted microwave treat-ment. Nano Struct. Nano Objects 2021, 25, 100660. [Google Scholar] [CrossRef]
- Hu, L.; Cheng, Q.; Chen, D.; Ma, M.; Wu, K. Liquid-phase exfoliated graphene as highly-sensitive sensor for simultaneous determination of endocrine disruptors: Diethylstilbestrol and estradiol. J. Hazard. Mater. 2015, 283, 157–163. [Google Scholar] [CrossRef] [PubMed]
- Wei, P.; Shen, J.; Wu, K.; Hu, C. Tuning electrochemical behaviors of N-methyl-2-pyrrolidone liquid exfoliated graphene nanosheets by centrifugal speed-based grading. Carbon 2018, 129, 183–190. [Google Scholar] [CrossRef]
- Hernandez, Y.; Nicolosi, V.; Lotya, M.; Blighe, F.M.; Sun, Z.; De, S.; McGovern, I.T.; Holland, B.; Byrne, M.; Gun’Ko, Y.K.; et al. High-yield production of graphene by liquid-phase exfoliation of graphite. Nat. Nanotechnol. 2008, 3, 563–568. [Google Scholar] [CrossRef] [Green Version]
- Xing, B.; Zhang, C.; Cao, Y.; Huang, G.; Liu, Q.; Zhang, C.; Chen, Z.; Yi, G.; Chen, L.; Yu, J. Preparation of synthetic graphite from bituminous coal as anode materials for high performance lithi-um-ion batteries. Fuel Process. Technol. 2018, 172, 162–171. [Google Scholar] [CrossRef]
- Bonijoly, M.; Oberlin, M. A possible mechanism for natural graphite formation. Int. J. Coal Geol. 1982, 1, 283–312. [Google Scholar] [CrossRef]
- Lian, W.; Song, H.; Chen, X.; Li, L.; Huo, J.; Zhao, M.; Wang, G. The transformation of acetylene black into onion-like hollow carbon nanoparticles at 1000 °C using an iron catalyst. Carbon 2008, 46, 525–530. [Google Scholar] [CrossRef]
- Liu, Y.; Liu, Q.; Gu, J.; Kang, D.; Zhou, F.; Zhang, W.; Wu, Y.; Zhang, D. Highly porous graphitic materials prepared by catalytic graphitization. Carbon 2013, 64, 132–140. [Google Scholar] [CrossRef]
- Rodríguez-Manzo, J.A.; Pham-Huu, C.; Banhart, F. Graphene growth by a metal-catalyzed solid-state transfor-mation of amorphous carbon. ACS Nano 2011, 5, 1529–1534. [Google Scholar] [CrossRef]
- Kim, J.; Lee, J.; Choi, Y.; Jo, C. Synthesis of hierarchical linearly assembled graphitic carbon nanoparticles via catalytic graphitization in SBA. Carbon 2014, 75, 95–103. [Google Scholar] [CrossRef]
- Gutiérrez-Pardo, A.; Ramírez-Rico, J.; De Arellano-López, A.R.; Martínez-Fernández, J. Characterization of porous graphitic monoliths from pyrolyzed wood. J. Mater. Sci. 2014, 49, 7688–7696. [Google Scholar] [CrossRef]
- Sevilla, M.; Martinez-de Lecea, C.S.; Valdés-Solís, T.; Morallón, E.; Fuertes, A.B. Solid-phase synthesis of graphitic carbon nanostructures from iron and cobalt gluconates and their uti-lization as electrocatalyst supports. Phys. Chem. Chem. Phys. 2008, 10, 1433–1442. [Google Scholar] [CrossRef] [PubMed] [Green Version]
- Li, S.; Li, F.; Wang, J.; Tian, L.; Zhang, H.; Zhang, S. Preparation of Hierarchically Porous Graphitic Carbon Spheres and Their Applications in Supercapacitors and Dye Adsorption. Nanomaterials 2018, 8, 625. [Google Scholar] [CrossRef] [PubMed] [Green Version]
- Yeh, T.-S.; Wu, Y.-S.; Lee, Y.-H. Graphitization of unburned carbon from oil-fired fly ash applied for anode materials of high power lithium ion batteries. Mater. Chem. Phys. 2011, 130, 309–315. [Google Scholar] [CrossRef]
- Wang, T.; Wang, Y.; Cheng, G.; Ma, C.; Liu, X.; Wang, J.; Qiao, W.; Ling, L. Catalytic Graphitization of Anthracite as an Anode for Lithium-Ion Batteries. Energy Fuels 2020, 34, 8911–8918. [Google Scholar] [CrossRef]
- Zhong, M.; Yan, J.; Wu, H.; Shen, W.; Zhang, J.; Yu, C.; Li, L.; Hao, Q.; Gao, F.; Tian, Y.; et al. Multilayer graphene spheres generated from anthracite and semi-coke as anode materials for lithi-um-ion batteries. Fuel Process. Technol. 2020, 198, 106241. [Google Scholar] [CrossRef]
- Kinoshita, K. Electrochemical Oxygen Technology; John Wiley & Sons: Hoboken, NJ, USA, 1992; Volume 30. [Google Scholar]
- Kim, T.; Lee, J. Full graphitization of amorphous carbon by microwave heating. RSC Adv. 2016, 6, 24667–24674. [Google Scholar] [CrossRef] [Green Version]
- Bystrzejewski, M. Synthesis of carbon-encapsulated iron nanoparticles via solid state reduction of iron oxide nanoparti-cles. J. Solid State Chem. 2011, 184, 1492–1498. [Google Scholar] [CrossRef]
- Malard, L.M.; Pimenta, M.A.; Dresselhaus, G.; Dresselhaus, M.S. Raman spectroscopy in graphene. Phys. Rep. 2009, 473, 51–87. [Google Scholar] [CrossRef]
- Pavoski, G.; Maraschin, T.; Fim, F.D.C.; Balzaretti, N.M.; Galland, G.B.; Moura, C.; Basso, N. Few Layer Reduced Graphene Oxide: Evaluation of the Best Experimental Conditions for Easy Production. Mater. Res. 2016, 20, 53–61. [Google Scholar] [CrossRef] [Green Version]
- Santangelo, S.; Messina, G.; Faggio, G.; Lanza, M.; Milone, C. Evaluation of crystalline perfection degree of multi-walled carbon nanotubes: Correlations between thermal kinetic analysis and micro-Raman spectroscopy. J. Raman Spectrosc. 2010, 42, 593–602. [Google Scholar] [CrossRef]
- Ōya, A.; Ōtani, S. Catalytic graphitization of carbons by various metals. Carbon 1979, 17, 131–137. [Google Scholar] [CrossRef]
- Derbyshire, F.; Presland, A.; Trimm, D. Graphite formation by the dissolution—Precipitation of carbon in cobalt, nickel and iron. Carbon 1975, 13, 111–113. [Google Scholar] [CrossRef]
- Okamoto, H. The C-Fe (carbon-iron) system. J. Phase Equilibria Diffus. 1992, 13, 543–565. [Google Scholar] [CrossRef]
- Zhang, Y.; Zhang, L.; Kim, P.; Ge, M.; Li, Z.; Zhou, C. Vapor Trapping Growth of Single-Crystalline Graphene Flowers: Synthesis, Morphology, and Electronic Properties. Nano Lett. 2012, 12, 2810–2816. [Google Scholar] [CrossRef] [PubMed]
- Liu, L.H.; Lyu, J.; Zhao, T.K.; Li, T.H. Large area preparation of multilayered graphene films by chemical vapour deposition with high elec-trocatalytic activity toward hydrogen peroxide. Mater. Technol. 2015, 30, 121–126. [Google Scholar] [CrossRef]
- Cameán, I.; LaVela, P.; Tirado, J.L.; Garcia, A. On the electrochemical performance of anthracite-based graphite materials as anodes in lithium-ion batteries. Fuel 2010, 89, 986–991. [Google Scholar] [CrossRef]
- Ma, C.; Zhao, Y.; Li, J.; Song, Y.; Shi, J.; Guo, Q.; Liu, L. Synthesis and electrochemical properties of artificial graphite as an anode for high-performance lithi-um-ion batteries. Carbon 2013, 64, 553–556. [Google Scholar] [CrossRef] [Green Version]
- Charon, E.; Rouzaud, J.-N.; Aléon, J. Graphitization at low temperatures (600–1200 °C) in the presence of iron impli-cations in planetology. Carbon 2014, 66, 178–190. [Google Scholar] [CrossRef]
- Fitzer, E.; Kegel, B. Reactions of Carbon Saturated Vanadium Carbide Melts with Different Order Carbons (Catalytic Graphitization). Carbon 1968, 6, 433. [Google Scholar] [CrossRef]
- Gür, T.M. Review of electrical energy storage technologies, materials and systems: Challenges and prospects for large-scale grid storage. Energy Environ. Sci. 2018, 11, 2696–2767. [Google Scholar] [CrossRef]
- Juang, Z.-Y.; Wu, C.-Y.; Lo, C.-W.; Chen, W.-Y.; Huang, C.-F.; Hwang, J.-C.; Chen, F.-R.; Leou, K.-C.; Tsai, C.-H. Synthesis of graphene on silicon carbide substrates at low temperature. Carbon 2009, 47, 2026–2031. [Google Scholar] [CrossRef]
- Kiciński, W.; Norek, M.; Bystrzejewski, M. Monolithic porous graphitic carbons obtained through catalytic graphiti-zation of carbon xerogels. J. Phys. Chem. Solids 2013, 74, 101–109. [Google Scholar] [CrossRef]


| Temperature (°C)/Parameter | 800 | 900 | 1000 | 1100 | 1200 | 1300 |
|---|---|---|---|---|---|---|
| Interlayer spacing (d002)(nm) 1 | 0.3366 | 0.3364 | 0.3368 | 0.3363 | 0.3362 | 0.3357 |
| Crystallite size (Lc) (nm) 1 | 2.76 | 2.88 | 3.16 | 3.22 | 3.24 | 3.28 |
| In-plane crystallite thickness (La) (nm) | 5.95 | 6.20 | 6.82 | 6.95 | 6.98 | 7.06 |
| g factor (%) 2 | 86.3 | 87.8 | 88.5 | 89.2 | 90.7 | 96.5 |
| Fe Loading (%)/Parameter | S2 | S5 | S10 | S20 |
|---|---|---|---|---|
| Interlayer spacing (d002)(nm) 1 | 0.3367 | 0.3362 | 0.3357 | 0.3365 |
| Crystallite size (Lc) (nm) 1 | 2.77 | 3.22 | 3.16 | 3.22 |
| In-plane crystallite thickness (La) (nm) | 5.59 | 6.94 | 7.06 | 6.68 |
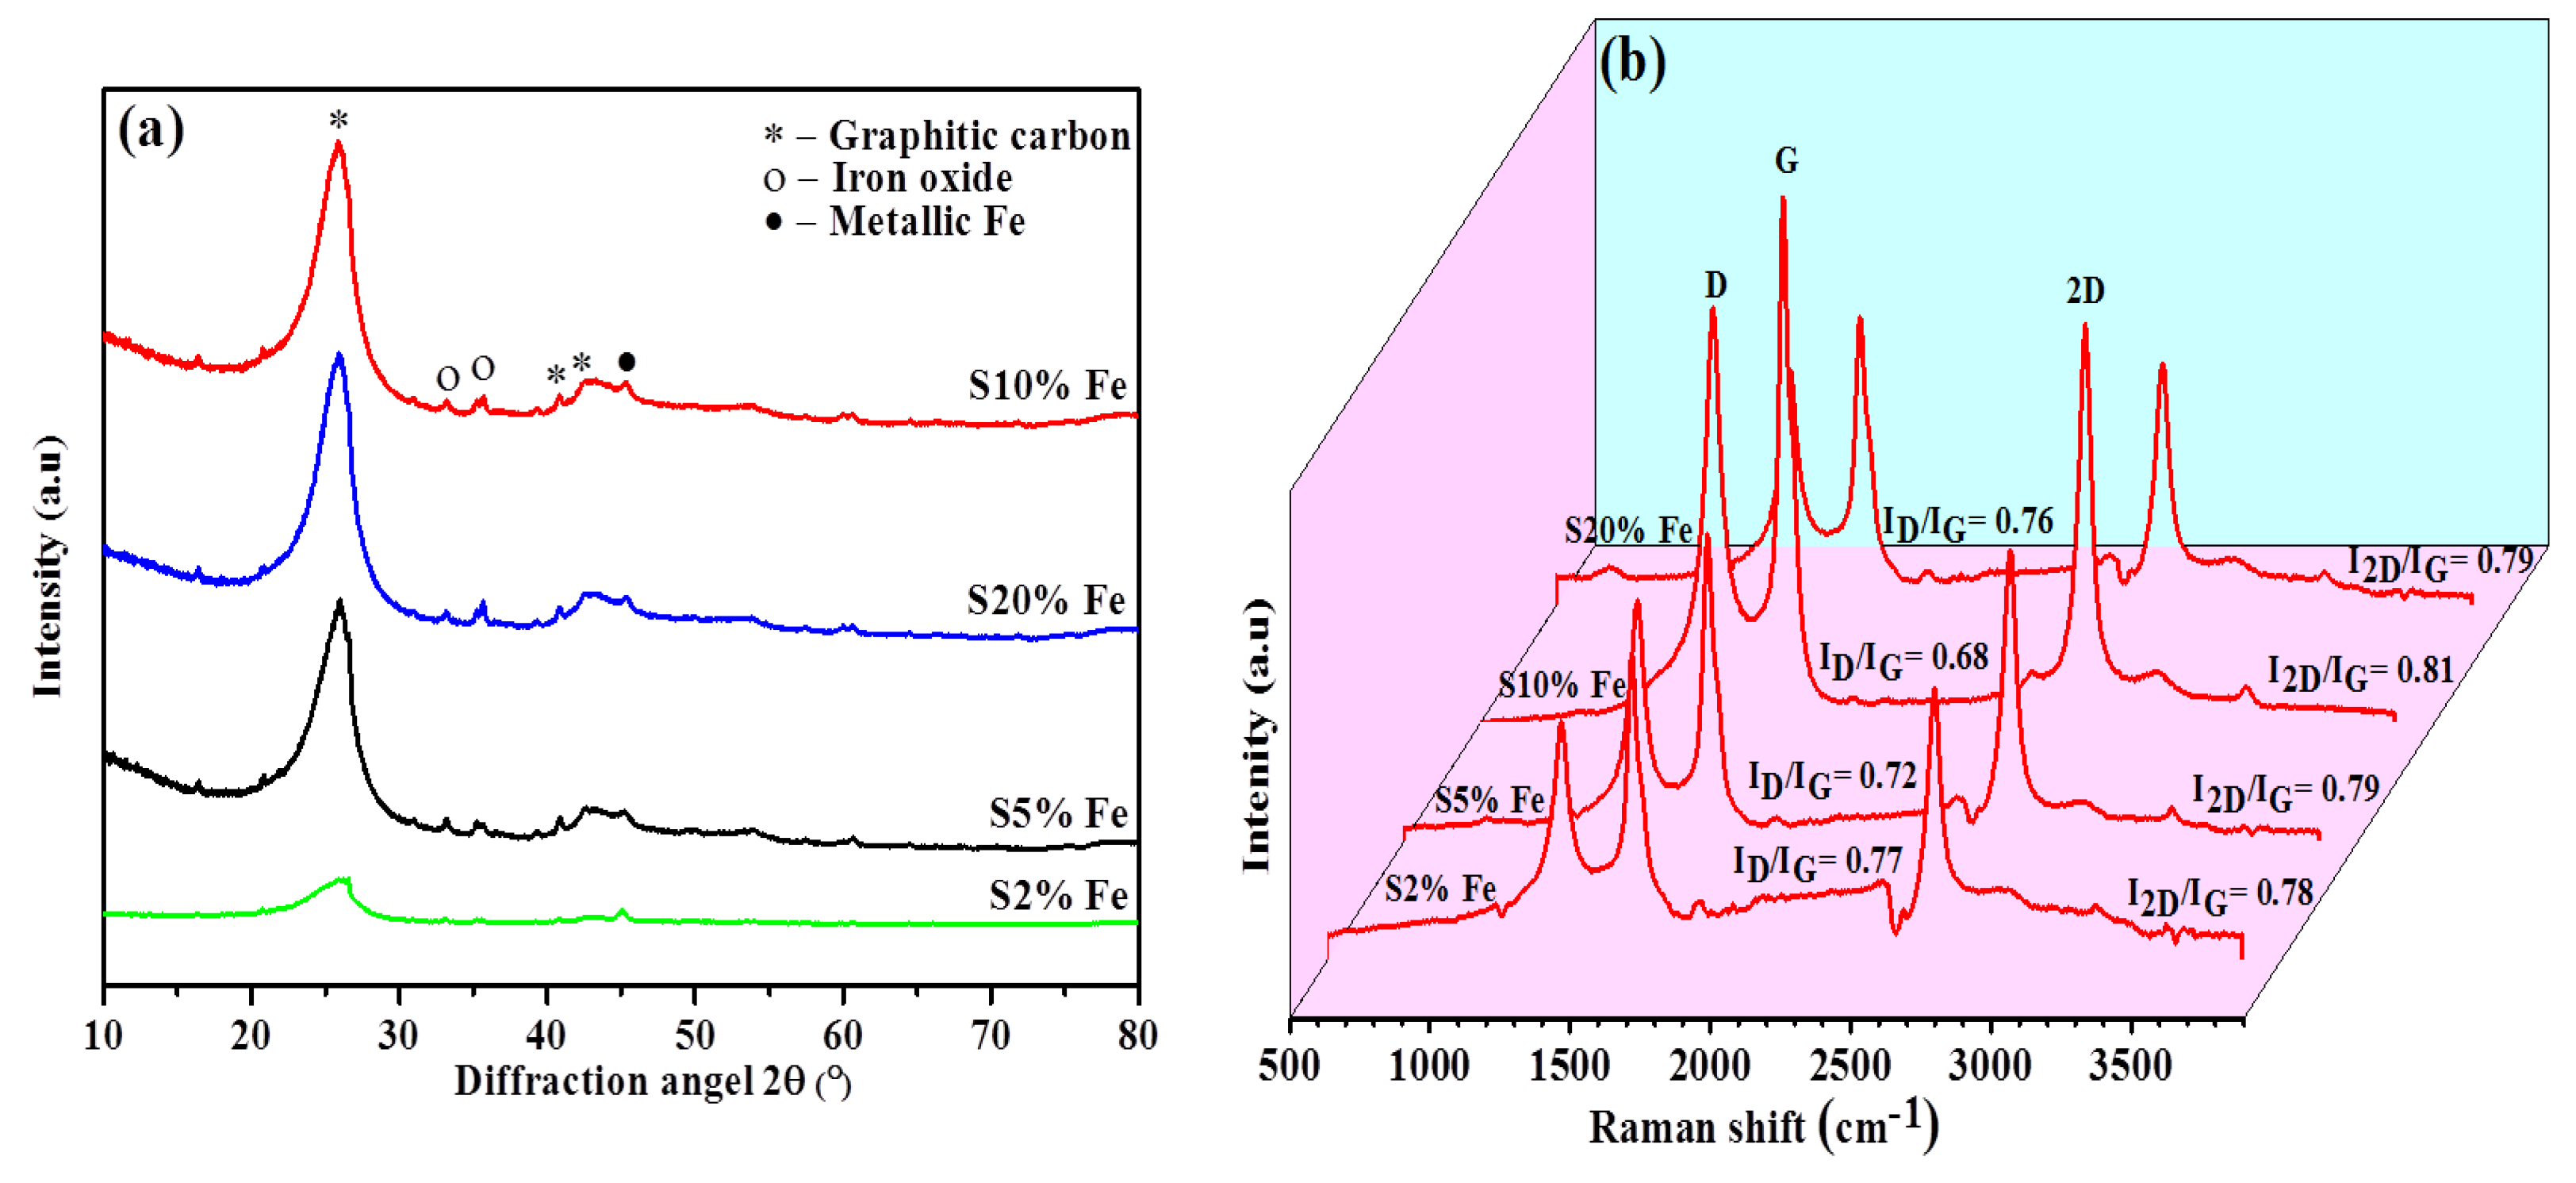
| ID/IG | 0.77 | 0.72 | 0.68 | 0.76 |
| I2D/IG | 0.78 | 0.79 | 0.81 | 0.79 |
| I2D/ID | 1.01 | 1.10 | 1.19 | 1.03 |
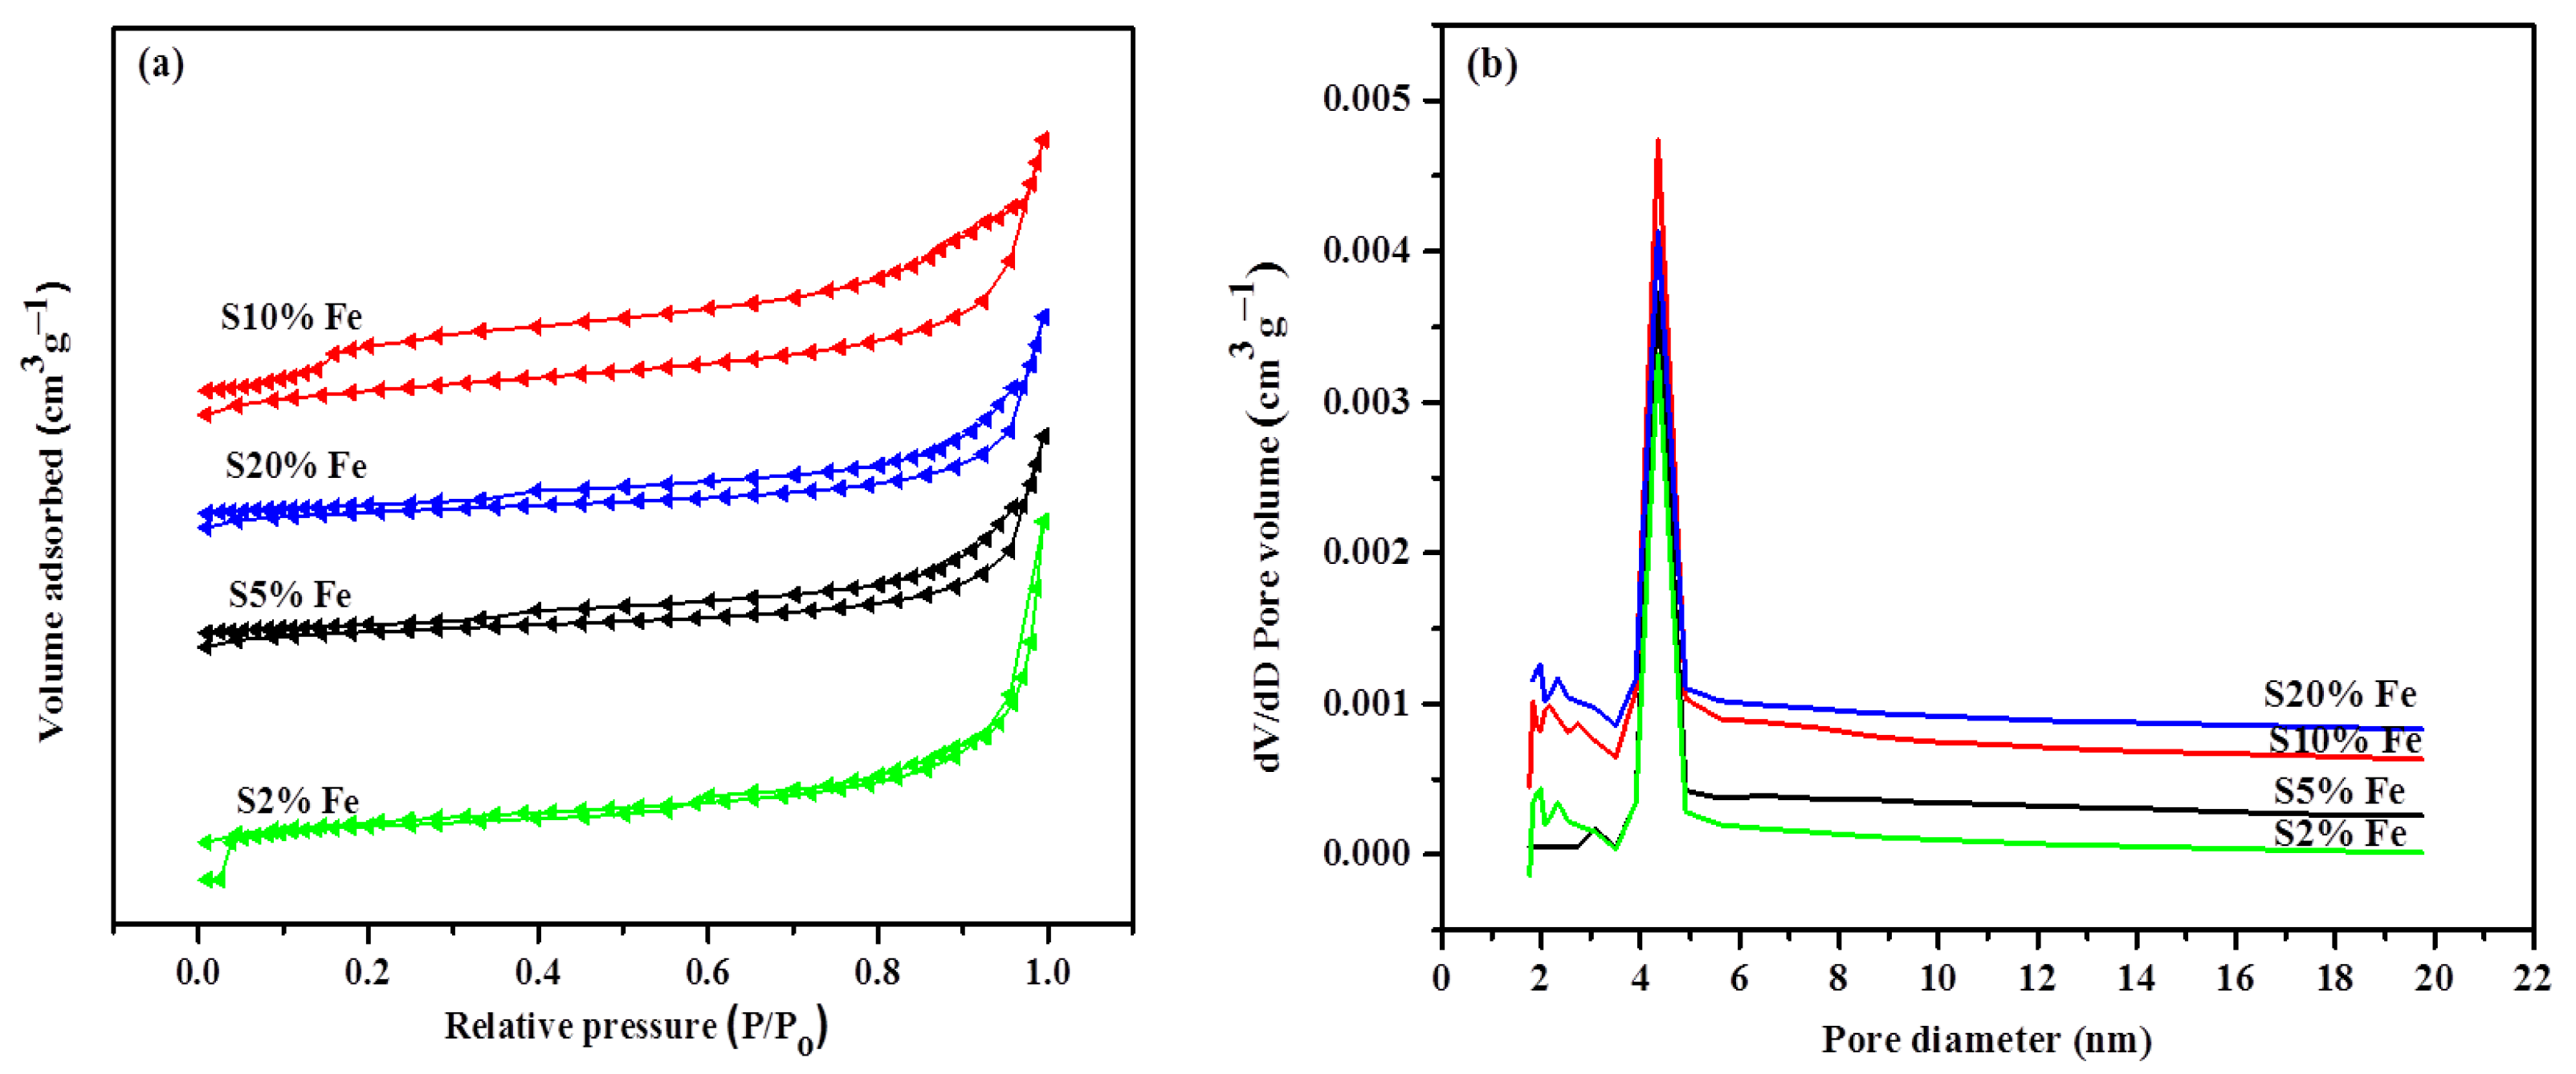
| Surface area (m2g−1) | 51.57 | 63.31 | 109.3 | 85.12 |
| g factor (%) 2 | 84.9 | 90.7 | 96.5 | 87.8 |
Publisher’s Note: MDPI stays neutral with regard to jurisdictional claims in published maps and institutional affiliations. |
© 2021 by the authors. Licensee MDPI, Basel, Switzerland. This article is an open access article distributed under the terms and conditions of the Creative Commons Attribution (CC BY) license (https://creativecommons.org/licenses/by/4.0/).
Share and Cite
Islam, F.; Tahmasebi, A.; Wang, R.; Yu, J. Structure of Coal-Derived Metal-Supported Few-Layer Graphene Composite Materials Synthesized Using a Microwave-Assisted Catalytic Graphitization Process. Nanomaterials 2021, 11, 1672. https://doi.org/10.3390/nano11071672
Islam F, Tahmasebi A, Wang R, Yu J. Structure of Coal-Derived Metal-Supported Few-Layer Graphene Composite Materials Synthesized Using a Microwave-Assisted Catalytic Graphitization Process. Nanomaterials. 2021; 11(7):1672. https://doi.org/10.3390/nano11071672
Chicago/Turabian StyleIslam, Faridul, Arash Tahmasebi, Rou Wang, and Jianglong Yu. 2021. "Structure of Coal-Derived Metal-Supported Few-Layer Graphene Composite Materials Synthesized Using a Microwave-Assisted Catalytic Graphitization Process" Nanomaterials 11, no. 7: 1672. https://doi.org/10.3390/nano11071672
APA StyleIslam, F., Tahmasebi, A., Wang, R., & Yu, J. (2021). Structure of Coal-Derived Metal-Supported Few-Layer Graphene Composite Materials Synthesized Using a Microwave-Assisted Catalytic Graphitization Process. Nanomaterials, 11(7), 1672. https://doi.org/10.3390/nano11071672