Article

Optical Constants and Structural Properties of Epitaxial MoS2 Monolayers

by
Georgy A. Ermolaev
1,
Marwa A. El-Sayed
1,2,
Dmitry I. Yakubovsky
1,
Kirill V. Voronin
1,3,
Roman I. Romanov
4,
Mikhail K. Tatmyshevskiy
1,
Natalia V. Doroshina
1,
Anton B. Nemtsov
1,
Artem A. Voronov
1,
Sergey M. Novikov
1,
Andrey M. Markeev
1,
Gleb I. Tselikov
1,
Andrey A. Vyshnevyy
1,
Aleksey V. Arsenin
1,5 and
Valentyn S. Volkov
1,5,*
1
Center for Photonics and 2D Materials, Moscow Institute of Physics and Technology, 9 Institutsky Lane, 141700 Dolgoprudny, Russia
2
Department of Physics, Faculty of Science, Menoufia University, Shebin El-Koom 32511, Egypt
3
Skolkovo Institute of Science and Technology, 3 Nobel Street, 143026 Moscow, Russia
4
Moscow Engineering Physics Institute, National Research Nuclear University MEPhI, 31 Kashirskoe Sh., 115409 Moscow, Russia
5
GrapheneTek, Skolkovo Innovation Center, 143026 Moscow, Russia
*
Author to whom correspondence should be addressed.
Nanomaterials 2021, 11(6), 1411; https://doi.org/10.3390/nano11061411
Submission received: 3 May 2021 / Revised: 23 May 2021 / Accepted: 25 May 2021 / Published: 27 May 2021

Abstract

:
Two-dimensional layers of transition-metal dichalcogenides (TMDs) have been widely studied owing to their exciting potential for applications in advanced electronic and optoelectronic devices. Typically, monolayers of TMDs are produced either by mechanical exfoliation or chemical vapor deposition (CVD). While the former produces high-quality flakes with a size limited to a few micrometers, the latter gives large-area layers but with a nonuniform surface resulting from multiple defects and randomly oriented domains. The use of epitaxy growth can produce continuous, crystalline and uniform films with fewer defects. Here, we present a comprehensive study of the optical and structural properties of a single layer of MoS2 synthesized by molecular beam epitaxy (MBE) on a sapphire substrate. For optical characterization, we performed spectroscopic ellipsometry over a broad spectral range (from 250 to 1700 nm) under variable incident angles. The structural quality was assessed by optical microscopy, atomic force microscopy, scanning electron microscopy, and Raman spectroscopy through which we were able to confirm that our sample contains a single-atomic layer of MoS2 with a low number of defects. Raman and photoluminescence spectroscopies revealed that MBE-synthesized MoS2 layers exhibit a two-times higher quantum yield of photoluminescence along with lower photobleaching compared to CVD-grown MoS2, thus making it an attractive candidate for photonic applications.

1. Introduction

The discovery of graphene as the first known 2D material [1] has generated a great momentum for research in nanoelectronics and nanophotonics based on low-dimensional materials [2,3,4,5]. Great efforts have been devoted to expanding the range of available materials. As a result, a new “periodic table” of 2D materials has been created, which comprises groups of transition metal chalcogenides (MXn) [6,7], hexagonal boron nitride [8], monatomic materials, such as silicene, germanene, phosphorene, borophene [9,10,11,12], and a family of MXenes [13,14].
The family of transition metal dichalcogenides (TMDs) was widely recognized for the diversity of their electronic properties, encompassing superconductors [15], conductors [16,17], and semiconductors [18,19]. In addition to this vast diversity, materials can be stacked on each other, thus forming van der Waals heterostructures [19] and attaining novel properties. Furthermore, even monolayers of the same material can change their properties drastically when stacked to form twisted bilayers [20]. Thus, the use of TMDs allows one to design a large number of electronic, nanophotonic, mechanical, and thermal devices based only on 2D materials [6,21,22,23,24], making them inherently flexible and easy to use.
MoS2 is a prominent representative of TMD semiconductors. When thinned down to a single atomic layer, it undergoes a transition from an indirect to a direct bandgap semiconductor [25], which is crucial for photonic applications as the radiative quantum yield drastically increases upon such transition [26]. In practice, monolayers of MoS2 are typically obtained either via exfoliation or chemical vapor deposition (CVD). Both methods have serious drawbacks. Although exfoliated flakes have excellent structural and optical properties, their size is limited by a few microns, which hinders their commercial applications. CVD MoS2 films overcome the size limitation, but at a price of decreased quality, both structural and optical. Recently, epitaxially grown films of TMDs [27], including MoS2 [28], with a thickness down to a single atomic layer, have become available. Molecular beam epitaxy is a mature technology for the production of atomically smooth monocrystalline thin semiconductor films [29]; therefore, it has the potential to overcome size and quality limitations of exfoliation and CVD, respectively. At the same time, while the properties of CVD MoS2 monolayers have been studied previously [30,31,32,33,34], little is known about the optical properties of available MBE-grown MoS2 monolayers. Although recent works [27,35,36] report optical and electronic properties of MBE TMDs close to the exfoliated one, their epitaxial samples has at a maximum 200 μm lateral size, which is insufficient for the majority of applications [2,3,4,5]. To resolve this limitation, we focused on a large-scale MBE MoS2, which covers more than 97% of the substrate surface.
Here we present a comprehensive study of the optical and structural properties of a MoS2 monolayer grown by MBE on a sapphire substrate. Optical properties were measured by spectroscopic ellipsometry (SE) in a broad spectral range from 250 to 1700 nm. Using the Accurion EP4 imaging ellipsometer, which is capable of collecting the signal from a small micrometer-scaled area, we have measured optical constants of epitaxially grown monolayer MoS2, and compared them with the available data of CVD-grown and exfoliated monolayer MoS2 [37,38]. The structural properties of MoS2 samples were assessed in a combined study comprising optical microscopy, scanning electron microscopy (SEM), atomic force microscopy (AFM), X-ray photoemission spectroscopy (XPS), Raman spectroscopy, and photoluminescence imaging. We find that MBE produces a polycrystalline monolayer film with a high crystallinity whose quantum yield of luminescence is higher than that of the CVD monolayers of MoS2.

2. Results and Discussion

2.1. Sample Preparation and Characterization

Monolayers of MoS2 were prepared through molecular beam epitaxy as schematically shown in Figure 1a. Before measurement, MoS2 samples were washed and annealed in a vacuum chamber to remove any contaminants. The measured samples were uniform and high-crystalline as confirmed by images from optical, scanning electron microscopy (SEM), and atomic force microscopy (AFM) shown in Figure 1b–e. The epitaxial MoS2 monolayer uniformly covers the double polished sapphire substrate with an average crystallite size of 6  μm, confirming the high quality of the samples [39]. Next, we validated that grown MoS2 is atomically thin using AFM. The measured topography in Figure 1f yields 0.9  nm for film thickness, which is consistent with the previous results for monolayer MoS2 [23,40,41,42,43].
We carried out a detailed comparison of photoluminescence and Raman spectra for epitaxial and CVD-grown MoS2 monolayers for further investigation of the samples’ quality. Photoluminescence (PL) of the CVD and epitaxial monolayer MoS2 grown on sapphire substrates are presented in Figure 2a. PL was excited resonantly at 632.8 nm. Each spectrum was deconvoluted into two Gaussian peaks with maxima at about 1.87 and 1.8 eV in the case of CVD-grown MoS2 and 1.85 and 1.78 eV in MBE-synthetized MoS2. The first peak A corresponds to the radiative excitonic recombination while the microscopic origin of the second peak remains a disputable topic. Earlier works attribute it to negatively charged trions [44,45] related to n-type conductivity, while a more recent work [46] argues that it stems from the recombination of bound excitons formed on either the unintended impurities or the native point defects. Regardless of the PL mechanism (bound excitons or trions) of the peak, in both cases it comes from structural defects of the sample, since inherent n-type conductivity can originate only from defects [47] or donor impurities. Hence, the defect’s contribution into PL spectrum is 14% for epitaxial MoS2 and 22% for CVD MoS2, thereby validating the lower density of structural defects in MBE MoS2. Moreover, A-exciton PL is almost two times brighter for MBE MoS2 compared to the CVD sample, as is clearly seen in Figure 2a. Additionally, PL from epitaxial MoS2 has a 0.025 eV red-shift in respect to the CVD sample, which implies that MBE MoS2 has a slightly different crystal structure. The non-resonant Raman scattering spectra of the CVD and the epitaxial monolayer MoS2 grown on sapphire substrates are presented in Figure 2b. The value of frequency difference between the A 1 g ( Γ ) and E 2 g 1 ( Γ ) modes equals 20 cm−1 for both samples. This value confirms the monolayer nature of both studied samples [48].
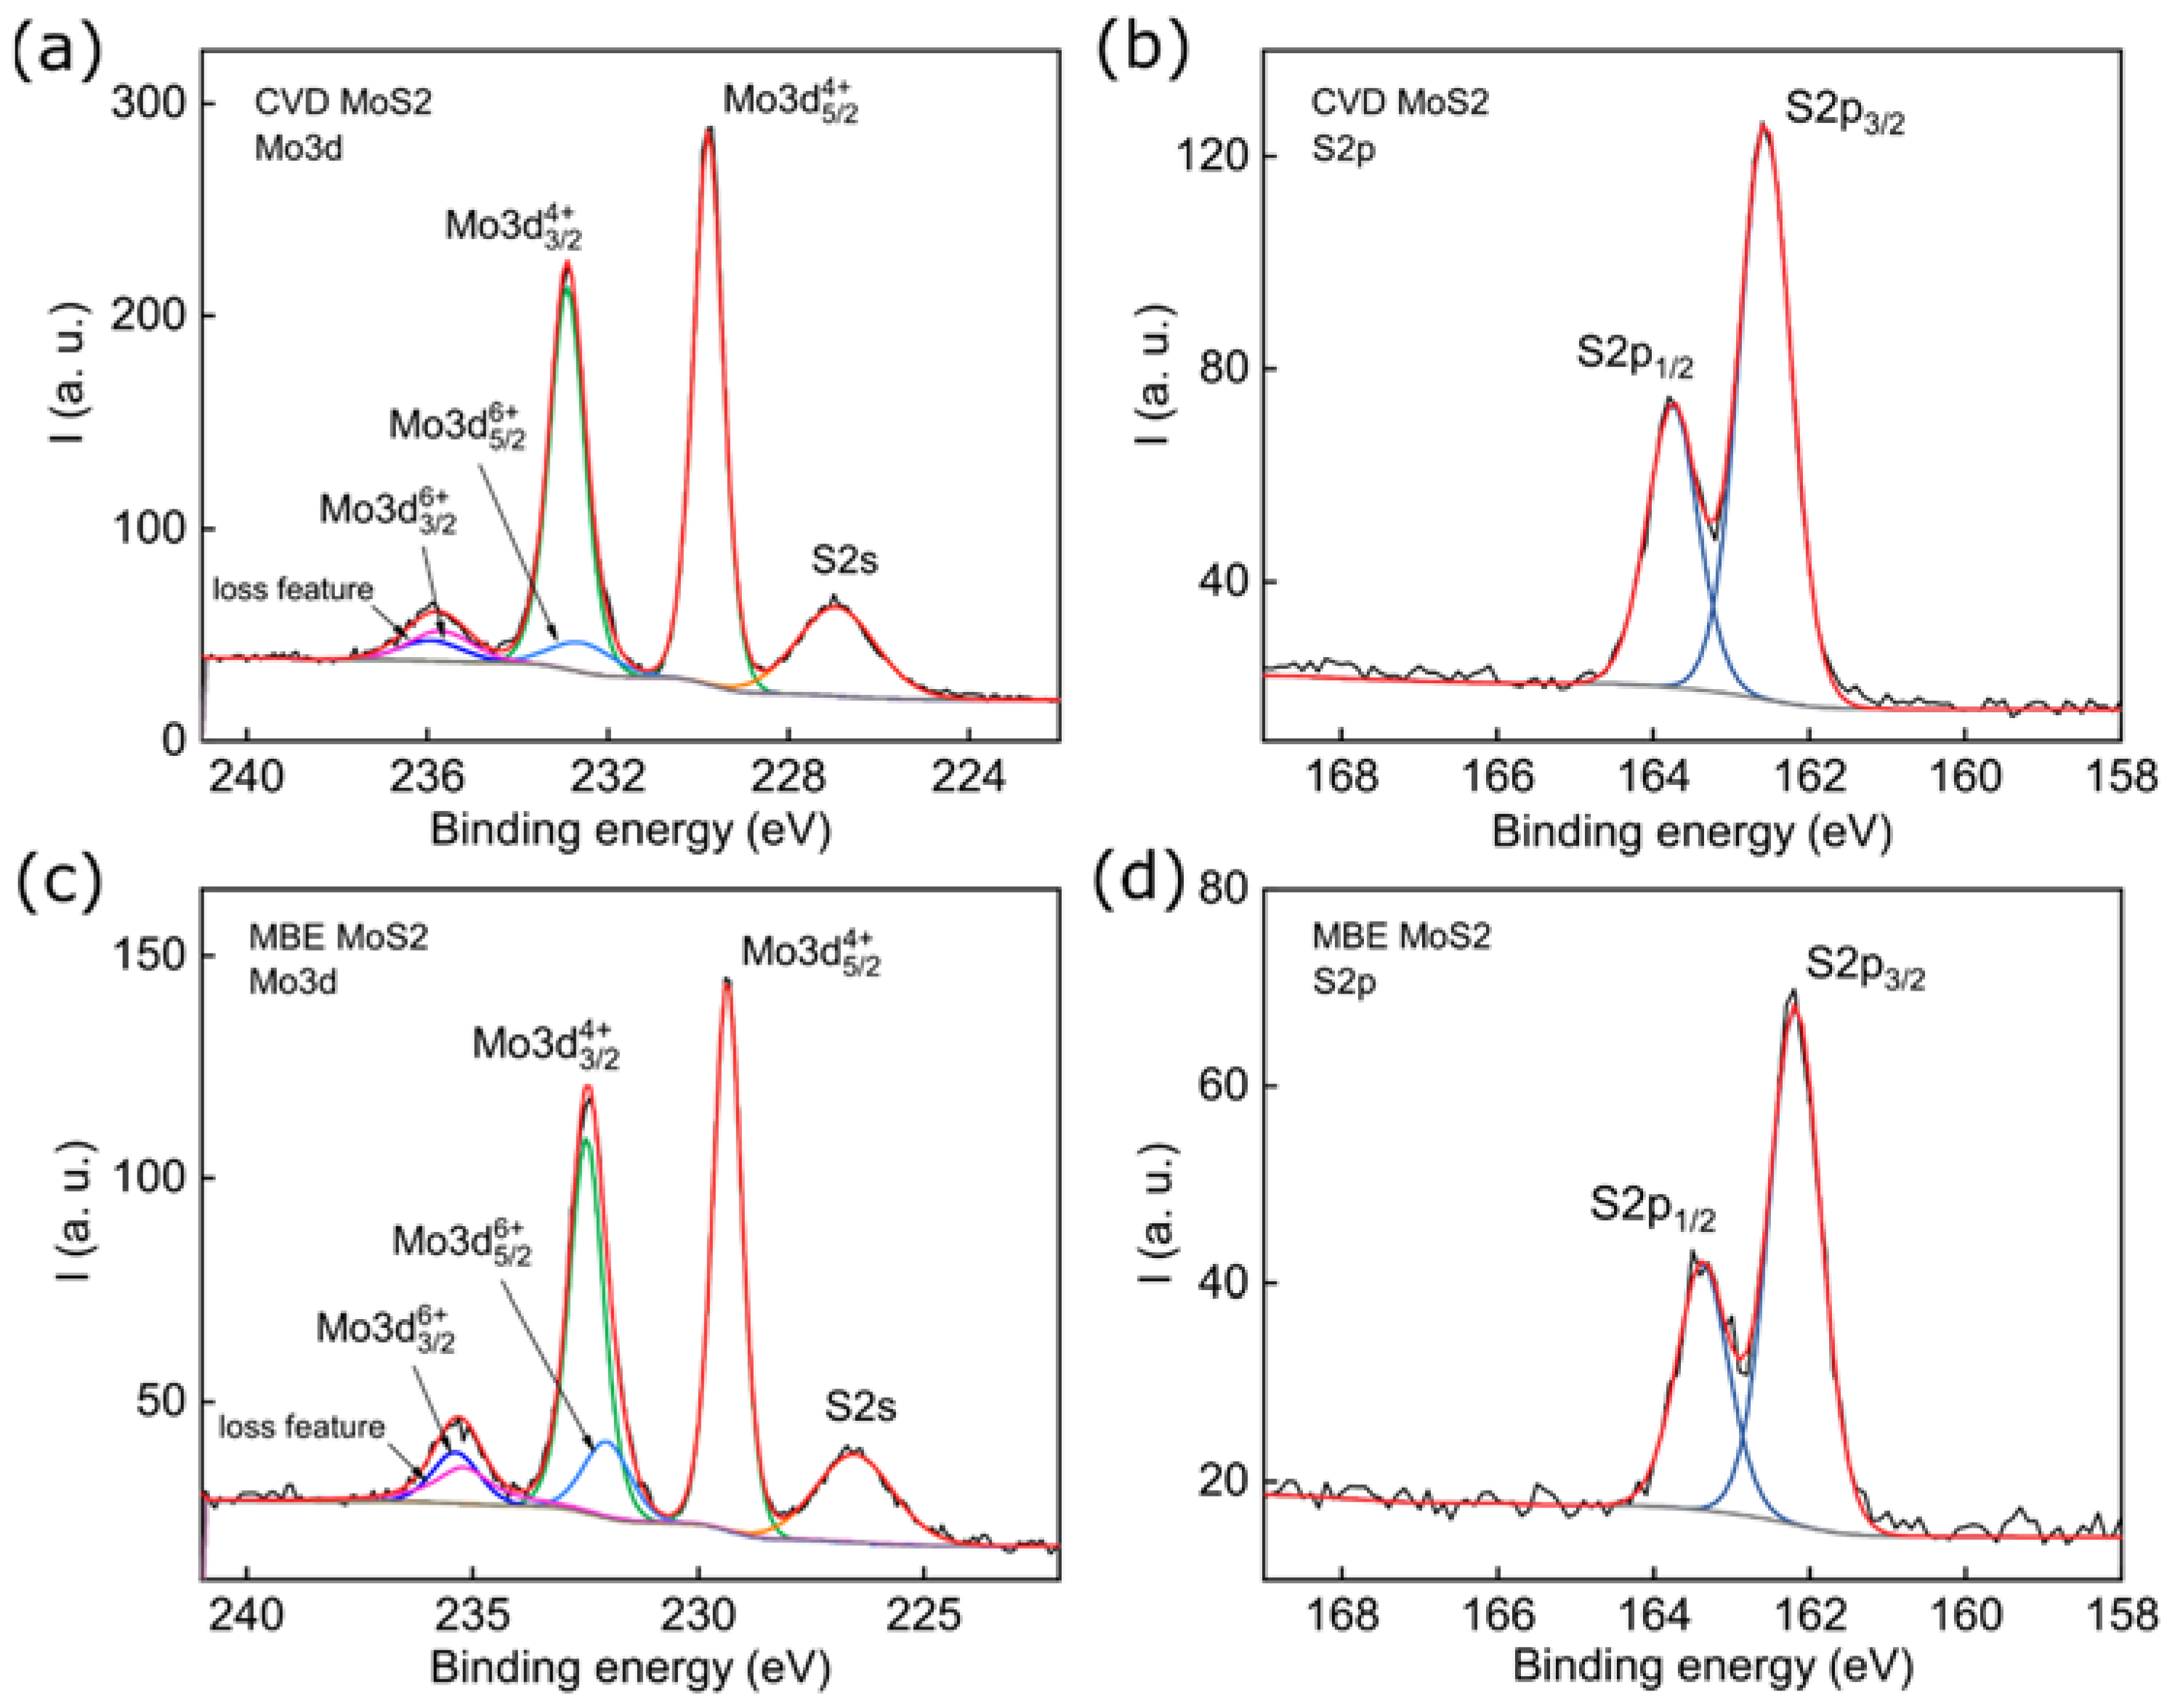
To assess the chemical purity of samples, we performed XPS measurements in Figure 3. A detailed study was performed in spectral ranges corresponding to bonds formed by Mo and S atoms. No impurities other than oxygen were found during XPS measurements.
The S2p spectra were described by a doublet with the S2p5/2 line position at 162.6 eV and a spin-orbit splitting of 1.2 eV for the CVD MoS2 sample and at 162.2 eV and the same spin-orbit splitting for the MBE MoS2 sample.
The Mo3d spectrum was decomposed of two doublets, with the more intense one corresponding to the Mo4+ state in the MoS2 compound. The less intense doublet corresponded to the Mo6+ state in the MoO3 compound. In addition, the S2s and “loss feature” lines were present in the spectra. The position of the Mo3d5/2 line for the CVD MoS2 and MBE MoS2 samples was 229.8 eV and 229.4 eV, respectively. The difference in the position of the lines could be caused by different levels of doping. The molybdenum fraction in the Mo6+ state for CVD MoS2 and MBE MoS2 samples was 0.10 and 0.18, respectively. The total atomic concentration ratio [S]/[Mo] for CVD MoS2 and MBE MoS2 samples was 1.8 and 1.7, respectively. No noticeable concentration of other impurities was observed in XPS measurements. The natural oxidation of single-layered MoS2 under ambient conditions has been previously reported [49] and the S vacancies are formed through oxidation spontaneously followed by an O substitution process since the oxidation is thermodynamically more favorable [50,51]. The results of XPS measurements indicate that the increased photoluminescence yield of MBE MoS2 might be due to the passivation of sulfur vacancies and crystallite boundaries by oxygen [52].

2.2. Dielectric Response Analysis

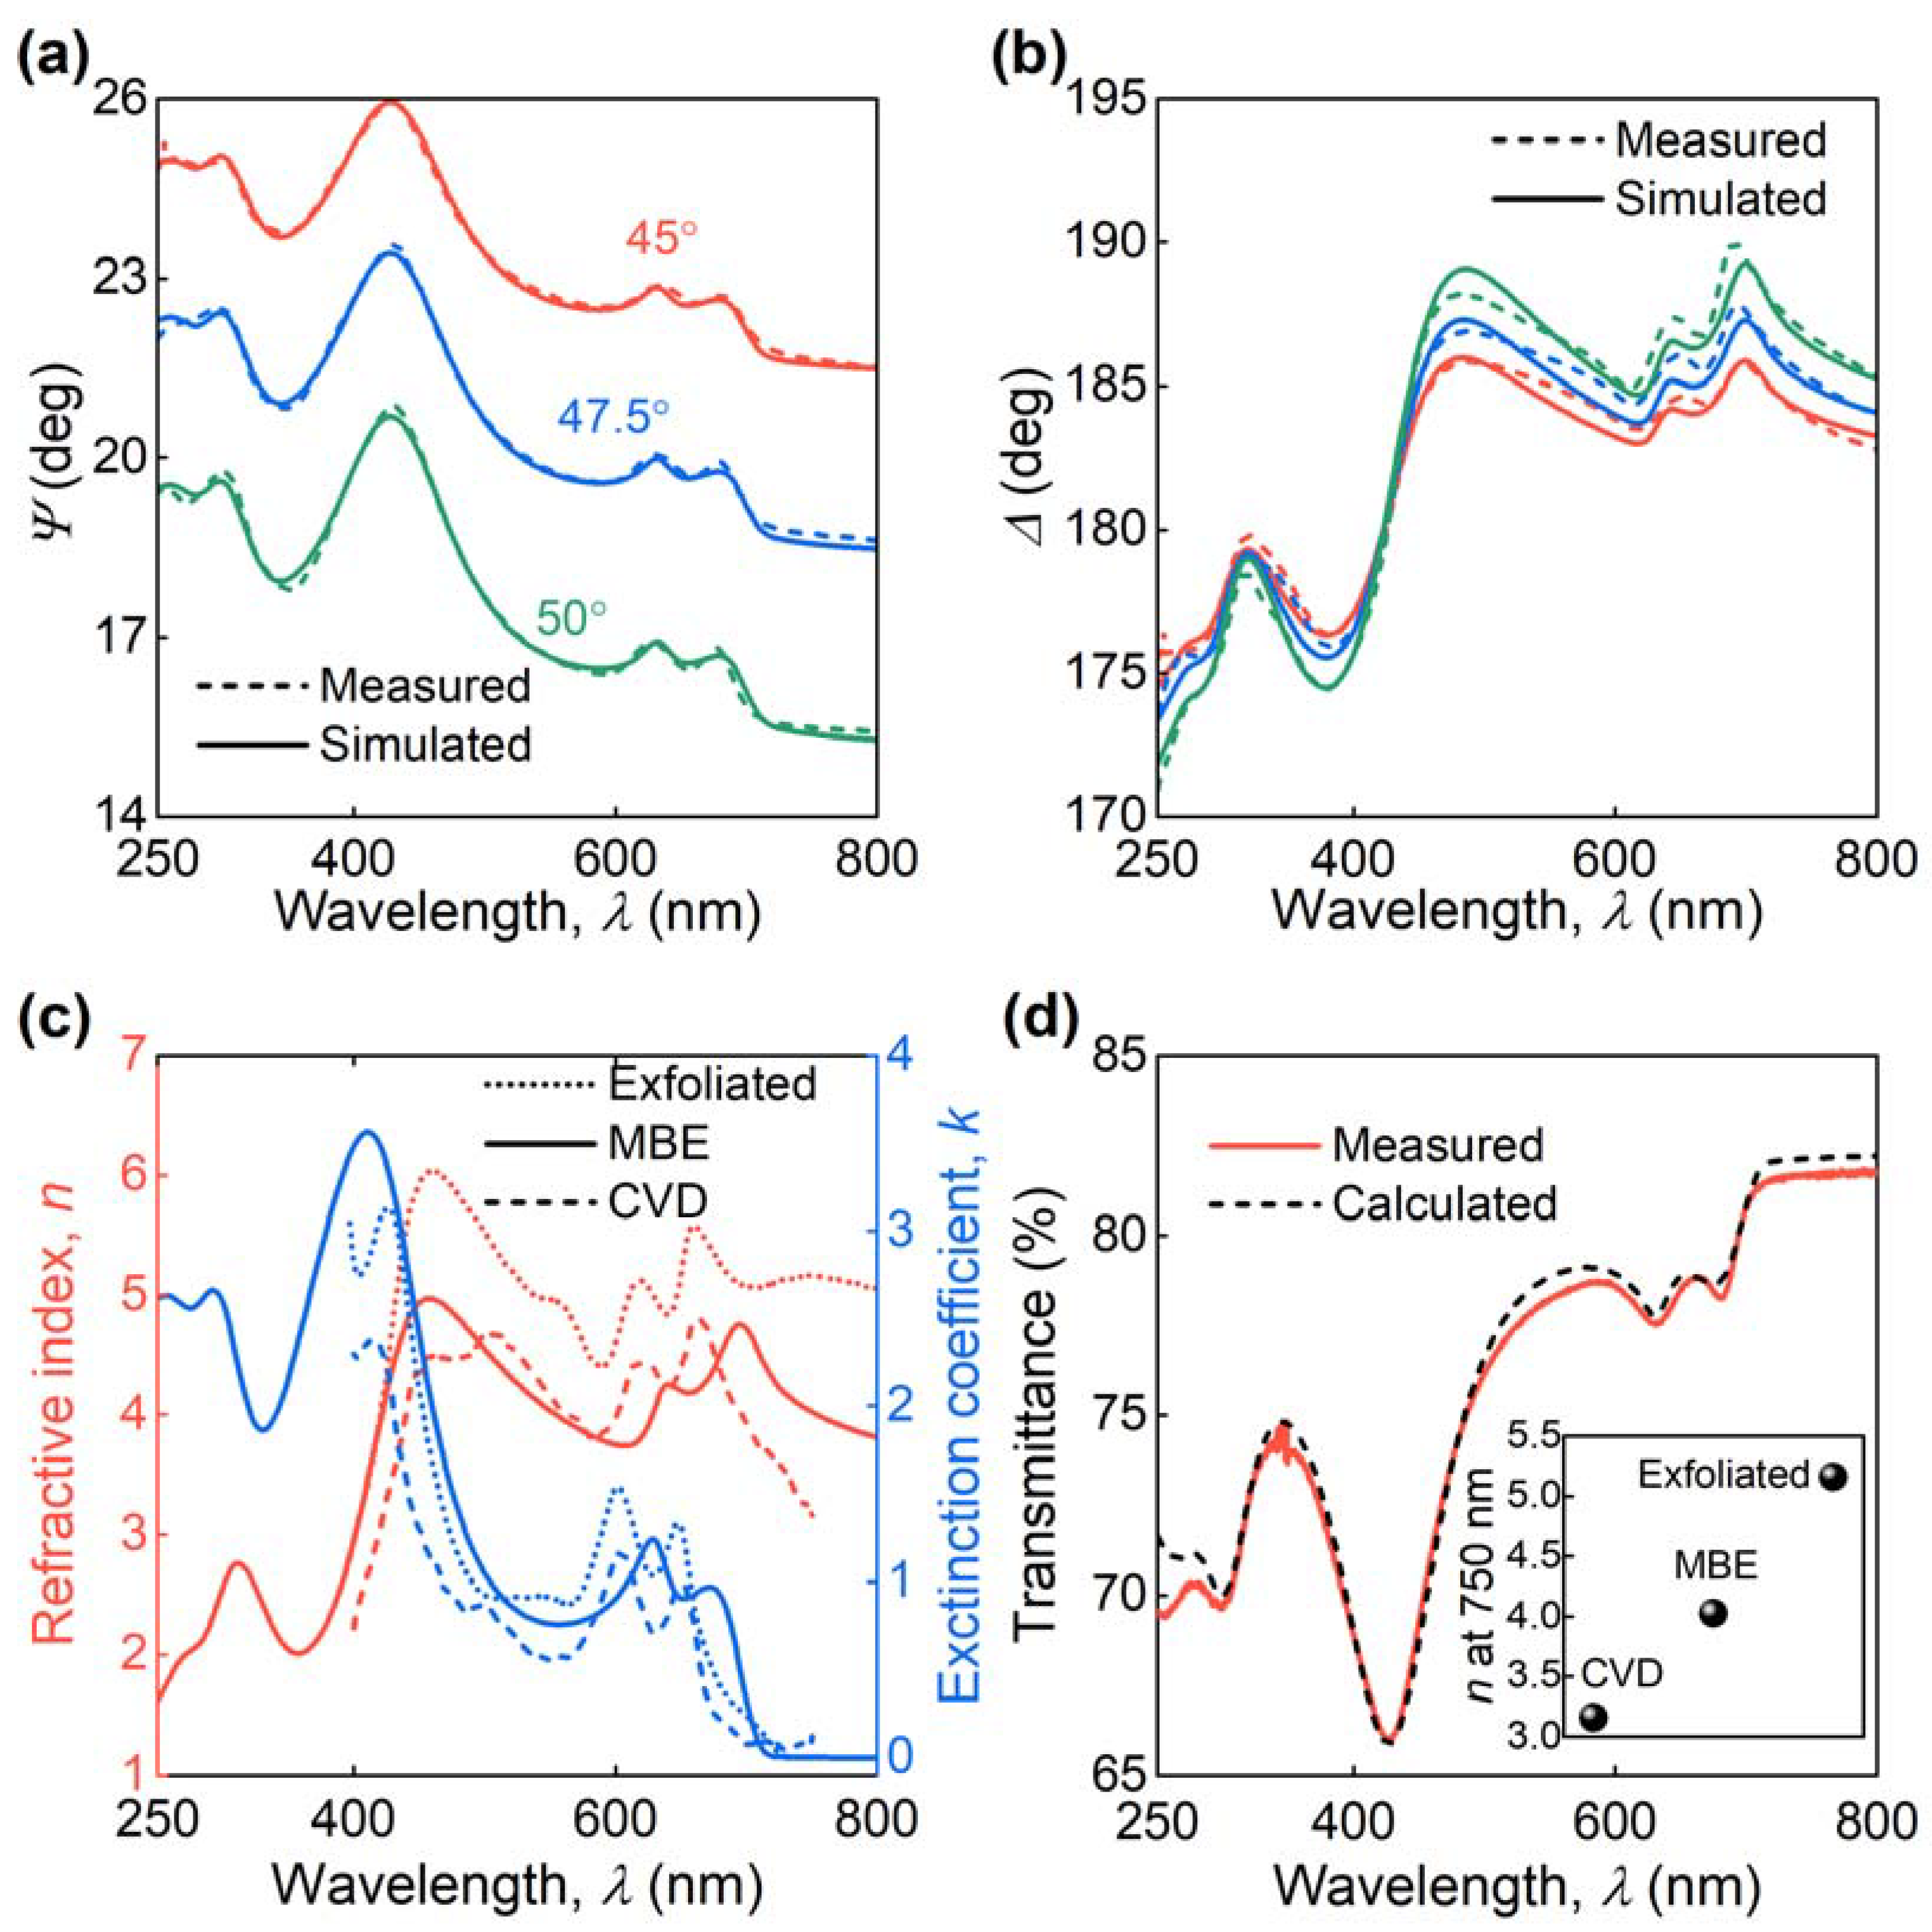
The dielectric response of MBE MoS2 was determined using spectroscopic ellipsometry (SE), and the resulting spectra are shown in Figure 4a,b. The ellipsometric parameter Ψ clearly reveals MoS2 excitonic features, which we described through the Tauc-Lorentz oscillator model [38] with their resulting parameters collected in Table 1. Figure 4c depicts the corresponding dielectric function. Notably, the optical bandgap of the MBE sample equals 1.718 eV, while for CVD MoS2 this value is 1.744 eV [39]. This red-shift (0.026 eV) of optical bandgap is in agreement with the PL result (0.025 eV) from Figure 2a. We also recorded transmission spectra and compared them to the transfer matrix calculations [53] to verify the extracted dielectric response in Figure 4c and confirm its predictive capability. The measured and calculated transmittance spectra plotted in Figure 4d match perfectly, thus validating our result in Figure 4c.
Interestingly, the optical constants of MBE MoS2 are intermediate between CVD and exfoliated MoS2, as illustrated in Figure 4c. For example, at λ = 750 nm the refractive index of CVD, MBE, and exfoliated MoS2 are 3.2, 4.0, and 5.2, respectively. Therefore, the MBE growth technique allows getting closer to superior properties of exfoliated MoS2, but at a large scale. It makes MBE MoS2 a promising platform for scientific and industrial photonic applications.
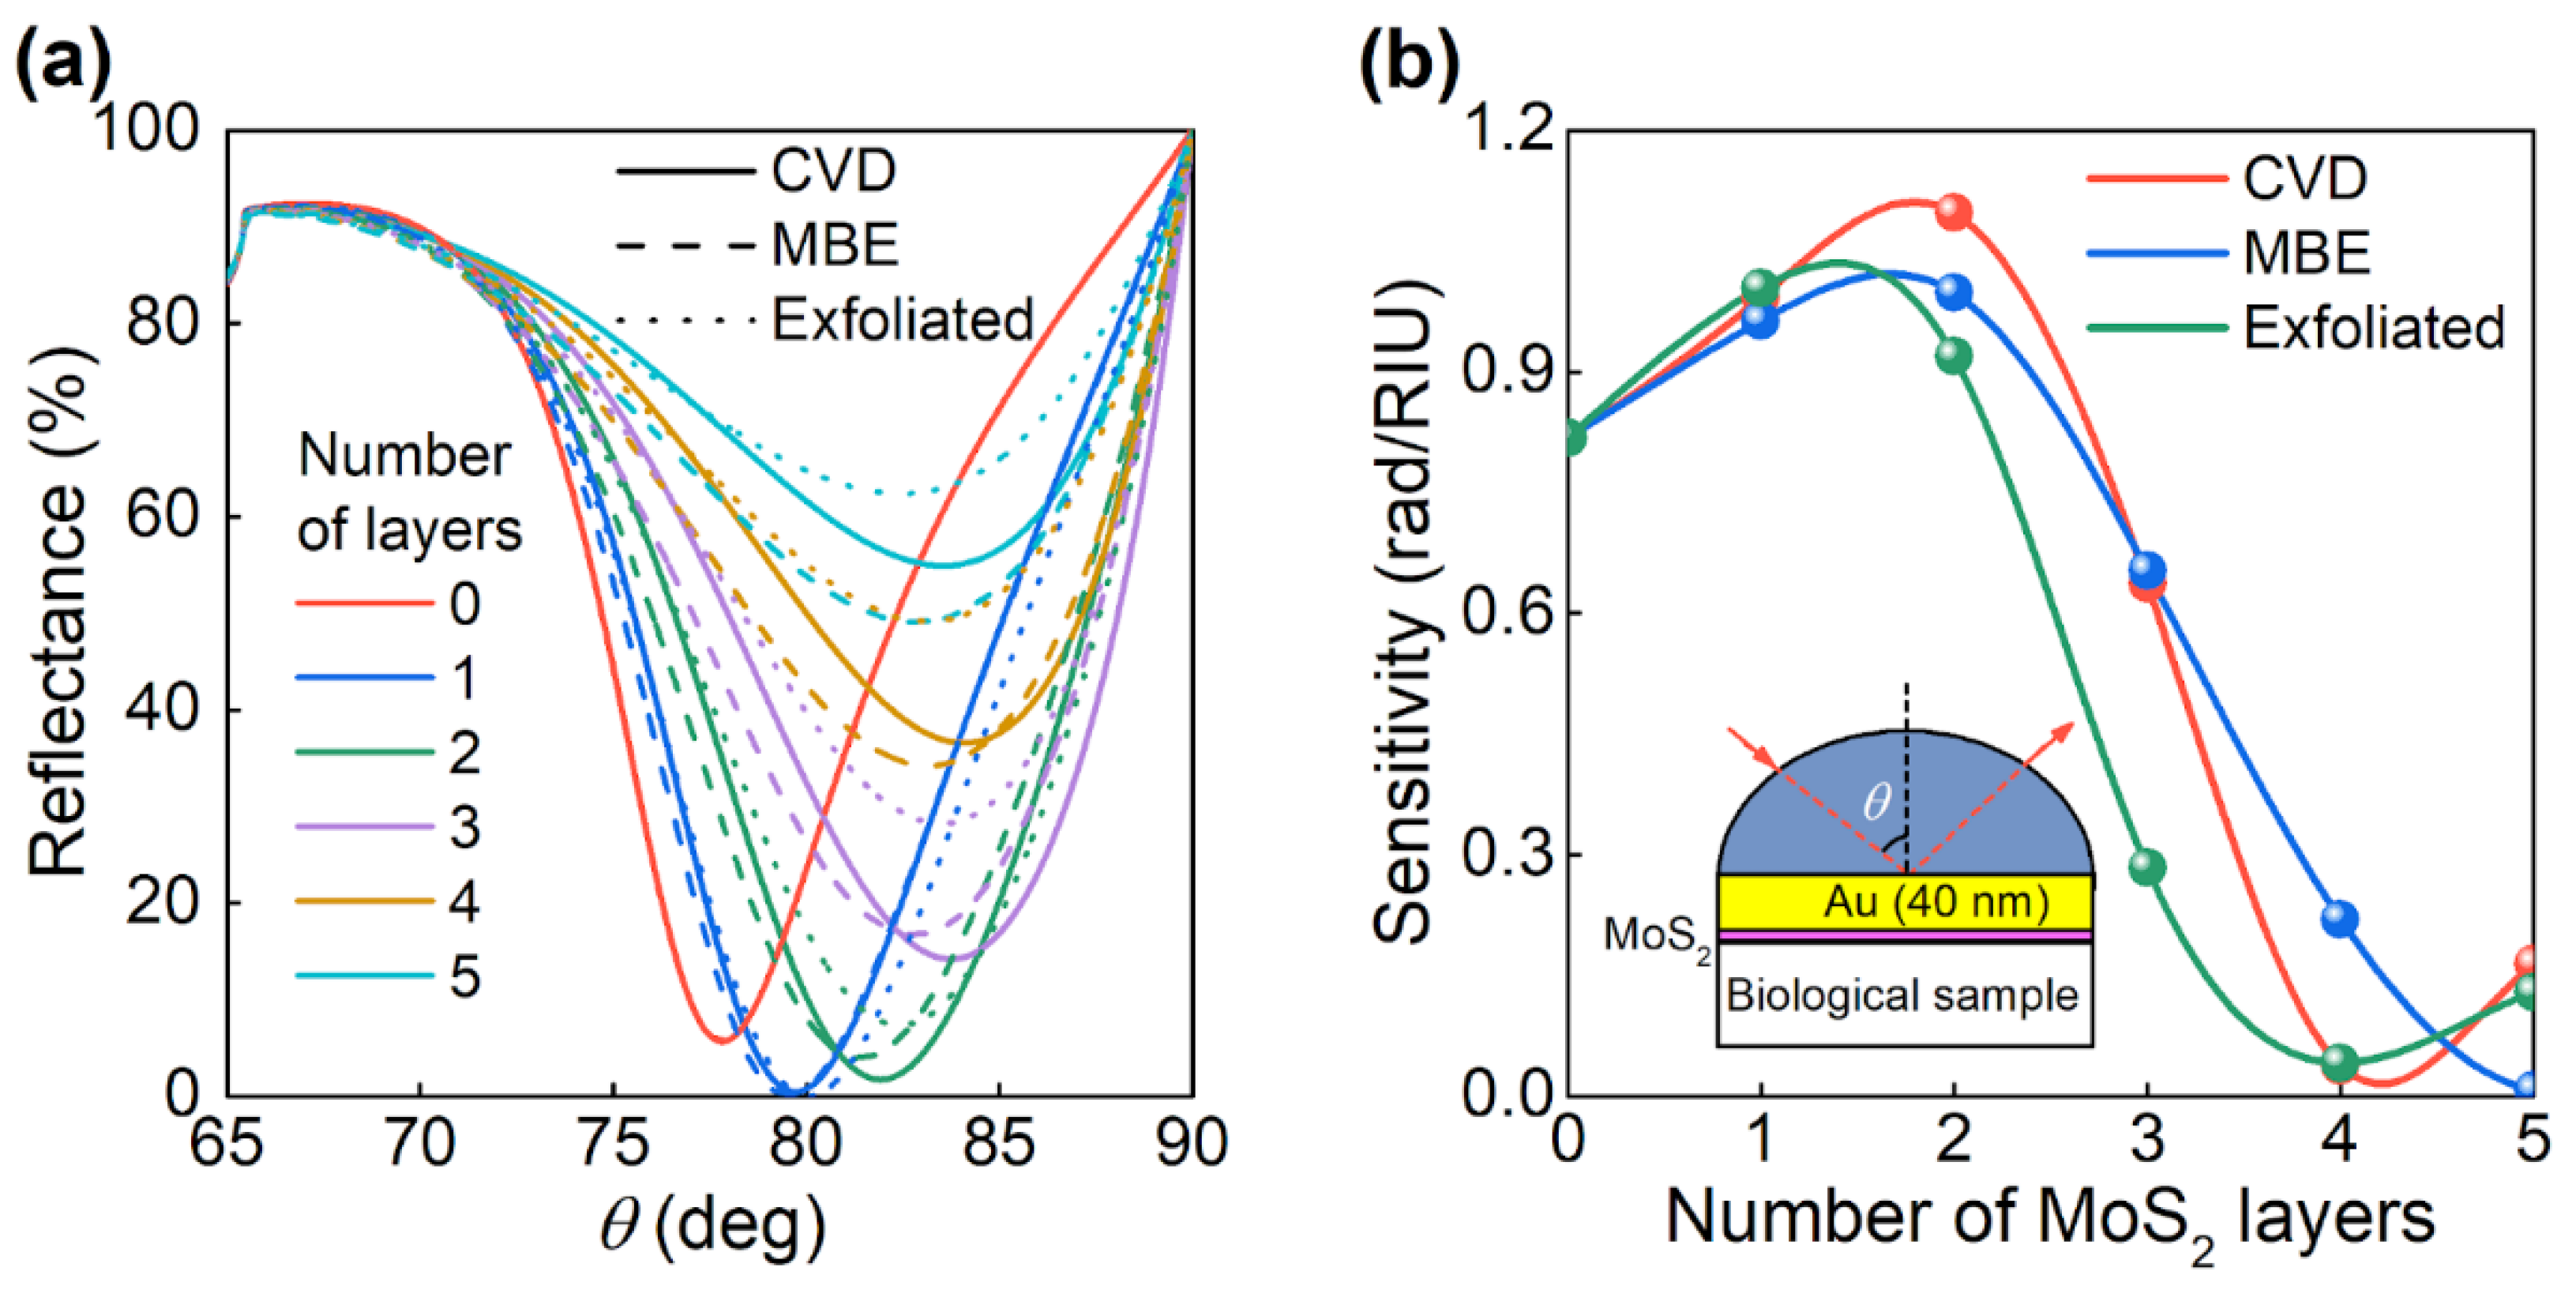
The difference in the optical properties of MBE-synthesized MoS2 films from films fabricated by other methods must be taken into account when developing optical devices, since the difference in optical constants entails differences in characteristics of the device. To illustrate this, we consider a biosensor based on surface plasmon resonance in the Kretschmann scheme [54], in which a thin gold film covers a silicon oxide prism, and the change in the refraction index is detected by measuring the change of the resonant angle, at which the reflection from the scheme is minimal. To increase the sensitivity and coupling with the studied molecules, several layers of van der Waals material, such as graphene, are often deposited on the gold surface [55,56]. The addition of layers of molybdenum disulfide also improves the sensitivity of the biosensor. Figure 5 shows the dependence of the reflection coefficient on the angle of incidence (Figure 5a) and the dependence of the biosensor sensitivity on the number of MoS2 layers (Figure 5b). The calculations were performed for a wavelength of 635 nm, which is often used in optical biosensors, with a gold thickness of 40 nm. It turns out that even for a couple of MoS2 layers, both the dependence of the reflection coefficient on the angle of incidence and the sensitivity of the biosensor differ by more than 10% for MoS2 films obtained by different methods. As a result, fabrication technology provides an efficient way to control the dielectric function of MoS2, and hence, a method to tailor the optical response in photonic applications.

3. Materials and Methods

3.1. Materials

Isolated triangles with some full coverage areas of epitaxial MoS2 monolayer samples were purchased from 2d Semiconductors, Inc. (https://www.2dsemiconductors.com/ (accessed on 25 May 2021), Scottsdale, AZ, USA). Samples were grown in an MBE chamber at a base pressure of 8 × 10⁻⁹ Torr on a double-side polished c-cut sapphire. An extremely slow deposition rate of 5–100 atoms per second provides a single-crystal quality film deposition with a high crystallinity and reduced defect density. CVD-grown full area coverage monolayer MoS2 samples purchased from the SixCarbon Technology (http://www.6carbon.com/ (accessed on 25 May 2021), Shenzhen, China) were synthesized with atmospheric pressure chemical vapor deposition also on double-side polished c-cut sapphire.

3.2. Raman and Photoluminescence Characterization

The experimental setup used for Raman measurements was a confocal scanning Raman microscope Horiba LabRAM HR Evolution (HORIBA Ltd., Kyoto, Japan). All measurements were carried out using linearly polarized excitation at wavelengths 532 and 632.8 nm, 1800 lines/mm diffraction grating, and ×100 objective with a numerical aperture of 0.9. Meanwhile, we used unpolarized detection to have a significant signal-to-noise ratio. The spot size was ~0.43 µm. The Raman spectra were recorded with 0.75 mW (wavelength 632.8 nm) and 1.5 mW (wavelength 532 nm) incident power and an integration time of 3 s at each point. To compare CVD and epitaxial MoS2 PL response, we normalized PL spectra to A1g(Γ) Raman peak since they recorded simultaneously. The statistics were collected with at least 15 points for each sample, and the observed variation of the intensity for the spectra was less than 5%.

3.3. X-ray Photoemission Spectroscopy Characterization

For the detailed study of the CVD and epitaxial MoS2 monolayers grown on sapphire substrates, we performed measurements of the Mo3d and S2p5/2 level X-ray photoemission spectroscopy (XPS) spectra to reveal the difference in the elemental composition of two samples (Thermo Scientific K-Alpha, Waltham, MA, USA). Since the MoS2 samples on sapphire substrates were charged during the XPS measurements, the charge-compensation mode was used. The calibration was performed using the C1s line position at 284.5 eV.

3.4. Atomic Force Microscopy, Optical Visualization, Scanning Electron Microscopy

The roughness and homogeneity of the epitaxial MoS2 monolayer were measured by an atomic force microscope (NT-MDT Ntegra, Moscow, Russia). The MoS2 MBE fabricated sample was characterized immediately after unsealing without any pollution at ambient conditions, and thus these defects demonstrated in AFM and SEM in Figure 1d–f are the result of an MBE fabrication procedure. These defects might be Mo nucleation sites. The surface images (2400 × 2400 pixels) of the MoS2 samples were captured by an optical microscope (Nikon LV150, Tokyo, Japan) with a digital camera DS-Fi3. To investigate the MoS2 surface morphology, we additionally used the scanning electron microscope using the acceleration voltage of 3 kV (JEOL JSM-7001F, Tokyo, Japan).

3.5. Ellipsometry Characterization

Spectroscopic ellipsometry was conducted at several incident angles (45°, 47.5°, 50°) over a wide spectral range of 250 to 1700 nm (0.73–4.96 eV). An imaging ellipsometer in the rotation compensator mode was used for the measurements (Accurion nanofilm_ep4, Goettingen, Germany). We used the Tauc-Lorentz oscillator oscillator model for ellipsometry spectra analysis following the analysis algorithm developed by Ermolaev and colleagues [39,40]. The Tauc-Lorentz oscillator model is defined as:
ε 2 = { 1 E · A E 0 C ( E E g ) 2 ( E 2 E 0 2 ) 2 + C 2 E 2   for   E > E g 0   for   E < E g ,
where E is the photon energy, A is the strength of the oscillator, C is the broadening term, Eg is the optical band gap, and E0 is the peak central energy. The real part ε1 of the dielectric function is derived from the expression of imaginary part ε2 of the dielectric function using the Kramers–Kronig integration.

4. Conclusions

To summarize, we have performed a detailed study of the structural and optical properties of monolayer MoS2 synthesized by MBE. We verified that the sample indeed contains a single-atomic layer of MoS2 through Raman and AFM measurements, while XPS measurements confirmed its high purity. The high crystallinity of the sample with a characteristic crystallite size of 6 μm was revealed by SEM, AFM imaging and dark-field microscopy. The quantum yield of MBE MoS2 by almost two times exceeds that of CVD MoS2, as demonstrated by PL measurements, which proves its superior quallities for active photonic applications. Finally, we have conducted accurate measurements of optical constants of MBE MoS2 by spectroscopic ellipsometry. The accuracy of the optical properties has been further verified by the measurement of the optical transmittance spectrum, which fully agrees with calculations based on the optical constants acquired by ellipsometry. Additionally, we demonstrated the significance of our accurate measurements for practical applications by comparing characteristics of SPR sensors calculated using the different constants. Even devices with only a few atomic layers of MoS2 demonstrate substantial differences in sensitivity and anticipated signal intensity when different sources of optical properties are used. Our results create a firm ground for photonic applications of atomically thin layers of transition metal dichalcogenides.

Author Contributions

G.A.E., M.A.E.-S., K.V.V., S.M.N., A.M.M., G.I.T., A.A.V. (Andrey A. Vyshnevyy), A.V.A. and V.S.V. proposed the concept, conceived and designed the experiments and wrote original draft. G.A.E., M.A.E.-S., D.I.Y., R.I.R., M.K.T., N.V.D., A.B.N., A.A.V. (Artem A. Voronov), S.M.N. and G.I.T. performed the measurements and analyzed the data. K.V.V. and A.A.V. (Andrey A. Vyshnevyy) provided theoretical support. All authors discussed the results and contributed to manuscript preparation. G.A.E. and M.A.E.-S. contributed equally to this work and should be considered co-first authors. All authors have read and agreed to the published version of the manuscript.

Funding

The experimental work was supported by the Russian Science Foundation, grant No. 19-79-00350. The numerical analysis of multilayer structures was supported by the Russian Science Foundation, grant No. 20-79-00349.

Institutional Review Board Statement

Not applicable.

Informed Consent Statement

Not applicable.

Data Availability Statement

The data presented in this study are available on request from the corresponding author.

Acknowledgments

The authors thank the MIPT’s Shared Research Facilities Center for the use of their equipment.

Conflicts of Interest

The authors declare no conflict of interest.

Appendix A

Table A1. Tabulated optical constants for epitaxial MoS2 monolayer on sapphire substrates.
λ (nm)nk
2501.606842.61054
2752.029212.55685
3002.565752.58710
3252.558121.89351
3502.043392.16150
3752.175952.89179
4002.951433.48336
4254.188753.38186
4504.933342.40006
4754.859581.51647
5004.552101.04876
5254.264150.83499
5504.035560.75964
5753.862550.77777
6003.749440.90252
6253.909191.22200
6504.202910.90721
6754.384970.96487
7004.715740.32016
7254.233060.00662
7504.023270.00250
7753.898660.00000
8003.809810.00000
8253.741920.00000
8503.687400.00000
8753.642250.00000
9003.604030.00000
9253.571160.00000
9503.542540.00000
9753.522150.00000
10003.495020.00000
10253.478880.00000
10503.457130.00000
10753.444030.00000
11003.426200.00000
11253.415360.00000
11503.400500.00000
11753.391400.00000
12003.378830.00000
12253.371100.00000
12503.360350.00000
12753.353710.00000
13003.344430.00000
13253.338670.00000
13503.330590.00000
13753.325560.00000
14003.318470.00000
14253.314040.00000
14503.307790.00000
14753.303870.00000
15003.298320.00000
15253.294820.00000
15503.289870.00000
15753.286740.00000
16003.286740.00000
16253.279490.00000
16503.275490.00000
16753.272960.00000
17003.269340.00000

References

  1. Novoselov, K.S.; Geim, A.K.; Morozov, S.V.; Jiang, D.; Zhang, Y.; Dubonos, S.V.; Grigorieva, I.V.; Firsov, A.A. Electric Field Effect in Atomically Thin Carbon Films. Science 2004, 306, 666–669. [Google Scholar] [CrossRef] [PubMed] [Green Version]
  2. Novoselov, K.S.; Mishchenko, A.; Carvalho, A.; Castro Neto, A.H. 2D Materials and van Der Waals Heterostructures. Science 2016, 353, aac9439. [Google Scholar] [CrossRef] [Green Version]
  3. Mak, K.F.; Shan, J. Photonics and Optoelectronics of 2D Semiconductor Transition Metal Dichalcogenides. Nat. Photonics 2016, 10, 216–226. [Google Scholar] [CrossRef]
  4. Datta, I.; Chae, S.H.; Bhatt, G.R.; Tadayon, M.A.; Li, B.; Yu, Y.; Park, C.; Park, J.; Cao, L.; Basov, D.N.; et al. Low-Loss Composite Photonic Platform Based on 2D Semiconductor Monolayers. Nat. Photonics 2020, 14, 256–262. [Google Scholar] [CrossRef]
  5. Tan, C.; Cao, X.; Wu, X.-J.; He, Q.; Yang, J.; Zhang, X.; Chen, J.; Zhao, W.; Han, S.; Nam, G.-H.; et al. Recent Advances in Ultrathin Two-Dimensional Nanomaterials. Chem. Rev. 2017, 117, 6225–6331. [Google Scholar] [CrossRef] [PubMed]
  6. Wang, Q.H.; Kalantar-Zadeh, K.; Kis, A.; Coleman, J.N.; Strano, M.S. Electronics and Optoelectronics of Two-Dimensional Transition Metal Dichalcogenides. Nat. Nanotechnol. 2012, 7, 699–712. [Google Scholar] [CrossRef]
  7. Peng, B.; Ang, P.K.; Loh, K.P. Two-Dimensional Dichalcogenides for Light-Harvesting Applications. Nano Today 2015, 10, 128–137. [Google Scholar] [CrossRef]
  8. Caldwell, J.D.; Aharonovich, I.; Cassabois, G.; Edgar, J.H.; Gil, B.; Basov, D.N. Photonics with Hexagonal Boron Nitride. Nat. Rev. Mater. 2019, 4, 552–567. [Google Scholar] [CrossRef]
  9. Li, D.; Gao, J.; Cheng, P.; He, J.; Yin, Y.; Hu, Y.; Chen, L.; Cheng, Y.; Zhao, J. 2D Boron Sheets: Structure, Growth, and Electronic and Thermal Transport Properties. Adv. Funct. Mater. 2020, 30, 1904349. [Google Scholar] [CrossRef]
  10. Ambrosi, A.; Sofer, Z.; Pumera, M. Electrochemical Exfoliation of Layered Black Phosphorus into Phosphorene. Angew. Chem. Int. Ed Engl. 2017, 56, 10443–10445. [Google Scholar] [CrossRef]
  11. Fleurence, A.; Friedlein, R.; Ozaki, T.; Kawai, H.; Wang, Y.; Yamada-Takamura, Y. Experimental Evidence for Epitaxial Silicene on Diboride Thin Films. Phys. Rev. Lett. 2012, 108, 245501. [Google Scholar] [CrossRef] [PubMed]
  12. Dávila, M.E.; Xian, L.; Cahangirov, S.; Rubio, A.; Le Lay, G. Germanene: A Novel Two-Dimensional Germanium Allotrope Akin to Graphene and Silicene. New J. Phys. 2014, 16, 095002. [Google Scholar] [CrossRef]
  13. Naguib, M.; Mochalin, V.N.; Barsoum, M.W.; Gogotsi, Y. 25th Anniversary Article: MXenes: A New Family of Two-Dimensional Materials. Adv. Mater. 2014, 26, 992–1005. [Google Scholar] [CrossRef]
  14. Jiang, X.; Kuklin, A.V.; Baev, A.; Ge, Y.; Ågren, H.; Zhang, H.; Prasad, P.N. Two-Dimensional MXenes: From Morphological to Optical, Electric, and Magnetic Properties and Applications. Phys. Rep. 2020, 848, 1–58. [Google Scholar] [CrossRef]
  15. Saito, Y.; Nojima, T.; Iwasa, Y. Highly Crystalline 2D Superconductors. Nat. Rev. Mater. 2017, 2, 16094. [Google Scholar] [CrossRef] [Green Version]
  16. da Jornada, F.H.; Xian, L.; Rubio, A.; Louie, S.G. Universal Slow Plasmons and Giant Field Enhancement in Atomically Thin Quasi-Two-Dimensional Metals. Nat. Commun. 2020, 11, 1013. [Google Scholar] [CrossRef] [Green Version]
  17. Zhao, S.; Hotta, T.; Koretsune, T.; Watanabe, K.; Taniguchi, T.; Sugawara, K.; Takahashi, T.; Shinohara, H.; Kitaura, R. Two-Dimensional Metallic NbS2: Growth, Optical Identification and Transport Properties. 2D Mater. 2016, 3, 025027. [Google Scholar] [CrossRef]
  18. Radisavljevic, B.; Radenovic, A.; Brivio, J.; Giacometti, V.; Kis, A. Single-Layer MoS2 Transistors. Nat. Nanotechnol. 2011, 6, 147–150. [Google Scholar] [CrossRef]
  19. Geim, A.K.; Grigorieva, I.V. Van Der Waals Heterostructures. Nature 2013, 499, 419–425. [Google Scholar] [CrossRef]
  20. Scuri, G.; Andersen, T.I.; Zhou, Y.; Wild, D.S.; Sung, J.; Gelly, R.J.; Bérubé, D.; Heo, H.; Shao, L.; Joe, A.Y.; et al. Electrically Tunable Valley Dynamics in Twisted WSe2/WSe2 Bilayers. Phys. Rev. Lett. 2020, 124, 217403. [Google Scholar] [CrossRef]
  21. Jariwala, D.; Sangwan, V.K.; Lauhon, L.J.; Marks, T.J.; Hersam, M.C. Emerging Device Applications for Semiconducting Two-Dimensional Transition Metal Dichalcogenides. ACS Nano 2014, 8, 1102–1120. [Google Scholar] [CrossRef] [Green Version]
  22. Choi, W.; Choudhary, N.; Han, G.H.; Park, J.; Akinwande, D.; Lee, Y.H. Recent Development of Two-Dimensional Transition Metal Dichalcogenides and Their Applications. Mater. Today 2017, 20, 116–130. [Google Scholar] [CrossRef]
  23. Yakubovsky, D.I.; Stebunov, Y.V.; Kirtaev, R.V.; Ermolaev, G.A.; Mironov, M.S.; Novikov, S.M.; Arsenin, A.V.; Volkov, V.S. Ultrathin and Ultrasmooth Gold Films on Monolayer MoS2. Adv. Mater. Interfaces 2019, 6, 1900196. [Google Scholar] [CrossRef] [Green Version]
  24. Ermolaev, G.A.; Grudinin, D.V.; Stebunov, Y.V.; Voronin, K.V.; Kravets, V.G.; Duan, J.; Mazitov, A.B.; Tselikov, G.I.; Bylinkin, A.; Yakubovsky, D.I.; et al. Giant Optical Anisotropy in Transition Metal Dichalcogenides for next-Generation Photonics. Nat. Commun. 2021, 12, 854. [Google Scholar] [CrossRef] [PubMed]
  25. Mak, K.F.; Lee, C.; Hone, J.; Shan, J.; Heinz, T.F. Atomically Thin MoS2: A New Direct-Gap Semiconductor. Phys. Rev. Lett. 2010, 105, 136805. [Google Scholar] [CrossRef] [Green Version]
  26. Amani, M.; Lien, D.-H.; Kiriya, D.; Xiao, J.; Azcatl, A.; Noh, J.; Madhvapathy, S.R.; Addou, R.; Kc, S.; Dubey, M.; et al. Near-Unity Photoluminescence Quantum Yield in MoS2. Science 2015, 350, 1065–1068. [Google Scholar] [CrossRef] [Green Version]
  27. Choudhury, T.H.; Zhang, X.; Al Balushi, Z.Y.; Chubarov, M.; Redwing, J.M. Epitaxial Growth of Two-Dimensional Layered Transition Metal Dichalcogenides. Annu. Rev. Mater. Res. 2020, 50, 155–177. [Google Scholar] [CrossRef]
  28. El Kazzi, S.; Mortelmans, W.; Nuytten, T.; Meersschaut, J.; Carolan, P.; Landeloos, L.; Conard, T.; Radu, I.; Heyns, M.; Merckling, C. MoS2 Synthesis by Gas Source MBE for Transition Metal Dichalcogenides Integration on Large Scale Substrates. J. Appl. Phys. 2018, 123, 135702. [Google Scholar] [CrossRef]
  29. Chang, L.L.; Ploog, K. (Eds.) Molecular Beam Epitaxy and Heterostructures; NATO ASI Series; Springer: Dordrecht, The Netherlands, 1985; ISBN 9789024731183. [Google Scholar]
  30. Li, W.; Birdwell, A.G.; Amani, M.; Burke, R.A.; Ling, X.; Lee, Y.-H.; Liang, X.; Peng, L.; Richter, C.A.; Kong, J.; et al. Broadband Optical Properties of Large-Area Monolayer CVD Molybdenum Disulfide. Phys. Rev. B 2014, 90, 195434. [Google Scholar] [CrossRef] [Green Version]
  31. Liu, H.-L.; Shen, C.-C.; Su, S.-H.; Hsu, C.-L.; Li, M.-Y.; Li, L.-J. Optical Properties of Monolayer Transition Metal Dichalcogenides Probed by Spectroscopic Ellipsometry. Appl. Phys. Lett. 2014, 105, 201905. [Google Scholar] [CrossRef] [Green Version]
  32. Kravets, V.G.; Prorok, V.V.; Poperenko, L.V.; Shaykevich, I.A. Ellipsometry and Optical Spectroscopy of Low-Dimensional Family TMDs. Semicond. Phys. Quantum Electron. Optoelectron. 2017, 20, 284–296. [Google Scholar] [CrossRef] [Green Version]
  33. Ghasemi, F.; Frisenda, R.; Dumcenco, D.; Kis, A.; Perez de Lara, D.; Castellanos-Gomez, A. High Throughput Characterization of Epitaxially Grown Single-Layer MoS2. Electronics 2017, 6, 28. [Google Scholar] [CrossRef]
  34. Yu, Y.; Yu, Y.; Cai, Y.; Li, W.; Gurarslan, A.; Peelaers, H.; Aspnes, D.E.; Van de Walle, C.G.; Nguyen, N.V.; Zhang, Y.-W.; et al. Exciton-Dominated Dielectric Function of Atomically Thin MoS2 Films. Sci. Rep. 2015, 5, 16996. [Google Scholar] [CrossRef] [PubMed] [Green Version]
  35. Fu, D.; Zhao, X.; Zhang, Y.-Y.; Li, L.; Xu, H.; Jang, A.-R.; Yoon, S.I.; Song, P.; Poh, S.M.; Tianhua, R.; et al. Molecular Beam Epitaxy of Highly Crystalline Monolayer Molybdenum Disulfide on Hexagonal Boron Nitride. J. Am. Chem. Soc. 2017, 139, 9392–9400. [Google Scholar] [CrossRef]
  36. Pacuski, W.; Grzeszczyk, M.; Nogajewski, K.; Bogucki, A.; Oreszczuk, K.; Kucharek, J.; Polczynska, K.E.; Seredynski, B.; Rodek, A.; Bozek, R.; et al. Narrow Excitonic Lines and Large-Scale Homogeneity of Transition-Metal Dichalcogenide Monolayers Grown by Molecular Beam Epitaxy on Hexagonal Boron Nitride. Nano Lett. 2020, 20, 3058–3066. [Google Scholar] [CrossRef] [PubMed] [Green Version]
  37. Zhang, H.; Ma, Y.; Wan, Y.; Rong, X.; Xie, Z.; Wang, W.; Dai, L. Measuring the Refractive Index of Highly Crystalline Monolayer MoS2 with High Confidence. Sci. Rep. 2015, 5, 8440. [Google Scholar] [CrossRef]
  38. Hsu, C.; Frisenda, R.; Schmidt, R.; Arora, A.; Vasconcellos, S.M.; Bratschitsch, R.; Zant, H.S.J.; Castellanos-Gomez, A. Thickness-Dependent Refractive Index of 1L, 2L, and 3L MoS2, MoSe2, WS2, and WSe2. Adv. Opt. Mater. 2019, 7, 1900239. [Google Scholar] [CrossRef] [Green Version]
  39. Ermolaev, G.A.; Stebunov, Y.V.; Vyshnevyy, A.A.; Tatarkin, D.E.; Yakubovsky, D.I.; Novikov, S.M.; Baranov, D.G.; Shegai, T.; Nikitin, A.Y.; Arsenin, A.V.; et al. Broadband Optical Properties of Monolayer and Bulk MoS2. npj 2D Mater. Appl. 2020, 4, 21. [Google Scholar] [CrossRef]
  40. Ermolaev, G.A.; Yakubovsky, D.I.; Stebunov, Y.V.; Arsenin, A.V.; Volkov, V.S. Spectral Ellipsometry of Monolayer Transition Metal Dichalcogenides: Analysis of Excitonic Peaks in Dispersion. J. Vac. Sci. Technol. B Nanotechnol. Microelectron. 2020, 38, 014002. [Google Scholar] [CrossRef]
  41. Tao, L.; Long, H.; Zhou, B.; Yu, S.F.; Lau, S.P.; Chai, Y.; Fung, K.H.; Tsang, Y.H.; Yao, J.; Xu, D. Preparation and Characterization of Few-Layer MoS2 Nanosheets and Their Good Nonlinear Optical Responses in the PMMA Matrix. Nanoscale 2014, 6, 9713–9719. [Google Scholar] [CrossRef]
  42. Lee, C.; Yan, H.; Brus, L.E.; Heinz, T.F.; Hone, J.; Ryu, S. Anomalous Lattice Vibrations of Single- and Few-Layer MoS2. ACS Nano 2010, 4, 2695–2700. [Google Scholar] [CrossRef] [Green Version]
  43. Li, H.; Wu, J.; Huang, X.; Lu, G.; Yang, J.; Lu, X.; Xiong, Q.; Zhang, H. Rapid and Reliable Thickness Identification of Two-Dimensional Nanosheets Using Optical Microscopy. ACS Nano 2013, 7, 10344–10353. [Google Scholar] [CrossRef] [PubMed] [Green Version]
  44. Lu, Y.; Chen, T.; Ryu, G.H.; Huang, H.; Sheng, Y.; Chang, R.-J.; Warner, J.H. Self-Limiting Growth of High-Quality 2D Monolayer MoS2 by Direct Sulfurization Using Precursor-Soluble Substrates for Advanced Field-Effect Transistors and Photodetectors. ACS Appl. Nano Mater. 2019, 2, 369–378. [Google Scholar] [CrossRef]
  45. Mak, K.F.; He, K.; Lee, C.; Lee, G.H.; Hone, J.; Heinz, T.F.; Shan, J. Tightly bound trions in monolayer MoS2. Nat. Mater. 2013, 12, 207–211. [Google Scholar] [CrossRef] [PubMed]
  46. Kaplan, D.; Gong, Y.; Mills, K.; Swaminathan, V.; Ajayan, P.M.; Shirodkar, S.; Kaxiras, E. Excitation Intensity Dependence of Photoluminescence from Monolayers of MoS2 and WS2 /MoS2 Heterostructures. 2D Mater. 2016, 3, 015005. [Google Scholar] [CrossRef]
  47. McDonell, S.; Addou, R.; Buie, C.; Wallace, R.M.; Hinkle, C.L. Defect-Dominated Doping and Contact Resistance in MoS2. ACS Nano 2014, 8, 2880–2888. [Google Scholar] [CrossRef] [PubMed]
  48. Chakraborty, B.; Ramakrishna Matte, H.S.; Sood, A.K.; Rao, C.N.R. Layer-Dependent Resonant Raman Scattering of a Few Layer MoS2. J. Raman Spectrosc. 2013, 44, 92–96. [Google Scholar] [CrossRef]
  49. Gao, J.; Li, B.; Tan, J.; Chow, P.; Lu, T.-M.; Koratkar, N. Aging of Transition Metal Dichalcogenide Monolayers. ACS Nano 2016, 10, 2628–2635. [Google Scholar] [CrossRef] [PubMed]
  50. Longo, R.C.; Addou, R.; Santosh, K.C.; Noh, J.-Y.; Smyth, C.M.; Barrera, D.; Zhang, C.; Hsu, J.W.P.; Wallace, R.M.; Cho, K. Intrinsic Air Stability Mechanisms of Two-Dimensional Transition Metal Dichalcogenide Surfaces: Basal versus Edge Oxidation. 2D Mater. 2017, 4, 025050. [Google Scholar] [CrossRef]
  51. Pető, J.; Ollár, T.; Vancsó, P.; Popov, Z.I.; Magda, G.Z.; Dobrik, G.; Hwang, C.; Sorokin, P.B.; Tapasztó, L. Spontaneous Doping of the Basal Plane of MoS2 Single Layers through Oxygen Substitution under Ambient Conditions. Nat. Chem. 2018, 10, 1246–1251. [Google Scholar] [CrossRef]
  52. Lu, H.; Kummel, A.; Robertson, J. Passivating the Sulfur Vacancy in Monolayer MoS2. APL Mater. 2018, 6, 066104. [Google Scholar] [CrossRef] [Green Version]
  53. Passler, N.C.; Paarmann, A. Generalized 4 × 4 Matrix Formalism for Light Propagation in Anisotropic Stratified Media: Study of Surface Phonon Polaritons in Polar Dielectric Heterostructures. J. Opt. Soc. Am. B 2017, 34, 2128. [Google Scholar] [CrossRef] [Green Version]
  54. Kretschmann, E.; Raether, H. Notizen: Radiative Decay of Non Radiative Surface Plasmons Excited by Light. Z. Nat. A 1968, 23, 2135–2136. [Google Scholar] [CrossRef]
  55. Stebunov, Y.V.; Arsenin, A.V.; Volkov, V.S. Chapter 12. Chemically Derived Graphene for Surface Plasmon Resonance Biosensing. In Chemically Derived Graphene: Functionalization, Properties and Applications; Nanoscience & Nanotechnology Series; Zhang, J., Ed.; Royal Society of Chemistry: London, UK, 2018; Volume 46, pp. 328–353. ISBN 9781788010801. [Google Scholar]
  56. Stebunov, Y.V.; Aftenieva, O.A.; Arsenin, A.V.; Volkov, V.S. Highly Sensitive and Selective Sensor Chips with Graphene-Oxide Linking Layer. ACS Appl. Mater. Interfaces 2015, 7, 21727–21734. [Google Scholar] [CrossRef] [PubMed]
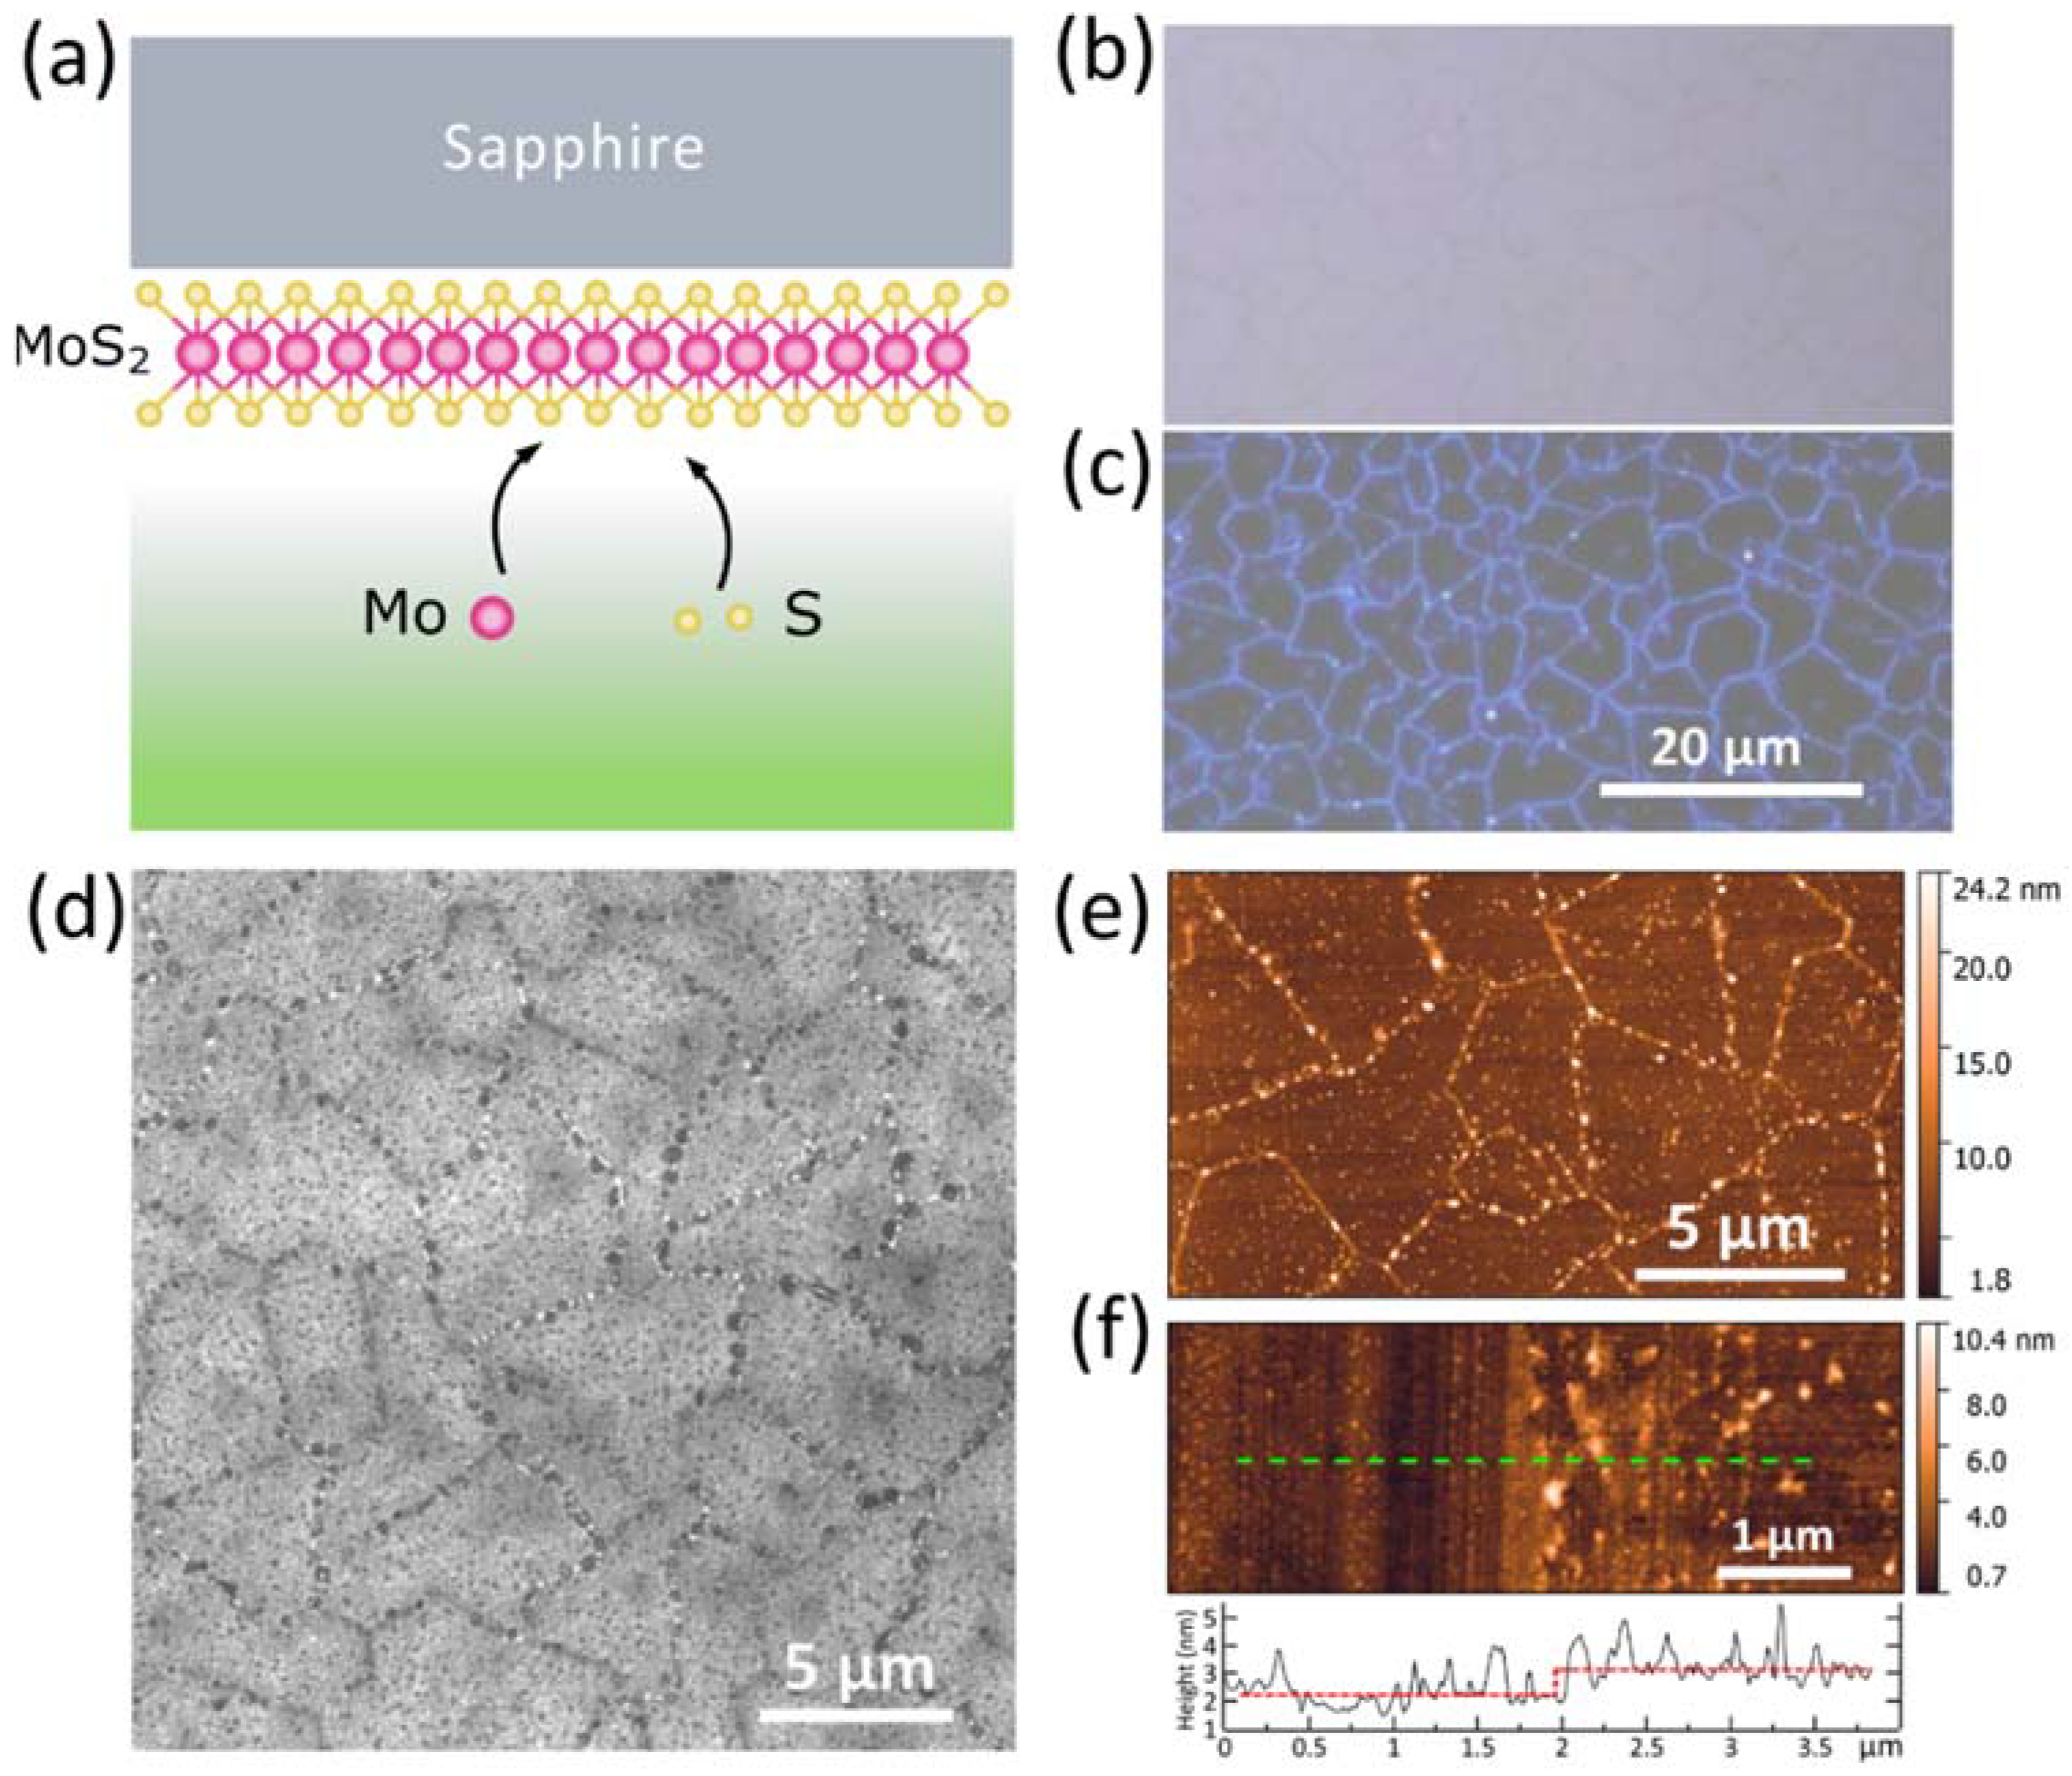
Figure 1. (a) A schematic diagram showing the concept of MBE growth monolayer MoS2 on a sapphire substrate. (b,c) Optical image of the epitaxial MoS2 taken in bright field (b) and dark field (c) regimes. MoS2 covers more than 97% of the surface. (d) SEM image of the epitaxial MoS2 revealing the high crystallinity of the samples with the characteristic crystallite size 6 ± 2 μm. (e) The AFM topography map of MoS2 surface with a scan area of 17.5 × 10 μm2. Root mean square roughness of MoS2 is 0.5 nm in areas without defects. (f) The AFM topography map and the cross-sectional profile of the edge of epitaxial MoS2 along the green line, giving the MoS2 layer thickness of ~0.9 nm. The scan area was 5.5 × 2 μm2.
Nanomaterials 11 01411 g001
Figure 2. Photoluminescence (a) and Raman (b) spectra of the CVD and epitaxial monolayer MoS2 grown on sapphire substrates. The excitation wavelength was 632.8 nm (a) and 532 nm (b). Dashed and dotted lines show deconvolution of the photoluminescence spectrum into Gaussian peaks corresponding to A-exciton and defects, respectively. The Raman peak marked as “Sp” is related to the sapphire substrate.
Nanomaterials 11 01411 g002
Figure 3. XPS characterization of CVD (a,b) and epitaxially (c,d) grown MoS2 monolayers on sapphire substrates. Decomposition of Mo3d (left) and S2p (right) core level signals into their constituents.
Nanomaterials 11 01411 g003
Figure 4. Optical properties of MBE MoS2. Plots of the measured and calculated MBE MoS2 ellipsometric parameters (a) Ψ and (b) Δ. (c) Optical constants (n and k) of epitaxial monolayer MoS2 grown on a sapphire substrate from SE analysis of panels (a,b). For the tabular data, see Table A1. For comparison, we added optical constants of CVD and exfoliated MoS2 from ref. [37,38], respectively. (d) Measured (red line) and calculated (black line) transmittance spectra of MBE MoS2 on sapphire matching perfectly within spectrophotometer accuracy (1%) except in the 250–270 nm range, where inaccuracy approaches 2% attributed to the low signal sensitivity of our ellipsometer in that interval. The inset is a refractive index of exfoliated, MBE, and CVD MoS2 at 750 nm.
Nanomaterials 11 01411 g004
Figure 5. Surface plasmonic resonance (SPR) sensor based on SiO2/Au (40 nm) chip with CVD, MBE and exfoliated MoS2. (a) The reflectance of SPR sensor for different layer numbers of CVD, MBE, and exfoliated MoS2. (b) The dependence of the SPR sensor sensitivity on the MoS2 number of layers. The inset is a scheme of an SPR sensor.
Nanomaterials 11 01411 g005
Table 1. Tauc-Lorentz parameters of the oscillators (excitons) with ε = 0.54 used to describe dielectric function of MBE MoS2.
OscillatorA (eV)C (meV)Eg (eV)E0 (eV)
#14101201.7181.787
#284881.8321.955
#3776001.5652.872
#4807312.8564.070
#52818264.1354.504
Publisher’s Note: MDPI stays neutral with regard to jurisdictional claims in published maps and institutional affiliations.