Article

Mechanical and Thermal Evaluation of Aluminum Hybrid Nanocomposite Reinforced with Alumina and Graphene Oxide

by
Abdul Samad Mohammed
1,2,*,
Tawfeeq Saad Alahmari
1,
Tahar Laoui
3,
Abbas Saeed Hakeem
4 and
Faheemuddin Patel
1,2
1
Department of Mechanical Engineering, King Fahd University of Petroleum and Minerals, Dhahran 31261, Saudi Arabia
2
Interdisciplinary Research Center for Advanced Materials, KFUPM, Dhahran 31261, Saudi Arabia
3
Department of Mechanical and Nuclear Engineering, University of Sharjah, Sharjah 27272, United Arab Emirates
4
Center of Research Excellence in Nanotechnology, King Fahd University of Petroleum and Minerals, Dhahran 31261, Saudi Arabia
*
Author to whom correspondence should be addressed.
Nanomaterials 2021, 11(5), 1225; https://doi.org/10.3390/nano11051225
Submission received: 20 March 2021 / Revised: 28 April 2021 / Accepted: 4 May 2021 / Published: 6 May 2021

Abstract

:
Aluminum matrix composites are among the most widely used metal matrix composites in several industries, such as aircraft, electronics, automobile, and aerospace, due to their high specific strength, durability, structural rigidity and high corrosion resistance. However, owing to their low hardness and wear resistance, their usage is limited in demanding applications, especially in harsh environments. In the present work, aluminum hybrid nanocomposite reinforced with alumina (Al2O3) and graphene oxide (GO) possessing enhanced mechanical and thermal properties was developed using spark plasma sintering (SPS) technique. The focus of the study was to optimize the concentration of Al2O3 and GO content in the composite to improve the mechanical and thermal properties such as hardness, compressive strength, heat flow, and thermal expansion. The nanocomposites were characterized by FESEM, EDS, XRD and Raman spectroscopy to investigate their morphology and structural properties. In the first phase, different volume percent of alumina (10%, 20%, 30%) were used as reinforcement in the aluminum matrix to obtain (Al+X% Al2O3) composite with the best mechanical/thermal properties which was found to be 10 V% of Al2O3. In the second phase, a hybrid nanocomposite was developed by reinforcing the (Al + 10 V% Al2O3) with different weight percent (0.25%, 0.5%, 1%) of GO to obtain the optimum composition with improved mechanical/thermal properties. Results revealed that the Al\10 V% Al2O3\0.25 wt.% GO hybrid nanocomposite showed the highest improvement of about 13% in hardness and 34% in compressive strength as compared to the Al\10V% Al2O3 composite. Moreover, the hybrid nanocomposite Al\10 V% Al2O3\0.25 wt.% GO also displayed the lowest thermal expansion.

1. Introduction

Aluminum (Al) has traditionally been used for a variety of applications because of its lightweight, high corrosion resistance, high electrical, thermal conductivity and better formability compared to ferrous and other non-ferrous metals. However, the use of plain Al is generally not suitable for engineering applications because of its high ductility and low strength. This has led to the development of a variety of aluminum-based alloys with enhanced mechanical and tribological properties for a wide range of engineering applications. These alloys exhibit high strength to weight ratio, good machinability and lower cost of fabrication [1,2,3,4]. Further enhancement in the properties has been achieved by the development of aluminum metal matrix composites (MMCs) by adding different reinforcements [5]. The advantage of Al-MMCs is that they can be sintered with tailored properties by using a combination of various inclusions in the matrix [6]. Ceramic reinforcements such as SiC [7,8,9], TiO2 [10], Al2O3 [11,12,13,14,15] and a combination of various oxides, carbides and nitrides have been used to prepare Al-MMCs [16,17]. SiC reinforced Al composites have exhibited an increase in yield strength, tensile strength, hardness and density with the increase in the SiC content; however, with a decrease in toughness and plasticity [9,18]. SiC addition is reported to improve work hardening rate and work-to-fracture along with the ultimate strength of the composite [7]. Studies involving Al2O3 reinforcements have shown that density, hardness and wear resistance of Al–Al2O3 composite increase with increasing alumina content [15]; however, in other studies, the higher volume fraction of the Al2O3 reinforcement particles are reported to decrease the density of the composites. This discrepancy may be attributed to a difference in the shape and size of the reinforcement particles [13]. Recently, carbon-based reinforcements have been used to impart improvements in the properties of Al-MMCs [19]. Carbon materials such as carbon fibers [20,21], graphite [22,23], carbon nanotubes (CNTs) [24,25], graphene (G) [26,27] and graphene oxide (GO) [28,29] have been used as reinforcements in Al-MMCs. In graphene-reinforced aluminum matrix nanocomposites, an improvement of 79, 49 and 44% in yield strength, ultimate strength, and Vickers hardness have been reported with 1 wt.% GO addition, and the increase in GO content has led to grain refinement of the composite [30]. In another study, an increase in GO has yielded an increase in the hardness of Al-GO composites up to 0.4 wt.% GO, with a maximum increase of 163.8%, but the hardness has declined upon increasing the GO reinforcement to 0.6 wt.%. The wear rate of Al-GO composites is found to reduce with increasing GO content [31]. However, graphene is prone to forming aluminum carbide during the processing of Al-graphene composites, which lowers the hardness and tensile strength. This is attributed to the defective nature of graphene produced by thermal exfoliation/reduction of graphite.
From the above literature review, it can be concluded that the use of monolithic reinforcement materials in Al-MMCs tends to have undesirable effects on some properties while enhancing other properties. For instance, Al-MMCs reinforced with ceramic inclusions have shown to improve the strength and stiffness, at the expense of ductility and fracture toughness [32,33]. To overcome these challenges, hybrid composites such as Al-MMCs containing both ceramic and carbon-based reinforcements are being developed [34,35,36,37]. Hybrid Al-SiC-GO prepared by stir casting method has shown a significant improvement in impact strength, tensile strength, hardness and wear resistance with the increase in the weight percentage of GO particles [38]. Similarly, Al-TiO2-GO hybrid composite with 10% TiO2 and various amounts of graphene (0.5, 0.75 and 1.0 wt.%) has exhibited an increase in hardness, ultimate tensile strength and wear resistance with increasing GO reinforcement. The selection of a processing method for Al-MMCs is shown to have an appreciable effect on the properties of hybrid Al-MMCs, which are generally sintered via powder metallurgy process, i.e., powder consolidation and sintering. The powder metallurgy process provides greater flexibility and controllability. Sintering is an important step that significantly affects the integrity and properties of composite materials sintered through powder metallurgy process. Conventional sintering is performed by heating the consolidated mixture of the powders in a furnace. However, nonconventional sintering techniques such as laser-assisted sintering, microwave-assisted sintering and spark plasma sintering are also being used. Spark plasma sintering (SPS) has shown several advantages over conventional sintering methods leading to marked improvements in the properties of materials. SPS integrates the consolidation and sintering stages and the material can be sintered with high heating rate and at relatively lower sintering temperature, thus leading to shorter processing time [39].
The review of literature has shown that studies on the development of hybrid Al-MMCs reinforced with ceramic-carbon materials are rather scarce, particularly Al-Al2O3-GO. Moreover, earlier studies have predominantly utilized the stir-casting method for consolidating the composites followed by conventional sintering.
This has motivated the authors to sinter aluminum hybrid nanocomposite reinforced with alumina (Al2O3) and graphene oxide (GO) using spark plasma sintering (SPS) process, and to evaluate the effect of varying the amount of Al2O3 and GO on the mechanical and thermal properties of the developed hybrid nanocomposite.

2. Materials

Aluminum (Al) powder with a particle size of 30 µm and a purity of 99.5% was used as the matrix. It was procured from Alpha chemical company. Alpha alumina (Al2O3 ) powder manufactured by Union Carbide corporation for Buehler Ltd., Lake Bluff, IL, USA was used as a reinforcement with 300 nm particle size and 99.8% purity with a surface area of 85–115 m2/g. Graphene oxide used as a second reinforcement was procured from AD-Nano Company, Shimoga, India, with the following specifications: purity ~99%, surface area 250 m2/g. The XRF analysis of the as-received powders is shown in Table 1.

SEM and XRD Analysis of the as Received Powders

The morphology of the as received powders was analyzed by scanning electron microscopy (SEM). X-ray diffraction (XRD) was also conducted to determine the phases of the as received powders. XRD was carried out on a Rigaku Miniflex X-ray diffractometer, using Cu Kα radiation (λ = 0.15416 nm) in the 2θ range 5°–120° at a scanning speed of 2 °/min.
Figure 1a,c displays the high magnification SEM images of as received Al powder, Al2O3 and GO, respectively. It can be observed from Figure 1a that Al particles are spherically shaped with an average diameter of 30 μm. Figure 1b shows the Al2O3 particles that are acicular in shape and which gather to form agglomerates in some areas, whereas Figure 1c shows small sheets of GO. The XRD spectra of the as received powders are displayed in Figure 1d–f, indicating that they exhibit the signature peaks of the as received Al, Al2O3 and GO powders.

3. Experimental Procedure

The steps for fabricating Al\X% Al2O3 nanocomposite and Al\X% Al2O3\Y% GO hybrid nanocomposite samples included ultrasonication, ball milling and spark plasma sintering. The different parameters used during each step are indicated in this section.

3.1. Ultrasonication of Al2O3 and GO Powders

Prior to mixing the reinforcements with the matrix Al powder, each of the reinforcements, namely, Al2O3 and GO were sonicated individually in ethanol for 10 min and 1 h, respectively using a probe sonicator (Sonics VCX 750, Newtown, CT, USA) at room temperature with an On\Off cycle of 20\5 s and an amplitude of 45%. Different volume percent (10%, 20%, 30%) of Al2O3 and different weight percent (0.25, 0.5 and 1 wt.%) of GO were sonicated under the same conditions to prepare different compositions.

3.2. Ball-Milling Procedure

Pure Al with different Al2O3 volume percent (10%, 20%, 30%) was loaded in zirconia vials and mixed for 24 h in a ball mill attritor (HD/HDDM/01, Union process, Inc. Akron, OH, USA) to produce a homogeneous mixture. The process was carried out under the flow of Argon (Ar) gas atmosphere to avoid oxidation. A total of 50 mL of ethanol was used as a process control agent (PCA) to avoid excessive cold welding and agglomeration. Zirconium oxide (ZrO2) balls with a diameter of 5 mm were used with a ball-to-powder weight ratio (BPR) of 10:1. Mixing was performed at a speed of 200 rpm. The ball milling experiment was halted after the first hour of the process to remove any powder from the walls of the vial to eliminate its accumulation on the walls. The vials were purged with Ar gas during the whole mixing process. Subsequently, the powder mixture was dried in an oven at a temperature of 80 °C for 12 h. The same procedure was used for 48 h to mix the Al\X% Al2O3\Y% GO hybrid powders to obtain a homogeneous mixture. Table 2 summarizes the mixing parameters used for the nanocomposites and the hybrid nanocomposite powders.

3.3. Spark Plasma Sintering Procedure

As-received Al powder was used to fabricate a reference sample. Al powder was charged in a 20 mm graphite die. A graphite sheet approximately 0.35 mm thick was placed in between the die and the powder as well as between the powder and the punch to easily remove the sample and avoid the wear of the punch. Spark plasma sintering machine from FCT group, System GMBH, (Rauenstein, Germany) was used to sinter the Al, the Al-X% Al2O3 nanocomposite and Al\X% Al2O3\Y% GO hybrid nanocomposite samples. In addition to the mentioned parameters in Table 3, the other SPS sintering parameters included, cooling rate = 100 °C/min to room temperature (20–35 °C), pulse = 1 ms, pause = 0, and number of pulse = 1. Circular samples of 20 mm diameter with a thickness of 6 mm were obtained after sintering.
The sintered samples were mounted by using hot mounted and grounded using different grit papers starting from rougher to the finer grit (240, 320, 400, 600, 800, 1200) followed by polishing with 0.3 μm alumina paste to obtain a polished surface. The samples were subjected to ultrasonic cleaning for 10 min to remove any debris being subjected to further characterizations.

3.4. Densification, Mechanical, Thermal and Thermomechanical Analyses

Various characterization techniques were used to evaluate the mechanical and thermal properties of the nanocomposites and the hybrid nanocomposites. Density measurements were carried out in line with the Archimedes principle (Kern ABT weighing scale, 320 g capacity, Balingen, Germany). Hardness measurements were carried out using a Zwick Roell Vickers hardness testing machine (Ulm, Germany) at a load of 500 gf. An average of 10 readings was taken for each sample. Scanning electron microscopy (SEM) fitted with an electronic dispersive x-ray (EDX) (Quanta FEG 250, Thermo Fisher company, Waltham, MA USA) was used to evaluate the morphology and the chemical composition of the samples. A compression test was carried out on an Instron testing machine to determine the behavior or response of the nanocomposites when exposed to compressive loads. Al is a soft material, and prone to dimensional instability due to its expansion when exposed to high temperature. A higher coefficient of thermal expansion indicates a more expansion tendency of the material. Hence, to evaluate the thermal expansion of the developed nanocomposites, Mettler Toledo instrument (TMA/SDTA LF/100, Columbus, OH, USA) was used for thermal expansion measurement.

4. Results and Discussion

The results are presented in three sub-sections. Firstly, the morphology and mechanical characterization results for the Al-X vol% Al2O3 composites are presented (Phase I) followed by the characterization of the hybrid nanocomposite (Phase II) and concluding with the mechanical and thermal characterization of the optimum hybrid nanocomposite (Phase III).

4.1. Results of Phase I-Morphology and Mechanical Characterization of Al-X vol% Al2O3 Nanocomposites

4.1.1. SEM Analysis of Al-X%Al2O3 Nanocomposite Powders after Mixing

The morphology of the nanocomposite powders of Al mixed with different volume percent of Al2O3 after ball milling was evaluated by SEM as shown in Figure 2a–c. It can be observed that in all nanocomposite powders, the particles deformed from a spherical shape into a relatively irregular shape after ball milling because of the collisions between the balls and the powder particles. It can be observed from Figure 2a that in Al-10% Al2O3, the nanoparticles of Al2O3 are uniformly distributed, whereas in Al-20%Al2O3 and Al-30% Al2O3 it can be observed the Al2O3 particles are non-uniformly distributed with a significant amount of agglomeration. The agglomeration tends to increase as the volume content of Al2O3 is increased from 20% to 30% Al2O3. Therefore, reducing the agglomeration would be a key element of improving the mechanical properties of Al- (20% and 30% Al2O3) nanocomposites due to the restriction of the interfacial area between the matrix and the reinforcement.

4.1.2. Microstructure of (Al-X%Al2O3) Nanocomposite Samples after SPS

Figure 3a, shows the SEM images for the SPS sample of Al-10 vol% Al2O3 nanocomposite, where little porosity can be observed with fine grain size. The samples were etched by buffered hydrofluoric acid (HF) for 10 s (1 mL HF and 49 mL water) for imaging. Adding more amount of Al2O3, as in the Al-20 vol% Al2O3 sample, Al2O3 is mainly observed along the grain boundaries of Al as illustrated in Figure 3b. A few cracks are also observed around the grain boundaries of the sample containing 20 vol% Al2O3. This can be attributed to a higher volume percent of Al2O3 content which makes the material brittle. Therefore, due to the brittleness of the sample which is associated with an increase in the volume percent of Al2O3, the fracture rate of the sample increased as was observed with Al-30 vol% Al2O3 which fractured during the grinding and polishing of the sample. Hence, the SEM could not be taken owing to the difficulty faced during grinding and polishing.

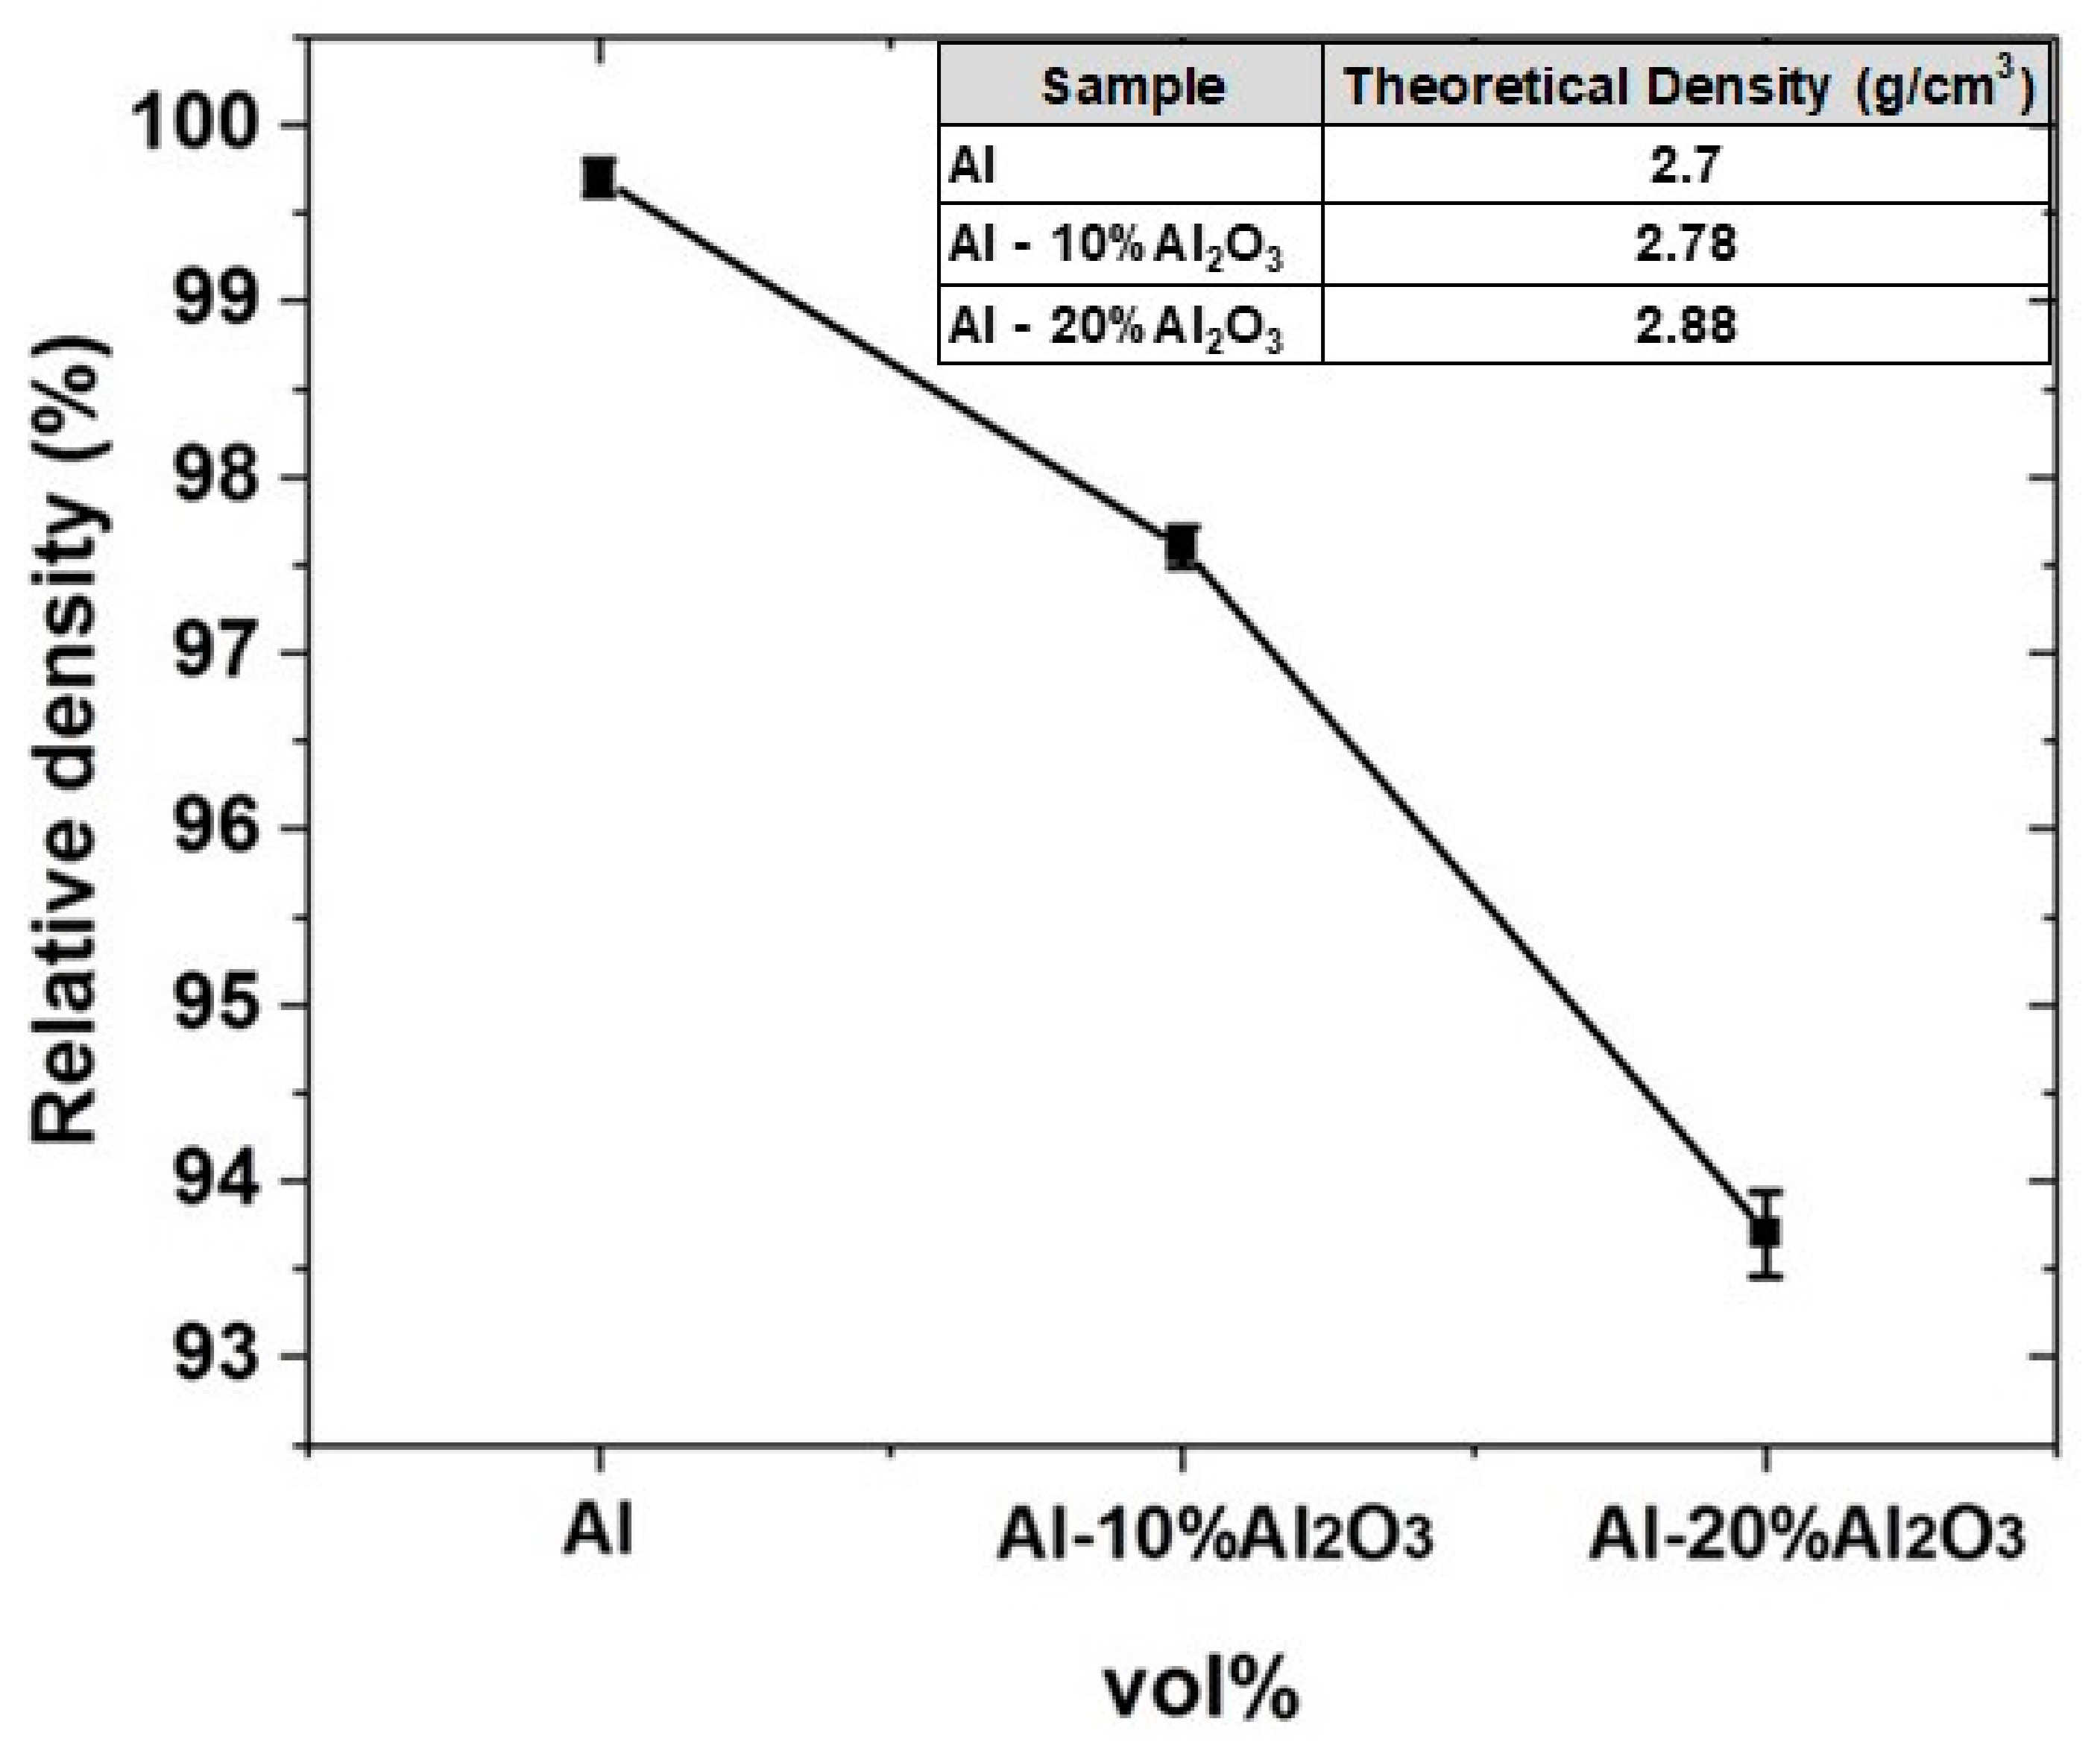
4.1.3. Density of Al-X vol% Al2O3 Nanocomposites

After sintering and grinding, Al-X vol%Al2O3 nanocomposite samples, the density was measured based on the Archimedes method and the results are shown in Figure 4. It is observed that Al displays a higher density of 99.7% as compared to the nanocomposite samples, with a density of 97.5% and 93.7% for Al-10 vol% Al2O3 and Al-20 vol% Al2O3, respectively. This density decrease can be attributed to the reduction in the wettability between Al2O3 and Al matrix due to the agglomeration of Al2O3 particles, particularly at high volume content. However, for the sample containing 30 vol% Al2O3, the density could not be measured because of the challenges mentioned above. The theoretical densities were measured using the rule of mixtures and are shown in Figure 4 (Inset).

4.1.4. Hardness of Al-X vol% Al2O3 Nanocomposites

Figure 5 displays the hardness values of the sintered samples of Al-X vol% Al2O3 nanocomposite. The sintered Al sample showed a Vickers hardness value of 32 HV. However, the addition of 10 vol% of Al2O3 resulted in a significant increase in the hardness from 32 to 55.8 HV. This tremendous increase in the hardness can be attributed to the presence of the uniformly distributed hard and non-deformable nanoparticles of Al2O3 particles within the Al matrix, as can be seen in Figure 3a. The presence of these particles thereby hinders the movement of dislocations, resulting in an increase in the hardness. Further increasing the amount of Al2O3 to 20 vol% resulted in a reduction in the hardness from 55.8 to 47.2 HV. This reduction can be attributed to the lower densification triggered by the agglomeration of Al2O3 particles, as clearly observed in the SEM image Figure 3b owing to high volume percent and non-uniform distribution of Al2O3. As mentioned earlier, with a further increase in the volume percent of Al2O3 to 30%, the nanocomposite sample fractured due to an increased brittleness resulting from the agglomeration and cracks during sintering, due to which, the hardness measurements were not acquired.

4.1.5. Summary of Phase I

Based on the above results, Al-10 vol%Al2O3 nanocomposite showed the highest hardness, reasonable density and uniform distribution of Al2O3 particles in the Al matrix compared to the other developed nanocomposites. Hence, 10 vol% Al2O3 was selected as a first filler to fabricate the Al hybrid nanocomposite.

4.2. Results of Phase II-Morphology and Mechanical Characterization of Al-10 vol% Al2O3 –Y wt.% GO Nanocomposites

In this phase, Al hybrid nanocomposites were fabricated by reinforcing the Al-10 vol% Al2O3 with different weight percentages (0.25, 0.5 and 1 wt.%) of GO.

4.2.1. SEM Analysis of Al-10 vol%Al2O3-Y wt.%GO Hybrid Nanocomposite Powders after Ball Milling

Figure 6a–c represents the morphology of the mixed powders for the developed Al-10 vol% Al2O3- Y wt.%GO hybrid nanocomposite samples. A uniform distribution of GO can be observed for the Al-10 vol% Al2O3- 0.25 wt.%GO hybrid powders.

4.2.2. Microstructure of Al-10 vol%Al2O3-Y wt.%GO Hybrid Nanocomposites after SPS

The microstructure of the developed hybrid nanocomposite was investigated by SEM as presented in Figure 7. A uniform distribution of GO along the grain boundaries is observed in the sample containing 0.25 wt.% GO, whereas, in the samples containing 0.5wt.% and 1 wt.% of GO some agglomeration of GO was observed as highlighted in Figure 7a. Another observation noted from Figures is the presence of porosity which is associated with the sample containing 1 wt.% of GO.
Figure 7d,e SEM from the fractured sample and mapping of the sample confirms the relatively uniform distribution of the alumina particles in the aluminium matrix with 1 wt.% of GO hybrid. It was comprehended that finer alumina particles were trapped between the large aluminium particles, which resulted in better densification in the absence of GO. SEM image of hybrid shows the homogeneous dispersion of GO, as per fractured surface. The GO was embedded between the aluminium particles, as shown in the fractured surfaces, which promote the improvement in the toughness of the hybrid. SEM/EDS mapping micrographs, Figure 7f–h revealed the presence of both intergranular and transgranular fracture morphologies in the hybrid sample. Moreover, there are few regions where agglomerates were found which deteriorate and have an adverse effect on the properties of the hybrid sample.

4.2.3. Density Measurement of Al-10% Al2O3-Y% GO Hybrid Nanocomposites

After sintering and grinding/polishing of Al-10% Al2O3-Y wt.% GO hybrid nanocomposite samples, the experimental density was measured based on the Archimedes method and the results are shown in Figure 8. The results indicate that the relative density is reduced with increasing GO content, whereby, adding 0.25 wt.% of GO to the Al-10% Al2O3 nanocomposite decreases the relative density from 97.5% to 96.8%. Further addition of GO to Al-10% Al2O3 nanocomposite gradually reduces the relative density to 95.4% and 94.6% corresponding to 0.5 wt.% and 1 wt.% GO content, respectively. This reduction in the density is attributed to the tendency of GO to distribute itself along the grain boundaries which impedes the densification process, consequently resulting in higher porosity with a higher content of GO as observed in SEM images in Figure 7.

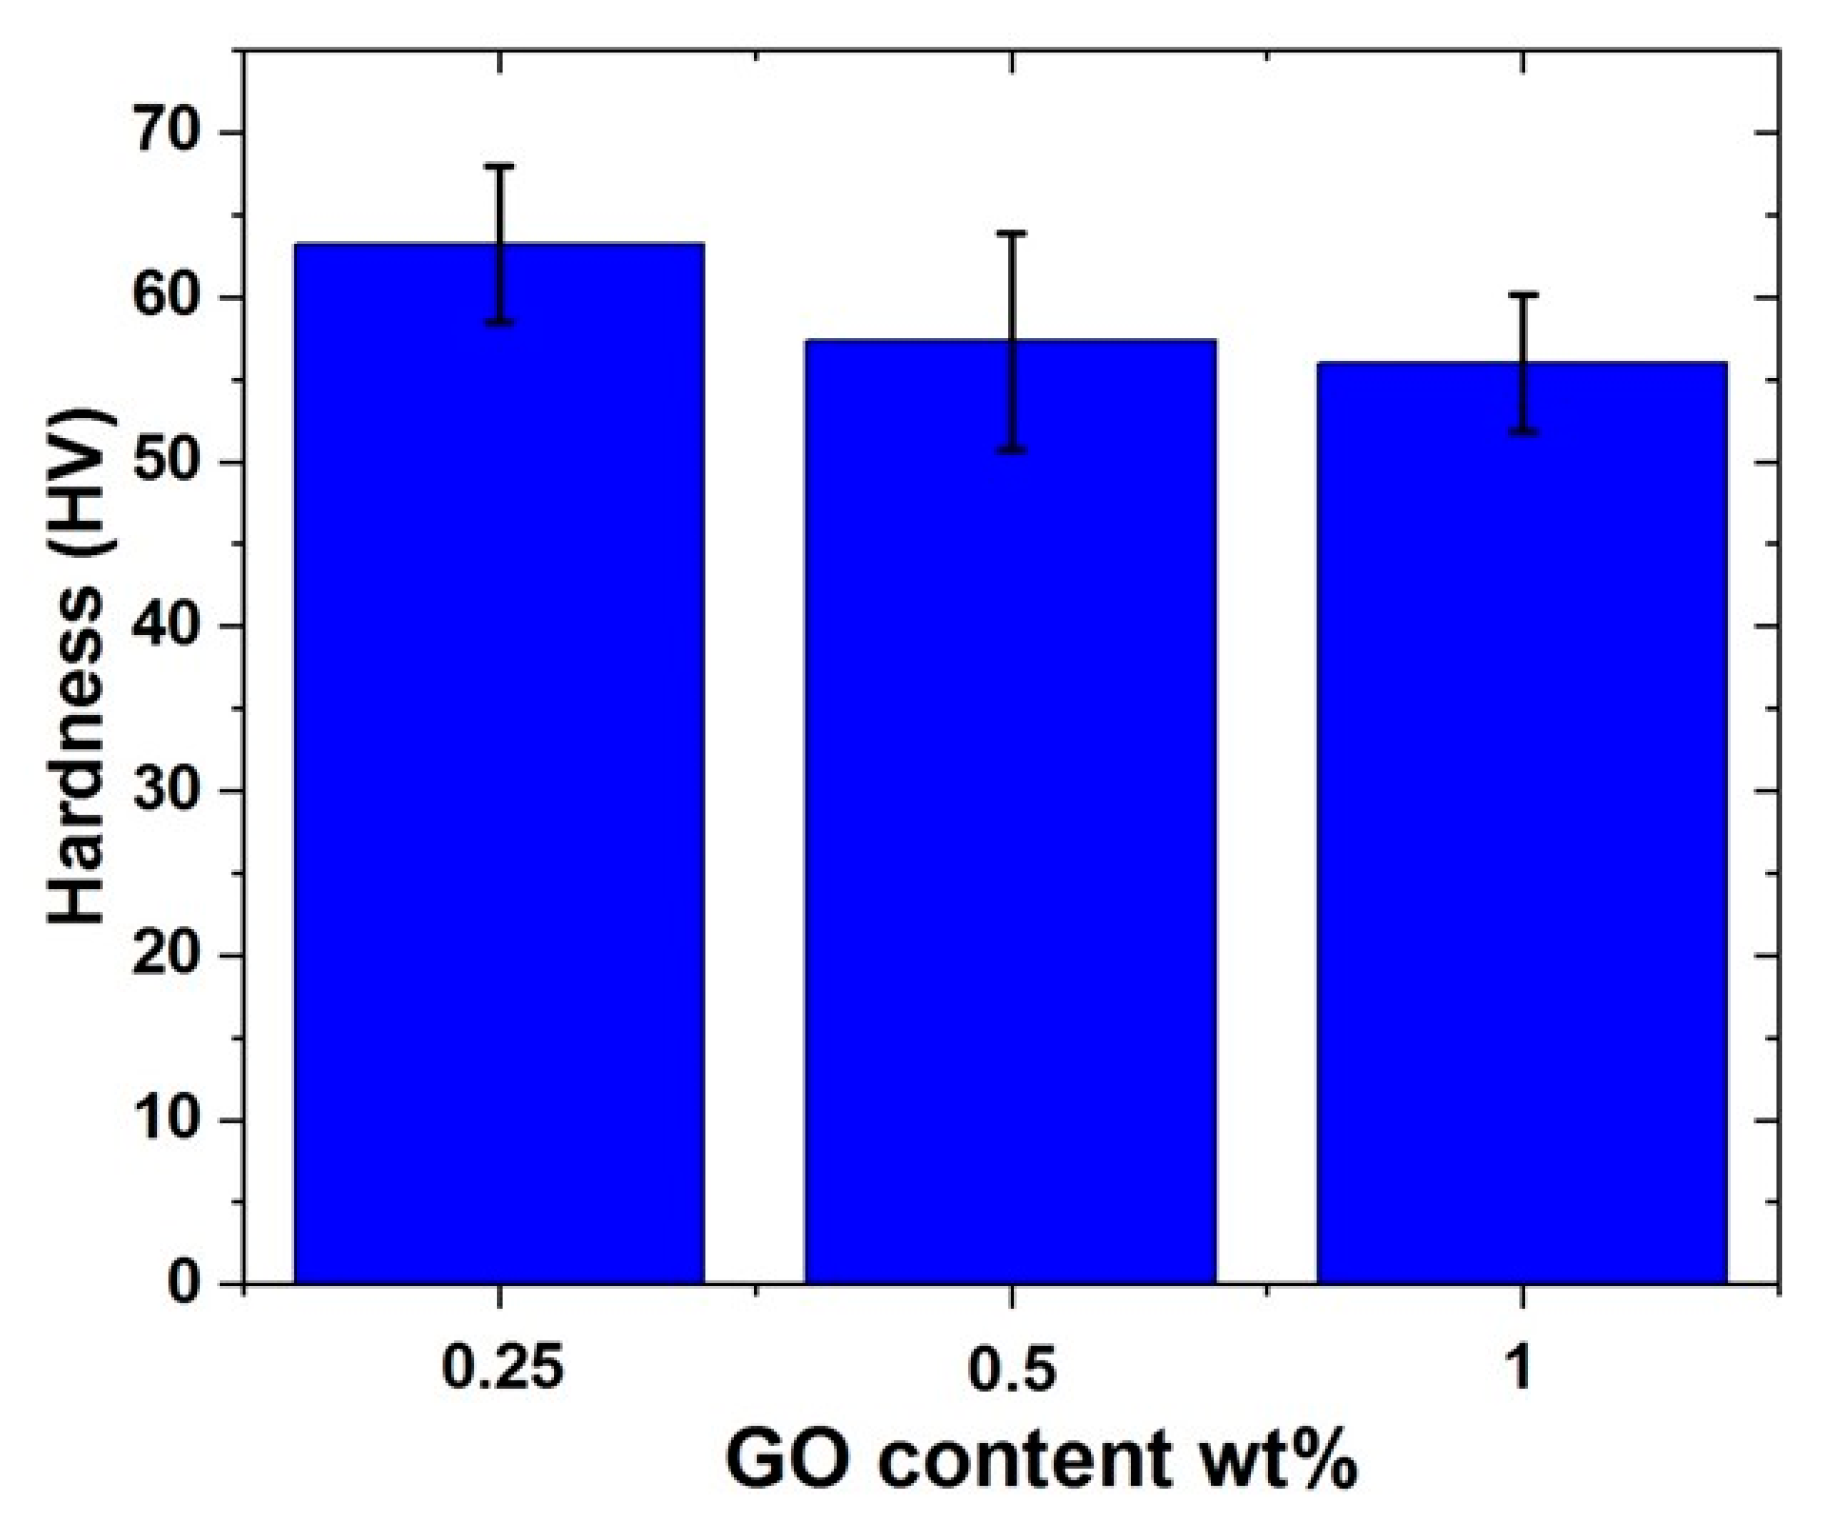
4.2.4. Hardness Measurement of Al-10% Al2O3-Y% GO Hybrid Nanocomposites

The hardness results of Al-10% Al2O3-Y% GO are presented in Figure 9. The highest hardness of 63 HV was observed for the hybrid sample containing 0.25 wt.% of GO among all the developed samples. The hardness reduced to 57 HV with an increase in the GO content to 0.5 wt.%. However, not much difference was observed in the hardness of the hybrid sample with a further increase in the GO content to 1 wt.%. The increase in the hardness of the hybrid nanocomposite with a low content of GO (0.25 wt.%) is attributed to the uniform distribution of both fillers, Al2O3 and GO, in the matrix. The homogeneous distribution of these fillers helps in the load transfer from the matrix leading to a higher hardness of the hybrid nanocomposite. Furthermore, these fillers as discussed above and shown by SEM, influence the microstructure of the hybrid nanocomposites resulting in finer grain size. The reason for observing relatively lower hardness in the samples containing 0.5 wt.% and 1 wt.% as compared to 0.25 wt.% GO sample is attributed to the low densification associated with the Al2O3 agglomeration and porosity.

4.2.5. Raman Spectroscopy of Al-10% Al2O3-Y% GO Hybrid Nanocomposite Powders

Figure 10 shows Raman spectra of GO powder and the hybrid nanocomposite powders after mixing. It can be observed that GO shows two signature peaks/bands. One at approximately 1580 cm−1 corresponding to the G band resulting from the stretching of the C–C bond in GO, and another one at approximately 1350 cm−1, corresponding to the D band which is associated with the disorders or defects that occur from the resonance Raman spectra of Sp2 hybridized carbon. Both peaks can be observed in the Raman spectra for all the hybrid nanocomposite powders. However, their intensity increases with an increase in the GO content.

4.2.6. XRD Analysis of the Nanocomposite and Hybrid Nanocomposite Samples

Figure 11 shows the X-ray diffraction pattern obtained for the SPS sintered samples for Al-10%Al2O3 nanocomposites and all the developed hybrid nanocomposite samples. The XRD pattern of Al-10% Al2O3 nanocomposite shows slightly less broadened peaks for both Al2O3 and Al, as compared to the hybrid nanocomposite samples. This can be attributed to the effect of ball milling time where the nanocomposite was milled for 24 h while the hybrid nanocomposite powders were milled for 48 h resulting in a more homogeneous and uniform distribution of the fillers in the Al matrix. However, GO phase was not observed in the hybrid nanocomposite due to its very small amount. Moreover, it was observed that no chemical reaction occurred between GO and Al- Al2O3 nanocomposite as there was no new phase such as intermetallic phase(s) nor the formation of aluminum carbide (Al4C3) was seen in any of the XRD patterns for the hybrid nanocomposites.
The XRD patterns were normalised and the crystallite size and microstrain were also estimated by using the following equations: crystallite size (average in Å) = Kλ/(Bcosθ) and BT = CεTanθ (ca. C = 4 for spherical particles), respectively. The average crystallite size was found to be slightly decreasing, with an increased ball milling duration and the average microstrain is found to slightly increase for all compositions. The slight increase in microstrain value can be attributed to the presence of hard alumina particles and the cold welding of soft aluminum.

4.2.7. Summary of Phase II

From the above results, it can be concluded that the hybrid nanocomposite sample containing 0.25%GO showed the highest hardness, density and uniform distribution of the fillers in the Al matrix. Hence, based upon the above results Al-10% Al2O3-0.25%GO was selected for further processing.

4.3. Results of Phase III-Mechanical and Thermal Characterization of Al-10 vol% Al2O3–0.25 wt.% GO Hybrid Nanocomposites

Mechanical and thermal characterization of the optimum hybrid nanocomposite which was obtained from Phase II to be Al-10 vol% Al2O3-0.25 wt.% GO were evaluated. Compressive strength, differential scanning calorimetry and thermal expansions for the hybrid nanocomposite were investigated and presented below.

4.3.1. Evaluation of Compressive Strength for Al, (Al-10% Al2O3) and (Al-10% Al2O3-0.25%GO) Nanocomposites

The results of compressive strength for Al as a reference matrix, Al-10% Al2O3 and the Al-10% Al2O3- 0.25%GO hybrid nanocomposite are presented in Figure 12. The compressive strength of Al sample measured to be 75MPa significantly increased to 130 MPa for the Al-10% Al2O3 nanocomposite, whereas the compressive strain reduced to 0.4% as compared to the Al sample. This effect could be attributed to the presence of the reinforcing Al2O3 hard nanoparticles. Moreover, the compressive strength further increased in the Al-10% Al2O3-0.25%GO hybrid nanocomposite to values of 180 MPa, about 30% higher than that of Al-10% Al2O3 nanocomposite. This improvement can be attributed to the presence of the uniformly distributed GO filler in the hybrid nanocomposite, leading to an improvement in the interfacial adhesion between Al2O3 and Al without overlapping or agglomeration. However, an increase in the compressive strain for the hybrid composite sample was observed to a value of about 0.52% as compared to the 0.4% compressive strain for Al-10% Al2O3 nanocomposite. This can be attributed to the structure of GO, which contains hydroxide (OH -) and (O -) chains, which in turn, leads to an increase in the length of the C–C bond at each hexagonal lattice as reported by Pop et al. [40]. These bonds will be dominant over Vander Waals attractions in (Al-10%Al2O3-0.25%GO) hybrid nanocomposites, thus results in strain improvement caused by the efficient load transfer from soft Al matrix to hard GO [41].

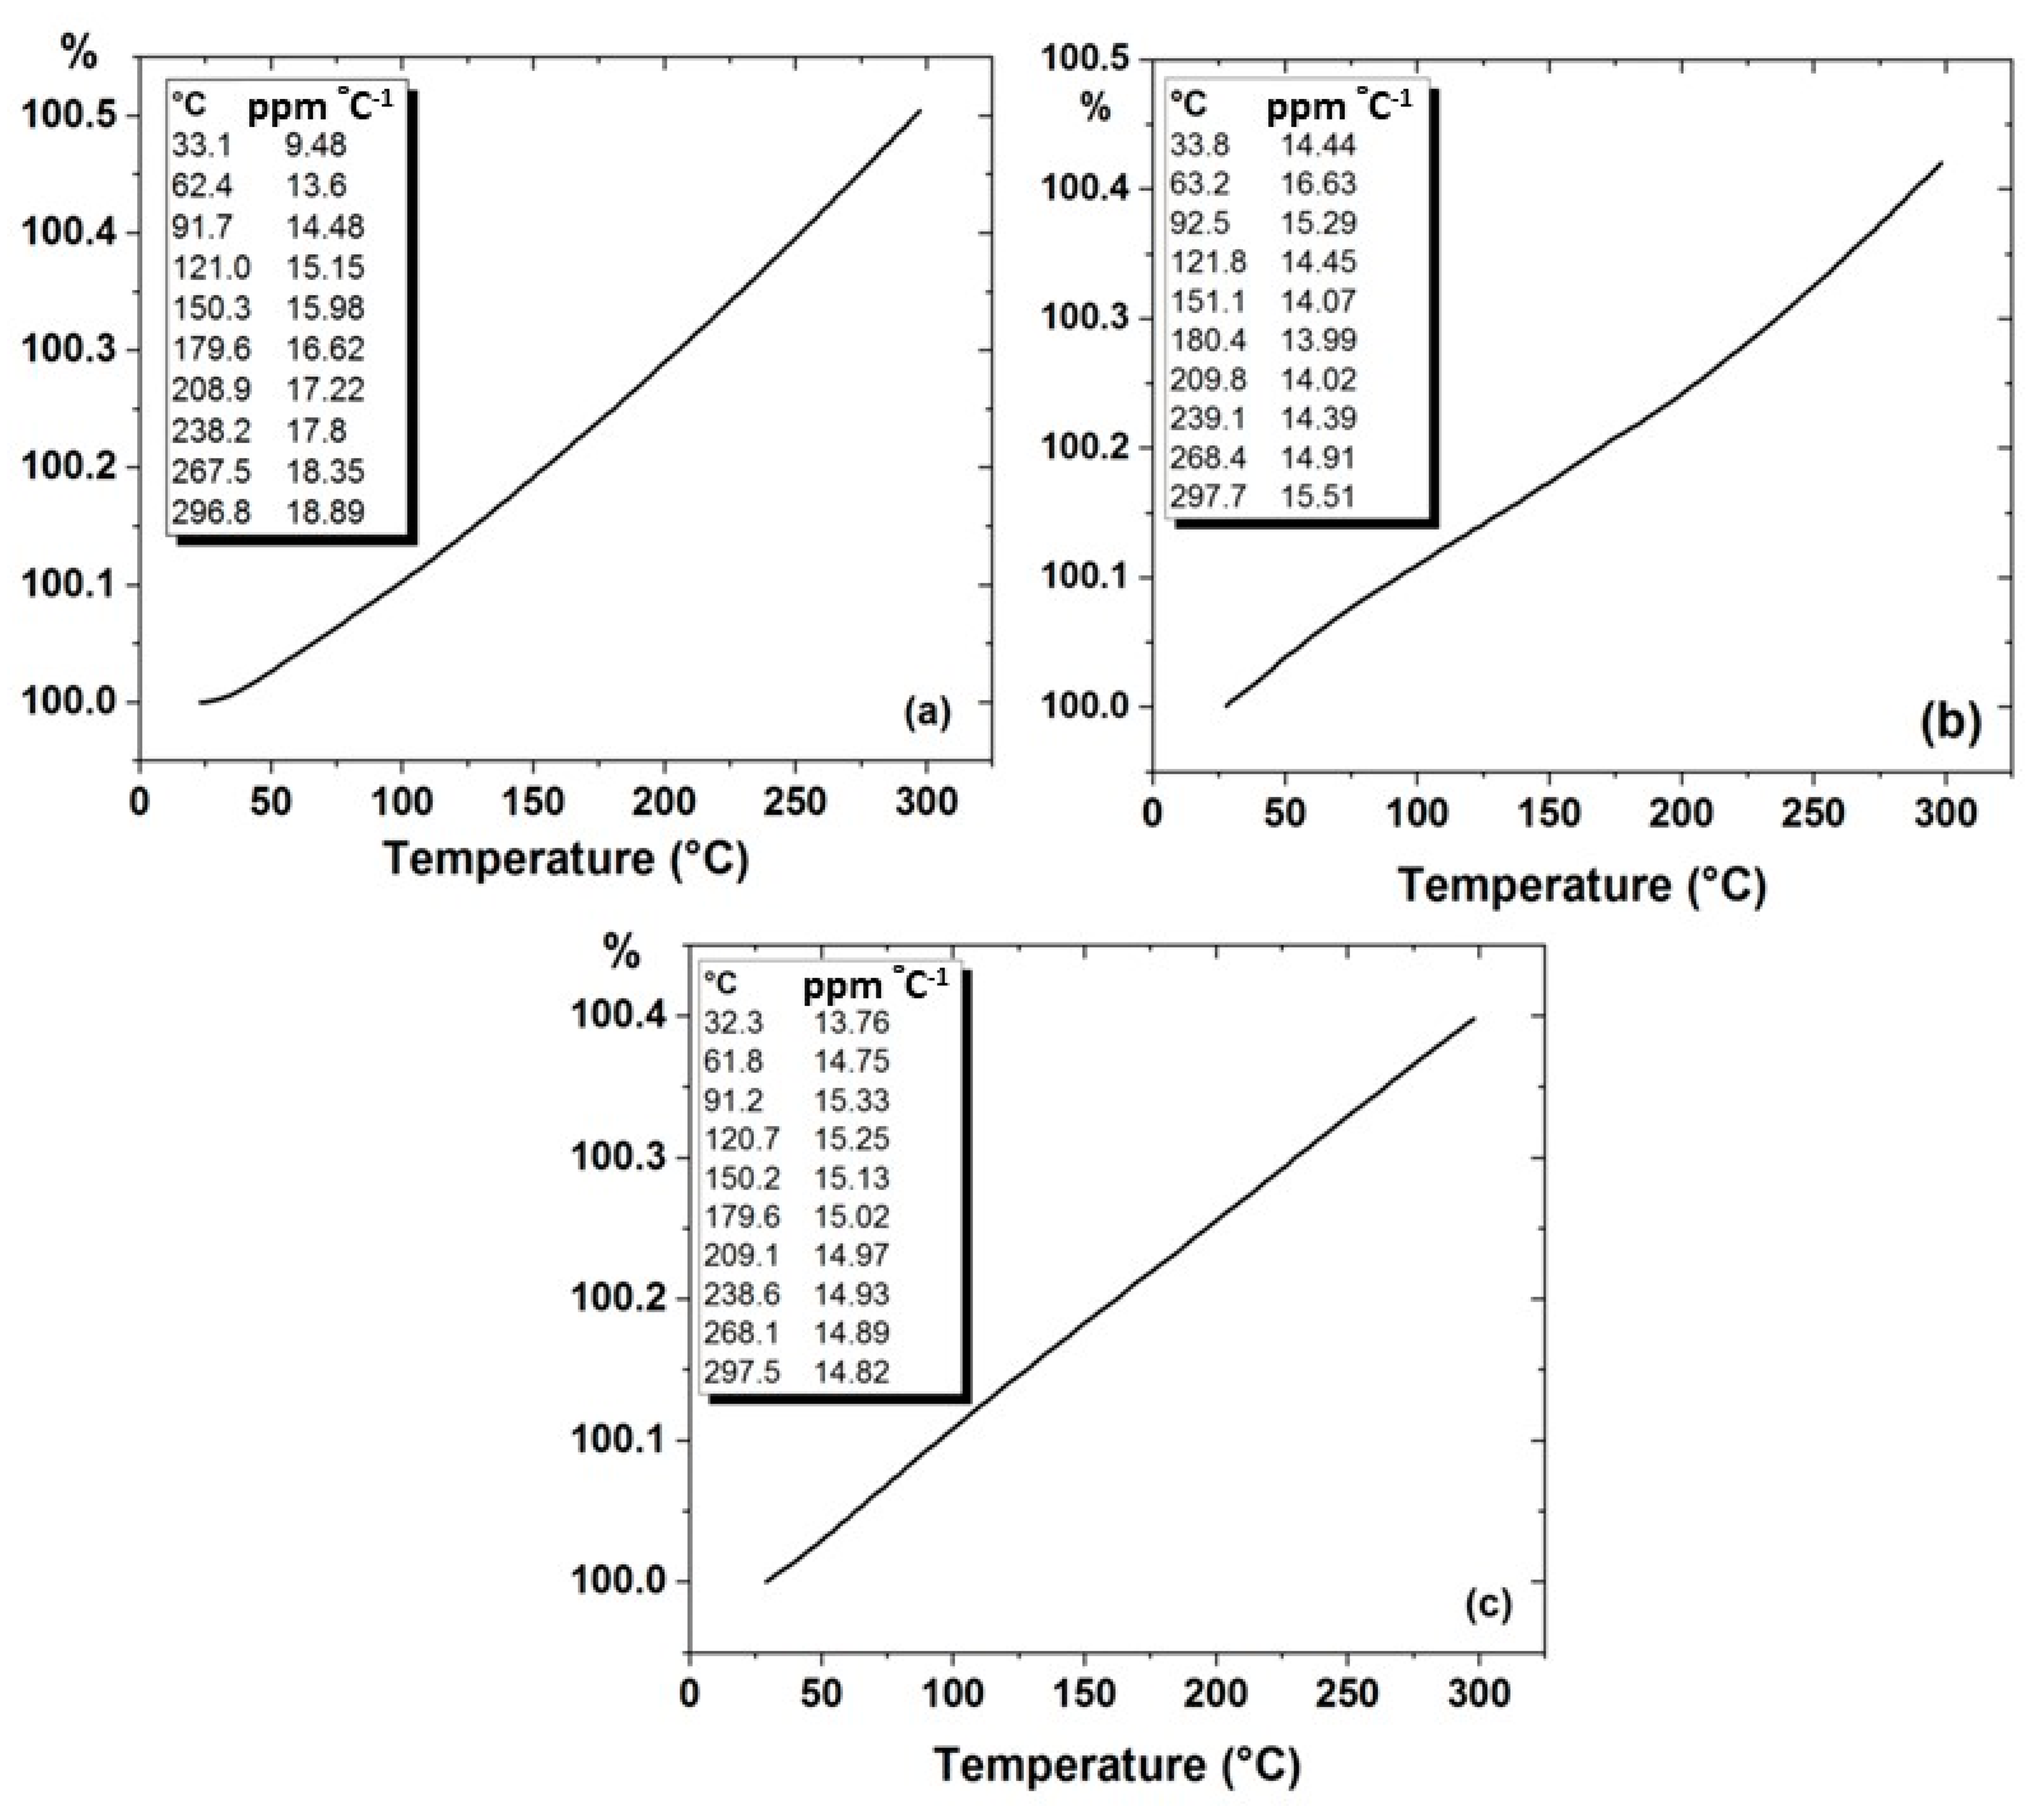
4.3.2. Thermal Expansion Measurement for Al, (Al-10% Al2O3) and (Al-10% Al2O3-0.25%GO) Nanocomposites

Thermal expansion was carried out for the developed SPS samples, and the results obtained are presented in Figure 13. It is observed that the coefficient of thermal expansion linearly increased with increasing temperature for all the developed samples. The thermal expansion of Al which is the reference matrix was found to be 18.89 ppm °C−1, whereas for Al-10% Al2O3 nancomposite it reduced to 15.51 ppm °C−l, leading to a reduction of 17%. Likewise, the thermal expansion further decreased for the Al-10% Al2O3-0.25%GO hybrid nanocomposite to a value of 14.82 ppm °C−1, leading to a reduction of 4.4% in the coefficient of thermal expansion as compared to Al-10% Al2O3 nanocomposite and reduction of 21% as compared to Al.
Generally, the thermal expansion decreased as alumina and GO was incorporated into the matrix. Thermal expansion of metal matrix composites is strongly influenced by voids and the breaking of bonds between constituents of the composite. Increasing the alumina and GO content of the composite coincided with the appearance of voids and porosity resulting in reduced effective thermal strain and lowering the coefficient of thermal expansion of the composite [42]. The thermal expansion of a composite is dominated by the component that has the most outstanding bulk modulus value. The bulk modulus values of aluminium and sintered alumina have been reported to be 62 GPa and 257 GPa, respectively. Additionally, indeed, we observed the lowest thermal expansion values for compositions having the highest tested alumina and GO content and this relationship was likely due to alumina and GO inclusions having a relatively much lower thermal expansion value and high bulk modulus as compared to the aluminium matrix.

4.3.3. Summary of Phase III

From the above results, it can be concluded that the compressive strength was the highest in the hybrid nanocomposite (Al-10% Al2O3-0.25%GO) with a value of 180 MPa compared to (Al-Al2O3) (130 MPa) and Al (75 MPa). Heat flow and area associated with hybrid nanocomposite presented the lowest values as compared to Al and Al-10%Al2O3 nanocomposite. On the other hand, the coefficient of thermal expansion was the lowest for the hybrid nanocomposite sample. Table 4 presents a summary and comparison of thermal and mechanical properties obtained in the present research for the hybrid sample to the mechanical and thermal properties of other developed aluminum composites in the literature.

5. Conclusions

Hybrid aluminum nanocomposites reinforced with alumina and graphene oxide were successfully produced by powder metallurgy technique and spark plasma sintering. The study was conducted in three phases whereby, in phase1, the optimum volume percent of alumina content out of 10%, 20%, 30% was determined. It was found that Al reinforced with 10 vol% Al2O3 resulted in the best mechanical properties due to the uniform dispersion of Al2O3 particles throughout the Al matrix as observed in SEM micrographs. In phase 2, different weight percent of GO (0.25%, 0.5% and 1%) were added to Al-10% Al2O3 to form a hybrid nanocomposite. It was found that Al-10vol% Al2O3-0.25 wt.% GO resulted in the best mechanical properties in terms of hardness. The distribution of GO was identified to be along the Al grain boundaries while the Al2O3 particle were distributed between the grain boundaries of Al grains. XRD results confirmed that no chemical reaction or intermetallic phase was formed in Al-10% Al2O3 and Al-10% Al2O3-0.25%GO. The optimized hybrid nanocomposite was further characterized in phase 3 by measuring its compressive strength and its thermal expansion. It was found that adding 0.25 wt.% of GO into Al-10vol% Al2O3 nanocomposite increased the compressive strength by 30%. Moreover, the Al-10%Al2O3-0.25%GO hybrid nanocomposite showed the lowest coefficient of thermal expansion.

Author Contributions

Data curation, T.S.A., A.S.H. and F.P.; Formal analysis, T.S.A., T.L. and A.S.H.; Funding acquisition, A.S.M.; Investigation, A.S.M. and A.S.H.; Methodology, A.S.M.; Supervision, A.S.M., A.S.H. and T.L.; Validation, T.S.A.; Writing—original draft, A.S.M., F.P.; Writing—review and editing, A.S.M., T.L., F.P. and A.S.H. All authors have read and agreed to the published version of the manuscript.

Funding

This research was funded by Deanship of Scientific Research (DSR) at King Fahd University of Petroleum & Minerals (KFUPM), grant number IN151009” and “The APC was funded by Deanship of Scientific Research (DSR) at King Fahd University of Petroleum & Minerals (KFUPM).

Data Availability Statement

The data presented in this study are available on request from the corresponding author.

Acknowledgments

The authors gratefully acknowledge the financial support provided by the Deanship of Scientific Research (DSR) at King Fahd University of Petroleum & Minerals (KFUPM) through Project No. IN151009.

Conflicts of Interest

The authors declare no conflict of interest.

References

  1. Dursun, T.; Soutis, C. Recent developments in advanced aircraft aluminium alloys. Mater. Des. 2014, 56, 862–871. [Google Scholar] [CrossRef]
  2. Sevik, H.; Kurnaz, S.C. Properties of alumina particulate reinforced aluminum alloy produced by pressure die casting. Mater. Des. 2006, 27, 676–683. [Google Scholar] [CrossRef]
  3. Martins Freitas, B.J.; Jorge Junior, A.M.; Zepon, G.; Kiminami, C.S.; Botta, W.J.; Bolfarini, C. Outstanding Tensile Ductility in High Iron-Containing Al-Si-Cu Alloys. Met. Mater. Trans. A 2020, 51, 2703–2710. [Google Scholar] [CrossRef]
  4. Hutchinson, C.R.; Ringer, S.P. Precipitation processes in Al-Cu-Mg alloys microalloyed with Si. Met. Mater. Trans. A 2000, 31, 2721–2733. [Google Scholar] [CrossRef]
  5. Dev Srivyas, P.; Charoo, M.S. Aluminum metal matrix composites a review of reinforcement; mechanical and tribological behavior. Int. J. Eng. Technol. 2018, 7, 117. [Google Scholar] [CrossRef]
  6. Tjong, S.C. Processing and Deformation Characteristics of Metals Reinforced with Ceramic Nanoparticles, 2nd ed.; Elsevier: Oxford, UK, 2014; Chapter 8; pp. 269–304. [Google Scholar]
  7. Tham, L.M.; Gupta, M.; Cheng, L. Effect of limited matrix—Reinforcement interfacial reaction on enhancing the mechanical properties of aluminium—Silicon carbide composites. Acta Mater. 2001, 49, 3243–3253. [Google Scholar] [CrossRef]
  8. Rana, R.S.; Purohit, R.; Soni, V.K.; Das, S. Characterization of mechanical properties and microstructure of aluminium alloy-SiC composites. Mater. Today Proc. 2015, 2, 1149–1156. [Google Scholar] [CrossRef]
  9. Song, M. Effects of volume fraction of SiC particles on mechanical properties of SiC/Al composites. Trans. Nonferrous Met. Soc. China 2009, 19, 1400–1404. [Google Scholar] [CrossRef]
  10. Kumar, C.A.V.; Rajadurai, J.S. Influence of rutile (TiO2) content on wear and microhardness characteristics of aluminium-based hybrid composites synthesized by powder metallurgy. Trans. Nonferrous Met. Soc. China 2016, 26, 63–73. [Google Scholar] [CrossRef]
  11. Ezatpour, H.R.; Torabi-parizi, M.; Sajjadi, S.A. Microstructure and mechanical properties of extruded Al/Al2O3 composites fabricated by stir-casting process. Trans. Nonferrous Met. Soc. China 2013, 23, 1262–1268. [Google Scholar] [CrossRef]
  12. Zahid, G.H.; Azhar, T.; Musaddiq, M.; Rizvi, S.S.; Ashraf, M.; Hussain, N.; Iqbal, M. In situ processing and aging behaviour of an aluminium/Al2O3 composite. Mater. Des. 2011, 32, 1630–1635. [Google Scholar] [CrossRef]
  13. Razavi-Tousi, S.S.; Yazdani-Rad, R.; Manafi, S.A. Effect of volume fraction and particle size of alumina reinforcement on compaction and densification behavior of Al–Al2O3 nanocomposites. Mater. Sci. Eng. A 2011, 528, 1105–1110. [Google Scholar] [CrossRef]
  14. Jiang, X.; Wang, N.; Zhu, D. Friction and wear properties of in-situ synthesized Al2O3 reinforced aluminum composites. Trans. Nonferrous Met. Soc. China 2014, 24, 2352–2358. [Google Scholar] [CrossRef]
  15. Rahimian, M.; Parvin, N.; Ehsani, N. The effect of production parameters on microstructure and wear resistance of powder metallurgy Al–Al2O3 composite. Mater. Des. 2011, 32, 1031–1038. [Google Scholar] [CrossRef]
  16. Shuvho, M.B.A.; Chowdhury, M.A.; Kchaou, M.; Rahman, A.; Islam, M.A. Surface characterization and mechanical behavior of aluminum based metal matrix composite reinforced with nano Al2O3, SiC, TiO2 particles. Chem. Data Collect. 2020, 100442. [Google Scholar] [CrossRef]
  17. Aybarc, U.; Dispinar, D.; Seydibeyoglu, M.O. Aluminum metal matrix composites with SiC, Al2O3 and graphene—Review. Arch. Foundry Eng. 2018, 18, 5–10. [Google Scholar]
  18. Ozben, T.; Kilickap, E.; Çakır, O. Investigation of mechanical and machinability properties of SiC particle reinforced Al-MMC. Mater. J. Process. Technol. 2008, 198, 220–225. [Google Scholar] [CrossRef]
  19. Huang, Y.; Ouyang, Q.; Zhang, D.; Zhu, J.; Li, R.; Yu, H. Carbon materials reinforced aluminum composites: A review. Acta Met. Sin. Engl. Lett. 2014, 27, 775–786. [Google Scholar] [CrossRef]
  20. Kumar, N.; Chittappa, H.C.; Ezhil Vannan, S. Development of aluminium-nickel coated short carbon fiber metal matrix composites. Mater. Today Proc. 2018, 5, 11336–11345. [Google Scholar] [CrossRef]
  21. Wang, S.; Zhang, Y.; Sun, P.; Cui, Y.; Wu, G. Microstructure and flexural properties of Z-pinned carbon fiber-reinforced aluminum matrix composites. Materials 2019, 12, 174. [Google Scholar] [CrossRef] [Green Version]
  22. Sharma, P.; Sharma, S.; Khanduja, D. Effect of graphite reinforcement on physical and mechanical properties of aluminum metal matrix composites. Part. Sci. Technol. 2016, 34, 17–22. [Google Scholar] [CrossRef]
  23. Moshier, W.C. Nonequilibrium alloying of graphite-reinforced aluminum metal matrix composites. In Corrosion; NACE International: Houston, TX, USA, 1993; Volume 49, Number 10. [Google Scholar]
  24. Jagannatham, M.; Chandran, P.; Sankaran, S.; Haridoss, P.; Nayan, N.; Bakshi, S.R. Tensile properties of carbon nanotubes reinforced aluminum matrix composites: A review. Carbon N. Y. 2020, 160, 14–44. [Google Scholar] [CrossRef]
  25. Sridhar, I.; Narayanan, K.R. Processing and characterization of MWCNT reinforced aluminum matrix composites. J. Mater. Sci. 2009, 44, 1750–1756. [Google Scholar] [CrossRef]
  26. Munir, K.; Wen, C.; Li, Y. Graphene nanoplatelets-reinforced magnesium metal matrix nanocomposites with superior mechanical and corrosion performance for biomedical applications. J. Magnes. Alloy. 2020, 8, 269–290. [Google Scholar] [CrossRef]
  27. Seyed Pourmand, N.; Asgharzadeh, H. aluminum matrix composites reinforced with graphene: A review on production, microstructure, and properties. Crit. Rev. Solid State Mater. Sci. 2019, 1–49. [Google Scholar] [CrossRef]
  28. Lian, W.; Mai, Y.; Wang, J.; Zhang, L.; Liu, C.; Jie, X. Fabrication of graphene oxide-Ti3AlC2 synergistically reinforced copper matrix composites with enhanced tribological performance. Ceram. Int. 2019, 45, 18592–18598. [Google Scholar] [CrossRef]
  29. Dasari, B.L.; Morshed, M.; Nouri, J.M.; Brabazon, D.; Naher, S. Mechanical properties of graphene oxide reinforced aluminium matrix composites. Compos. Part B Eng. 2018, 145, 136–144. [Google Scholar] [CrossRef]
  30. Khoshghadam-Pireyousefan, M.; Rahmanifard, R.; Orovcik, L.; Švec, P.; Klemm, V. Application of a novel method for fabrication of graphene reinforced aluminum matrix nanocomposites: Synthesis, microstructure, and mechanical properties. Mater. Sci. Eng. A 2020, 772, 138820. [Google Scholar] [CrossRef]
  31. Nyanor, P.; Hamada, K.; Nakamura, A.S.; Hassan, M.A.; El-Kady, O.; Yehia, H.M. Effect of carbon nanotube (cnt) content on the hardness, wear resistance and thermal expansion of in-situ reduced graphene oxide (rGO)-reinforced aluminum matrix composites. Met. Mater. Int. Jan. 2019. [CrossRef]
  32. Yigezu, S.; Mahapatra, B.M.; Jha, P. Influence of reinforcement type on microstructure, hardness, and tensile properties of an aluminum alloy metal matrix composite. J. Min. Mater. Charact. Eng. 2014, 1. [Google Scholar] [CrossRef] [Green Version]
  33. Alaneme, K.K.; Aluko, A.O. Fracture toughness (K1C) and tensile properties of as-cast and age-hardened aluminium (6063)–silicon carbide particulate composites. Sci. Iran. 2012, 19, 992–996. [Google Scholar] [CrossRef] [Green Version]
  34. Rajmohan, T.; Palanikumar, K.; Ranganathan, S. Evaluation of mechanical and wear properties of hybrid aluminium matrix composites. Trans. Nonferrous Met. Soc. China 2013, 23, 2509–2517. [Google Scholar] [CrossRef]
  35. Ravindran, P.; Manisekar, K.; Rathika, P.; Narayanasamy, P. Tribological properties of powder metallurgy—Processed aluminium self lubricating hybrid composites with SiC additions. Mater. Des. 2013, 45, 561–570. [Google Scholar] [CrossRef]
  36. Sharifi, E.M.; Karimzadeh, F. Wear behavior of aluminum matrix hybrid nanocomposites fabricated by powder metallurgy. Wear 2011, 271, 1072–1079. [Google Scholar] [CrossRef]
  37. Alaneme, K.K.; Sanusi, K.O. Microstructural characteristics, mechanical and wear behaviour of aluminium matrix hybrid composites reinforced with alumina, rice husk ash and graphite. Eng. Sci. Technol. Int. J. 2015, 18, 416–422. [Google Scholar] [CrossRef] [Green Version]
  38. Jacob Gajakosh, A.K.; Jagadeesha, T. Mechanical, tribological and theological studies on hybrid aluminium matrix composite reinforced with silicon carbide and reduced graphene oxide. Mater. Today Proc. 2020, 24, 343–349. [Google Scholar] [CrossRef]
  39. Orrù, R.; Licheri, R.; Locci, A.M.; Cincotti, A.; Cao, G. Consolidation/synthesis of materials by electric current activated/assisted sintering. Mater. Sci. Eng. R Rep. 2009, 63, 127–287. [Google Scholar] [CrossRef]
  40. Pop, E.; Varshney, V.; Roy, A.K. Thermal properties of Graphene: Fundamentals and applications. MRS Bull. 2012, 37, 1273–1281. [Google Scholar] [CrossRef] [Green Version]
  41. Rashad, M.; Pan, F.; Yu, Z.; Asif, M.; Lin, H.; Pan, R. Investigation on microstructural, mechanical and electrochemical properties of aluminum composites reinforced with graphene nanoplatelets. Nat. Sci. Mater. Int. 2015, 25, 460–470. [Google Scholar]
  42. Irshad, H.M.; Hakeem, A.S.; Ahmed, B.A.; Ali, S.; Ehsan, M.A.; Laoui, T. Effect of Ni content and Al2O3 particle size on the thermal and mechanical properties of Al2O3/Ni composites prepared by spark plasma sintering. Int. J. Refract. Met. Hard Mater. 2018, 76, 25–32. [Google Scholar] [CrossRef]
  43. Dash, K.; Chaira, D.; Ray, B.C. Synthesis and characterization of aluminium–alumina micro- and nano-composites by spark plasma sintering. Mater. Res. Bull. 2013, 48, 2535–2542. [Google Scholar] [CrossRef]
  44. Elshina, L.A.; Muradymov, R.V.; Kvashnichev, A.G.; Vichuzhanin, D.I.; Molchanova, N.G.; Pankratov, A.A. Synthesis of new metal-matrix Al–Al2O3–graphene composite materials. Russ. Met. 2017, 8, 631–641. [Google Scholar] [CrossRef]
  45. Sadeghi, B.; Shamanian, M.; Ashrafizadeh, F.; Cavaliere, P.; Sanayei, M.; Szpunar, J.A. Microstructural behaviour of spark plasma sintered composites containing bimodal micro- and nano-sized Al2O3 particles. Powder Metall. 2018, 61, 50–63. [Google Scholar] [CrossRef]
  46. Firestein, K.L.; Corthay, S.; Steinman, A.E.; Matveev, A.T.; Kovalskii, A.M.; Sukhorukova, I.V.; Golberg, D.; Shtansky, D.V. High-strength aluminum-based composites reinforced with BN, AlB2 and AlN particles fabricated via reactive spark plasma sintering of Al-BN powder mixtures. Mater. Sci. Eng. A 2017, 681, 1–9. [Google Scholar] [CrossRef] [Green Version]
  47. Saheb, N.; Iqbal, Z.; Khalil, A.; Hakeem, A.S.; Aqeeli, N.A.; Laoui, T.; Al-Qutub, A.; Kirchner, R. Spark plasma sintering of metals and metal matrix nanocomposites: A review. J. Nanomater. 2012, 2012. [Google Scholar] [CrossRef] [Green Version]
Figure 1. (ac) SEM and (df) XRD for the as received powders of (d) Al, (e) Al2O3, (f) GO.
Nanomaterials 11 01225 g001
Figure 2. SEM images (backscattered) of Al mixed with (a) 10 vol%, (b) 20 vol%, and (c) 30 vol% Al2O3 powders.
Nanomaterials 11 01225 g002
Figure 3. SEM images of the samples after SPS. (a) Al-10 vol% Al2O3. (b) Al-20 vol% Al2O3.
Nanomaterials 11 01225 g003
Figure 4. Relative density of Al, Al-10 vol% Al2O3, Al-20 vol% Al2O3. Inset: Theoretical densities of the different samples.
Nanomaterials 11 01225 g004
Figure 5. Variation of Hardness for Al, Al-10 vol% Al2O3, Al-20 vol% Al2O3.
Nanomaterials 11 01225 g005
Figure 6. SEM images (backscattered) of the powders after mixing for (a) Al-10% Al2O3-0.25% GO. (b) Al-10% Al2O3-0.5% GO. (c) Al-10% Al2O3-1%GO.
Nanomaterials 11 01225 g006
Figure 7. A SEM of SPS samples (a) Al-10% Al2O3-0.25% GO (b) 10% Al2O3-0.5% GO (c) 10% Al2O3-1 % GO. (d,e) from the fractured sample (Al-10% Al2O3-1%GO). (fh) EDS-mapping for the fractured sample (Al-10% Al2O3-1%GO) revealing the distribution of Al2O3 of the grain boundaries of Al hybrid.
Nanomaterials 11 01225 g007
Figure 8. Relative density for Al-10% Al2O3-Y% GO hybrid nanocomposite Inset: Relative densities of pure Al and Al-10% Al2O3.
Nanomaterials 11 01225 g008
Figure 9. Hardness results for (Al-10% Al2O3- Y% GO) hybrid nanocomposites.
Nanomaterials 11 01225 g009
Figure 10. Raman spectroscopy for GO, Al-10% Al2O3-0.25%GO, Al-10% Al2O3-0.5%GO, and Al-10% Al2O3-1%GO hybrid nanocomposites samples.
Nanomaterials 11 01225 g010
Figure 11. Normalized XRD spectrums the developed nanocomposite samples (Al-10%Al2O3) and hybrid nanocomposite (Al-10%Al2O3-0.25, 0.5, 1%GO).
Nanomaterials 11 01225 g011
Figure 12. Compression test results for Al, Al-10% Al2O3 and Al-10% Al2O3-0.25% GO.
Nanomaterials 11 01225 g012
Figure 13. Thermal expansion of (a) Al, (b) Al-10% Al2O3, (c) Al-10% Al2O3-0.25% GO.
Nanomaterials 11 01225 g013
Table 1. XRF analysis of the as received powders.
MaterialContentwt.%
Aluminum (Al) PowderAl>99.5
Si<0.25
Fe<0.15
Ti<0.25
Alumina PowderAl2O399.88
SiO20.034
P2O50.0085
S0.026
K2O0.027
TiO20.0022
V2O50.0041
MnO0.0016
Graphene Oxide (GO)C77
O222
Other1
Table 2. Ball milling parameters used for mixing the nanocomposite and the hybrid nanocomposite powders.
MaterialSpeed (RPM)BPRMixing Time (Hours)PCAAtmosphere
Al\X% Al2O3 nanocomposite powder20010:124 hEthanolArgon
Al\X% Al2O3\Y% GO hybrid nanocomposite powder20010:148 hEthanolArgon
Table 3. Spark plasma sintering parameters used for preparing the nanocomposite and the hybrid nanocomposite samples.
MaterialTemp (°C)Pressure (MPa)Holding Time (min)Heating Rate (°C/min)
Al\X% Al2O3 nanocomposite powder5505010200
Al\X% Al2O3\Y% GO hybrid nanocomposite powder5505010200
Table 4. Summary of physical/mechanical and thermal properties of aluminum composites in the literature.
MaterialSynthesis MethodDensity (%)Hardness (HV)Tensile Strength (TS)/Compressive Strength (CS MPa)Thermal Expansion (ppm °C−1)Reference
Al–0.2 wt.% GOUniaxial compaction + tube furnace sintering36[29]
Al–4 wt.% Cu - 1 wt.% GOSPS99.26125320 (TS)[30]
Al–7 wt.% Al2O3SPS93.638.77-[43]
Al–10% Al2O3-0.2% GrapheneIn situ melt casting19879.91 (TS)[44]
Al–10 wt.% Al2O3SPS95.588565 (TS)[45]
Al-7 wt.% BNSPS134170 (TS)[46]
Al-10 wt.% Al2O3Uniaxial compaction + tube furnace sintering98.181-[15]
Al-20 wt.% TiB2SPS96180540 (TS)[47]
Al-10%Al2O3-0.25%GOSPS96.863.2184(CS)14.82Present research
Publisher’s Note: MDPI stays neutral with regard to jurisdictional claims in published maps and institutional affiliations.

