
The Effect of High Lignin Content on Oxidative Nanofibrillation of Wood Cell Wall


 ,
,  and
and 
Abstract
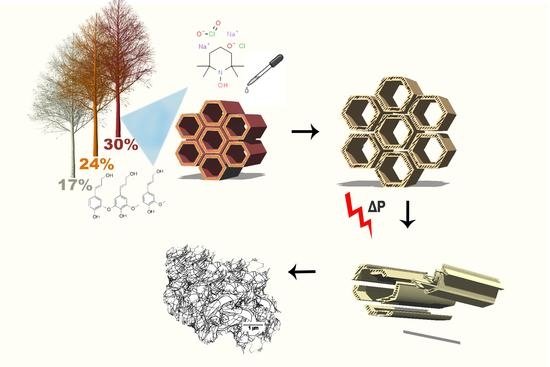
1. Introduction
2. Materials and Methods
2.1. Materials
2.2. Oxidation and Homogenisation
2.3. Viscosity of CNF Suspensions
2.4. Carboxylate Content
2.5. Atomic Force Microscopy
2.6. Process and Nanofibril Yield
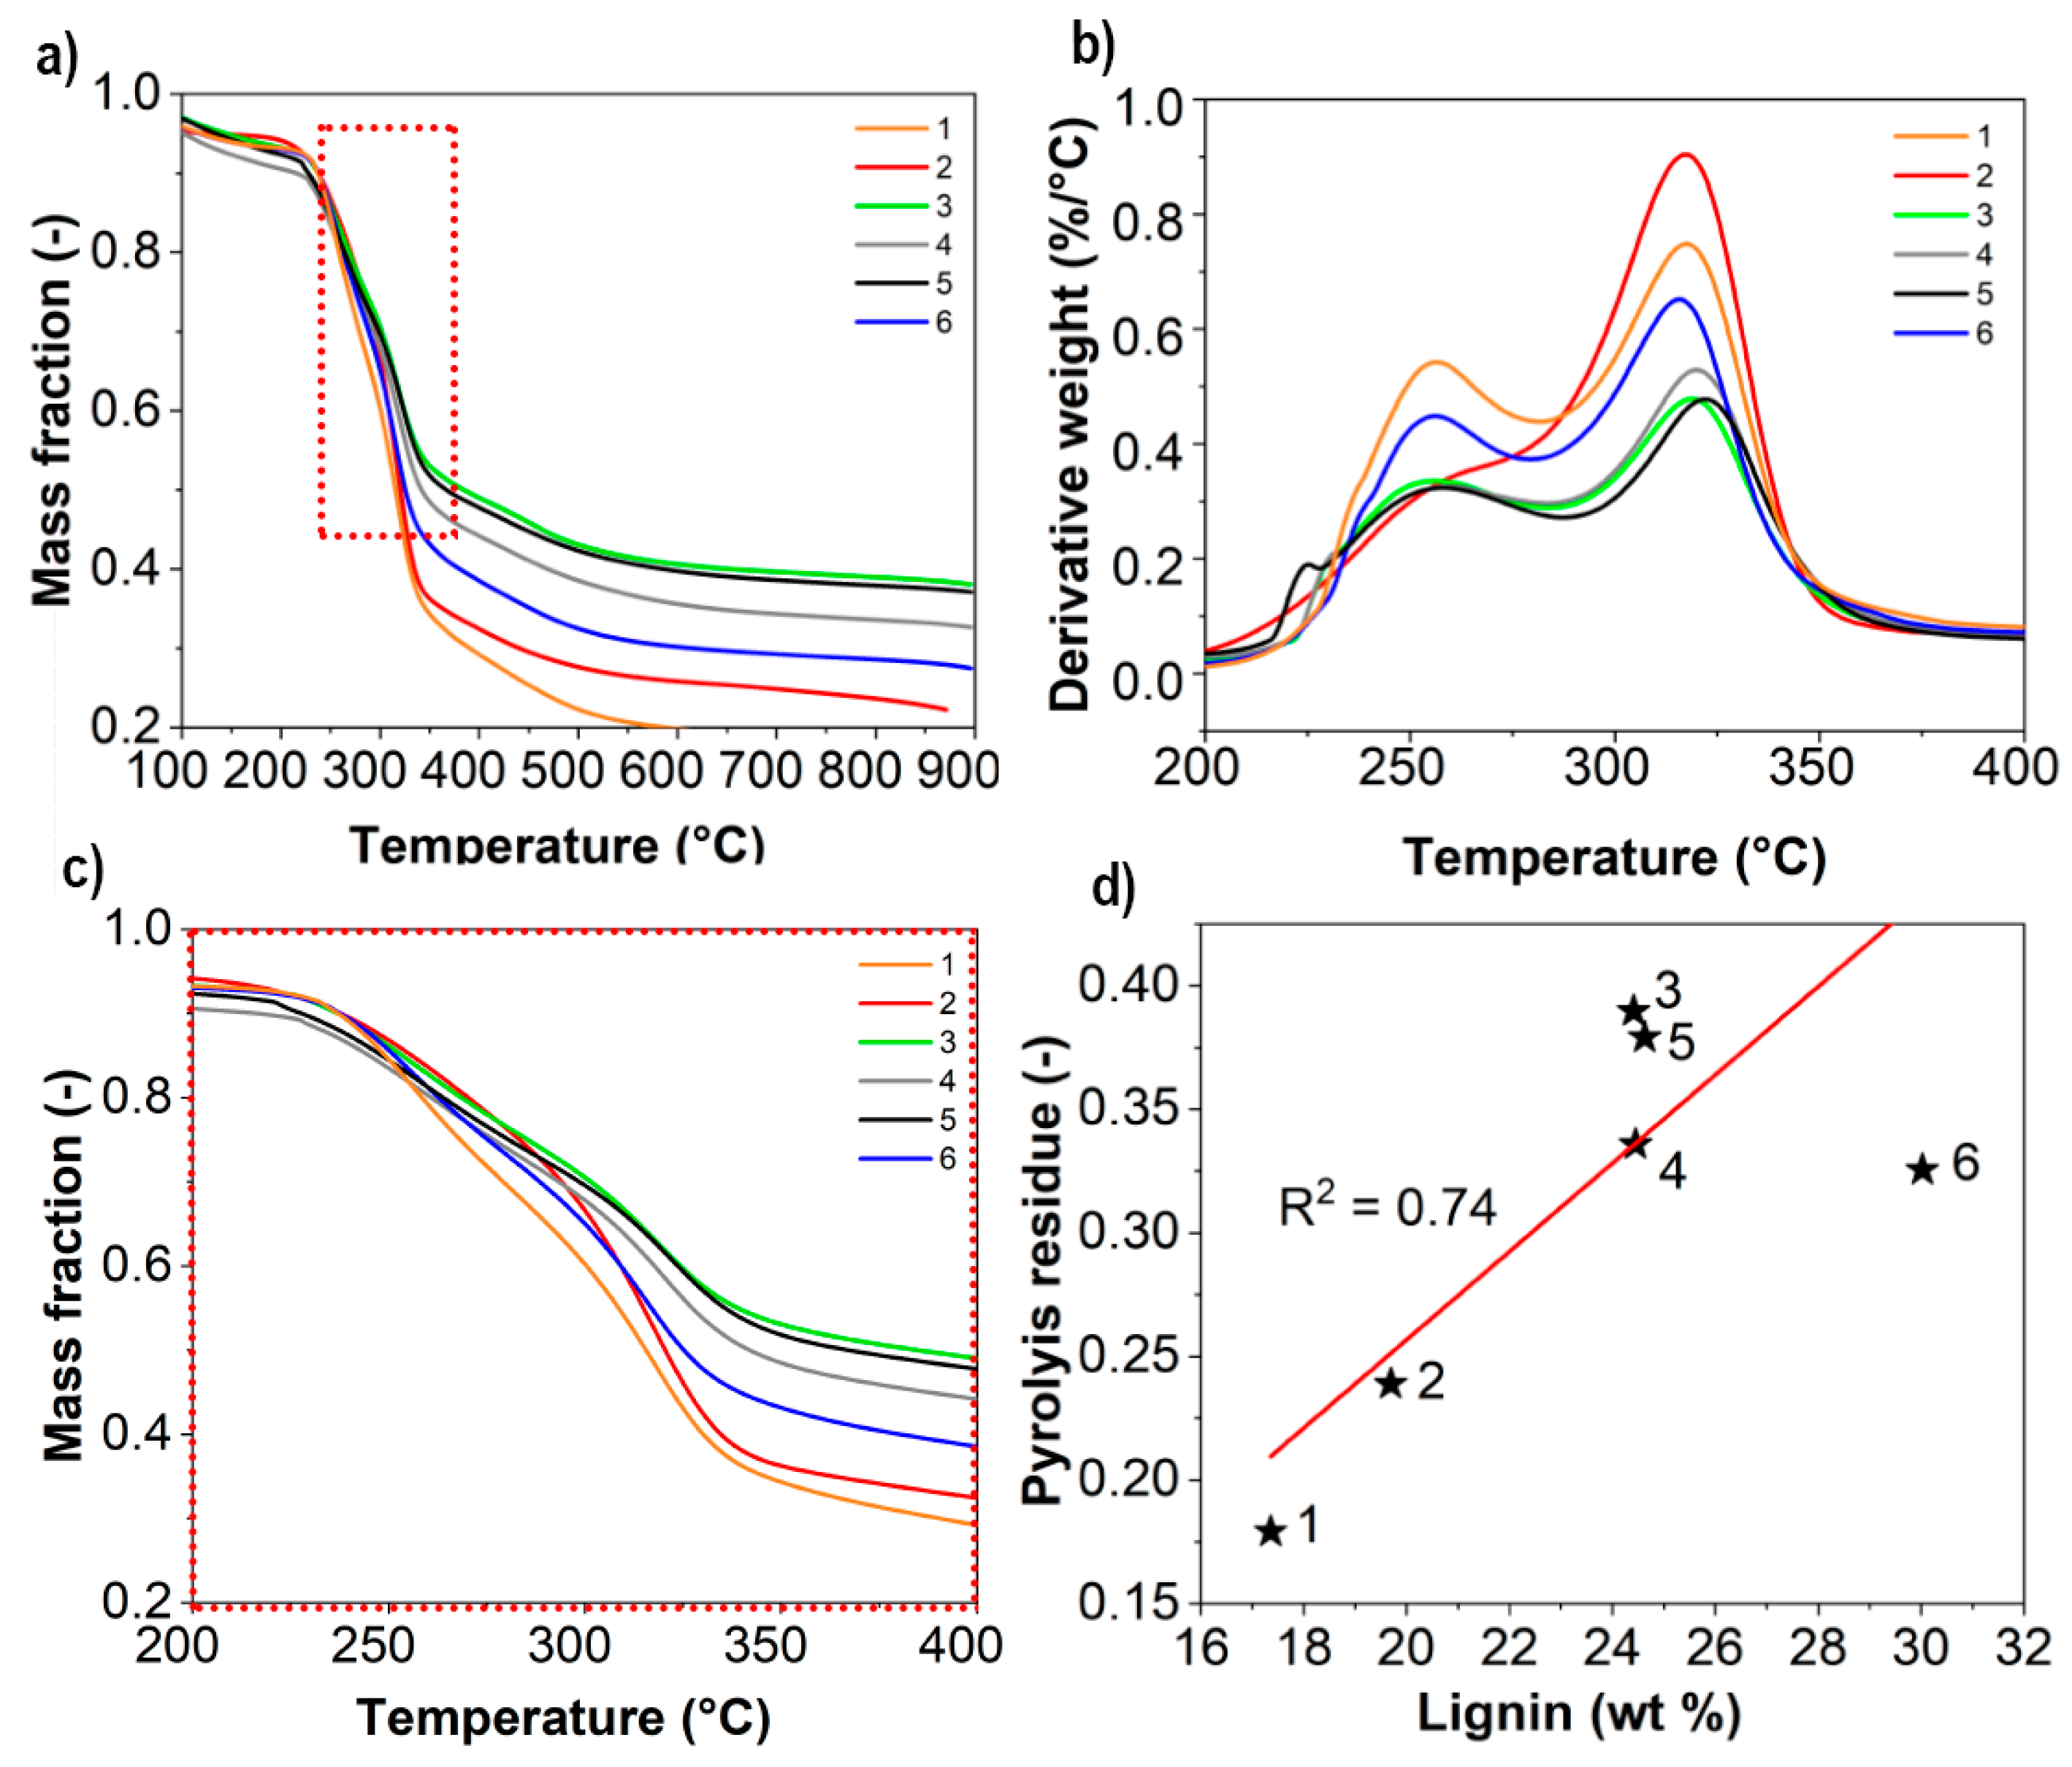
2.7. Thermogravimetric Analysis
2.8. Klason Lignin and Cellulose Content
2.9. Network Manufacturing
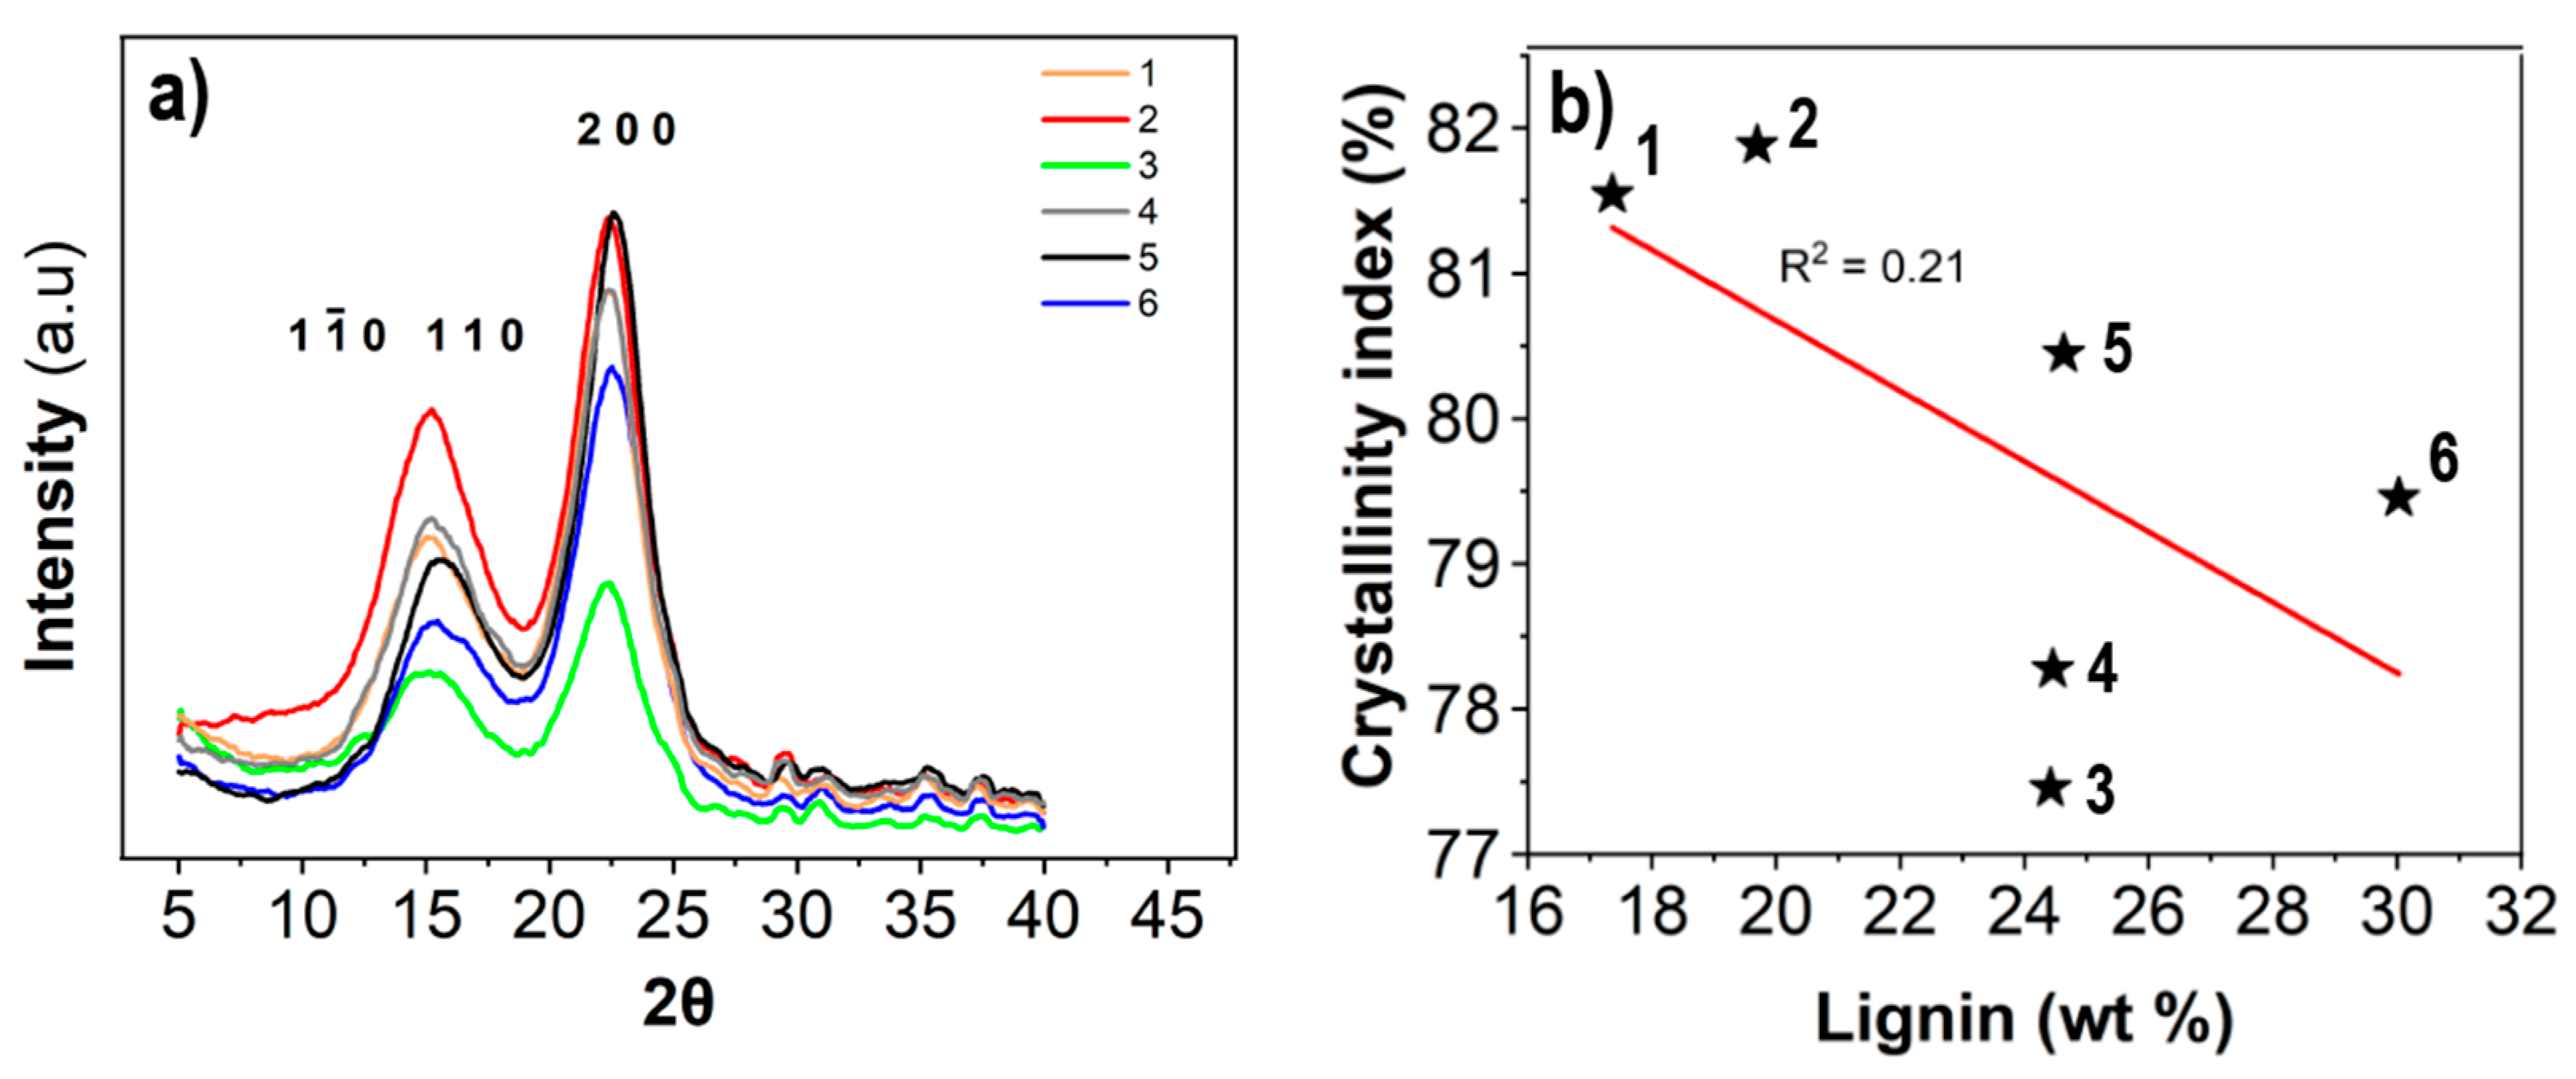
2.10. X-ray Diffraction
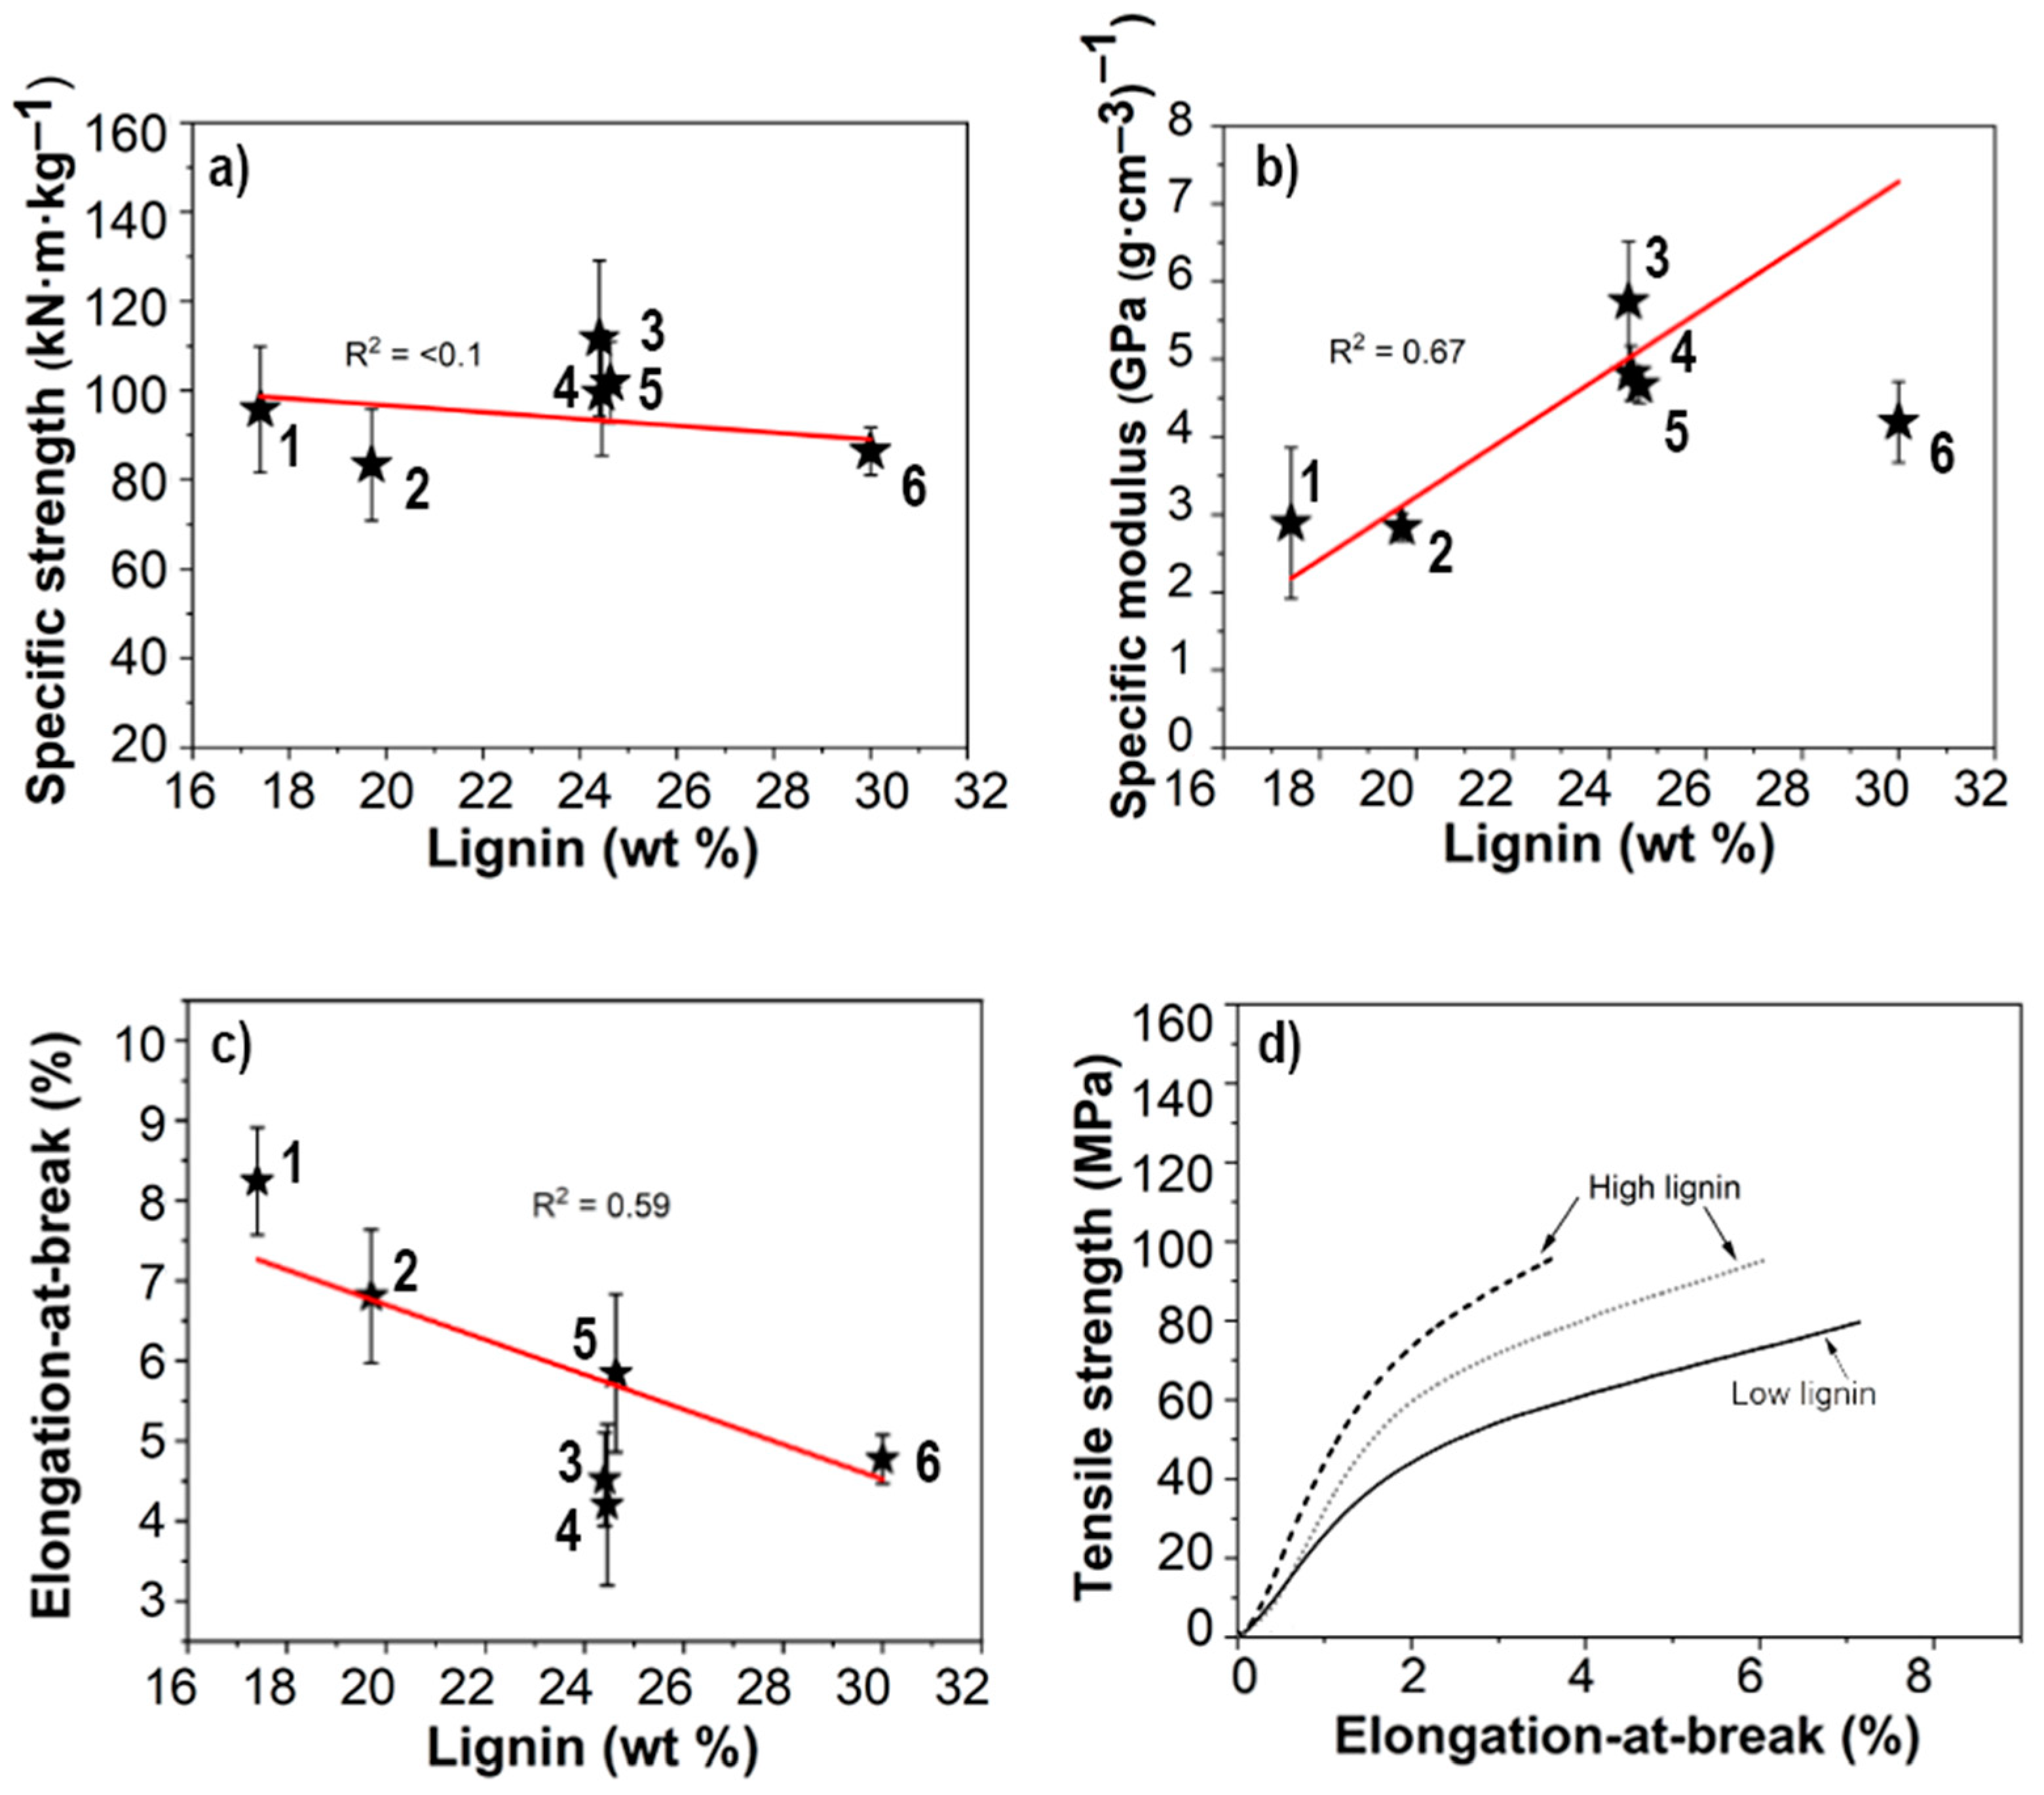
2.11. Mechanical Testing
2.12. Sample Porosity and Moisture Content
2.13. Wood Porosity Analysis
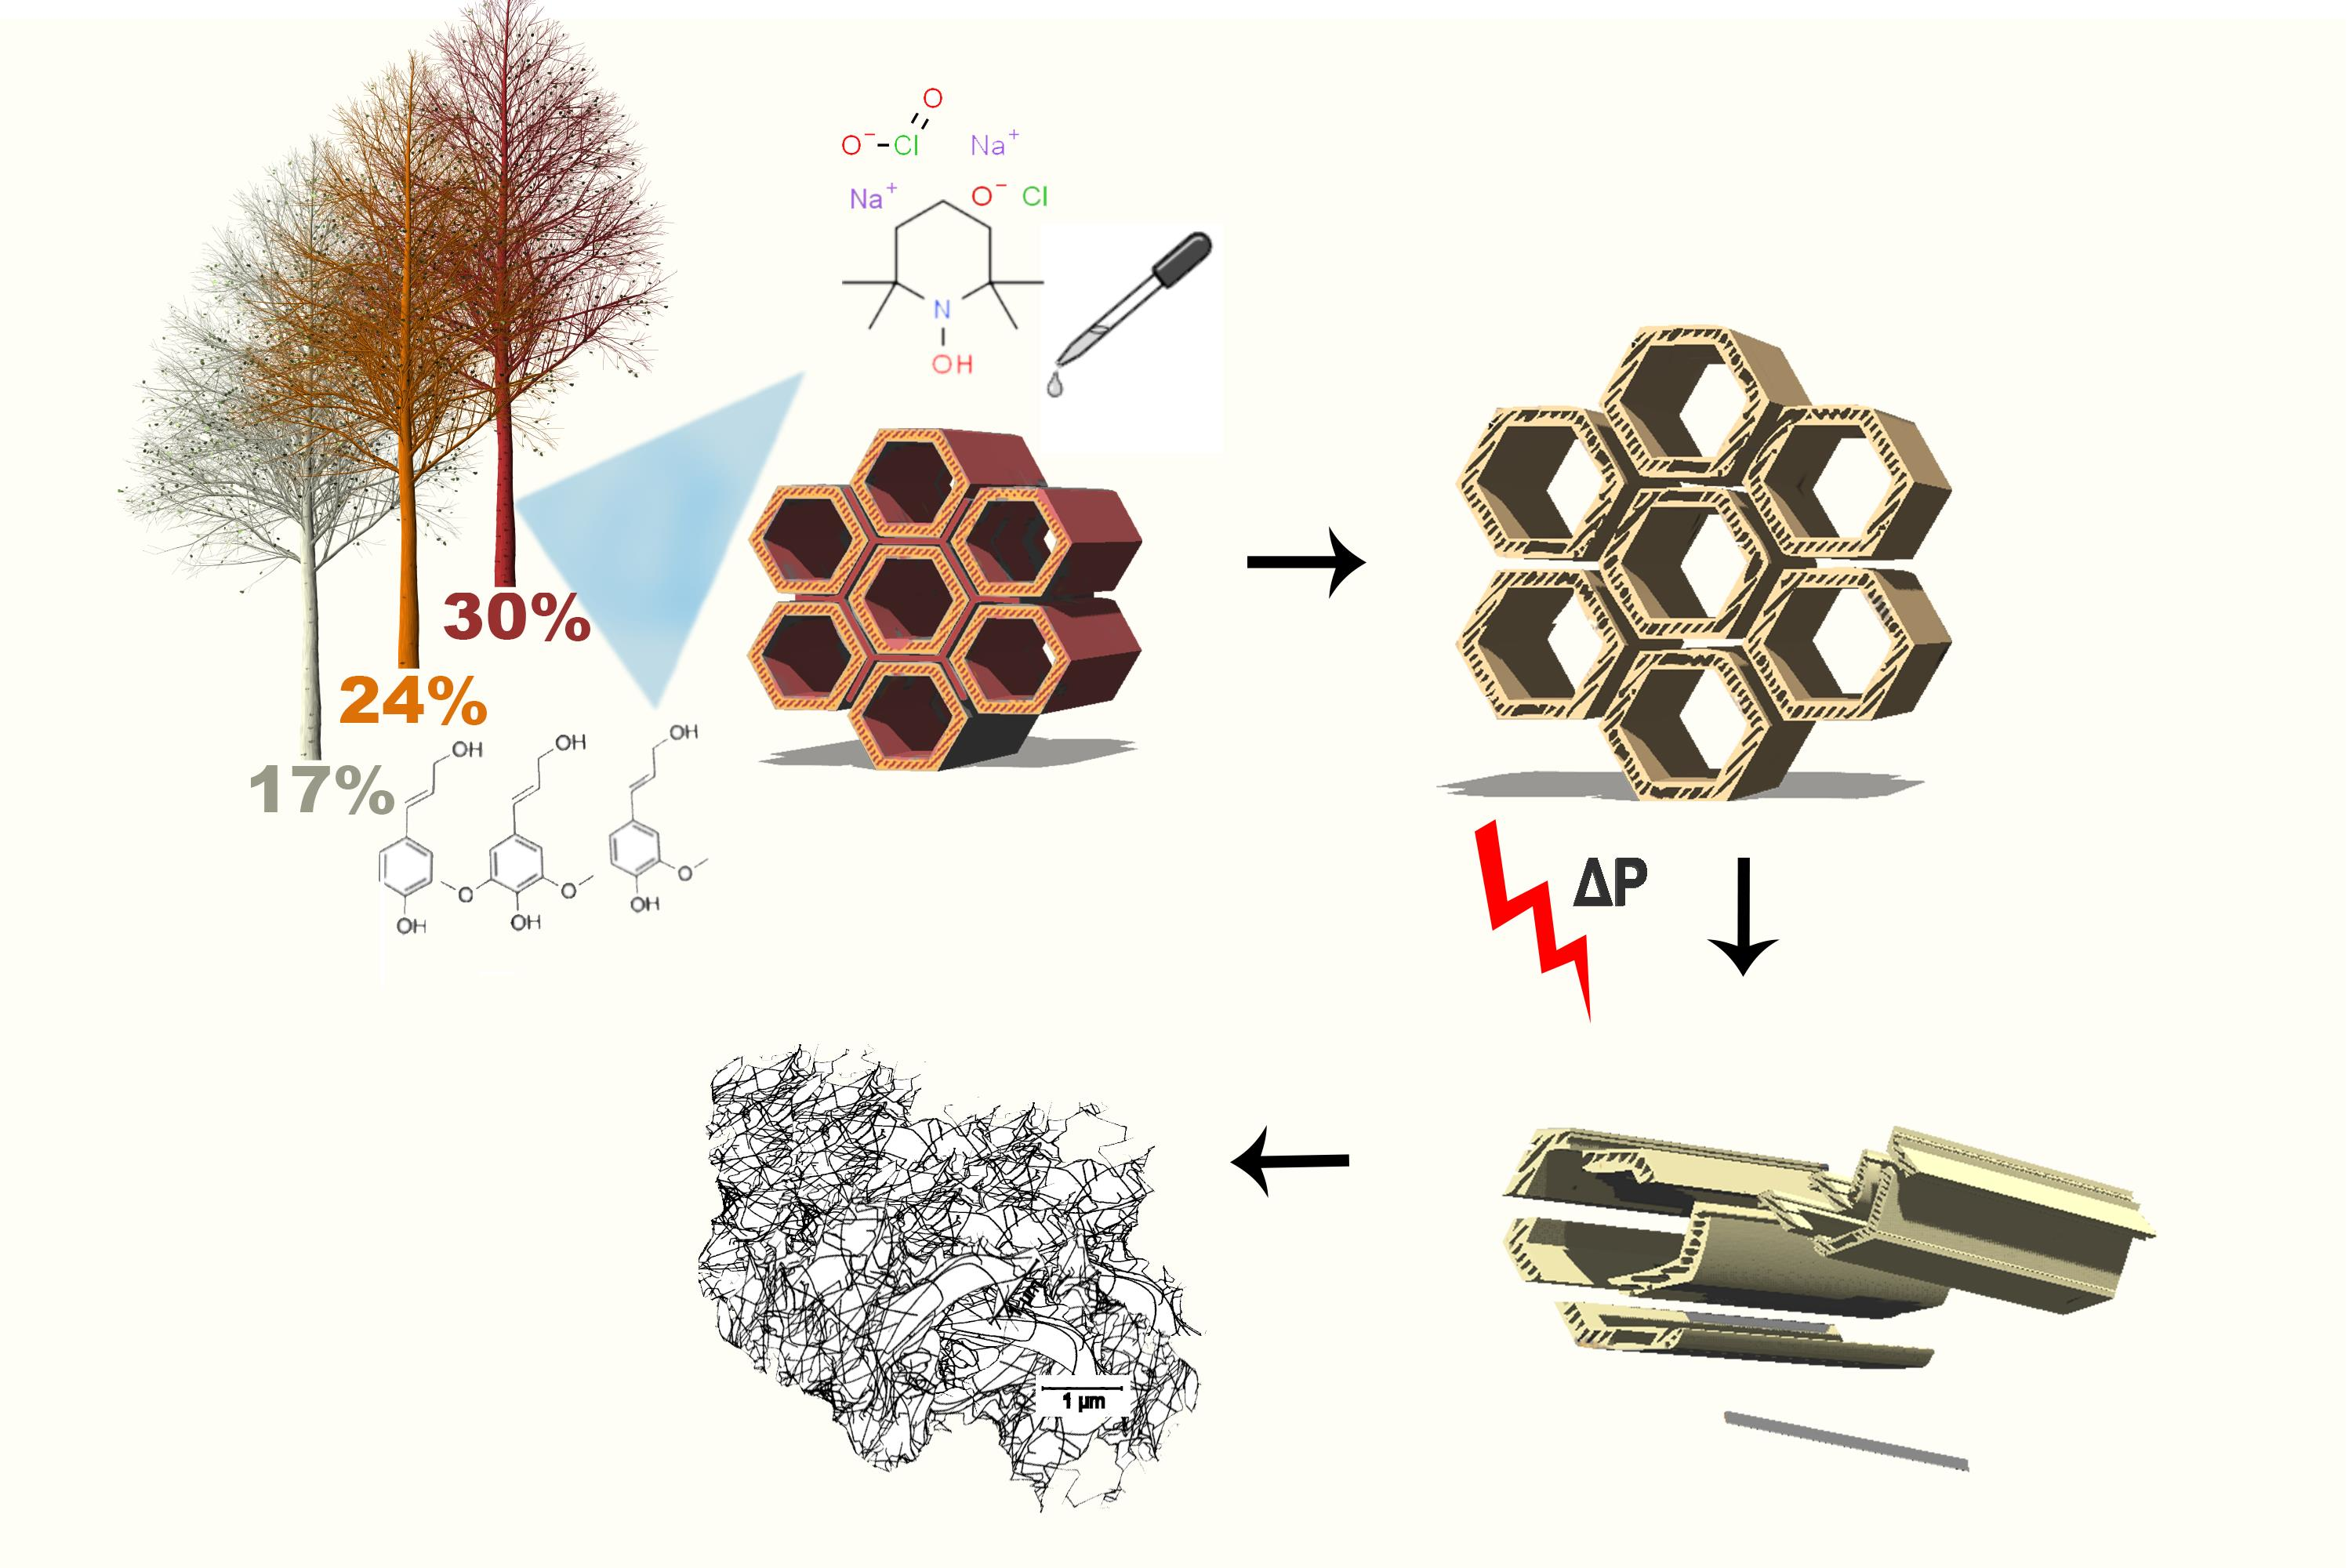
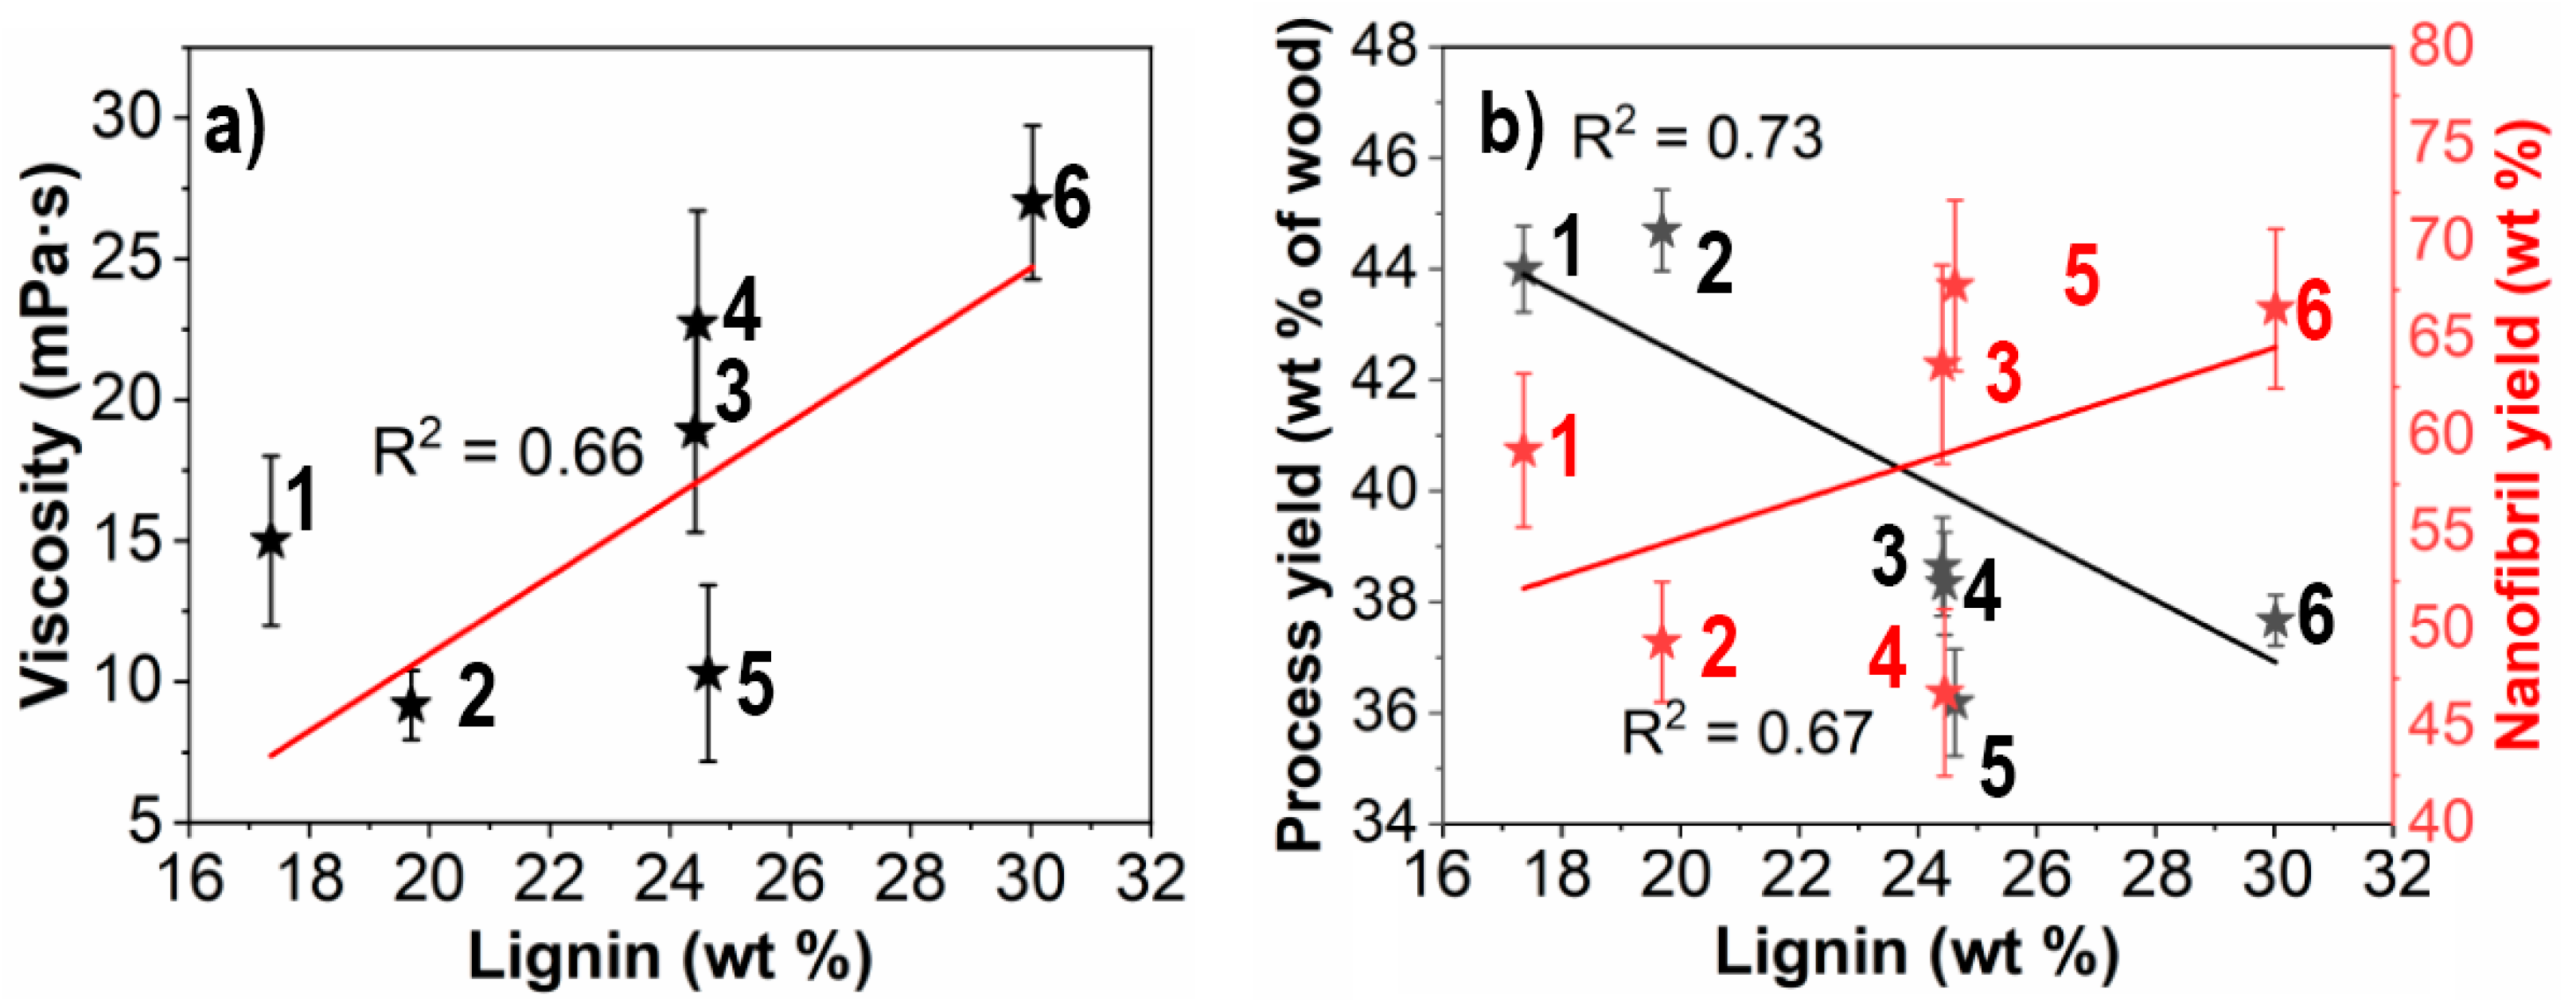
3. Results and Discussion
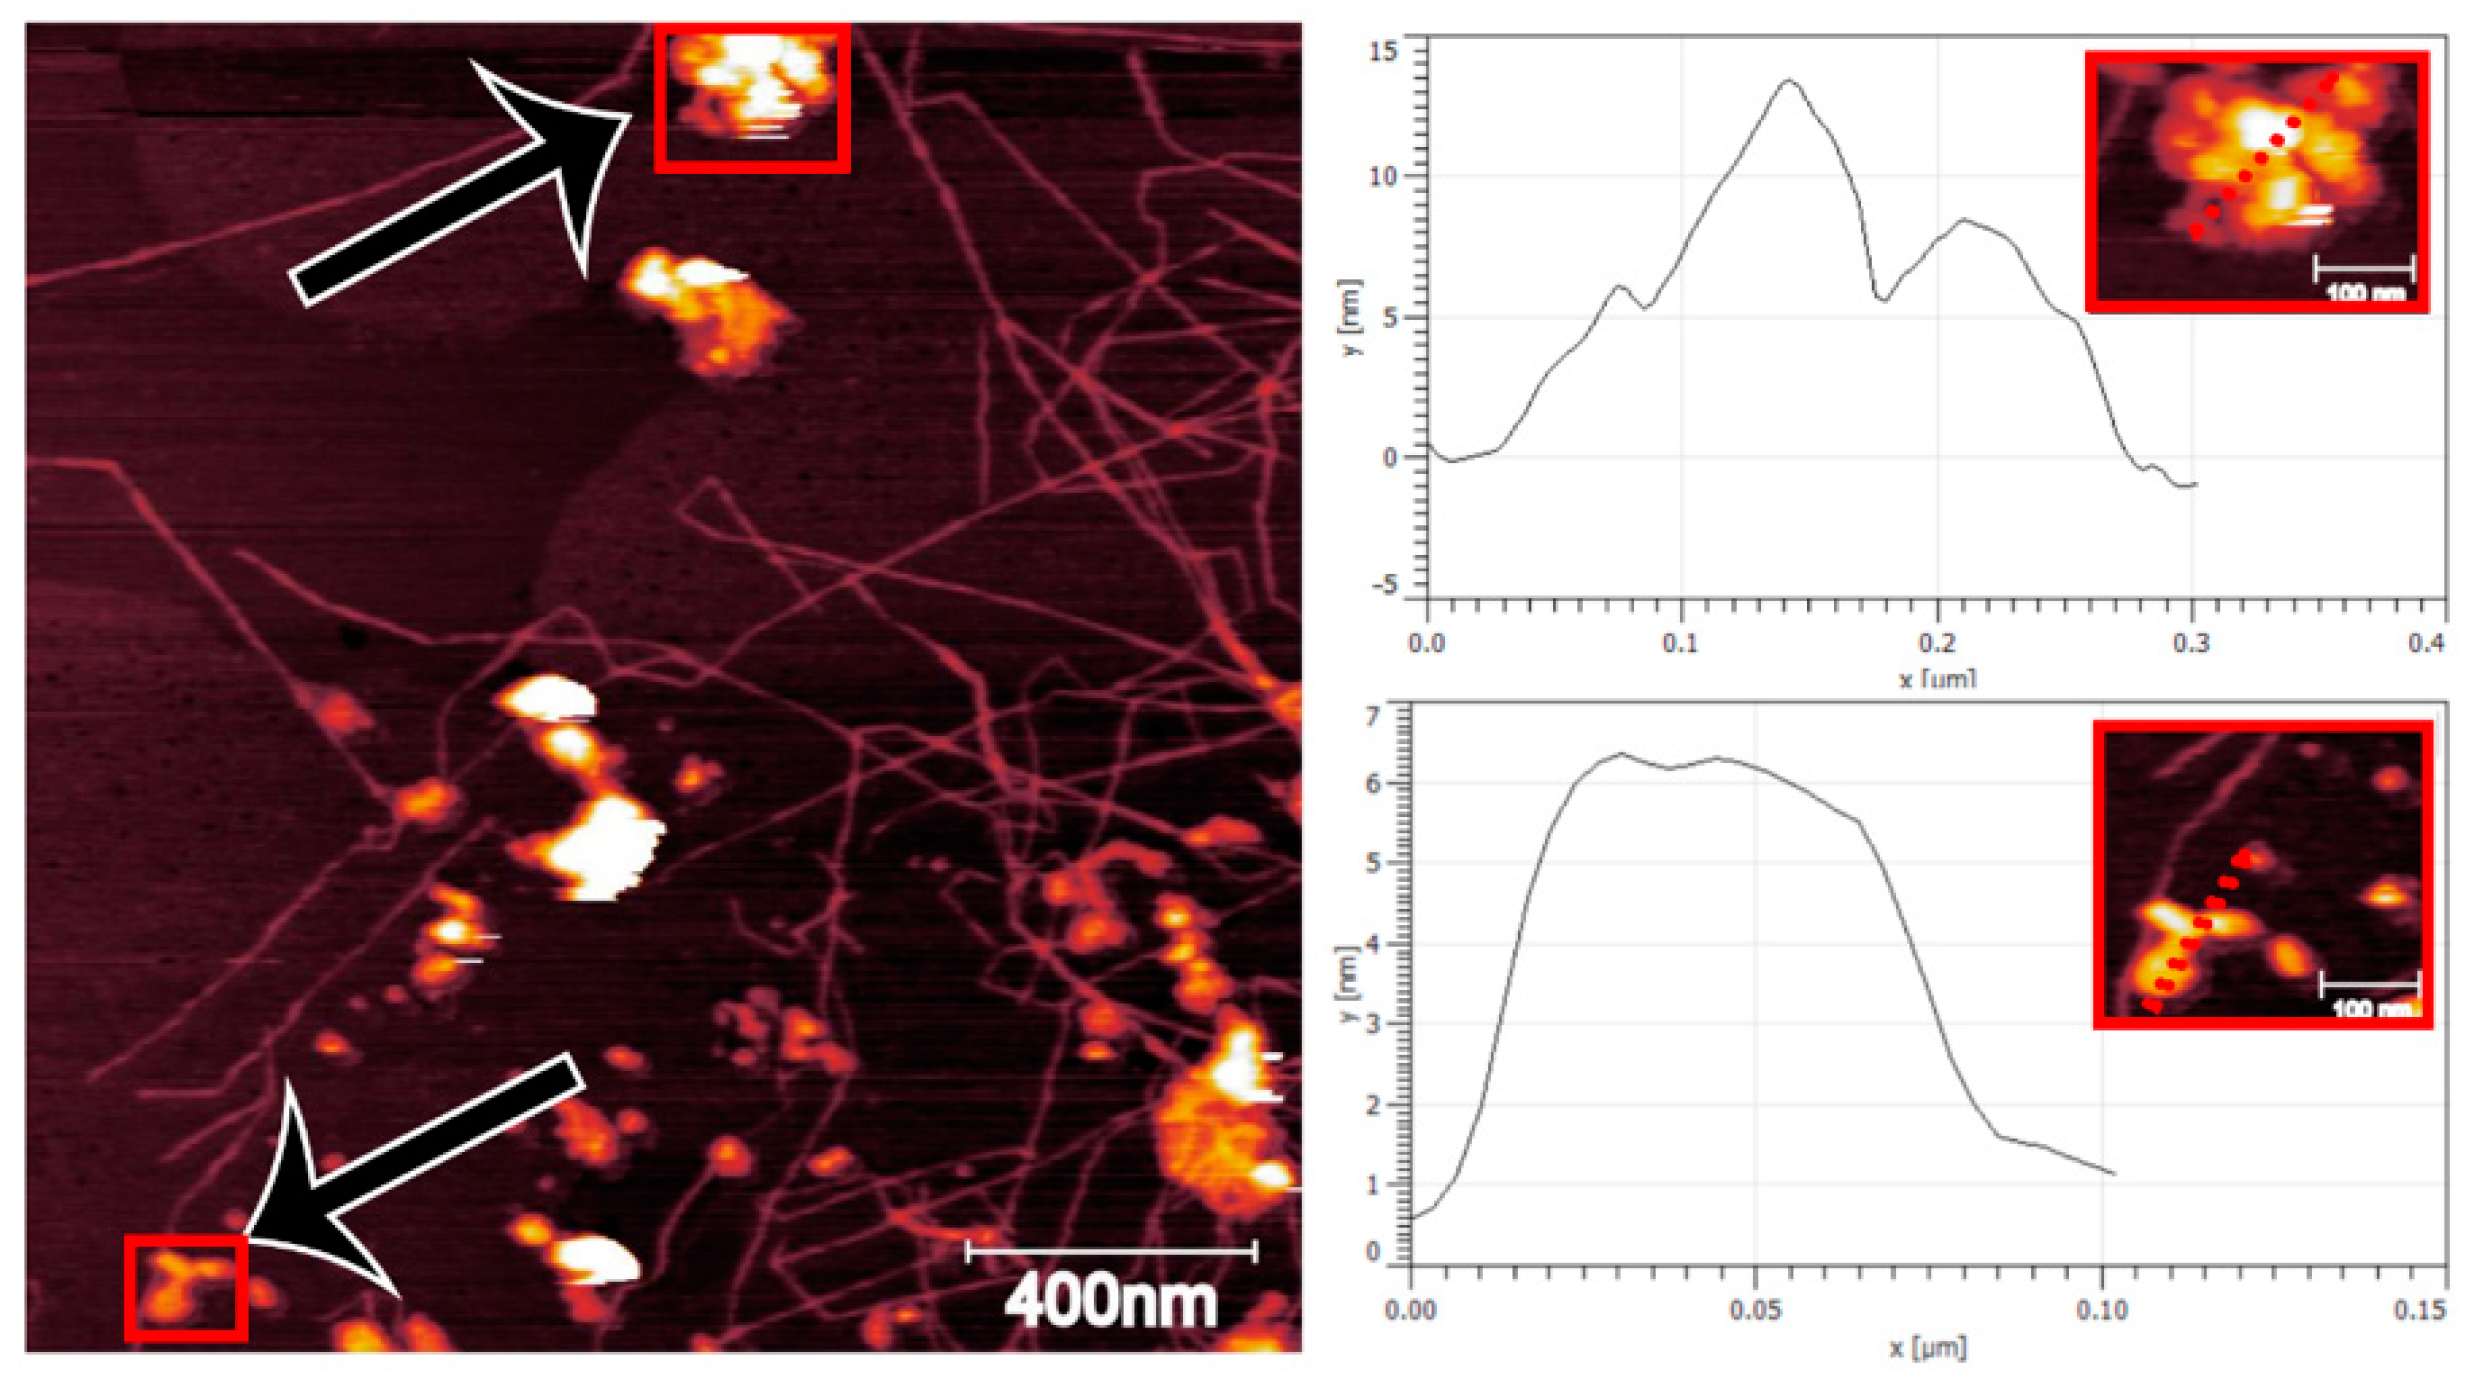
3.1. Fibrillation Efficiency and Nanofibril Characteristics
3.2. Dry Network Characteristics
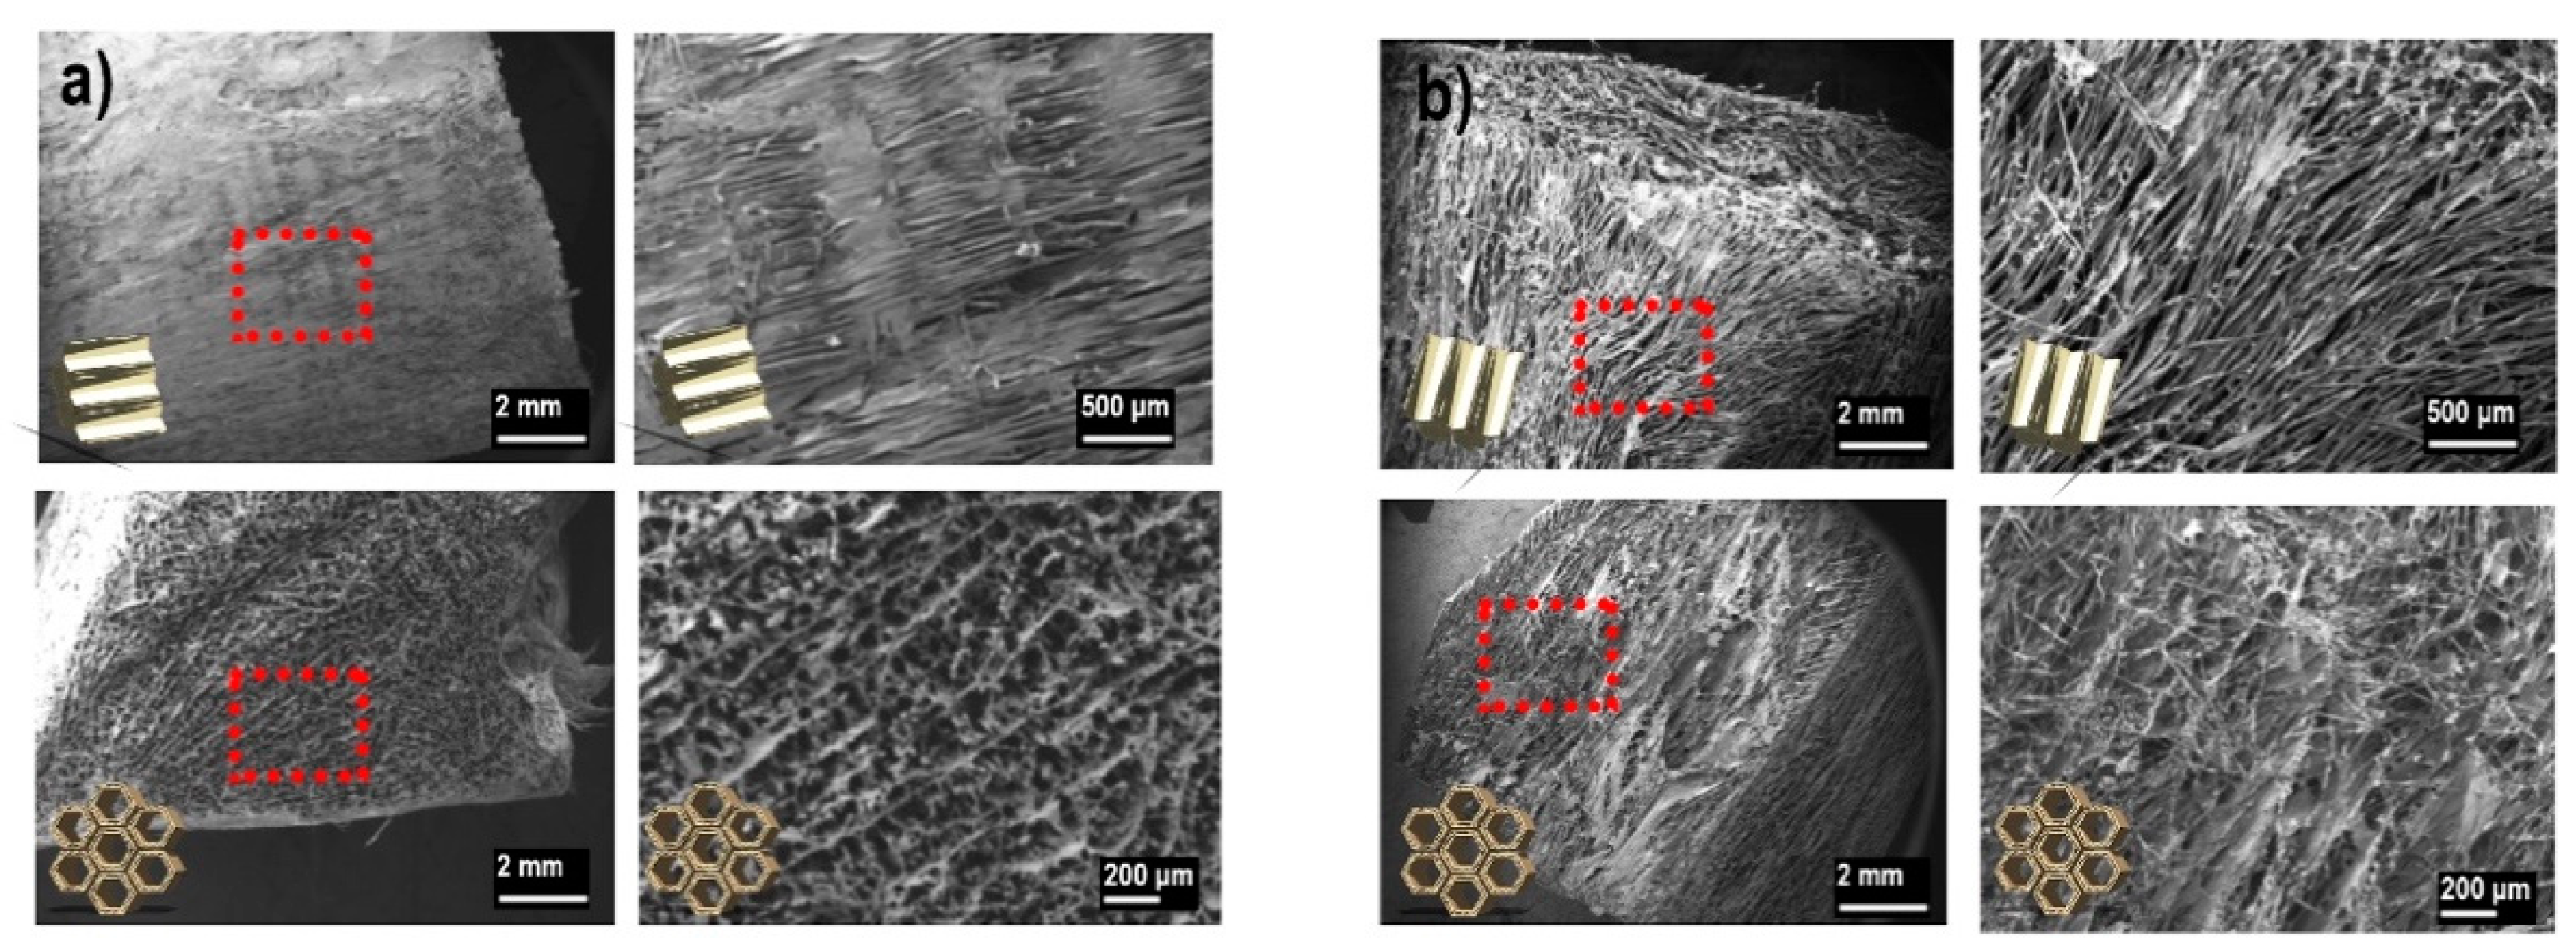
3.3. Wood Porosity Hypothesis
3.4. Outlook and Limitations
4. Conclusions
Supplementary Materials
Author Contributions
Funding
Data Availability Statement
Acknowledgments
Conflicts of Interest
References
- Himmel, M.E.; Ding, S.-Y.; Johnson, D.K.; Adney, W.S.; Nimlos, M.R.; Brady, J.W.; Foust, T.D. Biomass recalcitrance: Engineering plants and enzymes for biofuels production. Science 2007, 315, 804–807. [Google Scholar] [CrossRef] [PubMed]
- Lee, S.H.; Chang, F.; Inoue, S.; Endo, T. Increase in enzyme accessibility by generation of nanospace in cell wall supramolecular structure. Bioresour. Technol. 2010, 101, 7218–7223. [Google Scholar] [CrossRef]
- Morales, L.O.; Iakovlev, M.; Martin-Sampedro, R.; Rahikainen, J.L.; Laine, J.; van Heiningen, A.; Rojas, O.J. Effects of residual lignin and heteropolysaccharides on the bioconversion of softwood lignocellulose nanofibrils obtained by SO2-ethanol-water fractionation. Bioresour. Technol. 2014, 161, 55–62. [Google Scholar] [CrossRef] [PubMed]
- Nechyporchuk, O.; Belgacem, M.N.; Bras, J. Production of cellulose nanofibrils: A review of recent advances. Ind. Crops Prod. 2016, 93, 2–25. [Google Scholar] [CrossRef]
- Shibata, I.; Isogai, A. Depolymerization of cellouronic acid during TEMPO-mediated oxidation. Cellulose 2003, 10, 151–158. [Google Scholar] [CrossRef]
- Isogai, A.; Hänninen, T.; Fujisawa, S.; Saito, T. Review: Catalytic oxidation of cellulose with nitroxyl radicals under aqueous conditions. Prog. Polym. Sci. 2018, 86, 122–148. [Google Scholar] [CrossRef]
- Ma, P.; Fu, S.; Zhai, H.; Law, K.; Daneault, C. Influence of TEMPO-mediated oxidation on the lignin of thermomechanical pulp. Bioresour. Technol. 2012, 118, 607–610. [Google Scholar] [CrossRef]
- Puangsin, B.; Soeta, H.; Saito, T.; Isogai, A. Characterization of cellulose nanofibrils prepared by direct TEMPO-mediated oxidation of hemp bast. Cellulose 2017, 24, 3767–3775. [Google Scholar] [CrossRef]
- Jonasson, S.; Bünder, A.; Niittylä, T.; Oksman, K. Isolation and characterization of cellulose nanofibers from aspen wood using derivatizing and non-derivatizing pretreatments. Cellulose 2020, 27, 185–203. [Google Scholar] [CrossRef]
- Herrera, M.; Thitiwutthisakul, K.; Yang, X.; Rujitanaroj, P.O.; Rojas, R.; Berglund, L. Preparation and evaluation of high-lignin content cellulose nanofibrils from eucalyptus pulp. Cellulose 2018, 25, 3121–3133. [Google Scholar] [CrossRef]
- Wen, Y.; Yuan, Z.; Liu, X.; Qu, J.; Yang, S.; Wang, A.; Wang, C.; Wei, B.; Xu, J.; Ni, Y. Preparation and Characterization of Lignin-Containing Cellulose Nanofibril from Poplar High-Yield Pulp via TEMPO-Mediated Oxidation and Homogenization. ACS Sustain. Chem. Eng. 2019, 7, 6131–6139. [Google Scholar] [CrossRef]
- Spence, K.L.; Venditti, R.A.; Habibi, Y.; Rojas, O.J.; Pawlak, J.J. The effect of chemical composition on microfibrillar cellulose films from wood pulps: Mechanical processing and physical properties. Bioresour. Technol. 2010, 101, 5961–5968. [Google Scholar] [CrossRef]
- Kaffashsaie, E.; Yousefi, H.; Nishino, T.; Matsumoto, T.; Mashkour, M.; Madhoushi, M.; Kawaguchi, H. Direct conversion of raw wood to TEMPO-oxidized cellulose nanofibers. Carbohydr. Polym. 2021, 262, 117938. [Google Scholar] [CrossRef] [PubMed]
- Gerber, L.; Eliasson, M.; Trygg, J.; Moritz, T.; Sundberg, B. Multivariate curve resolution provides a high-throughput data processing pipeline for pyrolysis-gas chromatography/mass spectrometry. J. Anal. Appl. Pyrolysis 2012, 95, 95–100. [Google Scholar] [CrossRef]
- TAPPI. Alpha-, Beta- and Gamma-Cellulose in Pulp; Test Methods T 203 C; Technical Association of the Pulp and Paper Industry: Atlanta, GA, USA, 1999. [Google Scholar]
- Saito, T.; Hirota, M.; Tamura, N.; Kimura, S.; Fukuzumi, H.; Heux, L.; Isogai, A. Individualization of nano-sized plant cellulose fibrils by direct surface carboxylation using TEMPO catalyst under neutral conditions. Biomacromolecules 2009, 10, 1992–1996. [Google Scholar] [CrossRef]
- Saito, T.; Isogai, A. TEMPO-mediated oxidation of native cellulose. The effect of oxidation conditions on chemical and crystal structures of the water-insoluble fractions. Biomacromolecules 2004, 5, 1983–1989. [Google Scholar] [CrossRef] [PubMed]
- TAPPI. Acid Insoluble Lignin in Wood and Pulp; TAPPI Press: Atlanta, GA, USA, 2011. [Google Scholar]
- Segal, L.; Creely, J.J.; Martin, A.E.; Conrad, C.M. An Empirical Method for Estimating the Degree of Crystallinity of Native Cellulose Using the X-ray Diffractometer. Text. Res. J. 1959, 29, 786–794. [Google Scholar] [CrossRef]
- Sehaqui, H.; Zhou, Q.; Ikkala, O.; Berglund, L.A. Strong and tough cellulose nanopaper with high specific surface area and porosity. Biomacromolecules 2011, 12, 3638–3644. [Google Scholar] [CrossRef] [PubMed]
- Iwamoto, S.; Lee, S.-H.; Endo, T. Relationship between aspect ratio and suspension viscosity of wood cellulose nanofibers. Polym. J. 2014, 46, 73–76. [Google Scholar] [CrossRef]
- Gharehkhani, S.; Zhang, Y.; Fatehi, P. Lignin-derived platform molecules through TEMPO catalytic oxidation strategies. Prog. Energy Combust. Sci. 2019, 72, 59–89. [Google Scholar] [CrossRef]
- Sjöström, E. Wood Chemistry: Fundamentals and Applications, 2nd ed.; Academic Press, Inc.: San Diego, CA, USA, 1993; pp. 232–283. [Google Scholar]
- Li, Q.; Renneckar, S. Supramolecular structure characterization of molecularly thin cellulose i nanoparticles. Biomacromolecules 2011, 12, 650–659. [Google Scholar] [CrossRef]
- Usov, I.; Nyström, G.; Adamcik, J.; Handschin, S.; Schütz, C.; Fall, A.; Bergström, L.; Mezzenga, R. Understanding nanocellulose chirality and structure-properties relationship at the single fibril level. Nat. Commun. 2015, 6. [Google Scholar] [CrossRef] [PubMed]
- Nyström, G.; Arcari, M.; Adamcik, J.; Usov, I.; Mezzenga, R. Nanocellulose Fragmentation Mechanisms and Inversion of Chirality from the Single Particle to the Cholesteric Phase. ACS Nano 2018, 12, 5141–5148. [Google Scholar] [CrossRef]
- Jonasson, S.; Bünder, A.; Das, O.; Niittylä, T.; Oksman, K. Comparison of tension wood and normal wood for oxidative nanofibrillation and network characteristics. Cellulose 2020, 28, 1085–1104. [Google Scholar] [CrossRef]
- Moser, C. Manufacturing and Characterisation of Cellulose Nanofibers. Ph.D. Thesis, Royal Institute of Technology, Stockholm, Sweden, 25 January 2018. [Google Scholar]
- Ramiah, M.V. Thermogravimetric and differential thermal analysis of cellulose, hemicellulose, and lignin. J. Appl. Polym. Sci. 1970, 14, 1323–1337. [Google Scholar] [CrossRef]
- Lichtenstein, K.; Lavoine, N. Toward a deeper understanding of the thermal degradation mechanism of nanocellulose. Polym. Degrad. Stab. 2017, 146, 53–60. [Google Scholar] [CrossRef]
- French, A.D.; Santiago Cintrón, M. Cellulose polymorphy, crystallite size, and the Segal Crystallinity Index. Cellulose 2013, 20, 583–588. [Google Scholar] [CrossRef]
- Daicho, K.; Saito, T.; Fujisawa, S.; Isogai, A. The Crystallinity of Nanocellulose: Dispersion-Induced Disordering of the Grain Boundary in Biologically Structured Cellulose. ACS Appl. Nano Mater. 2018, 1, 5774–5785. [Google Scholar] [CrossRef]
- Meng, Q.; Wang, T.J. Mechanics of Strong and Tough Cellulose Nanopaper. Appl. Mech. Rev. 2019, 71. [Google Scholar] [CrossRef]
- Sehaqui, H.; Salajková, M.; Zhou, Q.; Berglund, L.A. Mechanical performance tailoring of tough ultra-high porosity foams prepared from cellulose i nanofiber suspensions. Soft Matter 2010, 6, 1824–1832. [Google Scholar] [CrossRef]
- Nge, T.T.; Lee, S.H.; Endo, T. Preparation of nanoscale cellulose materials with different morphologies by mechanical treatments and their characterization. Cellulose 2013, 20, 1841–1852. [Google Scholar] [CrossRef]
- Ding, Q.; Zeng, J.; Wang, B.; Tang, D.; Chen, K.; Gao, W. Effect of nanocellulose fiber hornification on water fraction characteristics and hydroxyl accessibility during dehydration. Carbohydr. Polym. 2019, 207, 44–51. [Google Scholar] [CrossRef]


| Sample ID | Coding | Carbohydrates | Extractives | Total Lignin | Cellulose 1 |
|---|---|---|---|---|---|
| 1 | Low | 79.4 | 0.4 | 17.4 | 45 (4) |
| 2 | 77.2 | 0.4 | 19.7 | 42 (3) | |
| 3 | Medium | 72.4 | 0.7 | 24.4 | 41 (2) |
| 4 | 72.3 | 0.5 | 24.5 | 40 (3) | |
| 5 | 72.5 | 0.6 | 24.6 | 41 (2) | |
| 6 | High | 66.9 | 0.7 | 30.0 | 39 (2) |
| Sample ID | Moisture (wt %) | Density (g·cm−3) | Thickness (µm) | Porosity (%) | α-cellulose (wt %) | Lignin (wt %) |
|---|---|---|---|---|---|---|
| 1 | 9.1 (1.1) | 1.20 (0.10) | 71 (10) | 20.0 (6.7) | 74 | <1 |
| 2 | 7.9 (0.8) | 1.23 (0.07) | 63 (4) | 18.0 (4.7) | 71 | <1 |
| 3 | 7.8 (1.3) | 1.19 (0.09) | 88 (7) | 20.7 (6.0) | 76 | <1 |
| 4 | 6.8 (1.3) | 1.26 (0.10) | 50 (5) | 16.0 (6.7) | 70 | <1 |
| 5 | 8.0 (1.4) | 1.17 (0.11) | 65 (6) | 22.0 (7.3) | 69 | <1 |
| 6 | 7.5 (0.5) | 1.20 (0.09) | 78 (10) | 20.0 (6.0) | 76 | <1 |
| Sample ID | Coding | BET Surface Area (m2g−1) | Pore Volume (cm3·kg−1) | Pore Size (nm) | Wet Surface Area (m2g−1) |
|---|---|---|---|---|---|
| 1 | Low | 6.9 | 7.5 | 4.4 | 76 |
| 6 | High | 4.4 | 5.7 | 5.0 | 114 |
Publisher’s Note: MDPI stays neutral with regard to jurisdictional claims in published maps and institutional affiliations. |
© 2021 by the authors. Licensee MDPI, Basel, Switzerland. This article is an open access article distributed under the terms and conditions of the Creative Commons Attribution (CC BY) license (https://creativecommons.org/licenses/by/4.0/).
Share and Cite
Jonasson, S.; Bünder, A.; Berglund, L.; Hertzberg, M.; Niittylä, T.; Oksman, K. The Effect of High Lignin Content on Oxidative Nanofibrillation of Wood Cell Wall. Nanomaterials 2021, 11, 1179. https://doi.org/10.3390/nano11051179
Jonasson S, Bünder A, Berglund L, Hertzberg M, Niittylä T, Oksman K. The Effect of High Lignin Content on Oxidative Nanofibrillation of Wood Cell Wall. Nanomaterials. 2021; 11(5):1179. https://doi.org/10.3390/nano11051179
Chicago/Turabian StyleJonasson, Simon, Anne Bünder, Linn Berglund, Magnus Hertzberg, Totte Niittylä, and Kristiina Oksman. 2021. "The Effect of High Lignin Content on Oxidative Nanofibrillation of Wood Cell Wall" Nanomaterials 11, no. 5: 1179. https://doi.org/10.3390/nano11051179
APA StyleJonasson, S., Bünder, A., Berglund, L., Hertzberg, M., Niittylä, T., & Oksman, K. (2021). The Effect of High Lignin Content on Oxidative Nanofibrillation of Wood Cell Wall. Nanomaterials, 11(5), 1179. https://doi.org/10.3390/nano11051179