
CdSe Quantum Dots in Human Models Derived from ALS Patients: Characterization, Nuclear Penetration Studies and Multiplexing

 ,
,  , ,
, ,  and
and 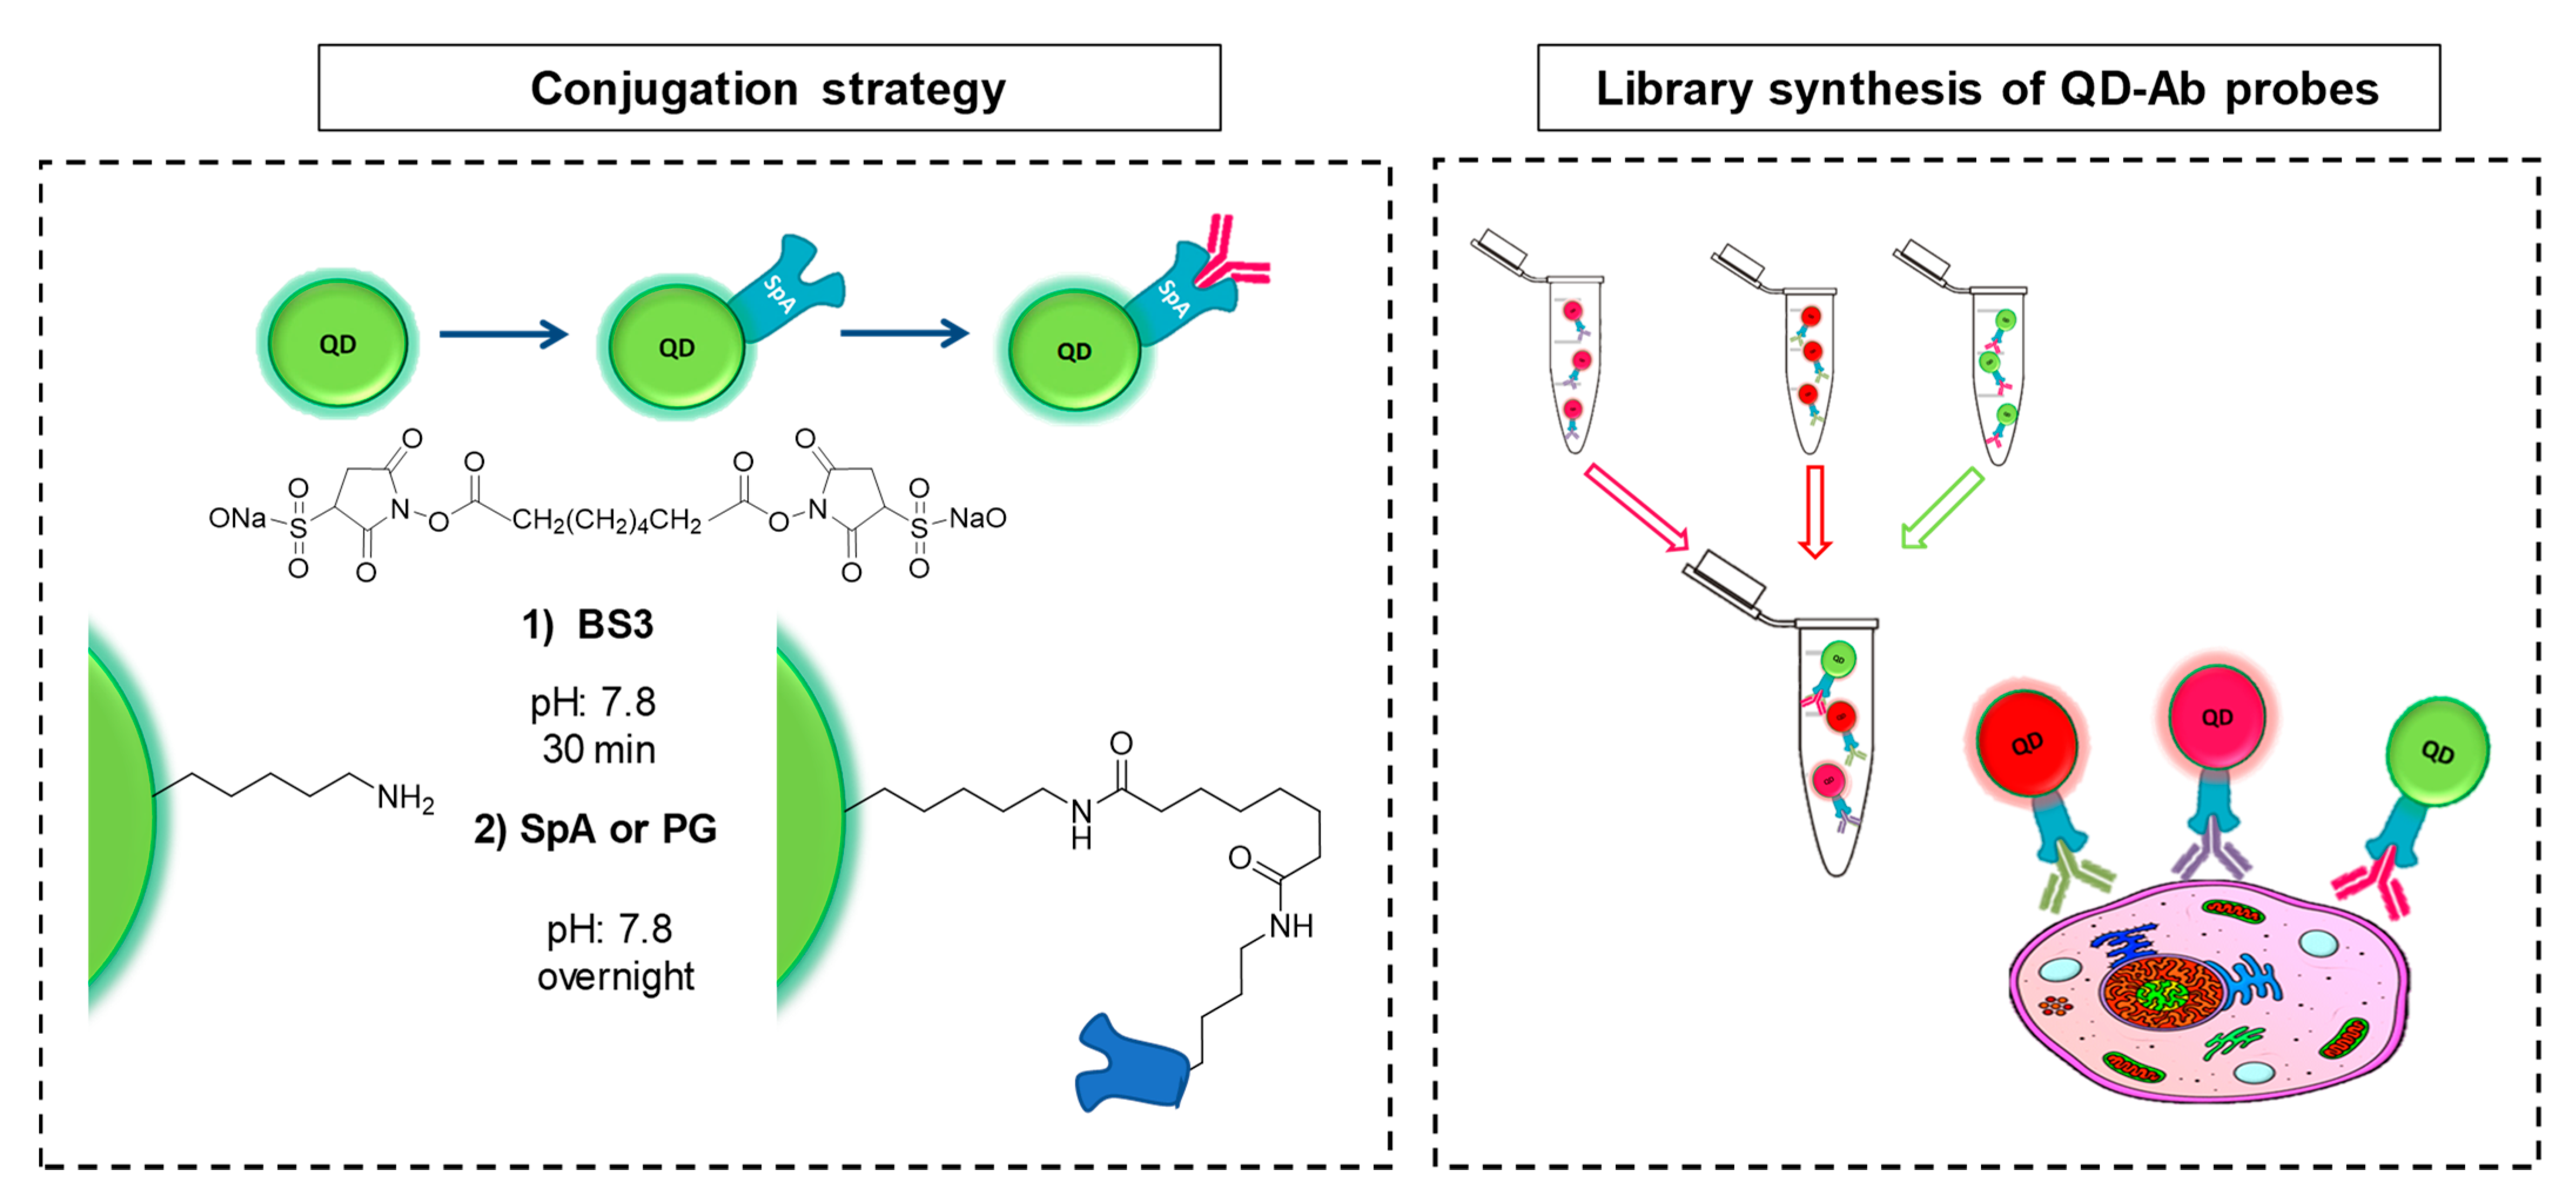
Abstract
1. Introduction
2. Materials and Methods
2.1. QD Bioconjugation
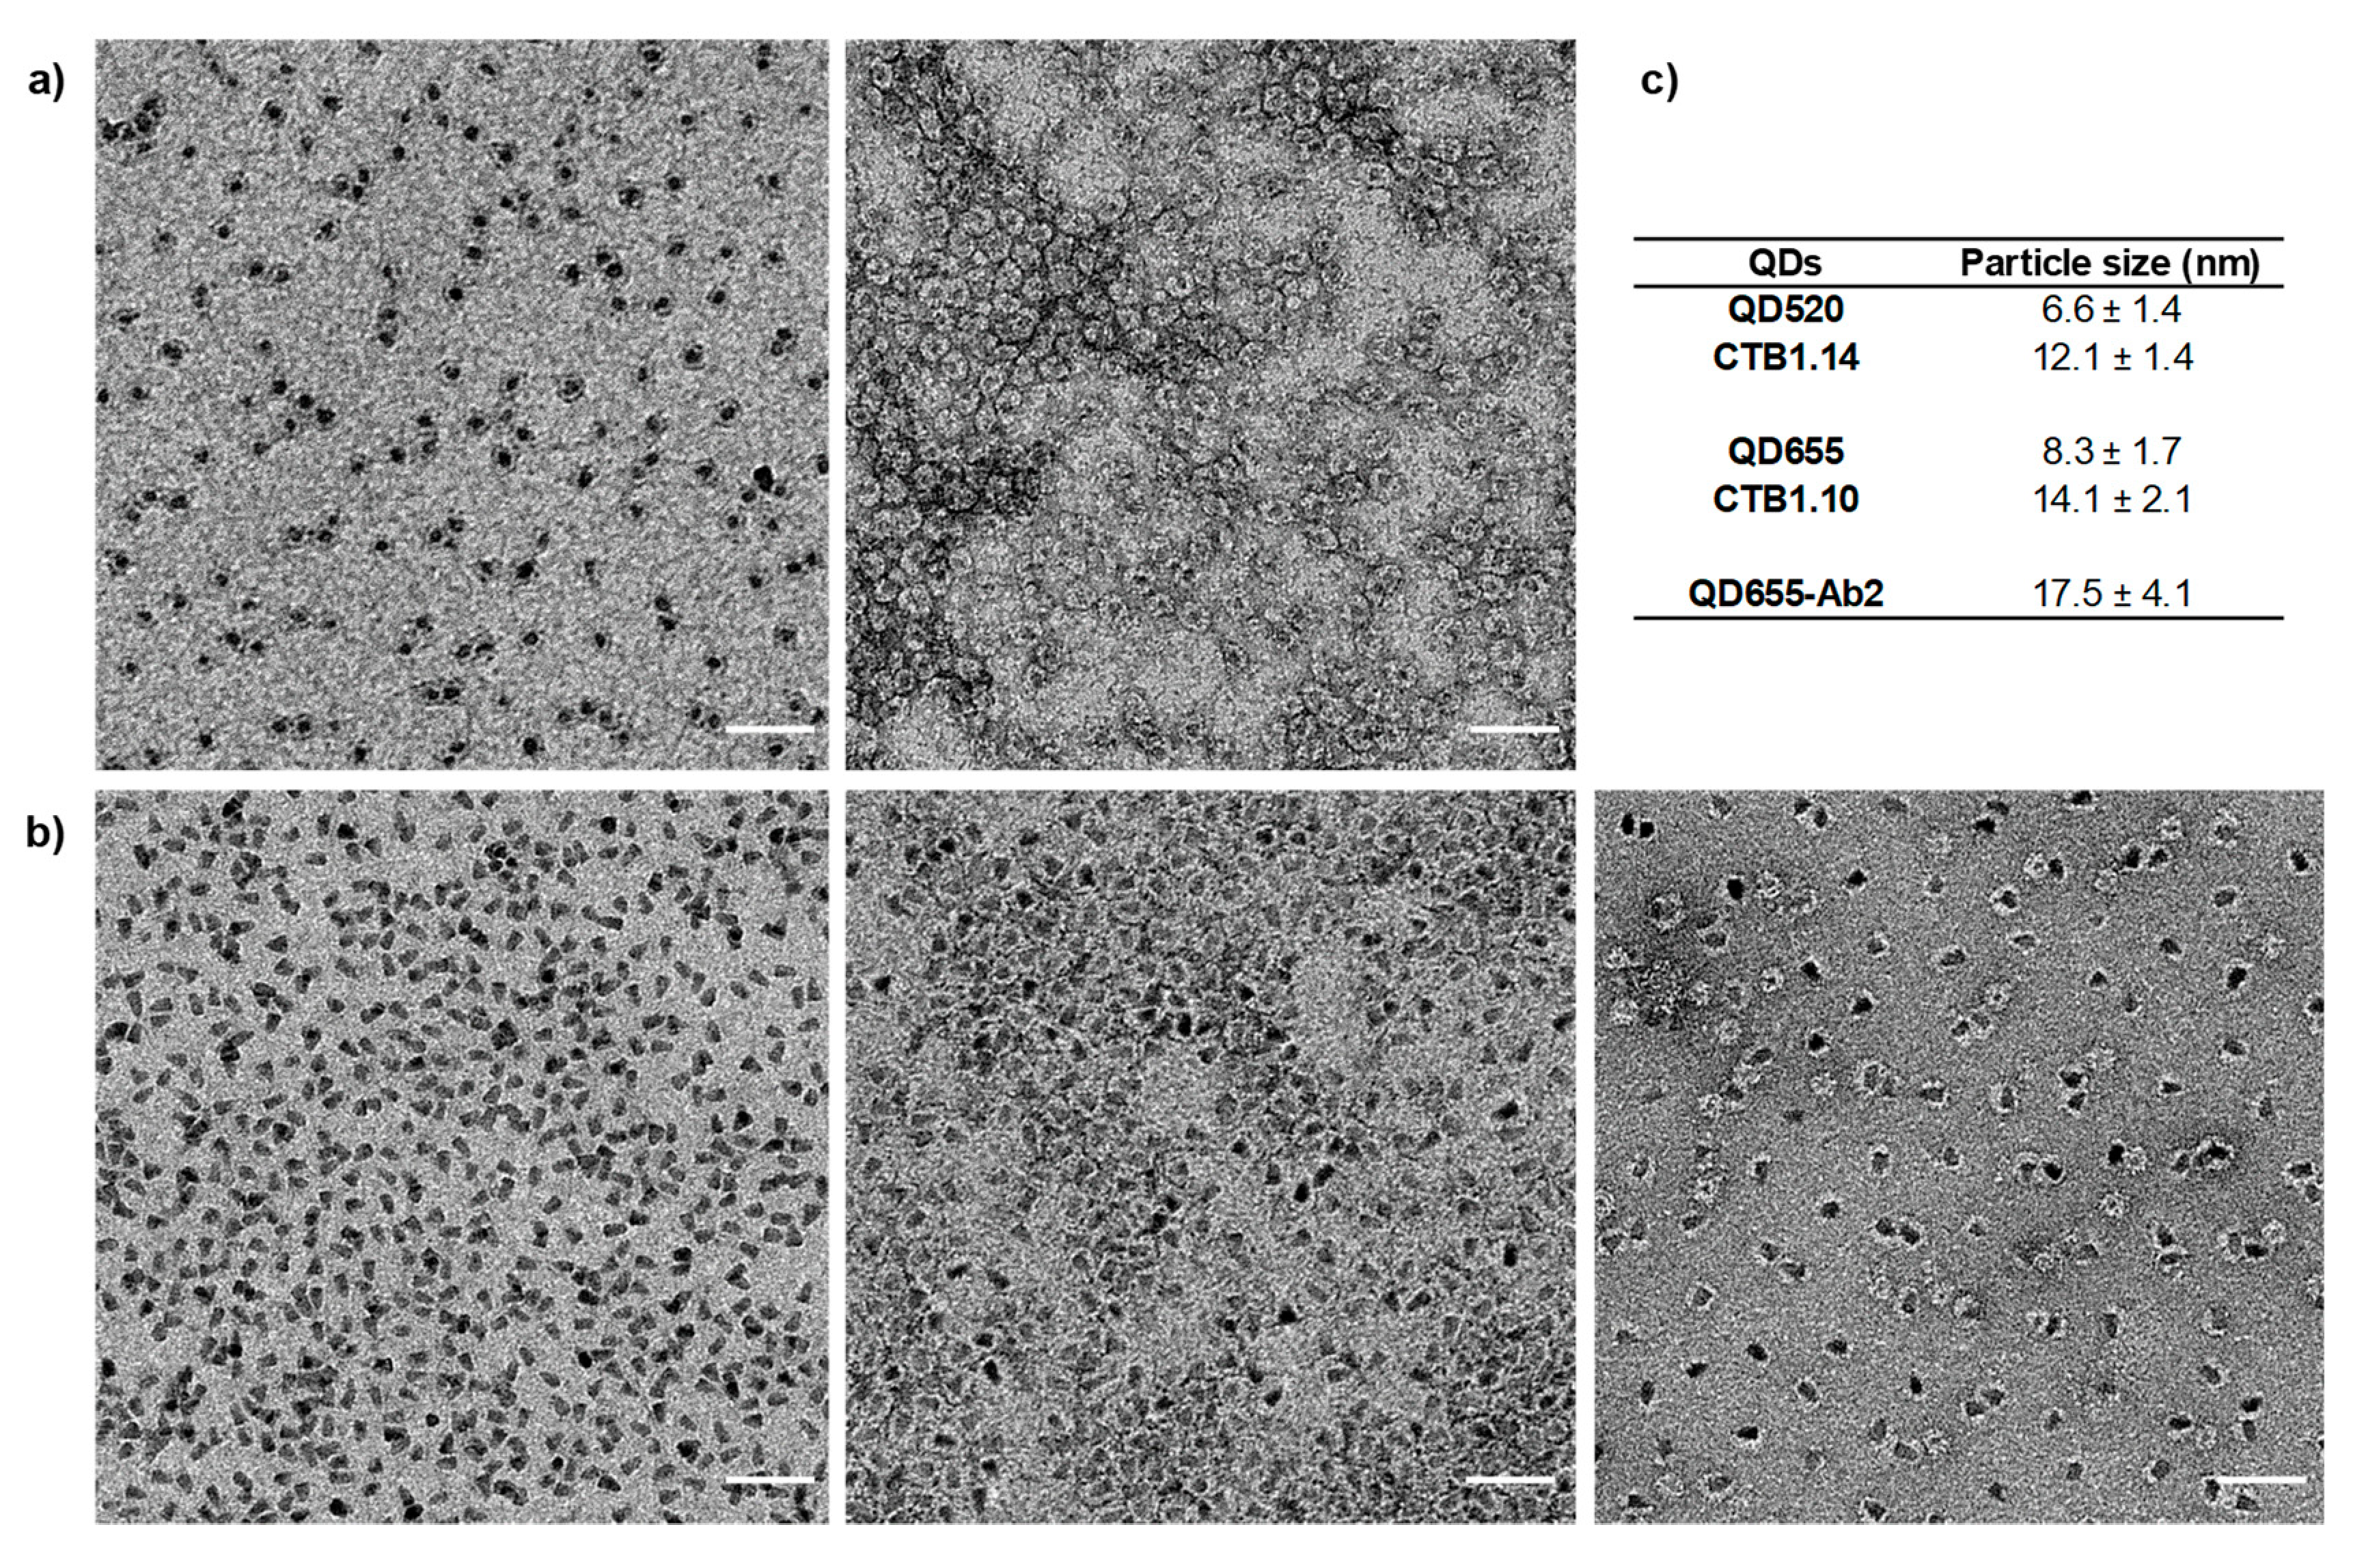
2.2. Transmission Electron Microscopy
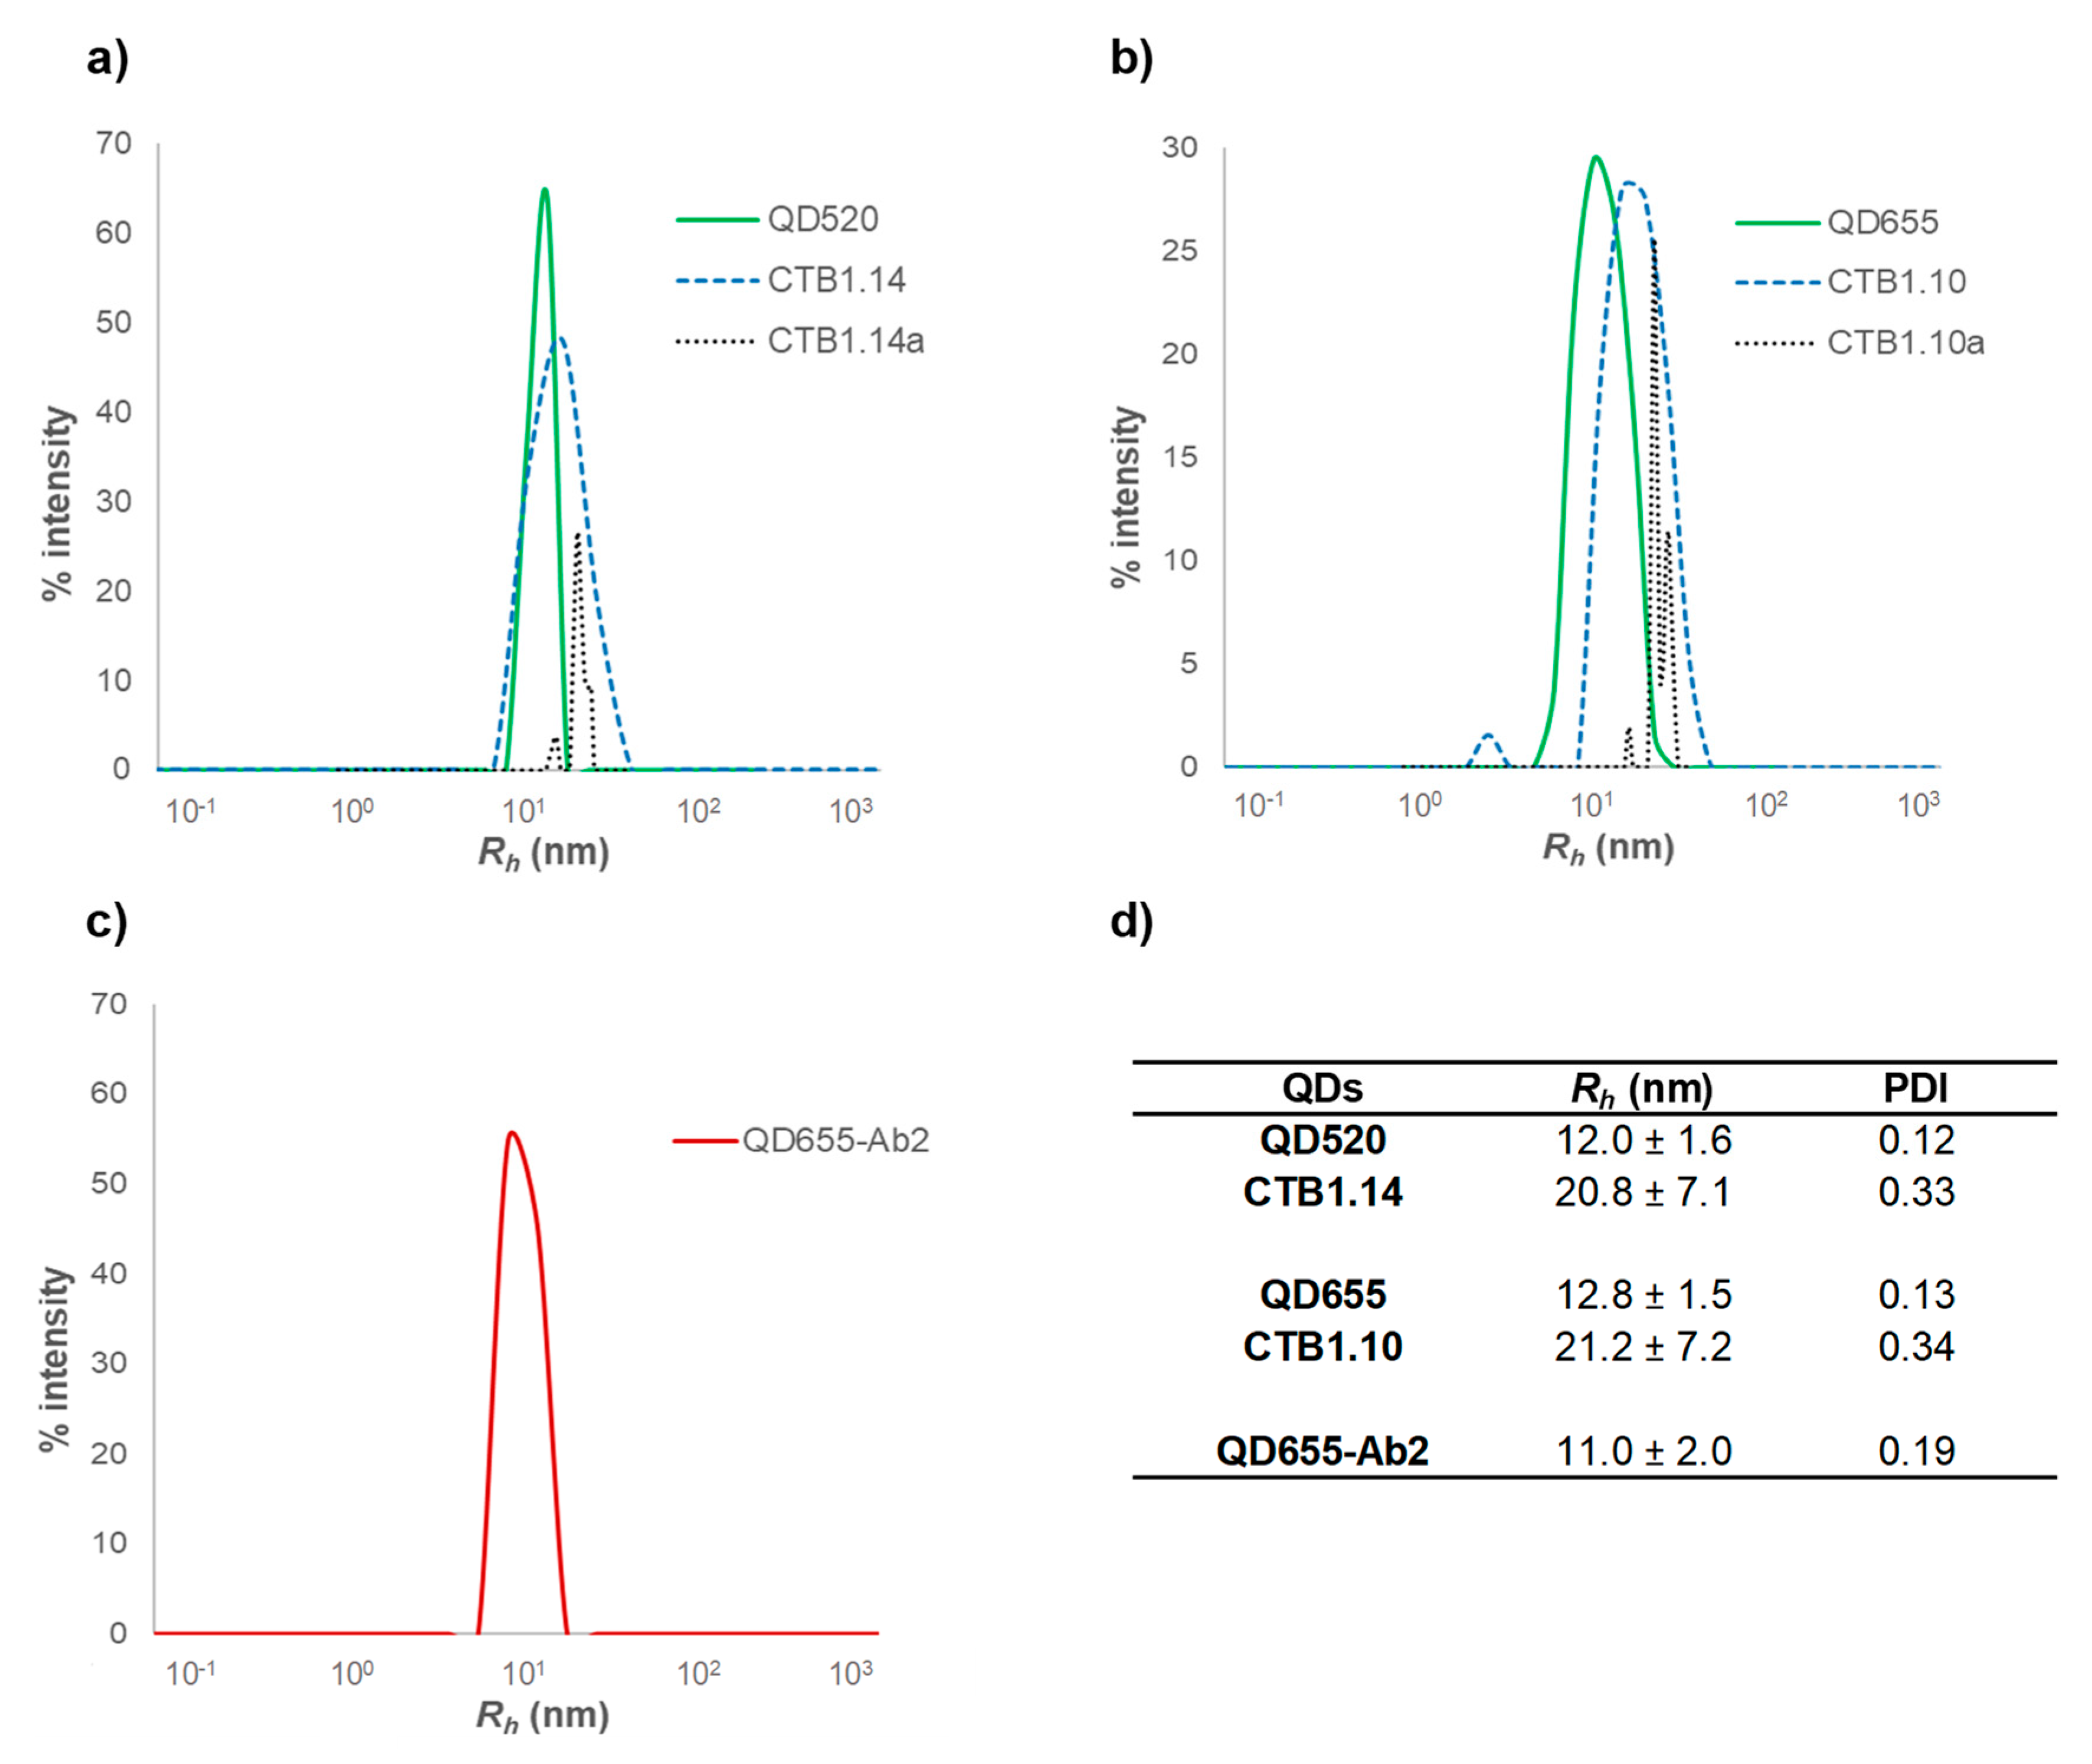
2.3. Dynamic Light Scattering
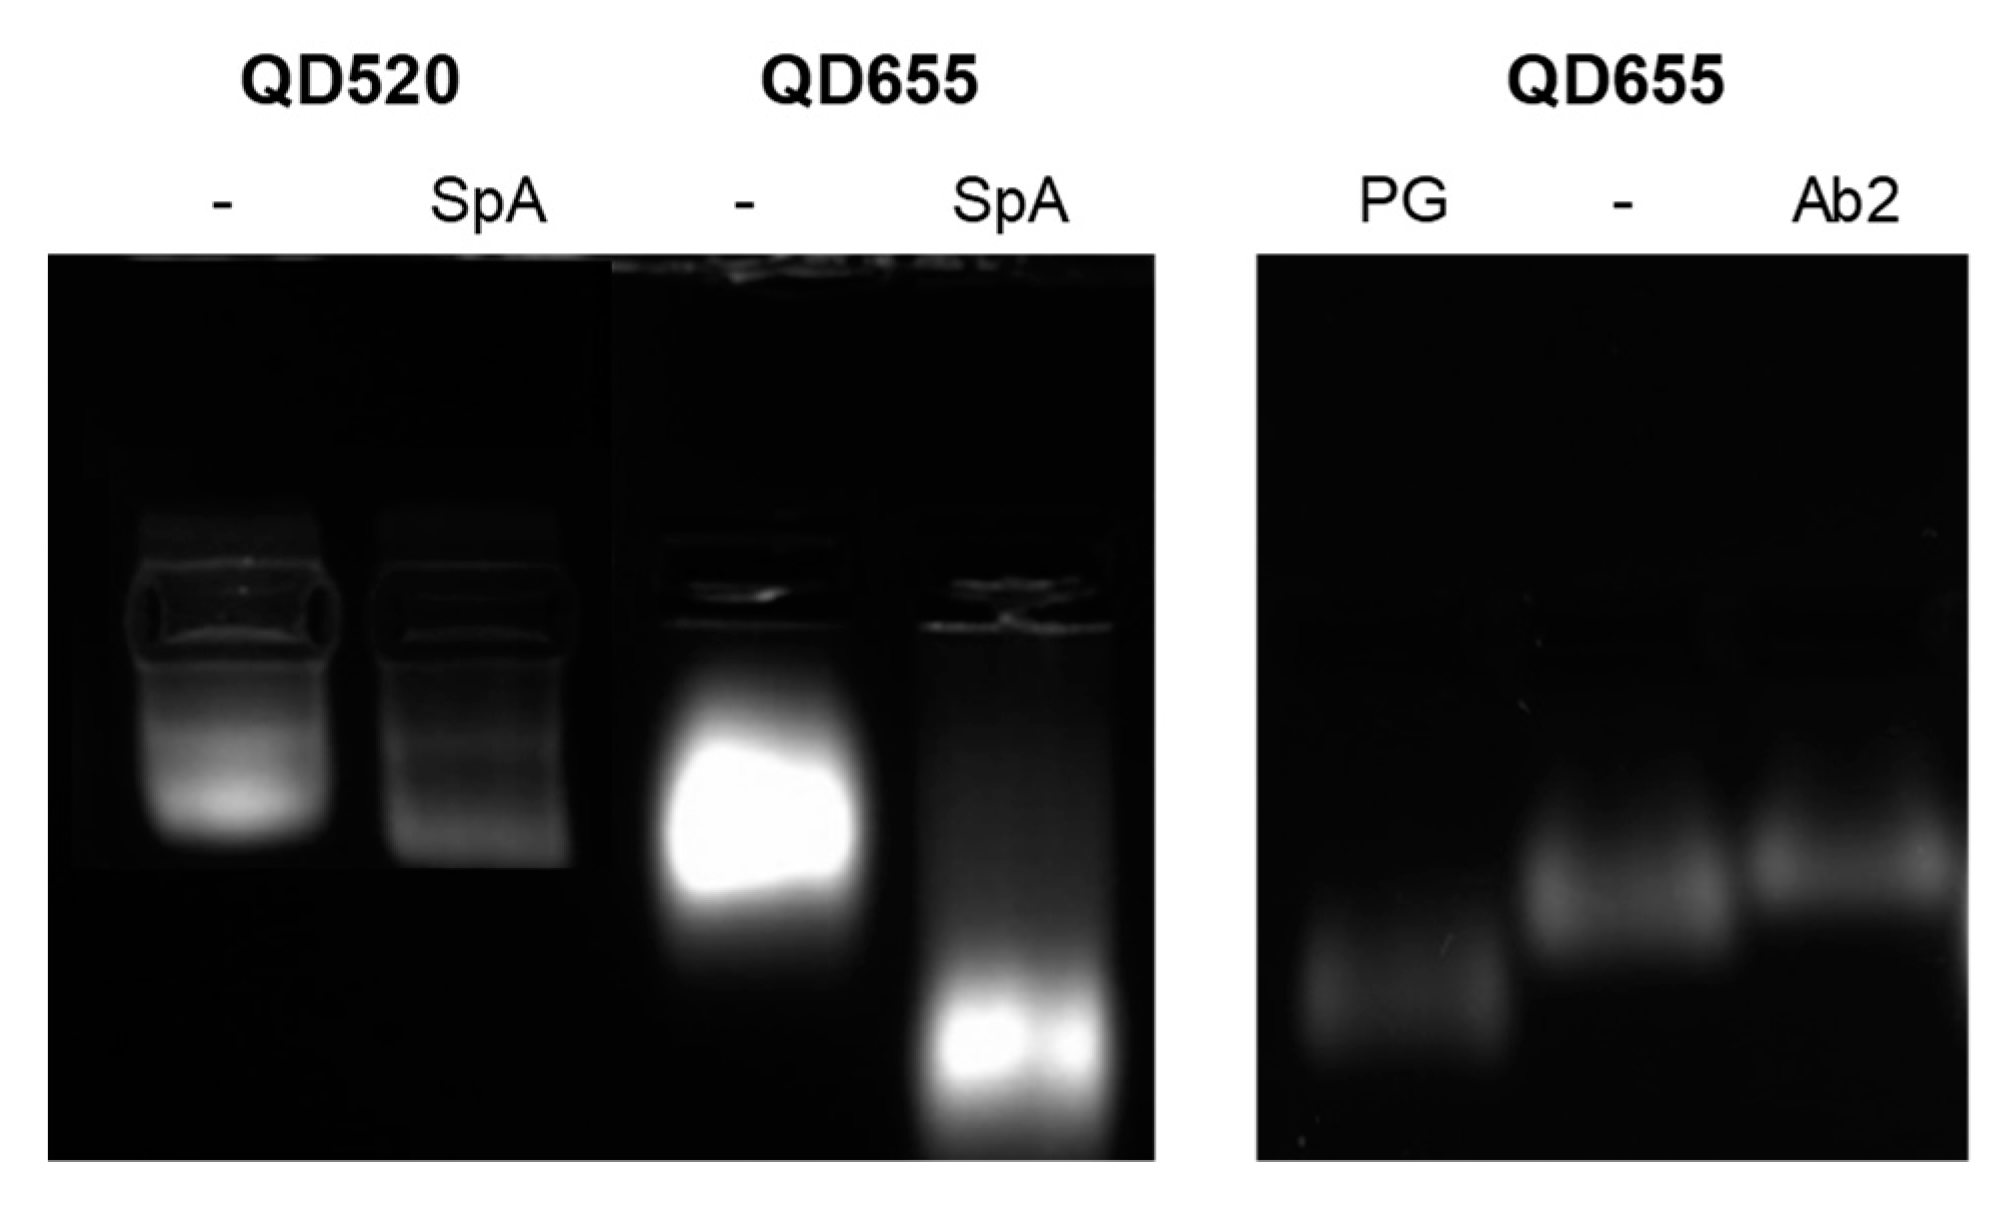
2.4. Electrophoretic Mobility
2.5. Neuronal Cell Line Culture
2.6. Amyotrophic Lateral Sclerosis (ALS) Patients
2.6.1. Skin Fibroblast Cultures
2.6.2. Lymphoblastic Cell Lines
2.7. Immunofluorescence
2.8. Image Adquisition
3. Results and Discussion
3.1. QDs Characterization
3.1.1. Transmission Electron Microscopy
3.1.2. Dynamic Light Scattering
3.1.3. Agarose Gel Electrophoresis
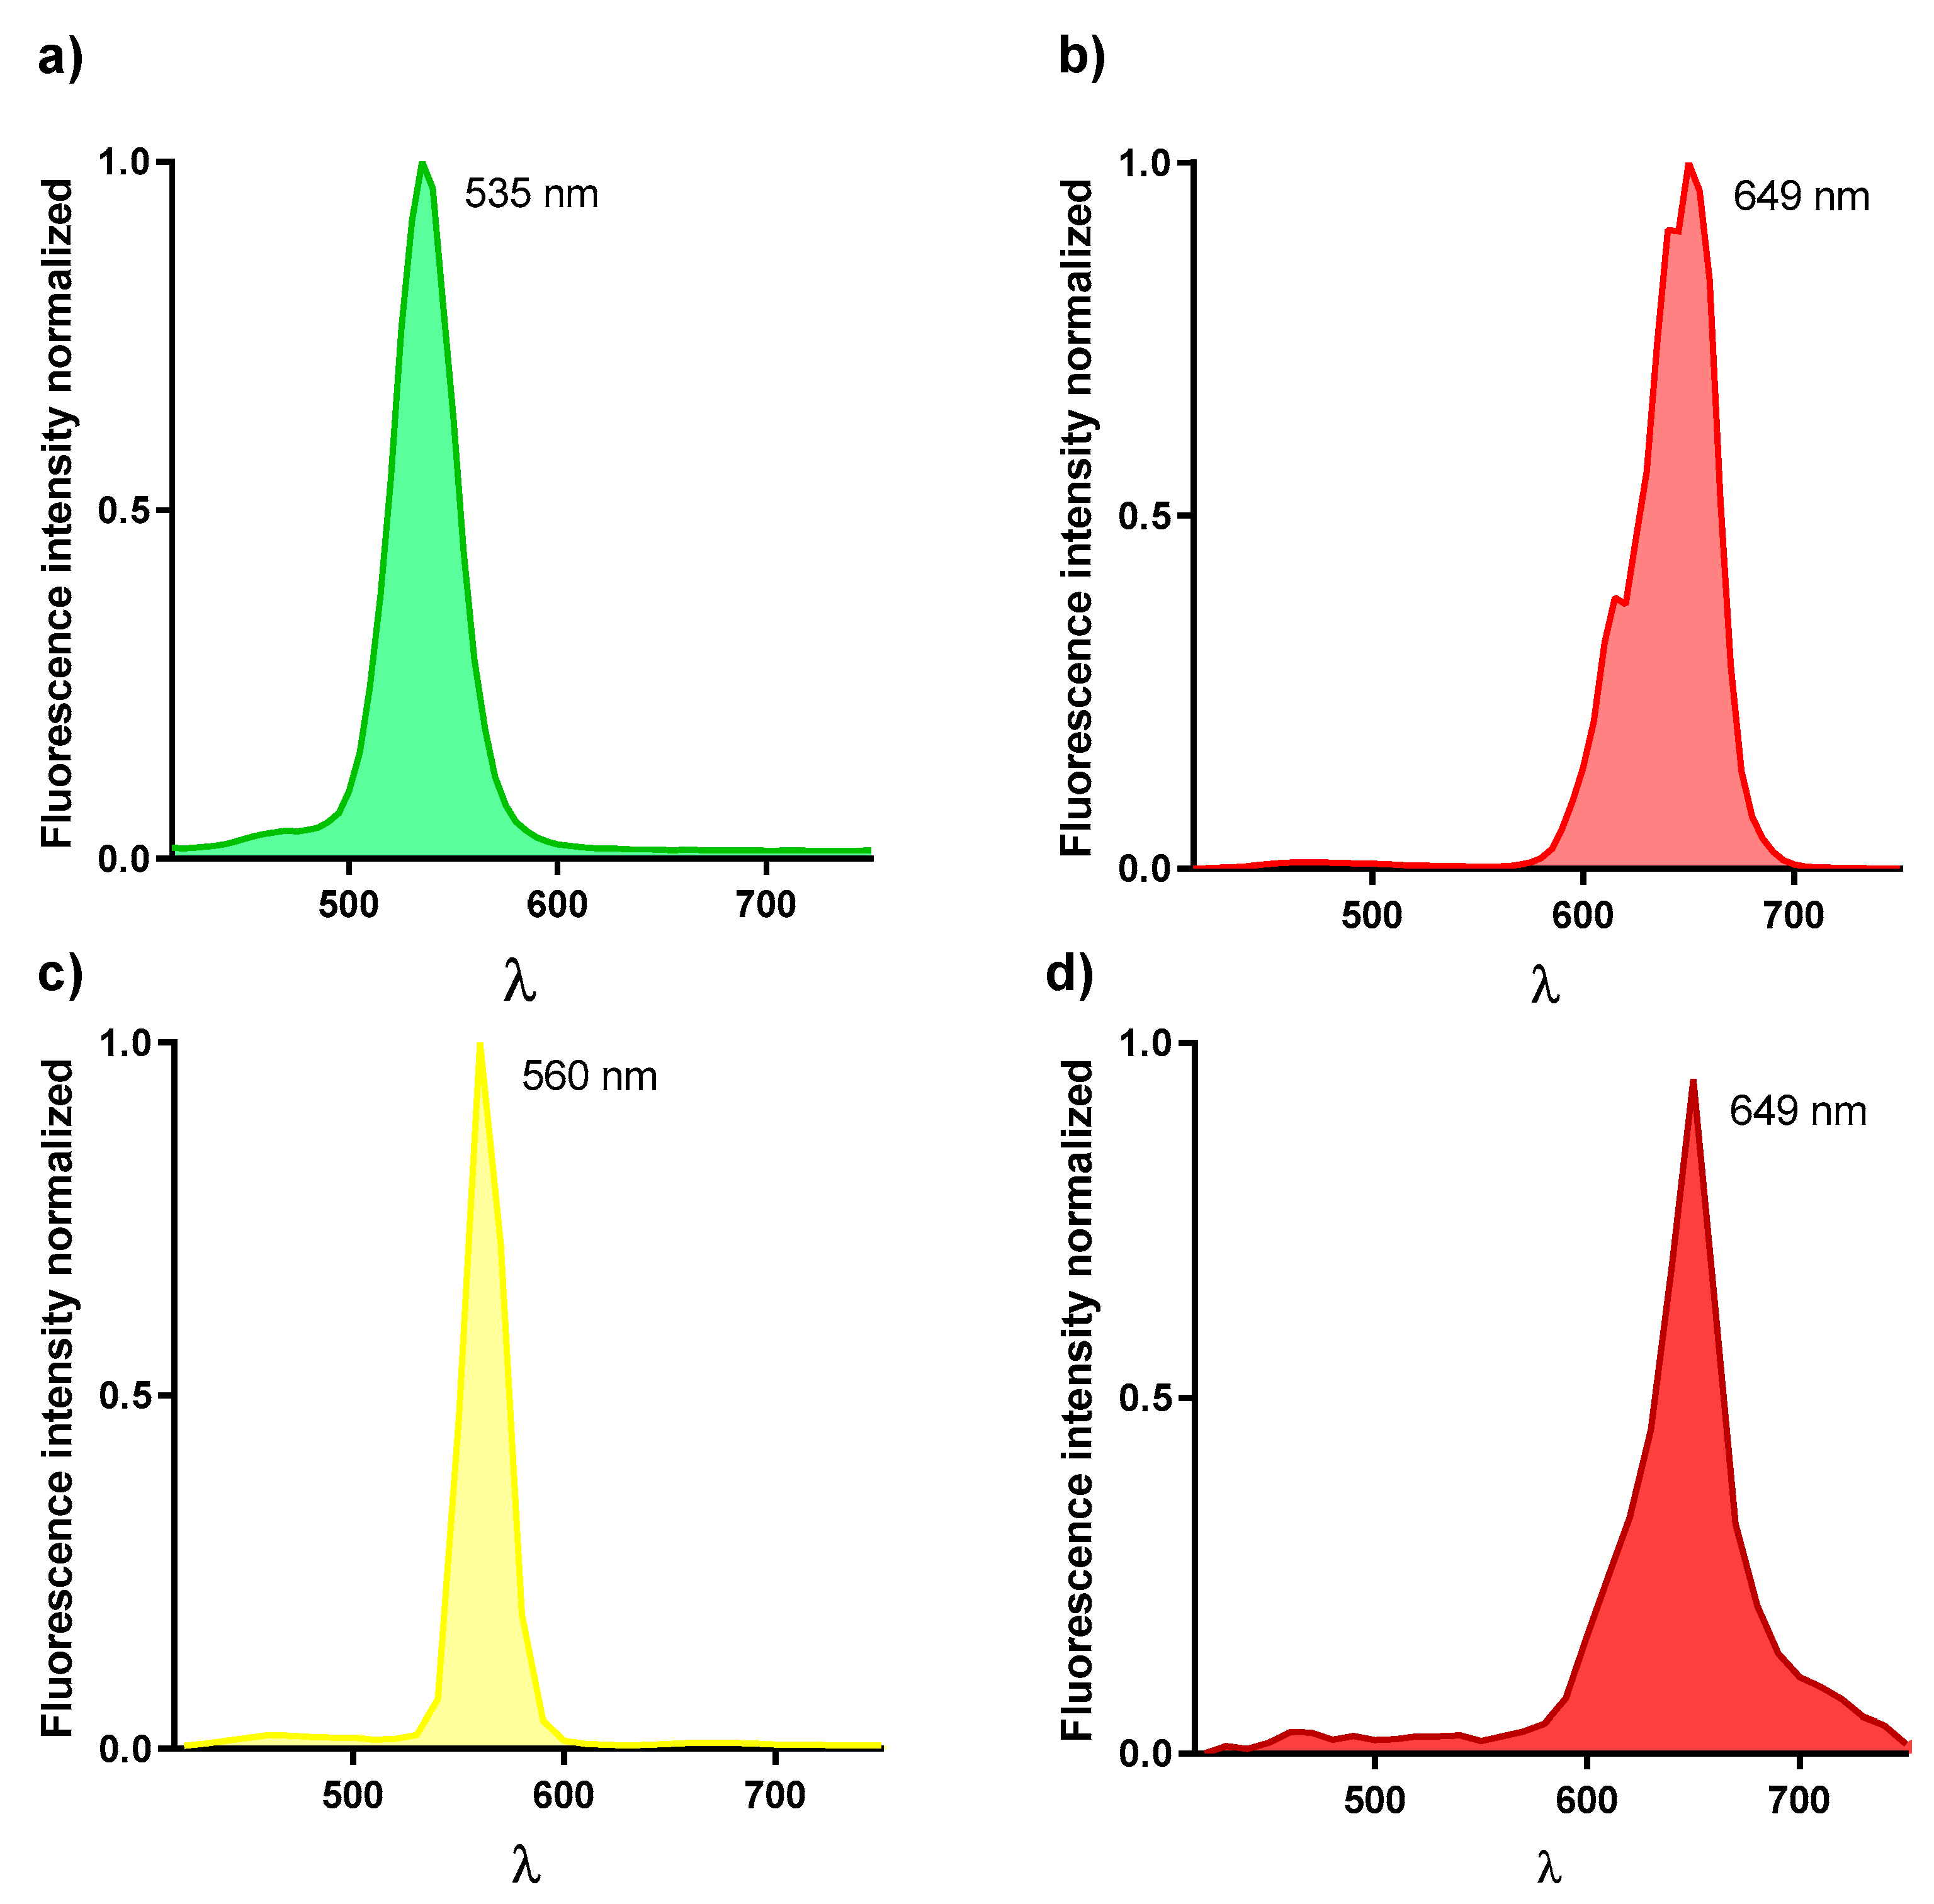
3.1.4. Spectral Characterization
3.2. Immunoassay Labelling
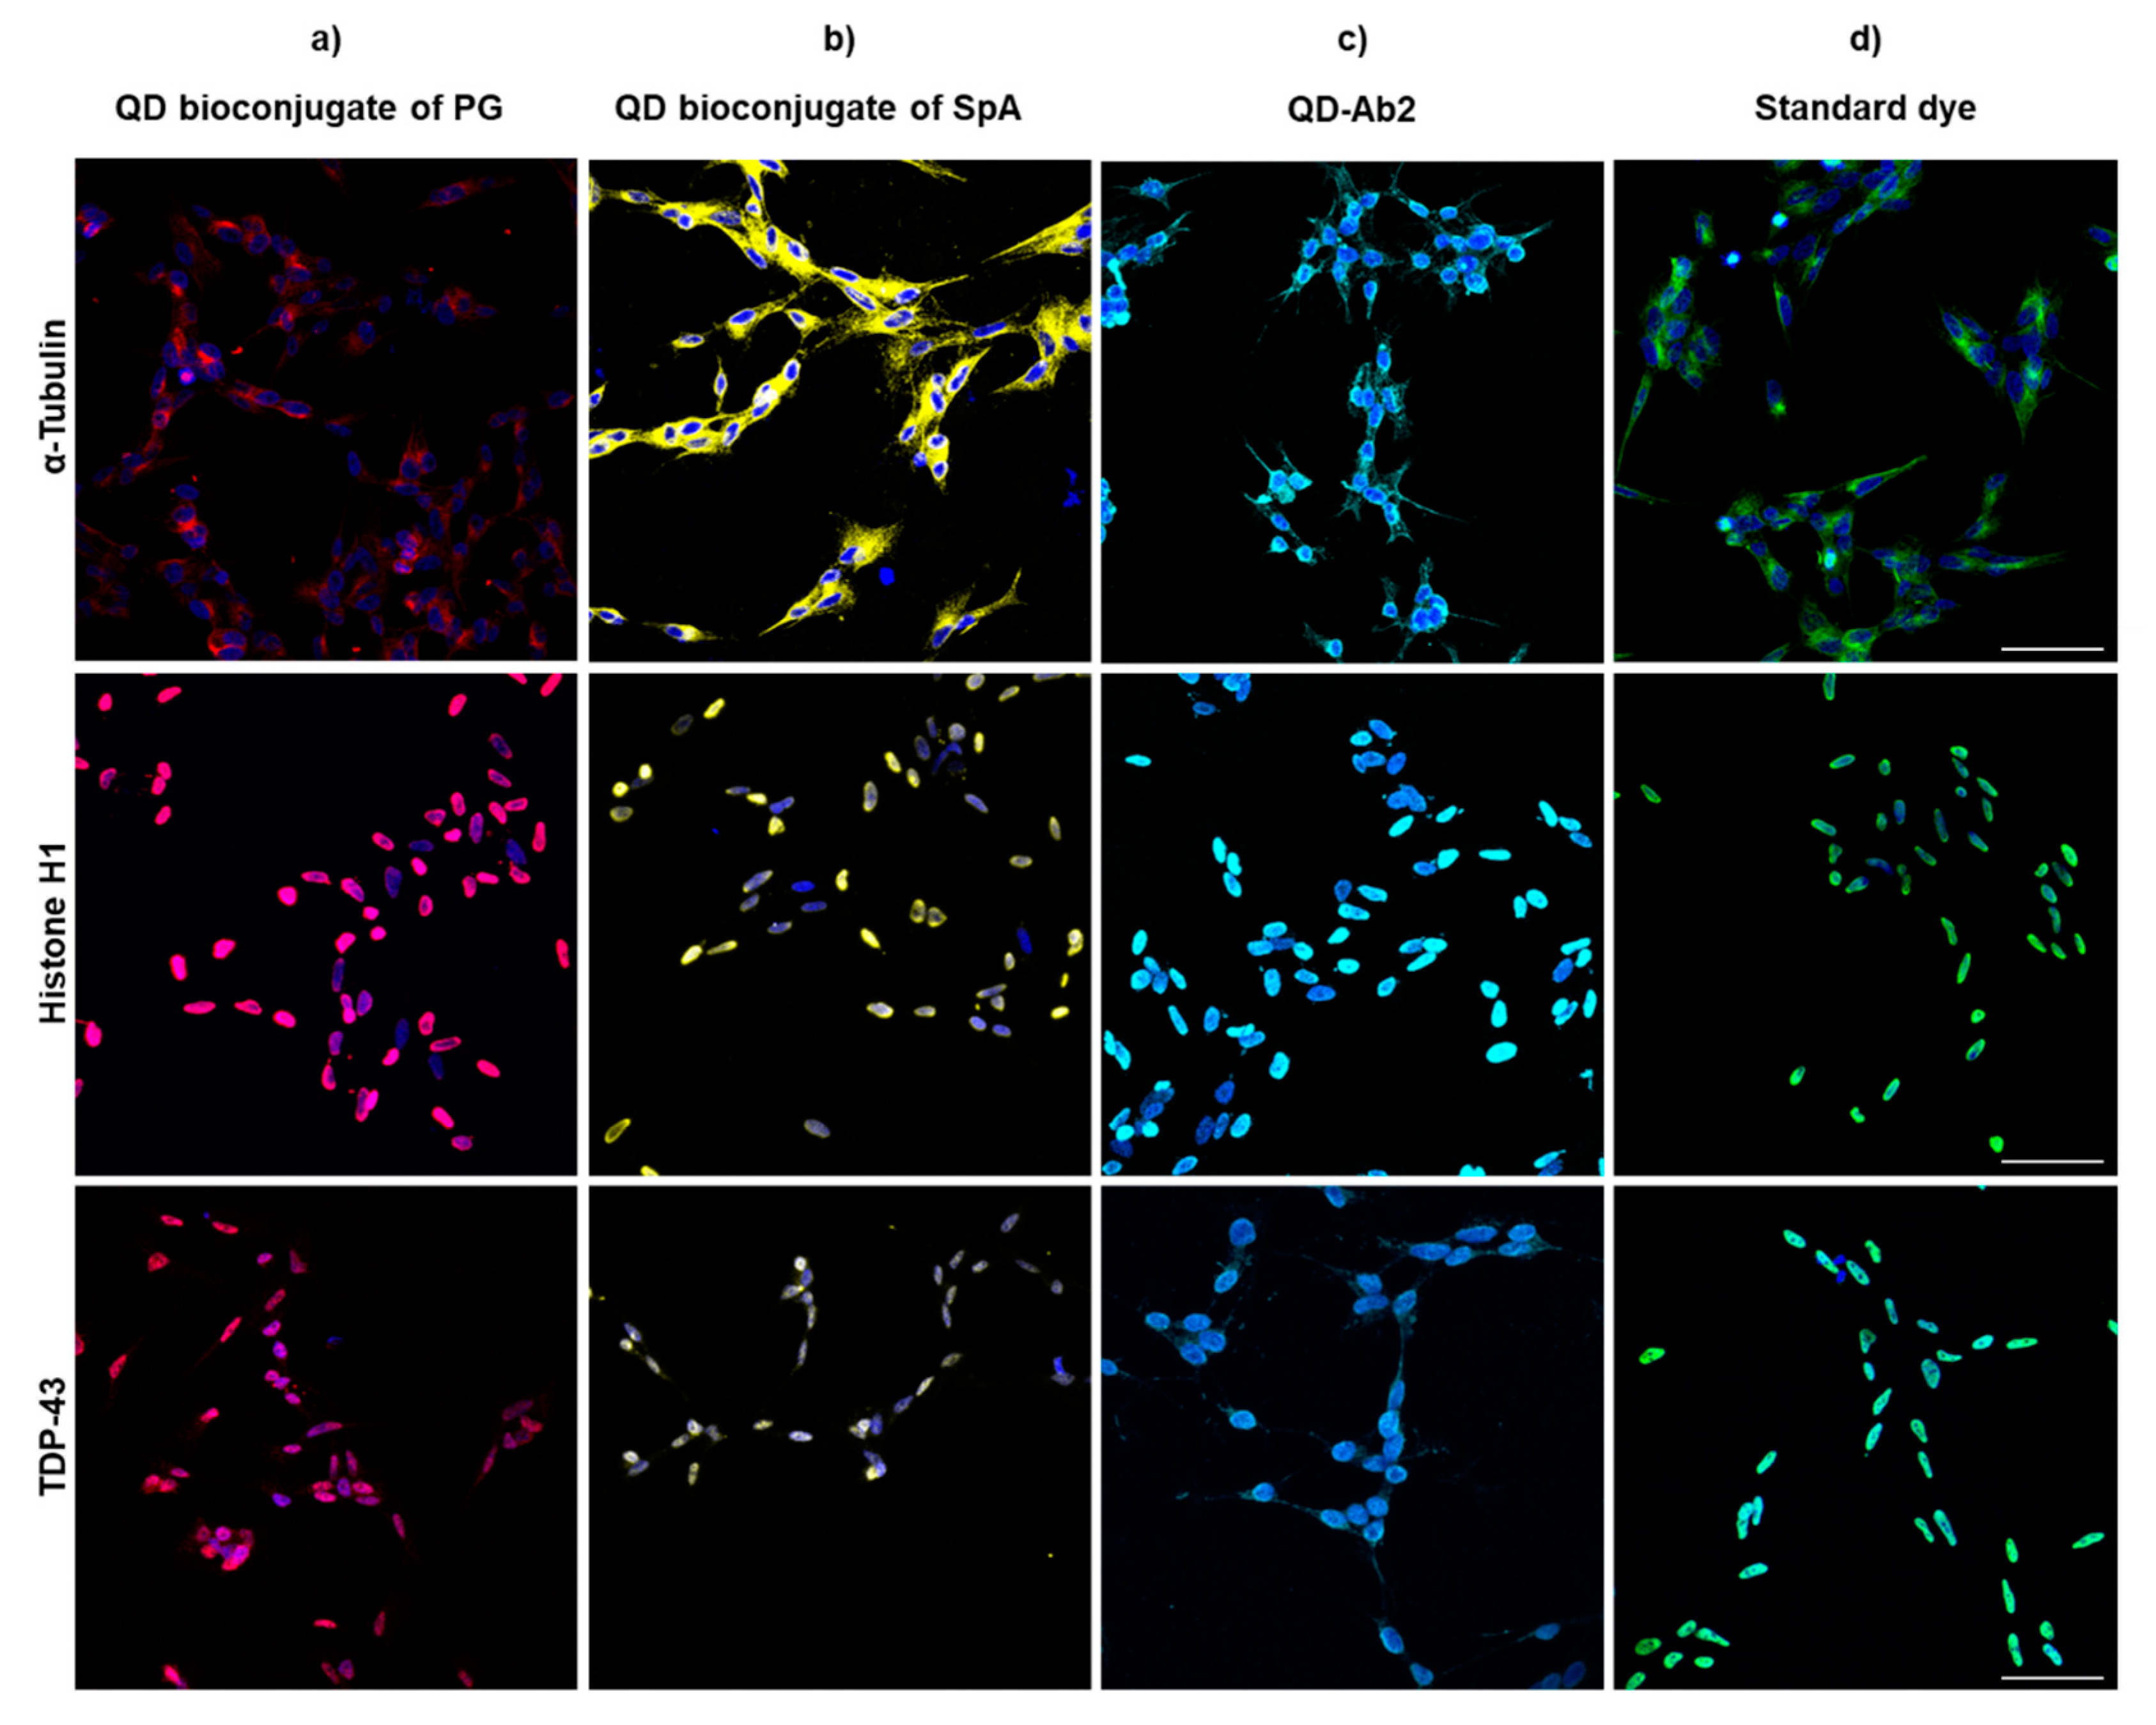
3.2.1. SH-SY5Y
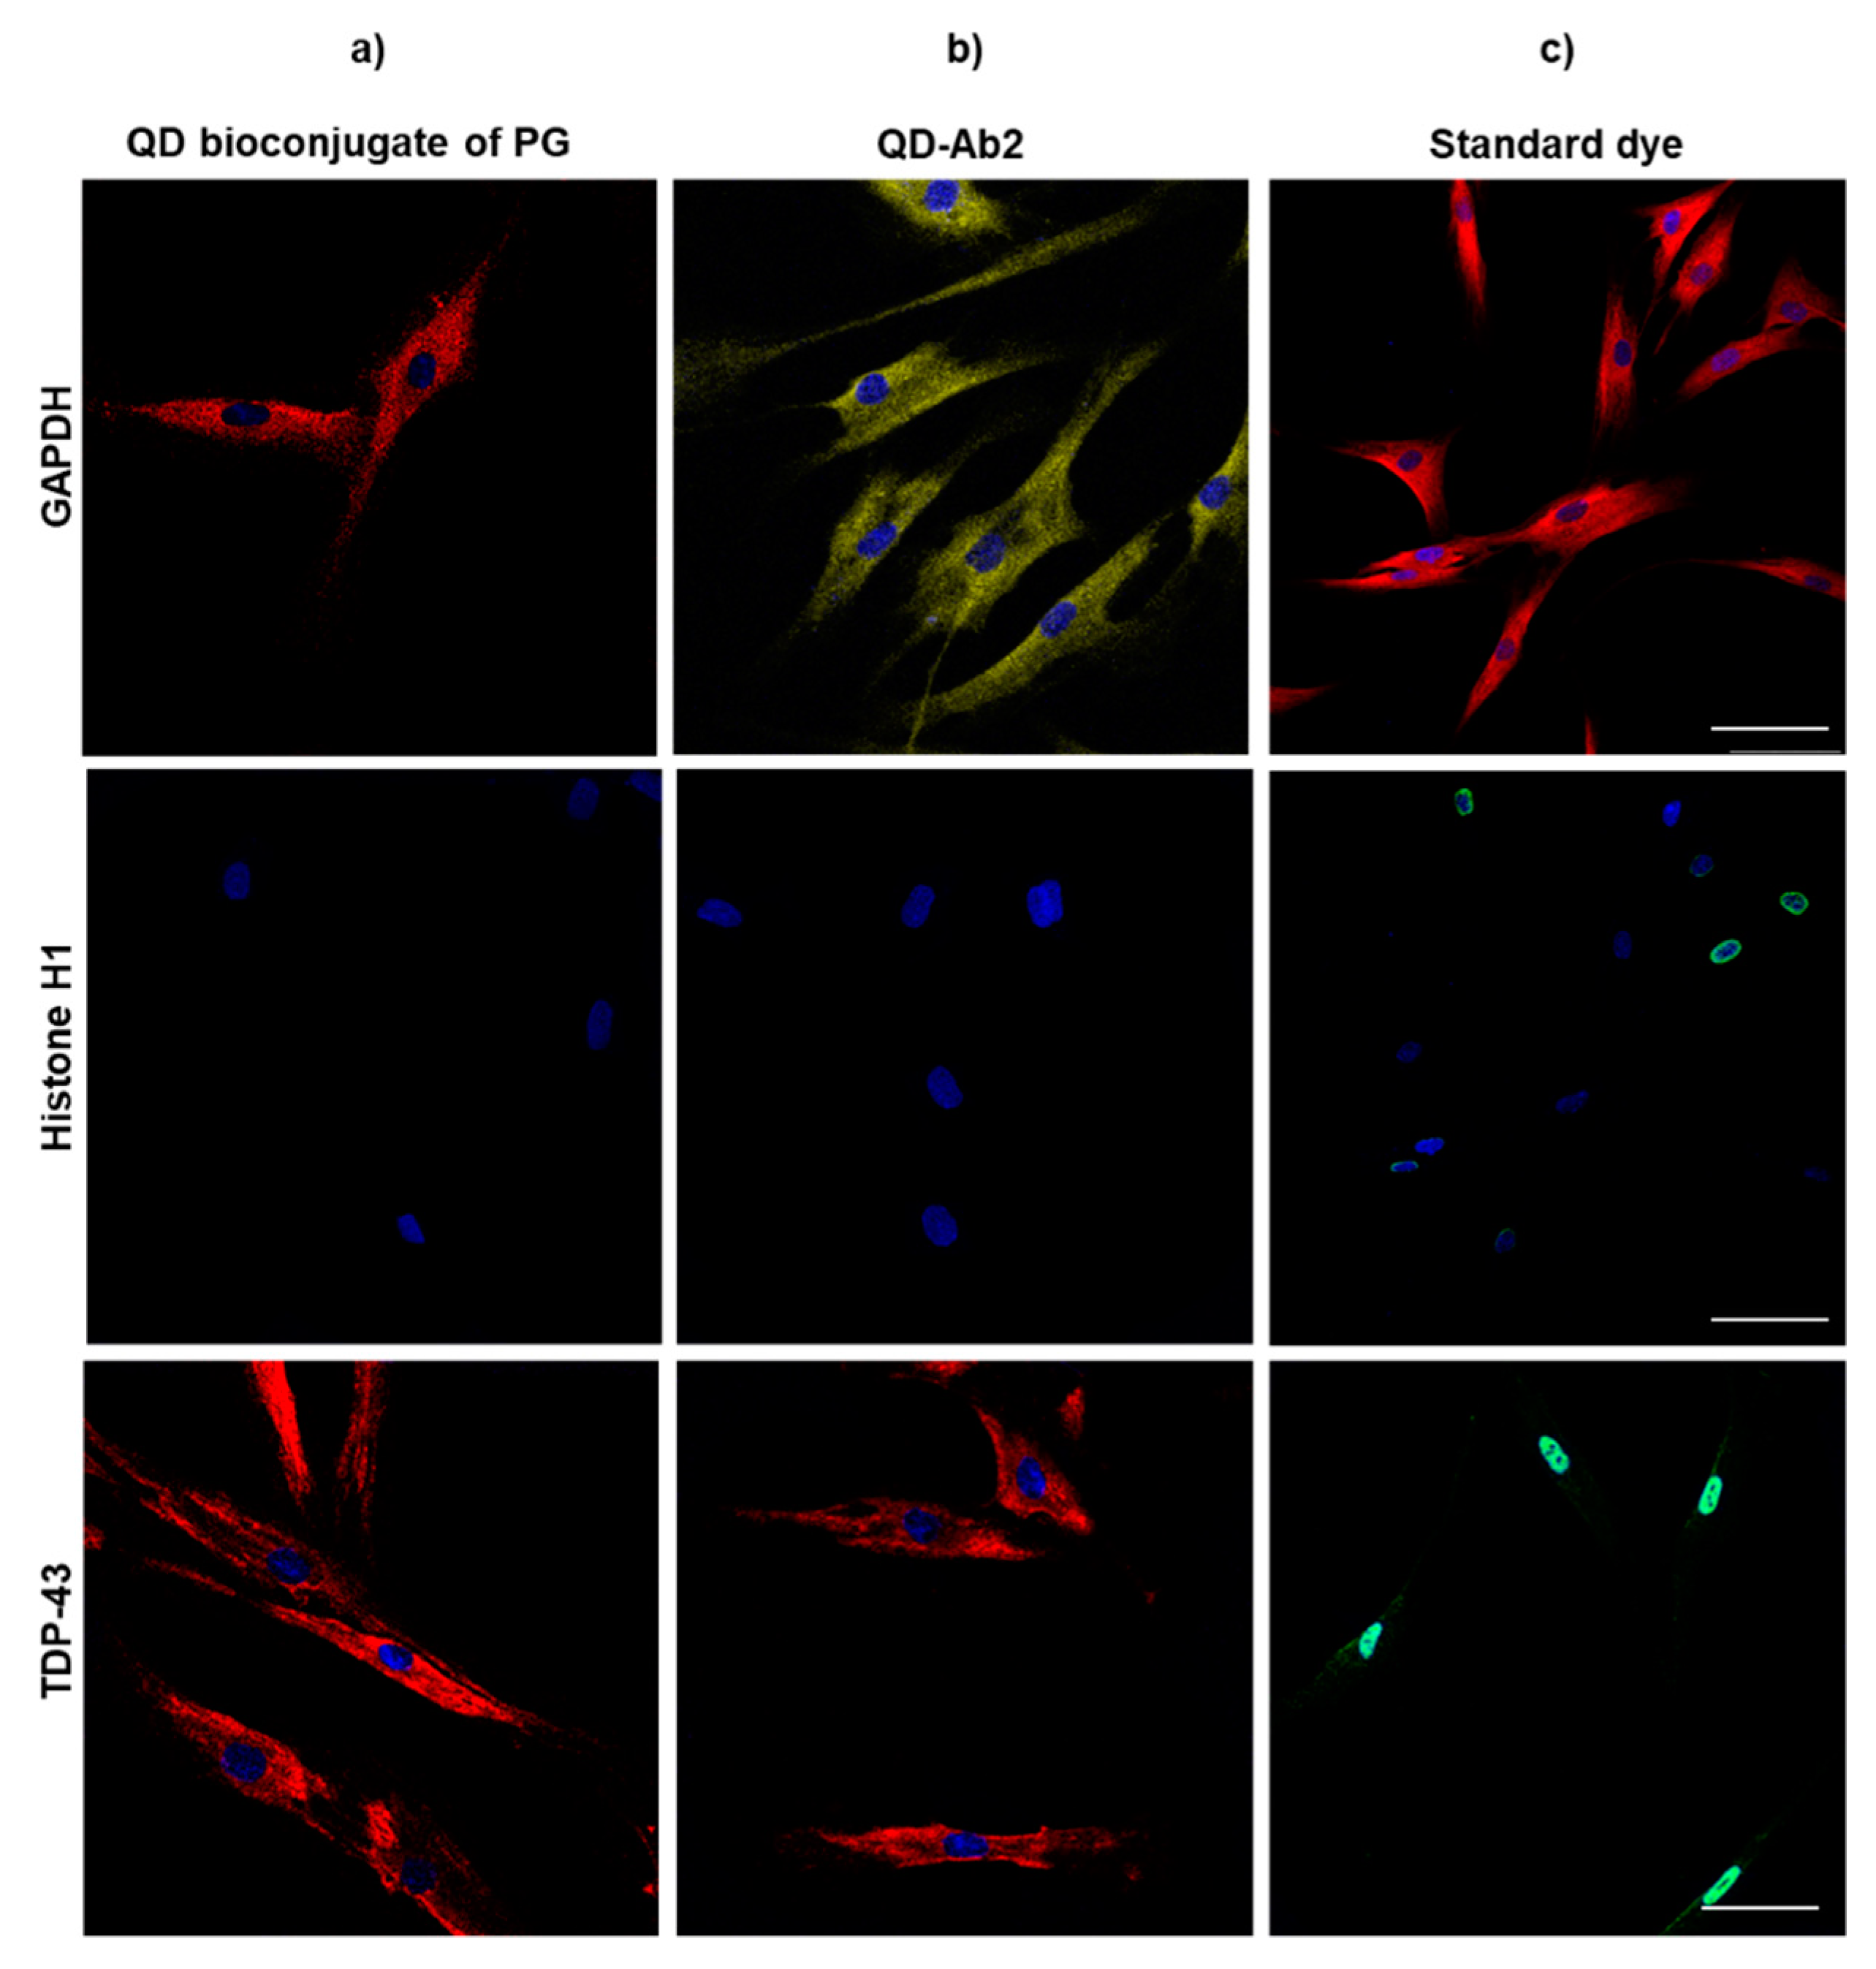
3.2.2. Primary Human Fibroblasts
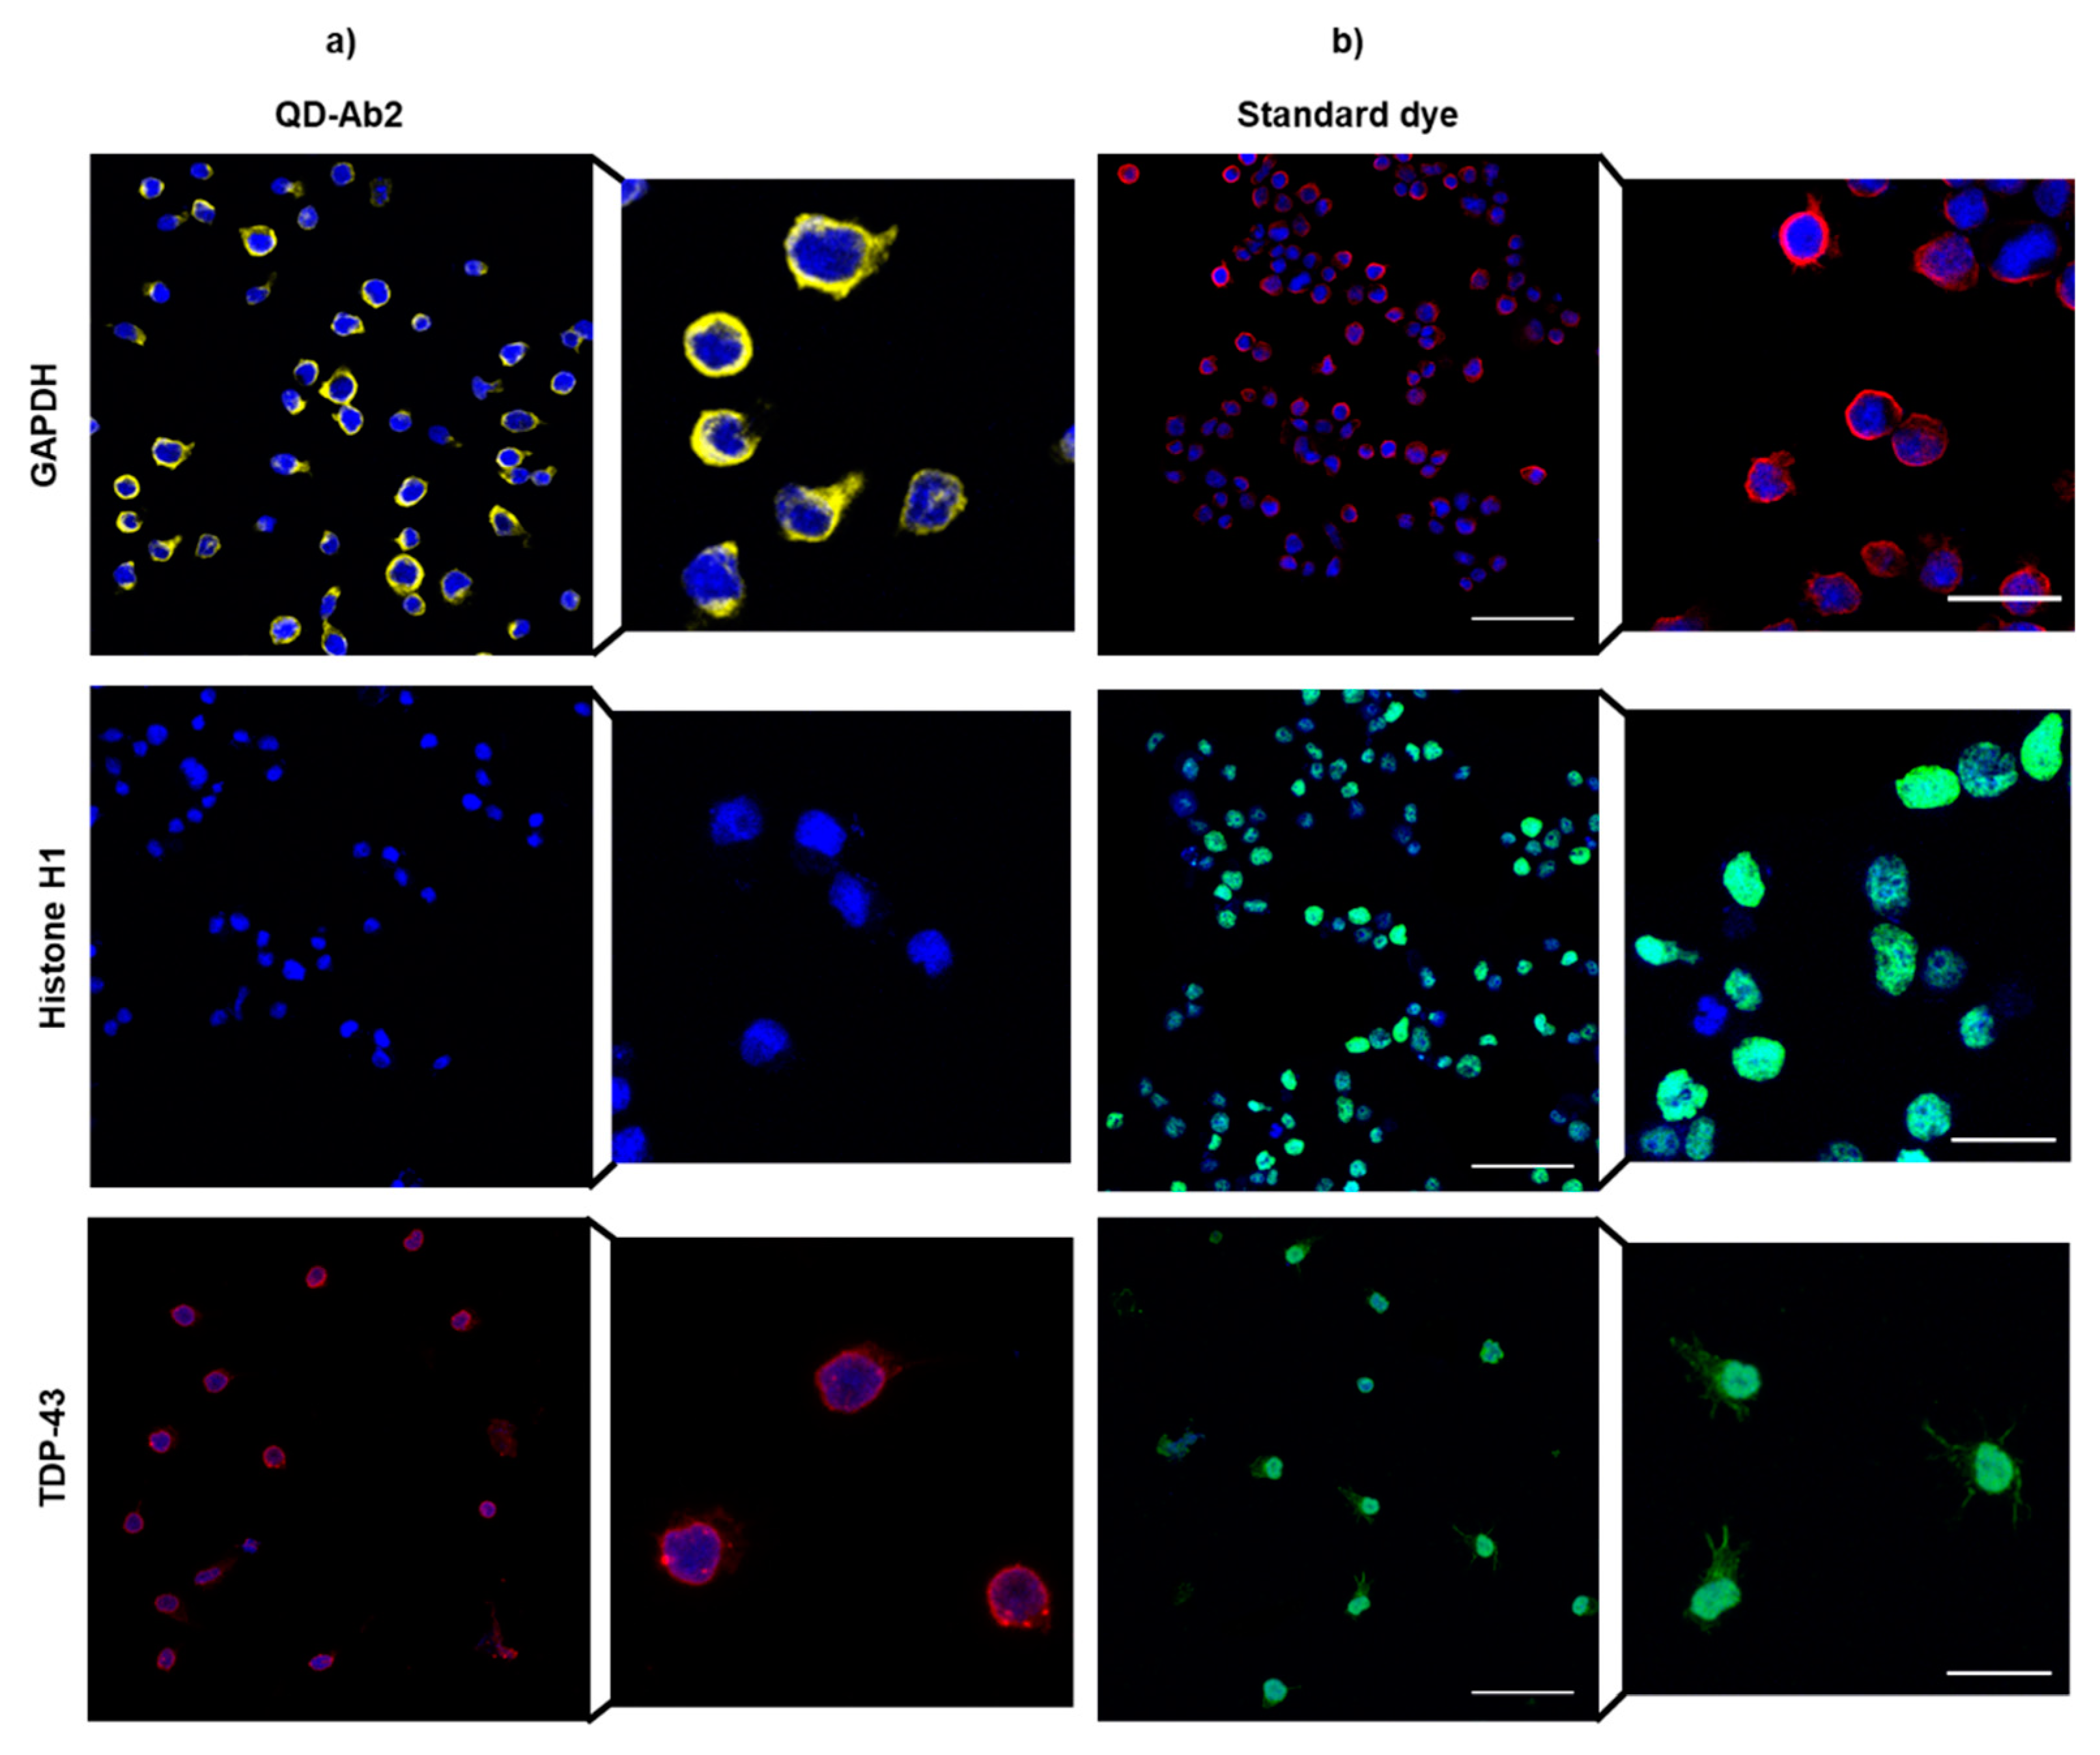
3.2.3. Immortalized Human Lymphocytes
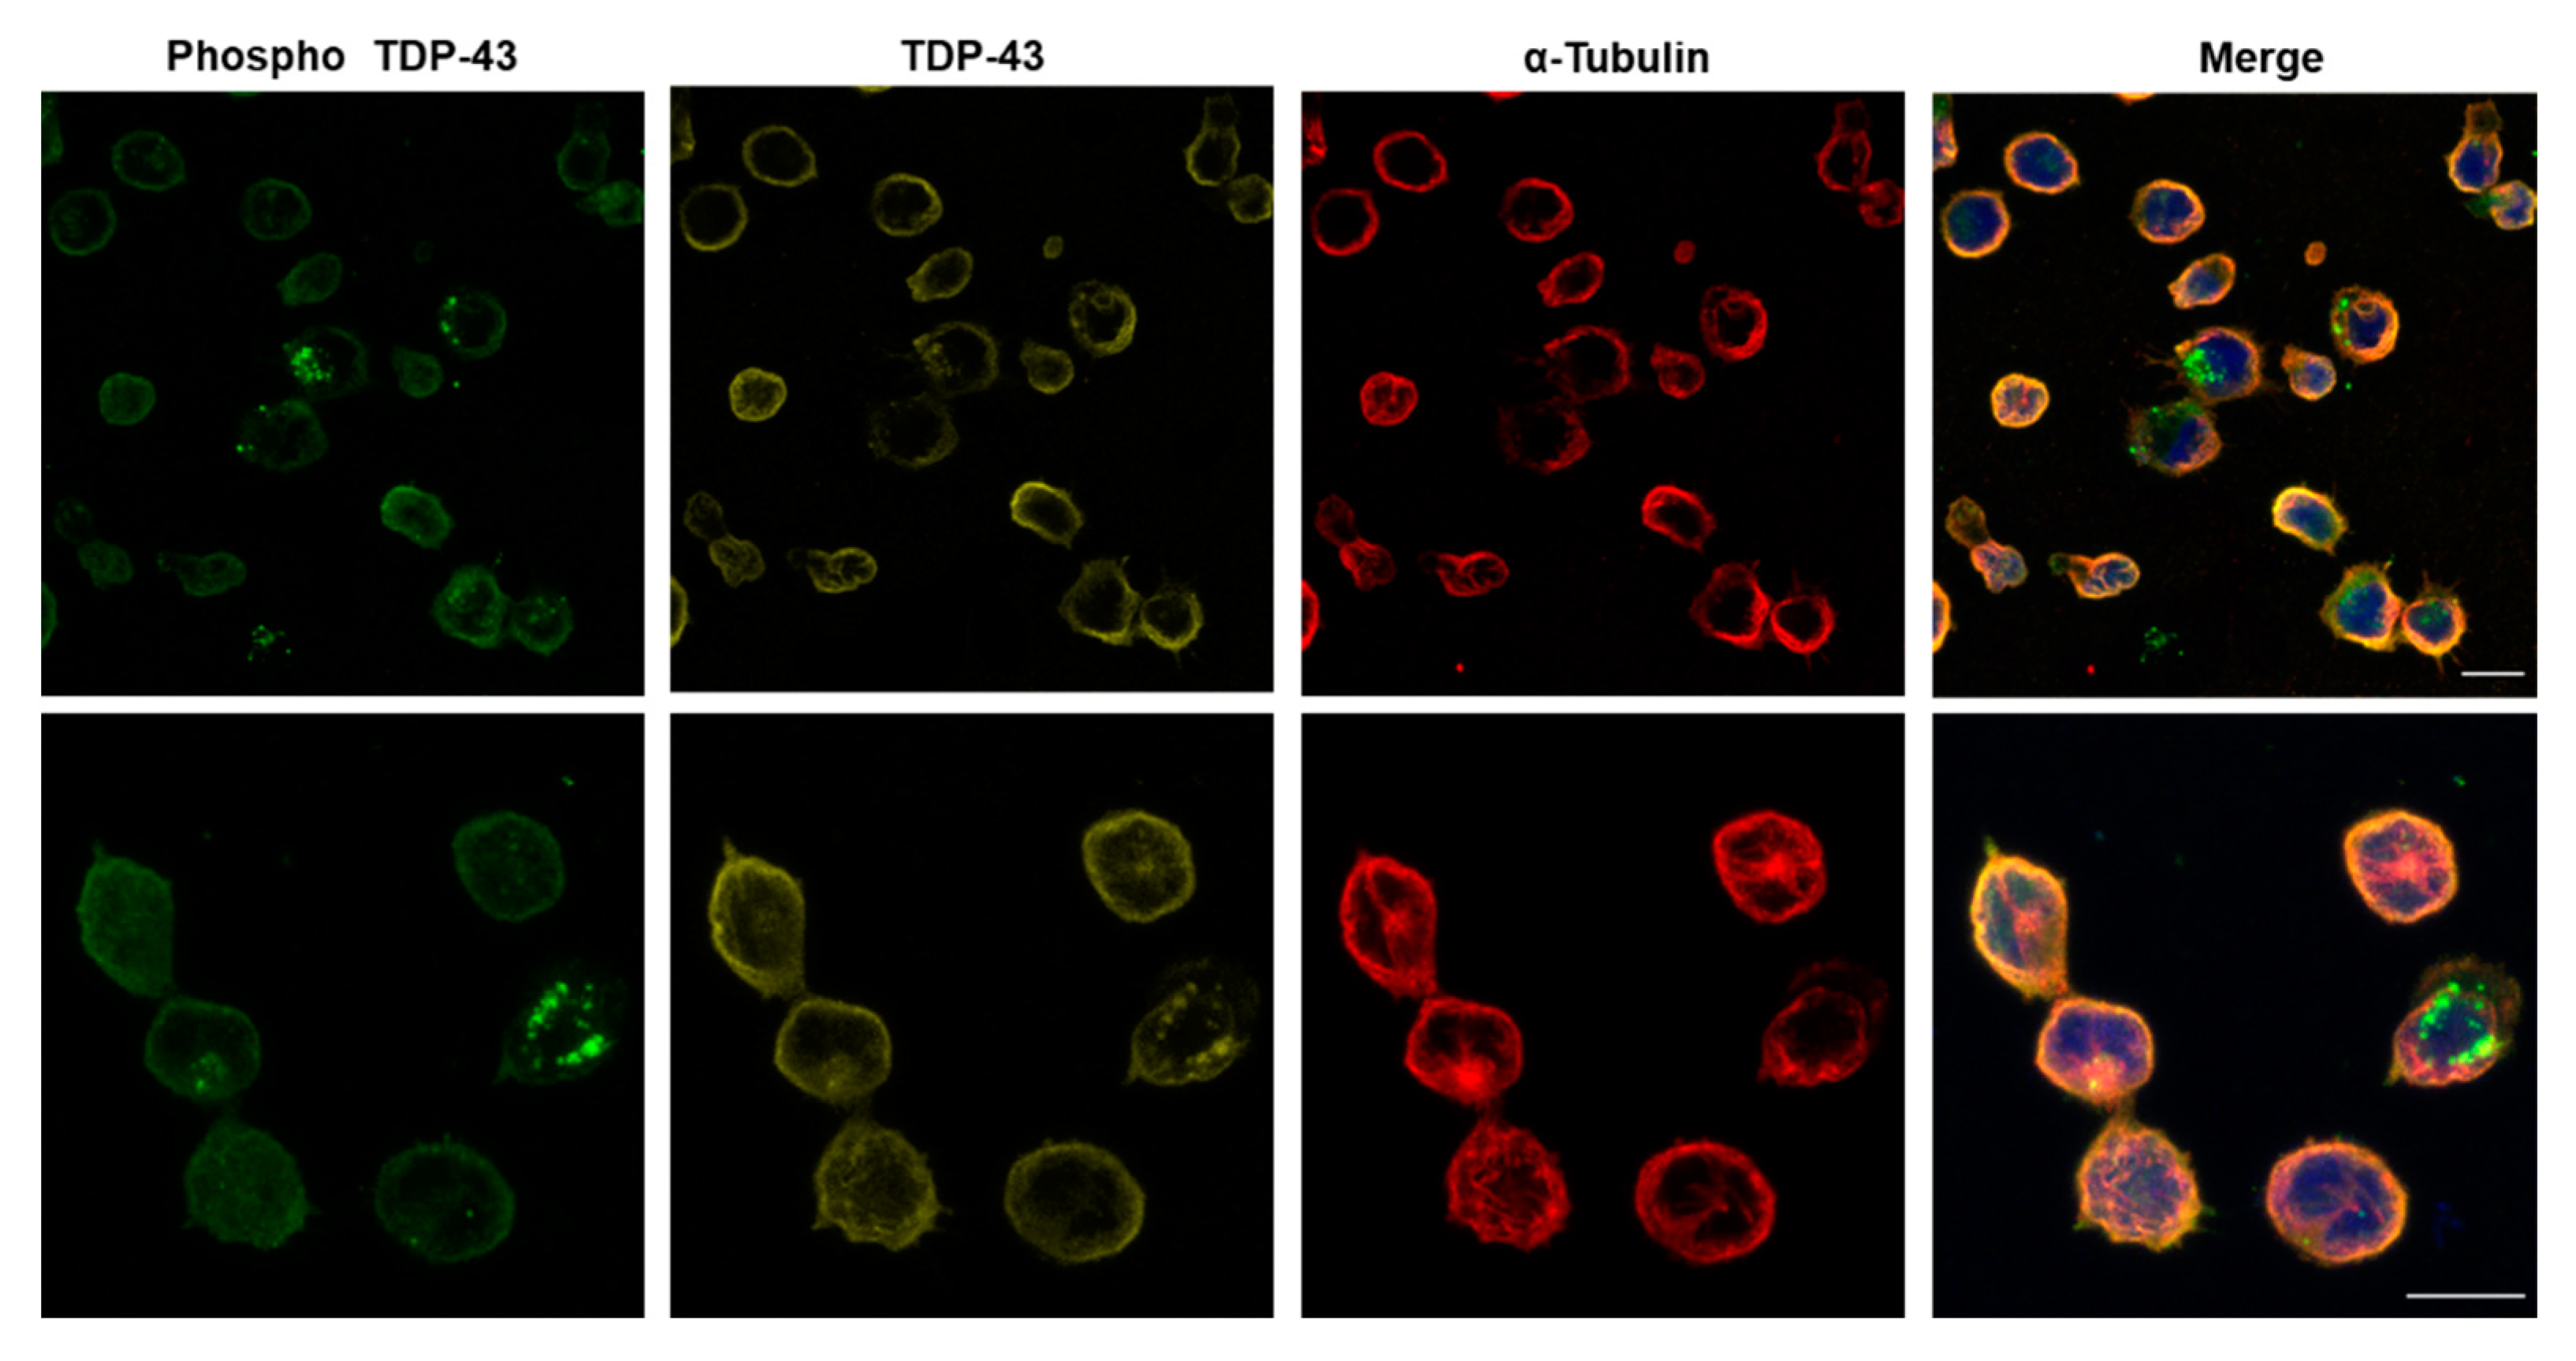
3.3. Multiplexing in Lymphoblasts from Patients
4. Conclusions
Supplementary Materials
Author Contributions
Funding
Data Availability Statement
Acknowledgments
Conflicts of Interest
References
- Hines, M.A.; Guyot-Sionnest, P. Synthesis and Characterization of Strongly Luminescing ZnS-Capped CdSe Nanocrystals. J. Phys. Chem. 1996, 100, 468–471. [Google Scholar] [CrossRef]
- Bentzen, E.L.; Tomlinson, I.D.; Mason, J.; Gresch, P.; Warnement, M.R.; Wright, D.; Sanders-Bush, E.; Blakely, A.R.; Rosenthal, S.J. Surface Modification To Reduce Nonspecific Binding of Quantum Dots in Live Cell Assays. Bioconjug. Chem. 2005, 16, 1488–1494. [Google Scholar] [CrossRef] [PubMed]
- Bruchez, M., Jr.; Moronne, M.; Gin, P.; Weiss, S.; Alivisatos, A.P. Semiconductor Nanocrystals as Fluorescent Biological Labels. Science 1998, 281, 2013–2016. [Google Scholar] [CrossRef]
- Chan, W.C. Quantum Dot Bioconjugates for Ultrasensitive Nonisotopic Detection. Science 1998, 281, 2016–2018. [Google Scholar] [CrossRef] [PubMed]
- Huston, A.; Delehanty, J.; Medintz, I. Quantum Dots for Biomedicine. Opt. Photonics News 2017, 28, 32–39. [Google Scholar] [CrossRef]
- Zhang, T.; Liedl, T. DNA-Based Assembly of Quantum Dots into Dimers and Helices. Nanomaterials 2019, 9, 339. [Google Scholar] [CrossRef]
- Wegner, K.D.; Hildebrandt, N. Quantum dots: Bright and versatile in vitro and in vivo fluorescence imaging biosensors. Chem. Soc. Rev. 2015, 44, 4792–4834. [Google Scholar] [CrossRef] [PubMed]
- Au, G.H.; Mejias, L.; Swami, V.K.; Brooks, A.D.; Shih, W.Y.; Shih, W.-H. Quantitative assessment of Tn antigen in breast tissue micro-arrays using CdSe aqueous quantum dots. Biomaterials 2014, 35, 2971–2980. [Google Scholar] [CrossRef]
- Tak, Y.K.; Naoghare, P.K.; Kim, B.J.; Kim, M.J.; Lee, E.S.; Song, J.M. High-content quantum dot-based subtype diagnosis and classification of breast cancer patients using hypermulticolor quantitative single cell imaging cytometry. Nano Today 2012, 7, 231–244. [Google Scholar] [CrossRef]
- Wu, Y.-T.; Qiu, X.; Lindbo, S.; Susumu, K.; Medintz, I.L.; Hober, S.; Hildebrandt, N. Quantum Dot-Based FRET Immunoassay for HER2 Using Ultrasmall Affinity Proteins. Small 2018, 14, e1802266. [Google Scholar] [CrossRef]
- Petryayeva, E.; Algar, W.R. A job for quantum dots: Use of a smartphone and 3D-printed accessory for all-in-one excitation and imaging of photoluminescence. Anal. Bioanal. Chem. 2016, 408, 2913–2925. [Google Scholar] [CrossRef]
- De Matteis, L.; Martín-Rapún, R.; De La Fuente, J.M. Nanotechnology in Personalized Medicine: A Promising Tool for Alzheimer’s Disease Treatment. Curr. Med. Chem. 2018, 25, 4602–4615. [Google Scholar] [CrossRef]
- Posa, D.; Martínez-González, L.; Bartolomé, F.; Nagaraj, S.; Porras, G.; Martínez, A.; Martín-Requero, Á. Recapitulation of Pathological TDP-43 Features in Immortalized Lymphocytes from Sporadic ALS Patients. Mol. Neurobiol. 2019, 56, 2424–2432. [Google Scholar] [CrossRef] [PubMed]
- Miller, G. Immortalization of human lymphocytes by Epstein-Barr virus. Yale J. Boil. Med. 1982, 55, 305–310. [Google Scholar]
- Tosat-Bitrián, C.; Palomo, V. CdSe quantum dots evaluation in primary cellular models or tissues derived from patients. Nanomed. Nanotechnol. Biol. Med. 2020, 30, 102299. [Google Scholar] [CrossRef]
- Love, S. Post mortem sampling of the brain and other tissues in neurodegenerative disease. Histopathology 2004, 44, 309–317. [Google Scholar] [CrossRef]
- Taylor, J.P.; Brown, R.H., Jr.; Cleveland, D.W. Decoding ALS: From genes to mechanism. Nat. Cell Biol. 2016, 539, 197–206. [Google Scholar] [CrossRef]
- Brooks, B.R.; Miller, R.G.; Swash, M.; Munsat, T.L. El Escorial revisited: Revised criteria for the diagnosis of amyotrophic lateral sclerosis. Amyotroph. Lateral Scler. 2000, 1, 293–299. [Google Scholar] [CrossRef] [PubMed]
- Ibarreta, D.; Parrilla, R.; Ayuso, M.S. Altered Ca2+ homeostasis in lymphoblasts from patients with late-onset Alzheimer disease. Alzheimer Dis. Assoc. Disord. 1997, 11, 220–227. [Google Scholar]
- Pecora, R. Dynamic Light Scattering Measurement of Nanometer Particles in Liquids. J. Nanopart. Res. 2000, 2, 123–131. [Google Scholar] [CrossRef]
- Souza, T.G.F.; Ciminelli, V.S.T.; Mohallem, N.D.S. A comparison of TEM and DLS methods to characterize size distribution of ceramic nanoparticles. J. Phys. Conf. Ser. 2016, 733, 012039. [Google Scholar] [CrossRef]
- Pons, T.; Uyeda, H.T.; Medintz, A.I.L.; Mattoussi, H. Hydrodynamic Dimensions, Electrophoretic Mobility, and Stability of Hydrophilic Quantum Dots. J. Phys. Chem. B 2006, 110, 20308–20316. [Google Scholar] [CrossRef] [PubMed]
- Sur, V.P.; Kominkova, M.; Buchtova, Z.; Dolezelikova, K.; Zitka, O.; Moulick, A. CdSe QD Biosynthesis in Yeast Using Tryptone-Enriched Media and Their Conjugation with a Peptide Hecate for Bacterial Detection and Killing. Nanomaterials 2019, 9, 1463. [Google Scholar] [CrossRef] [PubMed]
- Segets, D. Analysis of Particle Size Distributions of Quantum Dots: From Theory to Application. KONA Powder Part. J. 2016, 33, 48–62. [Google Scholar] [CrossRef]
- Francis, J.E.; Mason, D.; Lévy, R. Evaluation of quantum dot conjugated antibodies for immunofluorescent labelling of cellular targets. Beilstein J. Nanotechnol. 2017, 8, 1238–1249. [Google Scholar] [CrossRef]
- Available online: https://www.uniprot.org/uniprot/Q70AB8 (accessed on 13 January 2021).
- Bjork, I.; Petersson, B.-A.; Sjoquist, J. Some Physicochemical Properties of Protein A from Staphylococcus aureus. JBIC J. Biol. Inorg. Chem. 1972, 29, 579–584. [Google Scholar] [CrossRef]
- Murphy, J.P.; Atkinson, T.; Hartwell, R.; Stevens, G.B.; Hinton, R.J.; Goward, C.R. Amplified expression and large-scale purification of protein G’. Bioseparation 1992, 3, 63–71. [Google Scholar]
- Available online: https://www.proteinatlas.org/ENSG00000167552-TUBA1A/cell (accessed on 13 January 2021).
- Zrazhevskiy, P.; True, L.D.; Gao, X. Multicolor multicycle molecular profiling with quantum dots for single-cell analysis. Nat. Protoc. 2013, 8, 1852–1869. [Google Scholar] [CrossRef]
- Zrazhevskiy, P.; Gao, X. Quantum dot imaging platform for single-cell molecular profiling. Nat. Commun. 2013, 4, 1619. [Google Scholar] [CrossRef]
- Palomo, V.; Tosat-Bitrian, C.; Nozal, V.; Nagaraj, S.; Martin-Requero, A.; Martinez, A. TDP-43: A Key Therapeutic Target beyond Amyotrophic Lateral Sclerosis. ACS Chem. Neurosci. 2019, 10, 1183–1196. [Google Scholar] [CrossRef] [PubMed]
- Neumann, M.; Sampathu, D.M.; Kwong, L.K.; Truax, A.C.; Micsenyi, M.C.; Chou, T.T.; Bruce, J.; Schuck, T.; Grossman, M.; Clark, C.M.; et al. Ubiquitinated TDP-43 in Frontotemporal Lobar Degeneration and Amyotrophic Lateral Sclerosis. Science 2006, 314, 130–133. [Google Scholar] [CrossRef] [PubMed]
- Pinkernelle, J.; Calatayud, P.; Goya, G.F.; Fansa, H.; Keilhoff, G. Magnetic nanoparticles in primary neural cell cultures are mainly taken up by microglia. BMC Neurosci. 2012, 13, 32. [Google Scholar] [CrossRef] [PubMed]
- Smith, W.E.; Brownell, J.; White, C.C.; Afsharinejad, Z.; Tsai, J.; Hu, X.; Polyak, S.J.; Gao, X.; Kavanagh, T.J.; Eaton, D.L. In Vitro Toxicity Assessment of Amphiphillic Polymer-Coated CdSe/ZnS Quantum Dots in Two Human Liver Cell Models. ACS Nano 2012, 6, 9475–9484. [Google Scholar] [CrossRef] [PubMed]
- Lockman, P.R.; Koziara, J.M.; Mumper, R.J.; Allen, D.D. Nanoparticle Surface Charges Alter Blood–Brain Barrier Integrity and Permeability. J. Drug Target. 2004, 12, 635–641. [Google Scholar] [CrossRef]
- Alquezar, C.; Salado, I.G.; De La Encarnación, A.; Pérez, D.I.; Moreno, F.; Gil, C.; De Munain, A.L.; Martínez, A.; Martín-Requero, Á. Targeting TDP-43 phosphorylation by Casein Kinase-1δ inhibitors: A novel strategy for the treatment of frontotemporal dementia. Mol. Neurodegener. 2016, 11, 1–14. [Google Scholar] [CrossRef]


Publisher’s Note: MDPI stays neutral with regard to jurisdictional claims in published maps and institutional affiliations. |
© 2021 by the authors. Licensee MDPI, Basel, Switzerland. This article is an open access article distributed under the terms and conditions of the Creative Commons Attribution (CC BY) license (http://creativecommons.org/licenses/by/4.0/).
Share and Cite
Tosat-Bitrián, C.; Avis-Bodas, A.; Porras, G.; Borrego-Hernández, D.; García-Redondo, A.; Martín-Requero, A.; Palomo, V. CdSe Quantum Dots in Human Models Derived from ALS Patients: Characterization, Nuclear Penetration Studies and Multiplexing. Nanomaterials 2021, 11, 671. https://doi.org/10.3390/nano11030671
Tosat-Bitrián C, Avis-Bodas A, Porras G, Borrego-Hernández D, García-Redondo A, Martín-Requero A, Palomo V. CdSe Quantum Dots in Human Models Derived from ALS Patients: Characterization, Nuclear Penetration Studies and Multiplexing. Nanomaterials. 2021; 11(3):671. https://doi.org/10.3390/nano11030671
Chicago/Turabian StyleTosat-Bitrián, Carlota, Alicia Avis-Bodas, Gracia Porras, Daniel Borrego-Hernández, Alberto García-Redondo, Angeles Martín-Requero, and Valle Palomo. 2021. "CdSe Quantum Dots in Human Models Derived from ALS Patients: Characterization, Nuclear Penetration Studies and Multiplexing" Nanomaterials 11, no. 3: 671. https://doi.org/10.3390/nano11030671
APA StyleTosat-Bitrián, C., Avis-Bodas, A., Porras, G., Borrego-Hernández, D., García-Redondo, A., Martín-Requero, A., & Palomo, V. (2021). CdSe Quantum Dots in Human Models Derived from ALS Patients: Characterization, Nuclear Penetration Studies and Multiplexing. Nanomaterials, 11(3), 671. https://doi.org/10.3390/nano11030671