Article

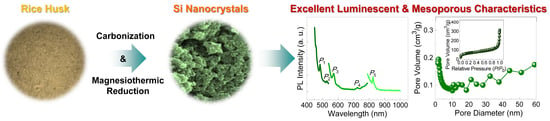
Derivation of Luminescent Mesoporous Silicon Nanocrystals from Biomass Rice Husks by Facile Magnesiothermic Reduction

1
Division of Physics & Semiconductor Science, Dongguk University-Seoul, Seoul 04620, Korea
2
Quantum-Functional Semiconductor Research Center, Dongguk University-Seoul, Seoul 04620, Korea
*
Author to whom correspondence should be addressed.
Nanomaterials 2021, 11(3), 613; https://doi.org/10.3390/nano11030613
Submission received: 31 December 2020 / Revised: 18 February 2021 / Accepted: 22 February 2021 / Published: 1 March 2021
(This article belongs to the Special Issue Silica and Silicon Based Nanostructures)

Abstract

:
High-quality silicon (Si) nanocrystals that simultaneously had superior mesoporous and luminescent characteristics were derived from sticky, red, and brown rice husks via the facile and cost-effective magnesiothermic reduction method. The Si nanocrystals were confirmed to comprise an aggregated morphology with spherical nanocrystals (e.g., average sizes of 15–50 nm). Due to the surface functional groups formed at the nanocrystalline Si surfaces, the Si nanocrystals clearly exhibited multiple luminescence peaks in visible-wavelength regions (i.e., blue, green, and yellow light). Among the synthesized Si nanocrystals, additionally, the brown rice husk (BRH)-derived Si nanocrystals showed to have a strong UV absorption and a high porosity (i.e., large specific surface area: 265.6 m2/g, small average pore diameter: 1.91 nm, and large total pore volume: 0.5389 cm3/g). These are indicative of the excellent optical and textural characteristics of the BRH-derived Si nanocrystals, compared to previously reported biomass-derived Si nanocrystals. The results suggest that the biomass BRH-derived Si nanocrystals hold great potential as an active source material for optoelectronic devices as well as a highly efficient catalyst or photocatalyst for energy conversion devices.

Graphical Abstract

1. Introduction

Silicon (Si) is one of the most powerful semiconductors that have led to the strong advancement of modern electronics. However, bulk Si is inadequate as an active material (i.e., a core part for visible light emission or detection) in optoelectronic devices because of its indirect bandgap with an infrared energy gap of 1.12 eV at 300 K [1,2]. One effective way to overcome this issue is the nanocrystallization of Si, which can allow us to create visible light emission and detection characteristics, attributable to the quantum confinement effect and the size effect in Si nanocrystals [3,4,5,6,7]. Therefore, the fabrication of Si nanocrystals has attracted tremendous attention in wide scientific and technologic communities because of their vast application fields in optoelectronics as well as electronics. For instance, nanofloating gate flash memory devices [8,9,10,11], field-effect electroluminescence devices [12,13], tandem solar cells [14], and optical waveguides [15,16] are typical examples that can use the quantum-confined electronic energy system in Si nanocrystals. Owing to the high porosity of Si nanocrystals, furthermore, they are also very useful as an active source material in energy storage and conversion devices. For example, Si nanocrystals could be used as an effective catalyst for the hydrogen evolution reaction [17], and be utilized as an anodic source material for highly energy-efficient lithium-ion and sodium-ion batteries [18,19,20].
To obtain highly porous and/or highly luminescent Si nanocrystals, many researchers have contrived and designed various experimental methods, e.g., laser ablation [21], nonthermal plasma processes [22], pulsed laser deposition [23], chemical doping [24], electrochemical etching [25], chemical vapor deposition [26], annealing of borophosphosilicate glasses [27], and laser pyrolysis [28]. However, these methods require expensive equipment, complex procedures, and high thermal budgets (also see Table S1, Supplementary Materials). Therefore, a facile and cost-effective approach is necessary for the mass production of Si nanoparticles. Considering both the cost-effectiveness and the eco-friendliness, biomass wastes are truly fascinating resources that can provide us with natural siliceous constituents. Accordingly, various biomass resources (e.g., sugarcane bagasse [29], bamboo leaves [29,30], beach sand [31], corn leaves [32], and rice husks (RHs) [33,34,35,36,37]) were used in earlier studies for the derivation of high-quality Si nanocrystals (also see Table S2 for the comparison of Si production from various biomass resources by using several experimental techniques, Supplementary Materials). Among them, RHs are one of the most prominent siliceous precursors because of their huge availability and high silica contents [18,38,39]. These provide us with a good hint to produce a large amount of Si nanocrystals via the recycling of biomass RHs. Despite such benefits, to our best knowledge, the synthesis of RH-derived high-quality Si nanocrystals with both high porosity and high luminescence has not been reported to date. Furthermore, the coexistence of both mesoporous and luminescent characteristics in a single material system is truly helpful for future energy technology; for example, the photocatalytic hydrogen evolution reaction [40,41,42] and oxygen evolution reaction [43,44,45].
We, therefore, investigated the facile derivation of mesoporous-and-luminescent Si nanocrystals from various RHs (i.e., sticky RHs, red RHs, and brown RHs) through the magnesiothermic reduction process, which can be simply performed in an inert atmosphere without toxic gases and vacuum facilities. Herein, we report on a comprehensive study from the synthesis to the characterization of RH-derived mesoporous luminescent Si nanocrystals. The kinetics of magnesiothermic reduction for Si nanocrystal production is discussed, and the structural, morphological, optical, and textural properties of the synthesized Si nanocrystals are thoroughly examined in detail.

2. Experimental Section

2.1. Material Preparation

The biomass sticky rice husks (S-RHs) were collected from Gyeonggi, South Korea, and the red rice husks (R-RHs) and brown rice husks (B-RHs) were collected from Perambalur, Tamil Nadu, India. Hydrochloric acid (HCl, 37%), hydrofluoric acid (HF, 48%), and magnesium (Mg, 99% purity) powders were purchased from Sigma-Aldrich (St. Louis, MO, USA) and used with no additional purification.

2.2. Synthesis of Si Nanocrystals

The derivation of the Si nanocrystals via magnesiothermic reduction can be described by the following chemical reactions:
SiO 2 ( Ashes ) + HCl 27   ° C   ( 2   h ) SiO 2 ( Colloidal ) + H 2 O + MCl
SiO 2 ( Colloidal ) 700   ° C   ( 2   h ) SiO 2 ( Nanoparticles )
SiO 2 ( Nanoparticles ) + 2 Mg 700   ° C   ( 2   h ) Si ( Nanocrystals ) + 2 MgO
Si ( Nanocrystals ) + 2 MgO + 4 HCl 27   ° C   ( 10   h )   Si   ( Nanocrystals ) + 2 MgCl 2 + 2 H 2 O
M in Equation (1) is the possible precipitates from raw bio-silica in the biomass RHs (e.g., Na, K, Ca, Fe, and Mg), which are normally removed as MCl after the HCl treatment. To investigate the dependence of the biomass RH resources, we used three different types of RHs, i.e., S-RHs, R-RHs, and B-RHs. As schematically illustrated in Figure 1, initially, all three types of RHs were carbonized at 500 °C for 2 h under an air atmosphere to obtain their ashes. Then, 3 g of each RH ash was stirred in a 10% HCl solution for 2 h to eliminate metal ions and contamination (e.g., Equation (1)). After HCl leaching, the samples were rinsed with deionized water (DI), filtered, and dried at 150 °C for 15 h in an electric oven. Subsequently, the samples were transferred to an alumina crucible and were further calcinated at 700 °C for 2 h under an air atmosphere in a muffle furnace (e.g., Equation (2)). During this calcination step, the silica nanopowders were obtained from the HCl-leached RH ashes. Next, the SiO2 nanopowders were reduced into the Si nanocrystals through magnesiothermic reduction. To achieve the reduction reaction, as a primary task, each type of SiO2 nanopowder (2 g) was mixed with the Mg powders (0.5 g). Then, the mixture powders were annealed at 700 °C for 2 h under an Ar atmosphere in a tube furnace (e.g., Equation (3)). The obtained products were stimulated with 1 M HCl (HCl:H2O:EtOH = 0.66:4.72:8.88 molar ratio) for 10 h to remove MgO (e.g., Equation (4)). After the HCl treatment, the colloidal solutions were reacted with 5% HF for 1 h to eliminate the residual SiO2 inside the magnesiothermically reduced Si nanopowders. Finally, the obtained Si nanopowders were washed in DI water, filtered, and dried at 80 °C for 12 h under vacuum. Through these sequences, we were able to obtain the powder type of the Si nanocrystals. For convenience, we denote the three different types of the Si nanocrystals as S-Si, R-Si, and B-Si, which were derived from S-RHs, R-RHs, and B-RHs, respectively.

2.3. Characterization of Material Properties

The morphological and the compositional properties of the Si nanocrystals were monitored by field-emission scanning electron microscopy (FE-SEM) using an Inspect F50 system (FEI Co., Mahwah, NJ, USA) and its in situ energy dispersive X-ray (EDX) spectroscopy, respectively. The structural and the vibrational properties of the samples were characterized by Raman scattering spectroscopy using a LabRAM HR800 system (HORIBA Jobin Yvon Inc., Edison, NJ, USA) and X-ray diffractometry (XRD) using a D2 Phaser system (Bruker, Madison, WI, USA), respectively. The functional groups of the nanocrystals were examined by Fourier transform infrared (FTIR) spectroscopy using a Spectrum-100 system (Perkin Elmer, Shelton, CT, USA). The optical absorption and emission characteristics were evaluated by UV–VIS spectroscopy using an S-3100 system (Scinco, Seoul, Republic of Korea) and photoluminescence (PL) spectroscopy using a Cary Eclipse Fluorescence Spectrophotometer (Agilent Technologies, Santa Clara, CA, USA), respectively. The textural properties were analyzed by nitrogen absorption–desorption isotherms (N2-ADI) using a BELSORP-mini II system (MicrotracBEL, Osaka, Japan).

3. Results and Discussion

3.1. Morphological and Compositional Properties

Figure 2 shows the FE-SEM images of the S-Si, R-Si, and B-Si nanocrystals. The S-Si sample exhibited cylindrically interconnected spherical nanocrystals (Figure 2a). However, the R-Si and the B-Si samples displayed a nanosponge-like morphology, where a lot of small spherical nanocrystals were densely aggregated (Figure 2b,c).
Here, it should be noticed that the average crystal size of B-Si (~15 nm) is much smaller than those of R-Si (~35 nm) and S-Si (~50 nm). We believe such a discrepancy is attributable to the smaller contents of Si species in the raw sources of the B-RH ashes (Si~2.46%) than the R-RH (Si~5.95%) and S-RH ashes (Si~24.62%) (see Figure S1, Supplementary Materials). In other words, during the acid treatment and the calcination step (i.e., Equations (1) and (2)), the size of the colloidal SiO2 should be smaller for the B-RH case than the others because the lower quantity of Si species in B-RH (i.e., raw bio-silica in the biomass resource) may increase the segregation of the silica nanoparticles [46]. According to previous literature [47,48], using the Fokker–Planck equation [49,50,51], the size distribution of the Si nanoparticles (C(i,t)) can be described as follows:
C ( i , t ) t = ( N ( t ) N e ) ( k ( i ) C ( i , t ) ) i + ( N ( t ) + N e ) 2 ( k ( i ) C ( i , t ) ) 2 i 2 ,
where i is the number of Si atoms, Ne is the equilibrium concentration of impurity atoms in the substance matrix, and N(t) is the number of Si atoms in the nanocrystal at each moment of time. The kinetic coefficient k(i) in Equation (5) is proportional to both the diffusion coefficient of the Si atoms in the matrix D and the Si nanocrystal radius (R(i)):
k ( i ) = 4 π D R ( i )
R ( i ) = b ( i + m ) α ,
where b is the distance parameter of the nanocrystals, m is the size homogeneity factor, and α is the geometry factor (= 1/3 for spherical nanocrystals). Hence, the smaller size of B-Si can be interpreted as resulting from the lower concentration of Si species in B-RH. We therefore conjecture that the size of the Si nanocrystals could be automatically controlled by choosing the type of the biomass raw resources.
Next, the compositional properties of the samples were evaluated by EDX. As shown in Figure 2d–f, all the prepared samples were composed of the main species of Si and O, arising from the body and the surface of the nanocrystals, respectively. The additional component of Pt is thought of as sprouting from the conductive coating layer for the FE-SEM measurements.

3.2. Structural and Vibrational Properties

The crystallographic properties of the S-Si, R-Si, and B-Si samples were characterized by XRD. As shown in Figure 3a, all of the three samples exhibited the typical diffraction patterns of crystalline Si at 28.4°, 47.4°, 56.1°, 69.1°, 76.4°, and 88.2°, which correspond to the (111), (220), (311), (400), (331), and (422) Si planes (JCPDS No. 27-1402 [18,33,52,53]), respectively. This means that all three, S-Si, R-Si, and B-Si, were well crystallized via magnesiothermic reduction from the biomass resources of the S-RH, R-RH, and B-RH ashes, respectively. By using the Scherer formula [54,55,56], the average crystallite sizes of the S-Si, R-Si, and B-Si nanocrystals were determined to be 33, 28, and 22 nm, respectively. This corroborates the dependence of the Si nanocrystal size on the kind of biomass raw source; i.e., the Si nanocrystal size relies on the different Si contents in each RH, as confirmed in Figure 2. The nanocrystallization of the samples was further elucidated by Raman spectroscopy measurements. As shown in Figure 3b, the Raman spectra of all three samples revealed a similar feature of the typical Raman vibration modes from crystalline Si. Namely, the sharp peak at 519 cm−1 (i.e., the first-order transversal optical (TO) mode [18,57,58]) and the broad hump at 957 cm−1 (i.e., the second-order TO mode [18,57,58]) are clearly observable in all the samples, while no other Raman bands are visible. This demonstrates that the high-purity Si nanocrystals were effectively derived from the biomass RHs through the magnesiothermic reduction process.
For the nanostructured materials, the functional groups of the elemental species and molecular states depend on the shape and the size of the nanomaterials because they rely on the bonding states at the surface terminals. To examine the functional groups of the samples, FTIR measurements were carried out. As shown in Figure 3c, the samples displayed several FTIR features at 795, 869, 956, 1070, 1377, 1643, 2884, 2977, and 3648 cm−1, all of which are closely relevant to the Si nanostructure. In other words, the transmission band at 795 cm−1 is ascribed to the Si–C stretching mode [36], and the vibrational band at 869 cm−1 is attributed to the Si–N stretching mode [59,60]. Similarly, the band at 956 cm−1 arose from the Si–H bending mode [61]. Additionally, the bands at 1070, 1377, 2884, and 2977 cm−1 correspond to the Si–O bending, CH3 bending, symmetric CH2 vibration, and CH3 stretching modes, respectively [59,62,63]. The bands at 3648 and 1643 cm−1 are responsible for the Si–OH vibrations [64].

3.3. Optical Properties

Figure 4a shows the UV−VIS absorption spectra of the S-Si, R-Si, and B-Si samples. The B-Si nanocrystals revealed strong UV adsorption, while the S-Si and the R-Si nanocrystals exhibited predominant visible-light adsorption characteristics. For B-Si, particularly, two distinct Si nanocrystal-related absorption bands are observable at A1~270 nm and A2~340 nm. Namely, the A1 peak and the A2 shoulder are associated with the LL and the ΓΓ transitions in nanocrystalline Si, respectively [6,36]. Since both the A1 and A2 adsorption intensities indicate the degree of nanocrystallization [65], one can observe that the B-Si sample was well crystallized with a smaller size than the others, as confirmed by FE-SEM and XRD.
According to earlier literature [3,4,5], those transitions originate from the discrete energy states within the modified electronic band structure of the Si nanocrystal. In other words, when the nanocrystal size becomes smaller than the exciton Bohr radius (~4 nm for Si), the subbands above the conduction band and below the valence band could be altered because of the quantum confinement effect. Then, discrete energy states would be created inside the modified electronic band structure. Furthermore, since the Si nanocrystal surface is typically terminated by H, C, and O (also see the FTIR for our samples in Figure 3c), the overlap of electron and hole wave-functions would become significant [65]. These subband modulation effects can be elucidated by PL. As shown in Figure 4b, the samples emitted visible light at P1~485 nm, P2~530 nm, P3~545 nm, and P4~573 nm. The strong P1 emission is reported to emerge from the radiative optical transitions between the discrete energy states that are created at the Si-OH surface functional groups [66] (also see Figure 4c). The other peaks at P2, P3, and P4 are also well known to arise from the radiative optical transitions between the energy states that are created by the surface functional groups of Si–O [67], Si–C [5], and Si–H [68,69], respectively. Figure 5 shows the excitation-dependent PL spectra of the S-Si, R-Si, and B-Si samples. As the excitation wavelength (λex) increased, the peak position of the light emission (λemit) tended to shift to the longer wavelength region (i.e., red shift). Such a λemit dependence on λex was present in all the samples, and the λemit positions were almost identical, regardless of the raw source of the RHs. These findings depict that the PL emission in all the samples originated from the surface functional group-related subband modulation rather than the quantum confinement effect.

3.4. Textural Properties

The nanocrystallization of Si would have sturdily affected the porosity of the entire material system because the locally crystallized small nanocrystal has a high surface-to-volume ratio. In short, the nanocrystals must form structural voids at the surface area, giving rise to an increase in the porosity of the material. To assess the porosity of the S-Si, R-Si, and B-Si samples, thus, the textural characteristics were evaluated by the Brunauer–Emmett–Teller (BET) and the Barrett–Joyner–Halenda (BJH) analysis methods. Firstly, the specific surface area (Sss) was determined by N2-ADI measurements. As shown in Figure 6, all the samples exhibited Type-IV isotherm curves (classified according to IUPAC), representing the distinctive mesoporous characteristics of the materials [33,70]. Through the BET analysis, the Sss values of the S-Si, R-Si, and B-Si nanocrystals were calculated to be 168.1, 212.4, and 265.6 m2/g, respectively.
Next, the pore distribution characteristics were examined by BJH measurements (Figure 7). The pore surface areas (Sps) were determined to be 149.3, 196.9, and 218.5 m2/g for the S-Si, R-Si, and B-Si nanocrystals, respectively, and the total pore volumes (Vtp) were calculated to be 0.4103, 0.4201, and 0.5389 cm3/g for S-Si, R-Si, and B-Si, respectively. Compared to S-Si and R-Si, the B-Si sample had larger magnitudes of Sps and Vtp because of both the smaller nanocrystal size and the uniform distribution. Accordingly, the average pore diameter of B-Si (dap~4.91 nm) was also smaller than those of S-Si (dap~9.76 nm) and R-Si (dap~7.82 nm).
Finally, we compared the textural and the optical characteristics of our samples with various biomass-derived Si nanocrystals previously reported. As can be confirmed from Table 1 and Table 2, the B-Si nanocrystals possessed a superior porosity compared to the others, and had a great potential for multiple light emissions. Based on all the above results, therefore, one can surmise that the magnesiothermically reduced biomass B-Si nanocrystals hold great promise in various applications such as energy storage/conversion devices and optoelectronic devices.

4. Conclusions

High-quality Si nanocrystals that simultaneously showed both strong luminescence and high porosity were successfully derived from various RHs through the facile magnesiothermic reduction method. Owing to the different quantities of raw bio-silica in each RH, the size of the Si nanoparticles could be automatically varied from 15 to 50 nm. Due to the existence of the surface functional groups at the nanocrystals, the samples showed multiple light emissions in the visible-wavelength regions (i.e., blue, green, and yellow). Among the prepared samples, the B-Si nanocrystals exhibited a higher UV absorption and a superior porosity. The results depict that the B-RH-derived Si nanocrystals can play a crucial role as high-performance electrocatalysts, photocatalysts, and light emitters.

Supplementary Materials

The Supplementary Materials are available online at https://www.mdpi.com/2079-4991/11/3/613/s1: Chemical Composition of Rice Husk Ashes; Comparison of Various Methods for Silicon Production; Figure S1. EDX spectra of (a) S-RH, (b) R-RH, and (c) B-RH ashes. Note that Pt in each raw source material arose from the conductive coating of Pt for better focusing and imaging during SEM and EDX measurements, Table S1. Summary of silicon synthesized from various resources through several experimental methods, Table S2. Summary of silicon synthesized from various biomass resources through several experimental methods.

Author Contributions

Investigation and writing—original draft, S.S.; conceptualization, supervision, funding acquisition, and writing—review and editing, S.L. All authors have read and agreed to the published version of the manuscript.

Funding

This research was supported by the National Research Foundation (NRF) of Korea through the Basic Science Research Programs (2016R1A6A1A03012877 and 2019R1A2C1085448) funded by the Korean Government.

Conflicts of Interest

The authors declare no conflict of interest.

References

  1. Grim, J.Q.; Manna, L.; Moreels, I. A sustainable future for photonic colloidal nanocrystals. Chem. Soc. Rev. 2015, 44, 5897–5914. [Google Scholar] [CrossRef] [Green Version]
  2. Berencén, Y.; Prucnal, S.; Liu, F.; Skorupa, I.; Hübner, R.; Rebohle, L.; Zhou, S.; Schneider, H.; Helm, M.; Skorupa, W. Room-temperature short-wavelength infrared Si photodetector. Sci. Rep. 2017, 7, 43688. [Google Scholar] [CrossRef] [PubMed] [Green Version]
  3. Klimov, V.I.; Ivanov, S.A.; Nanda, J.; Achermann, M.; Bezel, I.; McGuire, J.A.; Piryatinski, A. Single-exciton optical gain in semiconductor nanocrystals. Nature 2007, 447, 441–446. [Google Scholar] [CrossRef]
  4. Barbagiovanni, E.G.; Lockwood, D.J.; Simpson, P.J.; Goncharova, L.V. Quantum confinement in Si and Ge nanostructures. J. Appl. Phys. 2012, 111, 034307. [Google Scholar] [CrossRef] [Green Version]
  5. Montalti, M.; Cantelli, A.; Battistelli, G. Nanodiamonds and silicon quantum dots: Ultrastable and biocompatible luminescent nanoprobes for long-term bioimaging. Chem. Soc. Rev. 2015, 44, 4853–4921. [Google Scholar] [CrossRef] [PubMed]
  6. Li, Q.; Luo, T.-Y.; Zhou, M.; Abroshan, H.; Huang, J.; Kim, H.J.; Rosi, N.L.; Shao, Z.; Jin, R. Silicon Nanoparticles with Surface Nitrogen: 90% Quantum Yield with Narrow Luminescence Bandwidth and the Ligand Structure Based Energy Law. ACS Nano 2016, 10, 8385–8393. [Google Scholar] [CrossRef] [PubMed]
  7. Wolf, O.; Dasog, M.; Yang, Z.; Balberg, I.; Veinot, J.G.C.; Millo, O. Doping and Quantum Confinement Effects in Single Si Nanocrystals Observed by Scanning Tunneling Spectroscopy. Nano Lett. 2013, 13, 2516–2521. [Google Scholar] [CrossRef] [PubMed]
  8. Ma, Z.; Wang, W.; Yang, H.; Jiang, X.; Yu, J.; Qin, H.; Xu, L.; Chen, K.; Huang, X.; Li, W.; et al. Performance and retention characteristics of nanocrystalline Si floating gate memory with an Al2O3 tunnel layer fabricated by plasma-enhanced atomic layer deposition. J. Appl. Phys. 2016, 119, 075702. [Google Scholar] [CrossRef]
  9. Kang, Y.M.; Lee, S.J.; Kim, D.Y.; Kim, T.W.; Woo, Y.D.; Wang, K.L. Formation of Si nanocrystals utilizing a Au nanoscale island etching mask. Mater. Res. Bull. 2005, 40, 193–198. [Google Scholar] [CrossRef]
  10. Lee, S.; Shim, Y.S.; Cho, H.Y.; Kang, T.W.; Kim, D.Y.; Lee, Y.H.; Wang, K.L. Fabrication and characterization of silicon-nanocrystal using platinum-nanomask. Thin Solid Films 2004, 451–452, 379–383. [Google Scholar] [CrossRef]
  11. Lee, S.; Shim, Y.S.; Cho, H.Y.; Kim, D.Y.; Kim, T.W.; Wang, K.L. Optical and Electrical Properties of Si Nanocrystals Embedded in SiO2 Layers. Jpn. J. Appl. Phys. 2003, 42, 7180–7183. [Google Scholar] [CrossRef]
  12. Walters, R.J.; Bourianoff, G.I.; Atwater, H.A. Field-effect electroluminescence in silicon nanocrystals. Nat. Mater. 2005, 4, 143–146. [Google Scholar] [CrossRef]
  13. Cheng, C.-H.; Lin, G.-R. Si-QD Synthesis for Visible Light Emission, Color Conversion, and Optical Switching. Materials 2020, 13, 3635. [Google Scholar] [CrossRef]
  14. Hou, Y.; Aydin, E.; De Bastiani, M.; Xiao, C.; Isikgor, F.H.; Xue, D.-J.; Chen, B.; Chen, H.; Bahrami, B.; Chowdhury, A.H.; et al. Efficient tandem solar cells with solution-processed perovskite on textured crystalline silicon. Science 2020, 367, 1135–1140. [Google Scholar] [CrossRef] [PubMed]
  15. Alberucci, A.; Alasgarzade, N.; Chambonneau, M.; Blothe, M.; Kämmer, H.; Matthäus, G.; Jisha, C.P.; Nolte, S. In-Depth Optical Characterization of Femtosecond-Written Waveguides in Silicon. Phys. Rev. Appl. 2020, 14, 24078. [Google Scholar] [CrossRef]
  16. Yang, Y.; Guo, Y.; Huang, Y.; Pu, M.; Wang, Y.; Ma, X.; Li, X.; Luo, X. Crosstalk reduction of integrated optical waveguides with nonuniform subwavelength silicon strips. Sci. Rep. 2020, 10, 4491. [Google Scholar] [CrossRef]
  17. Ryu, J.; Jang, Y.J.; Choi, S.; Kang, H.J.; Park, H.; Lee, J.S.; Park, S. All-in-one synthesis of mesoporous silicon nanosheets from natural clay and their applicability to hydrogen evolution. NPG Asia Mater. 2016, 8, e248. [Google Scholar] [CrossRef]
  18. Sekar, S.; Aqueel Ahmed, A.T.; Kim, D.Y.; Lee, S. One-Pot Synthesized Biomass C-Si Nanocomposites as an Anodic Material for High-Performance Sodium-Ion Battery. Nanomaterials 2020, 10, 1728. [Google Scholar] [CrossRef] [PubMed]
  19. Loaiza, L.C.; Monconduit, L.; Seznec, V. Si and Ge-Based Anode Materials for Li-, Na-, and K-Ion Batteries: A Perspective from Structure to Electrochemical Mechanism. Small 2020, 16, 1905260. [Google Scholar] [CrossRef]
  20. Chae, S.; Choi, S.-H.; Kim, N.; Sung, J.; Cho, J. Integration of Graphite and Silicon Anodes for the Commercialization of High-Energy Lithium-Ion Batteries. Angew. Chem. Int. Ed. 2020, 59, 110–135. [Google Scholar] [CrossRef] [Green Version]
  21. Tsuchimoto, Y.; Yano, T.-A.; Hada, M.; Nakamura, K.G.; Hayashi, T.; Hara, M. Controlling the Visible Electromagnetic Resonances of Si/SiO2 Dielectric Core–Shell Nanoparticles by Thermal Oxidation. Small 2015, 11, 4844–4849. [Google Scholar] [CrossRef]
  22. Kramer, N.J.; Schramke, K.S.; Kortshagen, U.R. Plasmonic Properties of Silicon Nanocrystals Doped with Boron and Phosphorus. Nano Lett. 2015, 15, 5597–5603. [Google Scholar] [CrossRef]
  23. Iannotti, V.; Ausanio, G.; Campana, C.; D’Orazio, F.; Hison, C.; Lucari, F.; Lanotte, L. Magnetic anisotropy in Ni–Si nanoparticle films produced by ultrashort pulsed laser deposition. J. Magn. Magn. Mater. 2008, 320, e594–e598. [Google Scholar] [CrossRef]
  24. Ge, M.; Rong, J.; Fang, X.; Zhang, A.; Lu, Y.; Zhou, C. Scalable preparation of porous silicon nanoparticles and their application for lithium-ion battery anodes. Nano Res. 2013, 6, 174–181. [Google Scholar] [CrossRef]
  25. Joo, J.; Liu, X.; Kotamraju, V.R.; Ruoslahti, E.; Nam, Y.; Sailor, M.J. Gated Luminescence Imaging of Silicon Nanoparticles. ACS Nano 2015, 9, 6233–6241. [Google Scholar] [CrossRef] [Green Version]
  26. Yang, R.; Buonassisi, T.; Gleason, K.K. Organic Vapor Passivation of Silicon at Room Temperature. Adv. Mater. 2013, 25, 2078–2083. [Google Scholar] [CrossRef] [PubMed]
  27. Hori, Y.; Kano, S.; Sugimoto, H.; Imakita, K.; Fujii, M. Size-Dependence of Acceptor and Donor Levels of Boron and Phosphorus Codoped Colloidal Silicon Nanocrystals. Nano Lett. 2016, 16, 2615–2620. [Google Scholar] [CrossRef] [PubMed]
  28. Erogbogbo, F.; Lin, T.; Tucciarone, P.M.; LaJoie, K.M.; Lai, L.; Patki, G.D.; Prasad, P.N.; Swihart, M.T. On-Demand Hydrogen Generation using Nanosilicon: Splitting Water without Light, Heat, or Electricity. Nano Lett. 2013, 13, 451–456. [Google Scholar] [CrossRef] [PubMed]
  29. Praneetha, S.; Murugan, A.V. Development of Sustainable Rapid Microwave Assisted Process for Extracting Nanoporous Si from Earth Abundant Agricultural Residues and Their Carbon-based Nanohybrids for Lithium Energy Storage. ACS Sustain. Chem. Eng. 2015, 3, 224–236. [Google Scholar] [CrossRef]
  30. Wang, L.; Gao, B.; Peng, C.; Peng, X.; Fu, J.; Chu, P.K.; Huo, K. Bamboo leaf derived ultrafine Si nanoparticles and Si/C nanocomposites for high-performance Li-ion battery anodes. Nanoscale 2015, 7, 13840–13847. [Google Scholar] [CrossRef]
  31. Favors, Z.; Wang, W.; Bay, H.H.; Mutlu, Z.; Ahmed, K.; Liu, C.; Ozkan, M.; Ozkan, C.S. Scalable Synthesis of Nano-Silicon from Beach Sand for Long Cycle Life Li-ion Batteries. Sci. Rep. 2014, 4, 5623. [Google Scholar] [CrossRef] [Green Version]
  32. Su, A.; Li, J.; Dong, J.; Yang, D.; Chen, G.; Wei, Y. An Amorphous/Crystalline Incorporated Si/SiOx Anode Material Derived from Biomass Corn Leaves for Lithium-Ion Batteries. Small 2020, 16, 2001714. [Google Scholar] [CrossRef]
  33. Sekar, S.; Aqueel Ahmed, A.T.; Inamdar, A.I.; Lee, Y.; Im, H.; Kim, D.Y.; Lee, S. Activated carbon-decorated spherical silicon nanocrystal composites synchronously-derived from rice husks for anodic source of lithium-ion battery. Nanomaterials 2019, 9, 1055. [Google Scholar] [CrossRef] [PubMed] [Green Version]
  34. Jung, D.S.; Ryou, M.-H.; Sung, Y.J.; Park, S.B.; Choi, J.W. Recycling rice husks for high-capacity lithium battery anodes. Proc. Natl. Acad. Sci. USA 2013, 110, 12229–12234. [Google Scholar] [CrossRef] [PubMed] [Green Version]
  35. Marchal, J.C.; Krug Iii, D.J.; McDonnell, P.; Sun, K.; Laine, R.M. A low cost, low energy route to solar grade silicon from rice hull ash (RHA), a sustainable source. Green Chem. 2015, 17, 3931–3940. [Google Scholar] [CrossRef]
  36. Bose, S.; Ganayee, M.A.; Mondal, B.; Baidya, A.; Chennu, S.; Mohanty, J.S.; Pradeep, T. Synthesis of Silicon Nanoparticles from Rice Husk and their Use as Sustainable Fluorophores for White Light Emission. ACS Sustain. Chem. Eng. 2018, 6, 6203–6210. [Google Scholar] [CrossRef]
  37. Wu, Y.; Zhong, Y.; Chu, B.; Sun, B.; Song, B.; Wu, S.; Su, Y.; He, Y. Plant-derived fluorescent silicon nanoparticles featuring excitation wavelength-dependent fluorescence spectra for anti-counterfeiting applications. Chem. Commun. 2016, 52, 7047–7050. [Google Scholar] [CrossRef]
  38. Sankar, S.; Kaur, N.; Lee, S.; Kim, D.Y. Rapid sonochemical synthesis of spherical silica nanoparticles derived from brown rice husk. Ceram. Int. 2018, 44, 8720–8724. [Google Scholar] [CrossRef]
  39. Sankar, S.; Lee, H.; Jung, H.; Kim, A.; Aqueel Ahmed, A.T.; Inamdar, A.I.; Kim, H.; Lee, S.; Im, H.; Kim, D.Y. Ultrathin graphene nanosheets derived from rice husks for sustainable supercapacitor electrodes. New J. Chem. 2017, 41, 13792–13797. [Google Scholar] [CrossRef]
  40. Jin, X.; Wang, R.; Zhang, L.; Si, R.; Shen, M.; Wang, M.; Tian, J.; Shi, J. Electron Configuration Modulation of Nickel Single Atoms for Elevated Photocatalytic Hydrogen Evolution. Angew. Chem. Int. Ed. 2020, 59, 6827–6831. [Google Scholar] [CrossRef] [PubMed]
  41. Liao, G.; Gong, Y.; Zhang, L.; Gao, H.; Yang, G.-J.; Fang, B. Semiconductor polymeric graphitic carbon nitride photocatalysts: The “holy grail” for the photocatalytic hydrogen evolution reaction under visible light. Energy Environ. Sci. 2019, 12, 2080–2147. [Google Scholar] [CrossRef]
  42. Zhang, J.-W.; Gong, S.; Mahmood, N.; Pan, L.; Zhang, X.; Zou, J.-J. Oxygen-doped nanoporous carbon nitride via water-based homogeneous supramolecular assembly for photocatalytic hydrogen evolution. Appl. Catal. B 2018, 221, 9–16. [Google Scholar] [CrossRef]
  43. Zhao, D.; Dong, C.-L.; Wang, B.; Chen, C.; Huang, Y.-C.; Diao, Z.; Li, S.; Guo, L.; Shen, S. Synergy of Dopants and Defects in Graphitic Carbon Nitride with Exceptionally Modulated Band Structures for Efficient Photocatalytic Oxygen Evolution. Adv. Mater. 2019, 31, 1903545. [Google Scholar] [CrossRef]
  44. Yang, X.; Tian, L.; Zhao, X.; Tang, H.; Liu, Q.; Li, G. Interfacial optimization of g-C3N4-based Z-scheme heterojunction toward synergistic enhancement of solar-driven photocatalytic oxygen evolution. Appl. Catal. B 2019, 244, 240–249. [Google Scholar] [CrossRef]
  45. Wang, D.; Sheng, T.; Chen, J.; Wang, H.-F.; Hu, P. Identifying the key obstacle in photocatalytic oxygen evolution on rutile TiO2. Nat. Catal. 2018, 1, 291–299. [Google Scholar] [CrossRef]
  46. Sankar, S.; Sharma, S.K.; Kaur, N.; Lee, B.; Kim, D.Y.; Lee, S.; Jung, H. Biogenerated silica nanoparticles synthesized from sticky, red, and brown rice husk ashes by a chemical method. Ceram. Int. 2016, 42, 4875–4885. [Google Scholar] [CrossRef]
  47. Bulyarskii, S.V.; Svetukhin, V.V.; Prikhod’ko, O.V. Spatially inhomogeneous oxygen precipitation in silicon. Semiconductors 1999, 33, 1157–1162. [Google Scholar] [CrossRef]
  48. Bulyarskiy, S.V.; Svetukhin, V.V. A Kinetic Model of Silicon Nanocrystal Formation. Silicon 2020. [Google Scholar] [CrossRef]
  49. Fokker, A.D. Die mittlere Energie rotierender elektrischer Dipole im Strahlungsfeld. Ann. Phys. 1914, 348, 810–820. [Google Scholar] [CrossRef]
  50. Planck, M. Über einen Satz der statistischen Dynamik und seine Erweiterung in der Quantentheorie. Sitz. Preuss. Akad. Wiss. Berl. 1917, 24, 324–341. [Google Scholar]
  51. Rosenbluth, M.N.; MacDonald, W.M.; Judd, D.L. Fokker-Planck Equation for an Inverse-Square Force. Phys. Rev. 1957, 107, 1–6. [Google Scholar] [CrossRef] [Green Version]
  52. Choi, J.-H.; Kim, H.-K.; Jin, E.-M.; Seo, M.W.; Cho, J.S.; Kumar, R.V.; Jeong, S.M. Facile and scalable synthesis of silicon nanowires from waste rice husk silica by the molten salt process. J. Hazard. Mater. 2020, 399, 122949. [Google Scholar] [CrossRef]
  53. Zhang, Y.-C.; You, Y.; Xin, S.; Yin, Y.-X.; Zhang, J.; Wang, P.; Zheng, X.-s.; Cao, F.-F.; Guo, Y.-G. Rice husk-derived hierarchical silicon/nitrogen-doped carbon/carbon nanotube spheres as low-cost and high-capacity anodes for lithium-ion batteries. Nano Energy 2016, 25, 120–127. [Google Scholar] [CrossRef]
  54. Sankar, S.; Sharma, S.K.; An, N.; Lee, H.; Kim, D.Y.; Im, Y.B.; Cho, Y.D.; Ganesh, R.S.; Ponnusamy, S.; Raji, P.; et al. Photocatalytic properties of Mn-doped NiO spherical nanoparticles synthesized from sol-gel method. Optik 2016, 127, 10727–10734. [Google Scholar] [CrossRef]
  55. Kaur, N.; Lee, Y.; Kim, D.Y.; Lee, S. Optical bandgap tuning in nanocrystalline ZnO:Y films via forming defect-induced localized bands. Mater. Des. 2018, 148, 30–38. [Google Scholar] [CrossRef]
  56. Lee, S.; Kang, T.W.; Kim, D.Y. Correlation of Magnetic Properties with Microstructural Properties for Columnar-Structured (Zn1−xMnx)O/Al2O3 (0001) Thin Films. J. Cryst. Growth 2005, 284, 6–14. [Google Scholar] [CrossRef]
  57. Mishra, P.; Jain, K.P. First- and second-order Raman scattering in nanocrystalline silicon. Phys. Rev. B 2001, 64, 073304. [Google Scholar] [CrossRef]
  58. Krause, A.; Tkacheva, O.; Omar, A.; Langklotz, U.; Giebeler, L.; Dörfler, S.; Fauth, F.; Mikolajick, T.; Weber, W.M. In Situ Raman Spectroscopy on Silicon Nanowire Anodes Integrated in Lithium Ion Batteries. J. Electrochem. Soc. 2019, 166, A5378–A5385. [Google Scholar] [CrossRef]
  59. Tan, D.; Ma, Z.; Xu, B.; Dai, Y.; Ma, G.; He, M.; Jin, Z.; Qiu, J. Surface passivated silicon nanocrystals with stable luminescence synthesized by femtosecond laser ablation in solution. Phys. Chem. Chem. Phys. 2011, 13, 20255–20261. [Google Scholar] [CrossRef]
  60. Zhong, Y.; Sun, X.; Wang, S.; Peng, F.; Bao, F.; Su, Y.; Li, Y.; Lee, S.-T.; He, Y. Facile, Large-Quantity Synthesis of Stable, Tunable-Color Silicon Nanoparticles and Their Application for Long-Term Cellular Imaging. ACS Nano 2015, 9, 5958–5967. [Google Scholar] [CrossRef] [PubMed]
  61. Llansola Portolés, M.J.; Rodriguez Nieto, F.; Soria, D.B.; Amalvy, J.I.; Peruzzo, P.J.; Mártire, D.O.; Kotler, M.; Holub, O.; Gonzalez, M.C. Photophysical Properties of Blue-Emitting Silicon Nanoparticles. J. Phys. Chem. C 2009, 113, 13694–13702. [Google Scholar] [CrossRef] [Green Version]
  62. Shirahata, N.; Linford, M.R.; Furumi, S.; Pei, L.; Sakka, Y.; Gates, R.J.; Asplund, M.C. Laser-derived one-pot synthesis of silicon nanocrystals terminated with organic monolayers. Chem. Commun. 2009, 4684–4686. [Google Scholar] [CrossRef] [PubMed] [Green Version]
  63. Buriak, J.M.; Stewart, M.P.; Geders, T.W.; Allen, M.J.; Choi, H.C.; Smith, J.; Raftery, D.; Canham, L.T. Lewis Acid Mediated Hydrosilylation on Porous Silicon Surfaces. J. Am. Chem. Soc. 1999, 121, 11491–11502. [Google Scholar] [CrossRef]
  64. Bateman, J.E.; Horrocks, B.R.; Houlton, A. Reactions of water and methanol at hydrogen-terminated silicon surfaces studied by transmission FTIR. J. Chem. Soc. Faraday Trans. 1997, 93, 2427–2431. [Google Scholar] [CrossRef]
  65. Liu, Y.; Ji, G.; Wang, J.; Liang, X.; Zuo, Z.; Shi, Y. Fabrication and photocatalytic properties of silicon nanowires by metal-assisted chemical etching: Effect of H2O2 concentration. Nanoscale Res. Lett. 2012, 7, 663. [Google Scholar] [CrossRef] [PubMed] [Green Version]
  66. Shen, X.-B.; Song, B.; Fang, B.; Jiang, A.-R.; Ji, S.-J.; He, Y. Excitation-wavelength-dependent photoluminescence of silicon nanoparticles enabled by adjustment of surface ligands. Chem. Commun. 2018, 54, 4947–4950. [Google Scholar] [CrossRef] [PubMed]
  67. He, Y.; Su, Y.; Yang, X.; Kang, Z.; Xu, T.; Zhang, R.; Fan, C.; Lee, S.-T. Photo and pH Stable, Highly-Luminescent Silicon Nanospheres and Their Bioconjugates for Immunofluorescent Cell Imaging. J. Am. Chem. Soc. 2009, 131, 4434–4438. [Google Scholar] [CrossRef]
  68. Pi, X.D.; Liptak, R.W.; Deneen Nowak, J.; Wells, N.P.; Carter, C.B.; Campbell, S.A.; Kortshagen, U. Air-stable full-visible-spectrum emission from silicon nanocrystals synthesized by an all-gas-phase plasma approach. Nanotechnology 2008, 19, 245603. [Google Scholar] [CrossRef]
  69. Hua, F.; Erogbogbo, F.; Swihart, M.T.; Ruckenstein, E. Organically Capped Silicon Nanoparticles with Blue Photoluminescence Prepared by Hydrosilylation Followed by Oxidation. Langmuir 2006, 22, 4363–4370. [Google Scholar] [CrossRef] [PubMed]
  70. Ma, Q.; Zhao, Z.; Zhao, Y.; Xie, H.; Xing, P.; Wang, D.; Yin, H. A self-driven alloying/dealloying approach to nanostructuring micro-silicon for high-performance lithium-ion battery anodes. Energy Storage Mater. 2021, 34, 768–777. [Google Scholar] [CrossRef]
  71. Azadeh, M.; Zamani, C.; Ataie, A.; Morante, J.R. Three-dimensional rice husk-originated mesoporous silicon and its electrical properties. Mater. Today Commun. 2018, 14, 141–150. [Google Scholar] [CrossRef]
  72. Kang, W.; Kim, J.-C.; Kim, D.-W. Waste glass microfiber filter-derived fabrication of fibrous yolk-shell structured silicon/carbon composite freestanding electrodes for lithium-ion battery anodes. J. Power Sources 2020, 468, 228407. [Google Scholar] [CrossRef]
  73. Sakamoto, M.; Terada, S.; Mizutani, T.; Saitow, K.-I. Large Field Enhancement of Nanocoral Structures on Porous Si Synthesized from Rice Husks. ACS Appl. Mater. Interfaces 2020, 13, 1105–1113. [Google Scholar] [CrossRef] [PubMed]
Figure 1. Schematic illustration of the magnesiothermic reduction process for synthesizing the Si nanocrystals by using biomass sticky rice husks (S-RHs), red rice husks (R-RHs), and brown rice husks (B-RHs).
Nanomaterials 11 00613 g001
Figure 2. Field-emission scanning electron microscopy (FE-SEM) images of the (a) S-Si, (b) R-Si, and (c) B-Si nanocrystals and energy dispersive X-ray (EDX) spectra of the (d) S-Si, (e) R-Si, and (f) B-Si nanocrystals. The inset in each EDX graph summarizes the compositional properties of the Si nanoparticles.
Nanomaterials 11 00613 g002
Figure 3. (a) X-ray diffractometry (XRD) patterns, (b) Raman spectra, and (c) Fourier transform infrared (FTIR) spectra of the S-Si, R-Si, and B-Si nanocrystals.
Nanomaterials 11 00613 g003
Figure 4. (a) UV-VIS absorption spectra, (b) photoluminescence (PL) spectra, and (c) light emission mechanism of the rice husk (RH)-derived biomass Si nanocrystals.
Nanomaterials 11 00613 g004
Figure 5. Excitation-dependent PL spectra of the (a) S-Si, (b) R-Si, and (c) B-Si nanocrystals.
Nanomaterials 11 00613 g005
Figure 6. Nitrogen absorption–desorption isotherm (N2-ADI) characteristics of the (a) S-Si, (b) R-Si, and (c) B-Si nanocrystals.
Nanomaterials 11 00613 g006
Figure 7. Pore size characteristics of the (a) S-Si, (b) R-Si, and (c) B-Si nanocrystals.
Nanomaterials 11 00613 g007
Table 1. Comparison of the luminescence characteristics for various biomass-derived Si nanostructures.
BiomassNanostructuresLight Emission ColorReferences
Brown Rice HusksSpherical Si NanocrystalsBlue, Green, YellowThis Work
Red Rice HusksSpherical Si NanocrystalsBlue, Green, YellowThis Work
Sticky Rice HusksSpherical Si NanocrystalsBlue, Green, YellowThis Work
Rice HusksSi NanoparticlesGreen[36]
Wheat StrawsSi NanoparticlesBlue[37]
Sugarcane BagasseSi NanoparticlesBlue[37]
Rice HusksSi NanoparticlesBlue[37]
Table 2. Comparison of the pore characteristics for various biomass-derived Si nanostructures.
BiomassSss (m2/g)Vtp (cm3/g)References
Brown Rice Husks265.60.5389This Work
Red Rice Husks212.40.4201This Work
Sticky Rice Husks168.10.4103This Work
Bamboo Leaves302.130.526[30]
Beach Sand323-[31]
Corn Leaves64-[32]
Rice Husks288.40.35[53]
Rice Husks47.30.18[34]
Rice Husks127.050.2306[71]
Waste Glass Microfiber Filter66.120.64[72]
Rice Husks57.9-[73]
Publisher’s Note: MDPI stays neutral with regard to jurisdictional claims in published maps and institutional affiliations.

