Article

Comparative Study of Carbon Nanosphere and Carbon Nanopowder on Viscosity and Thermal Conductivity of Nanofluids

1
Department of Inorganic and Analytical Chemistry, Budapest University of Technology and Economics, Muegyetem Rakpart 3., 1111 Budapest, Hungary
2
Centre for Energy Research, Institute for Technical Physics and Materials Science, Hungarian Academy of Sciences, Konkoly Thege M. út 29-33, 1121 Budapest, Hungary
3
Department of Mechanical Engineering, Faculty of Engineering, King Mongkut’s University of Technology Thonburi, Bangmod, Bangkok 10140, Thailand
4
National Science and Technology Development Agency (NSTDA), Pathum Thani 12120, Thailand
5
Centre for Energy Research, Konkoly-Thege Miklós út 29-33, 1121 Budapest, Hungary
6
Department of Applied and Environmental Chemistry, University of Szeged, Rerrich Béla tér 1, 6720 Szeged, Hungary
7
Institute of Physical Metallurgy, Metal Forming and Nanotechnology, University of Miskolc, 3515 Miskolc-Egyetemváros, Hungary
*
Author to whom correspondence should be addressed.
Nanomaterials 2021, 11(3), 608; https://doi.org/10.3390/nano11030608
Submission received: 6 January 2021 / Revised: 11 February 2021 / Accepted: 23 February 2021 / Published: 28 February 2021
(This article belongs to the Special Issue Nanofluids for Thermal Solar Energy)

Abstract

:
A comparative research on stability, viscosity (µ), and thermal conductivity (k) of carbon nanosphere (CNS) and carbon nanopowder (CNP) nanofluids was performed. CNS was synthesized by the hydrothermal method, while CNP was provided by the manufacturer. Stable nanofluids at high concentrations 0.5, 1.0, and 1.5 vol% were prepared successfully. The properties of CNS and CNP nanoparticles were analyzed with Fourier-transform infrared spectroscopy (FT-IR), scanning electron microscope (SEM), X-ray photoelectron spectroscopy (XPS), specific surface area (SBET), X-ray powder diffraction (XRD), thermogravimetry/differential thermal analysis (TG/DTA), and energy dispersive X-ray analysis (EDX). The CNP nanofluids have the highest k enhancement of 10.61% for 1.5 vol% concentration compared to the base fluid, while the CNS does not make the thermal conductivity of nanofluids (knf) significantly higher. The studied nanofluids were Newtonian. The relative µ of CNS and CNP nanofluids was 1.04 and 1.07 at 0.5 vol% concentration and 30 °C. These results can be explained by the different sizes and crystallinity of the used nanoparticles.

1. Introduction

Improvement of energy efficiency in many areas and applications is an indispensable part of the global sustainability plan [1]. For example, high-efficiency cooling, a technique that depends on heat exchangers, is an essential requirement in many applications such as air conditioning, automobile radiators, power plants, etc. [2]. Common fluids such as water, glycols, and oil are used as cooling liquids in the applications mentioned above [3]. However, they have some limited heat characteristics [4].
In 1993, Masuda et al. utilized the aluminum oxide nanoparticles (13 nm) in water base fluid. The obtained nanofluids had k enhancement of 30% [5]. In 1995, Choi et al. called the fluid containing nanoparticles as nanofluids first [6]. In 1999, a linear model of k and concentration was developed by Lee et al. with nanofluid containing copper oxide (CuO) and alumina (Al2O3) into a mixture of ethylene glycol and water [7]. Then, the experiments of Wang et al. showed knf was higher than the base fluids [8]. In 2001, multiwall carbon nanotubes (MWCNT) were added into the water for enhancing k up to 160% with 1% volume concentration [9]. The nanofluids have been potential materials with improved electrical, optical, and thermal characteristics [10]. During the last decades, there were numerous attempts to enhance k, convective thermal transfer coefficient, and thermal transfer rate by adding nanoparticles into the base fluid [11,12,13]. The property enhancement is dependent on the type, size, shape, and concentration of nanoparticles. Moreover, the nature and characteristic of base fluids such as pH, µ, and the presence of surfactants affect the increment of k [14,15]. However, the disadvantage of nanofluids is the stability issue because the nanoparticles tend to aggregate into larger particles and clusters. This limits the usability of nanofluids in heat transfer applications [16,17,18].
Several kinds of nanoparticles have been utilized in the preparation of nanofluids for enhancement of k, including metal (metal: Au, Ni, Cu, Ag; metal oxide: TiO2, ZnO, MgO, Fe2O3; metal carbides: TiC), carbon (diamond, carbon nanotube, graphene, graphene oxide, graphite, carbon dots [19]), and metalloid (SiO2, SiC) [20,21,22]. Some composite materials have been developed with enhanced k, such as Al/diamond, Al/SiC [23,24]. However, these materials have a high cost. Recently, liquids containing two or more nanoparticles, also called hybrid nanofluids, are under extensive research [25,26,27]. Due to the superior properties of the carbon-based nanoparticles, they are potential materials that can be utilized for many applications [3].
Generally, nanofluids can be produced with one of two methods: a single-step and two-step approach. For the first one, nanofluids are obtained by direct synthesis of the nanoparticles into the base fluid. In 2011, carbon/water nanofluid was prepared by Teng et al. by utilizing the plasma arc technique and showed that compared to water, k is enhanced by 25% at 50 °C [28]. Then, in 2013 a revised water-assisted synthesis system was utilized to produce carbon/water nanofluids [29]. In the two-step method, nanoparticles are produced first and then dispersed into the based fluid. The two-step method has been used mostly due to its simplicity and low cost [3].
The most important issue of nanofluids is stability, which affects their thermal properties and commercialization. While the thermal properties depend on a complex motion with a combination of agglomeration, Brownian movement, and thermophoresis effect, the stability is dependent on the interactions between the base fluid and the nanoparticles. These motions and interactions are affected by temperature [30], the properties of nanoparticles and base fluid [31], the pH of the medium [32], and the used surfactants [33]. In order to improve the stability of the nanofluids for the short term, the mechanical technique can be used, such as an ultrasound bath. In this method, the van der Waals attractive force is broken down between nanoparticles. This supports to disperse the nanoparticles better into the base fluids [34]. The surface modification and the particle size can enhance the repulsive force between the nanoparticles [35].
For the same materials, the values measured by different investigators were non-identical, mainly due to the preparation procedure and the morphology of agglomeration. One benchmark study was performed by Buongiorno et al. to compare k from different research groups. The samples were measured at various laboratories between 20 and 30 °C with some available methods, and the experimental error was obtained [36]. Moreover, the available theory does not explain the experimental results. The aggregation mechanism presents phonon transport from each massive particle to another one. This is affected by the size and shape of nanoparticles and the formed clusters [37,38].
The effect of concentration, temperature, and surfactants was studied on k increment by Estellé et al. [39]. Talaei et al. investigated the MWCNT and presented that the functional group concentration supports to increase the stability and knf [40]. The effects of the base fluid on k were reported by Nanda et al. [41] and Aravind et al. [42]. Chen et al. [43] and Nasiri et al. [44] studied k with the different structures of carbon nanotubes. Recently, Brzóska et al. [45] reported the thermal physical characteristics of long MWCNT.
A lot of attention has been paid to carbon spheres due to their utilizations, such as lubricants, catalyst supports, etc. [46]. Generally, carbon spheres can be prepared with three methods. First, carbon spheres may be produced directly as pyrolysis [47,48], chemical vapor deposition [49], and hydrothermal treatment [50]. The second method uses rigid templates as 3D macroporous silica [51], zeolite Beta beads [52]. Finally, carbon spheres can be obtained from the synthesized polymer spheres with thermal treatment [53,54]. Carbon nanospheres may be utilized in a lot of applications as photoluminescence [55], multiphoton bioimaging [56], anode materials in batteries [46], nanofluids [46,57], etc.
Among others, no study has been performed on the comparison of knf and µnf containing carbon nanomaterials with different sizes. In this paper, the carbon nanomaterial nanofluids based on water/ethanol are studied. The CNS is synthesized from cheap sugar, while CNP is supplied by the manufacturer. The particles were first analyzed with SBET, XPS, SEM-EDX, XRD, FTIR, and TGA. The nanofluids were prepared at three concentrations (0.5, 1.0, and 1.5 vol%), and their knf and µnf were measured at five temperatures (20, 30, 40, 50, and 60 °C).

2. Materials and Methods

2.1. Materials

Carbon nanospheres were prepared using the hydrothermal method [58]. Sucrose was put in an autoclave; then, the pH was set to 12 with NaOH solution. Under autogenous pressure at 180 °C, the mixture was treated for 12 h. The reaction’s product was washed three times with distilled water then suspended in a 45% ethanol-water solution. The suspension was centrifuged at 4000 rpm for 20 min. The settled material was filtered and dried at 70 °C after washing with warm distilled water overnight. The product was a brown powder [59].
Carbon nanopowders, base fluids (ethylene glycol and ethyl alcohol), surfactants (Gum Arabic (GA), Triton X-100, and Tween 80 (T80) were purchased from Sigma Aldrich (Saint Louis, MO, USA).

2.2. Preparation of Nanofluid

The stability of nanofluids was investigated by using different kinds of solvents and surfactants. Various ratios of the solvent mixture were considered as well, and in the following, we report about only those configurations that were observed as stable nanofluids.
The nanofluids were obtained by adding CNS and CNP into the base fluid of deionized water (DI)/ethanol and DI/ethylene glycol, respectively. The ratio of DI and ethanol was 5:1. In the case of DI and ethylene glycol, the ratio was 1:1, and T80 was used as a surfactant with a concentration of 3.3 vol%. For CNP, the different base fluids were investigated; however, the nanofluids without surfactant were not stable. The volume fraction of nanoparticle content was 0.5, 1.0, and 1.5%. The CNS and CNP nanofluids were sonicated using an ultrasonication instrument for 1 h at 130 W and 45 kHz. The prepared nanofluids were stable for several days.

2.3. Characterization Techniques

The morphology analysis of nanoparticles was completed by LEO 1440 XB SEM (LEOGmbH, Oberkochen, Germany) at 5 kV with a secondary electron detector in a high vacuum mode.
The chemical components of CNS and CNP were examined by utilizing EDX analysis with a JEOL JSM-5500LV electron microscope (Tokyo, Japan) and XPS with X-ray photoelectron spectrometer (Berlin, Germany) having 150 W (14 kV) X-ray source. The investigation on the crystallinity of the CNS and CNP was performed by using Panalytical X’PERT PRO MPD XRD with Cu Kα irradiation, resolution of 3 degrees/min, and the 2θ range of 5° to 65°. The FTIR spectroscopy of CNS and CNP was performed by Excalibur FTS 3000 BioRad FTIR (Bio-Rad, Digilab, UK) in the wavenumber range of 400–4000 cm−1 and transmittance mode. The sensitivity was 4 cm−1, and the number of scans was 64.
According to the multipoint Brunauer–Emmett–Teller technique, the SBET of CNS and CNP was determined by utilizing nitrogen adsorption isotherms at −196 °C.
The effect of temperature on the nanoparticles was studied by utilizing an STD 2960 TG/DTA (TA Instruments Inc., New Castle, DE, USA) instrument with a heating rate of 10 °C/min. The temperature range was from room temperature to 800 °C. The experiments were performed in air.
The stability of CNS and CNP nanofluids was tested by using an Avantes AvaSpec-2048 Fiber Optic spectrometer (Avantes BV, Apeldoorn, Netherlands). After a period, 20 µL of each sample was diluted with 2 mL of DI, and their maximum absorbance was recorded.
The rheology of CNS and CNP nanofluids was investigated with three replicas using an Anton Paar Physica MCR 301 (Anton Paar, Ashland, VA, USA) rotation viscometer at 15 different shear rates and five temperatures. The amplitude was 5%. The range of angular frequency was 100 to 2000 s−1.
Based on the modified transient plane source approach, an SKZ1061C TPS Thermal Conductivity Tester (SKZ Industrial, Shandong, China) was used for measuring k of CNS and CNP nanofluids. All nanofluids were measured three times at five temperatures (20, 30, 40, 50, and 60 °C). The mean value and standard error were calculated for use in the figures. In order to increase the temperature of the nanofluids at the defined setpoint, a temperature-controlled oven was used.

3. Results and Discussion

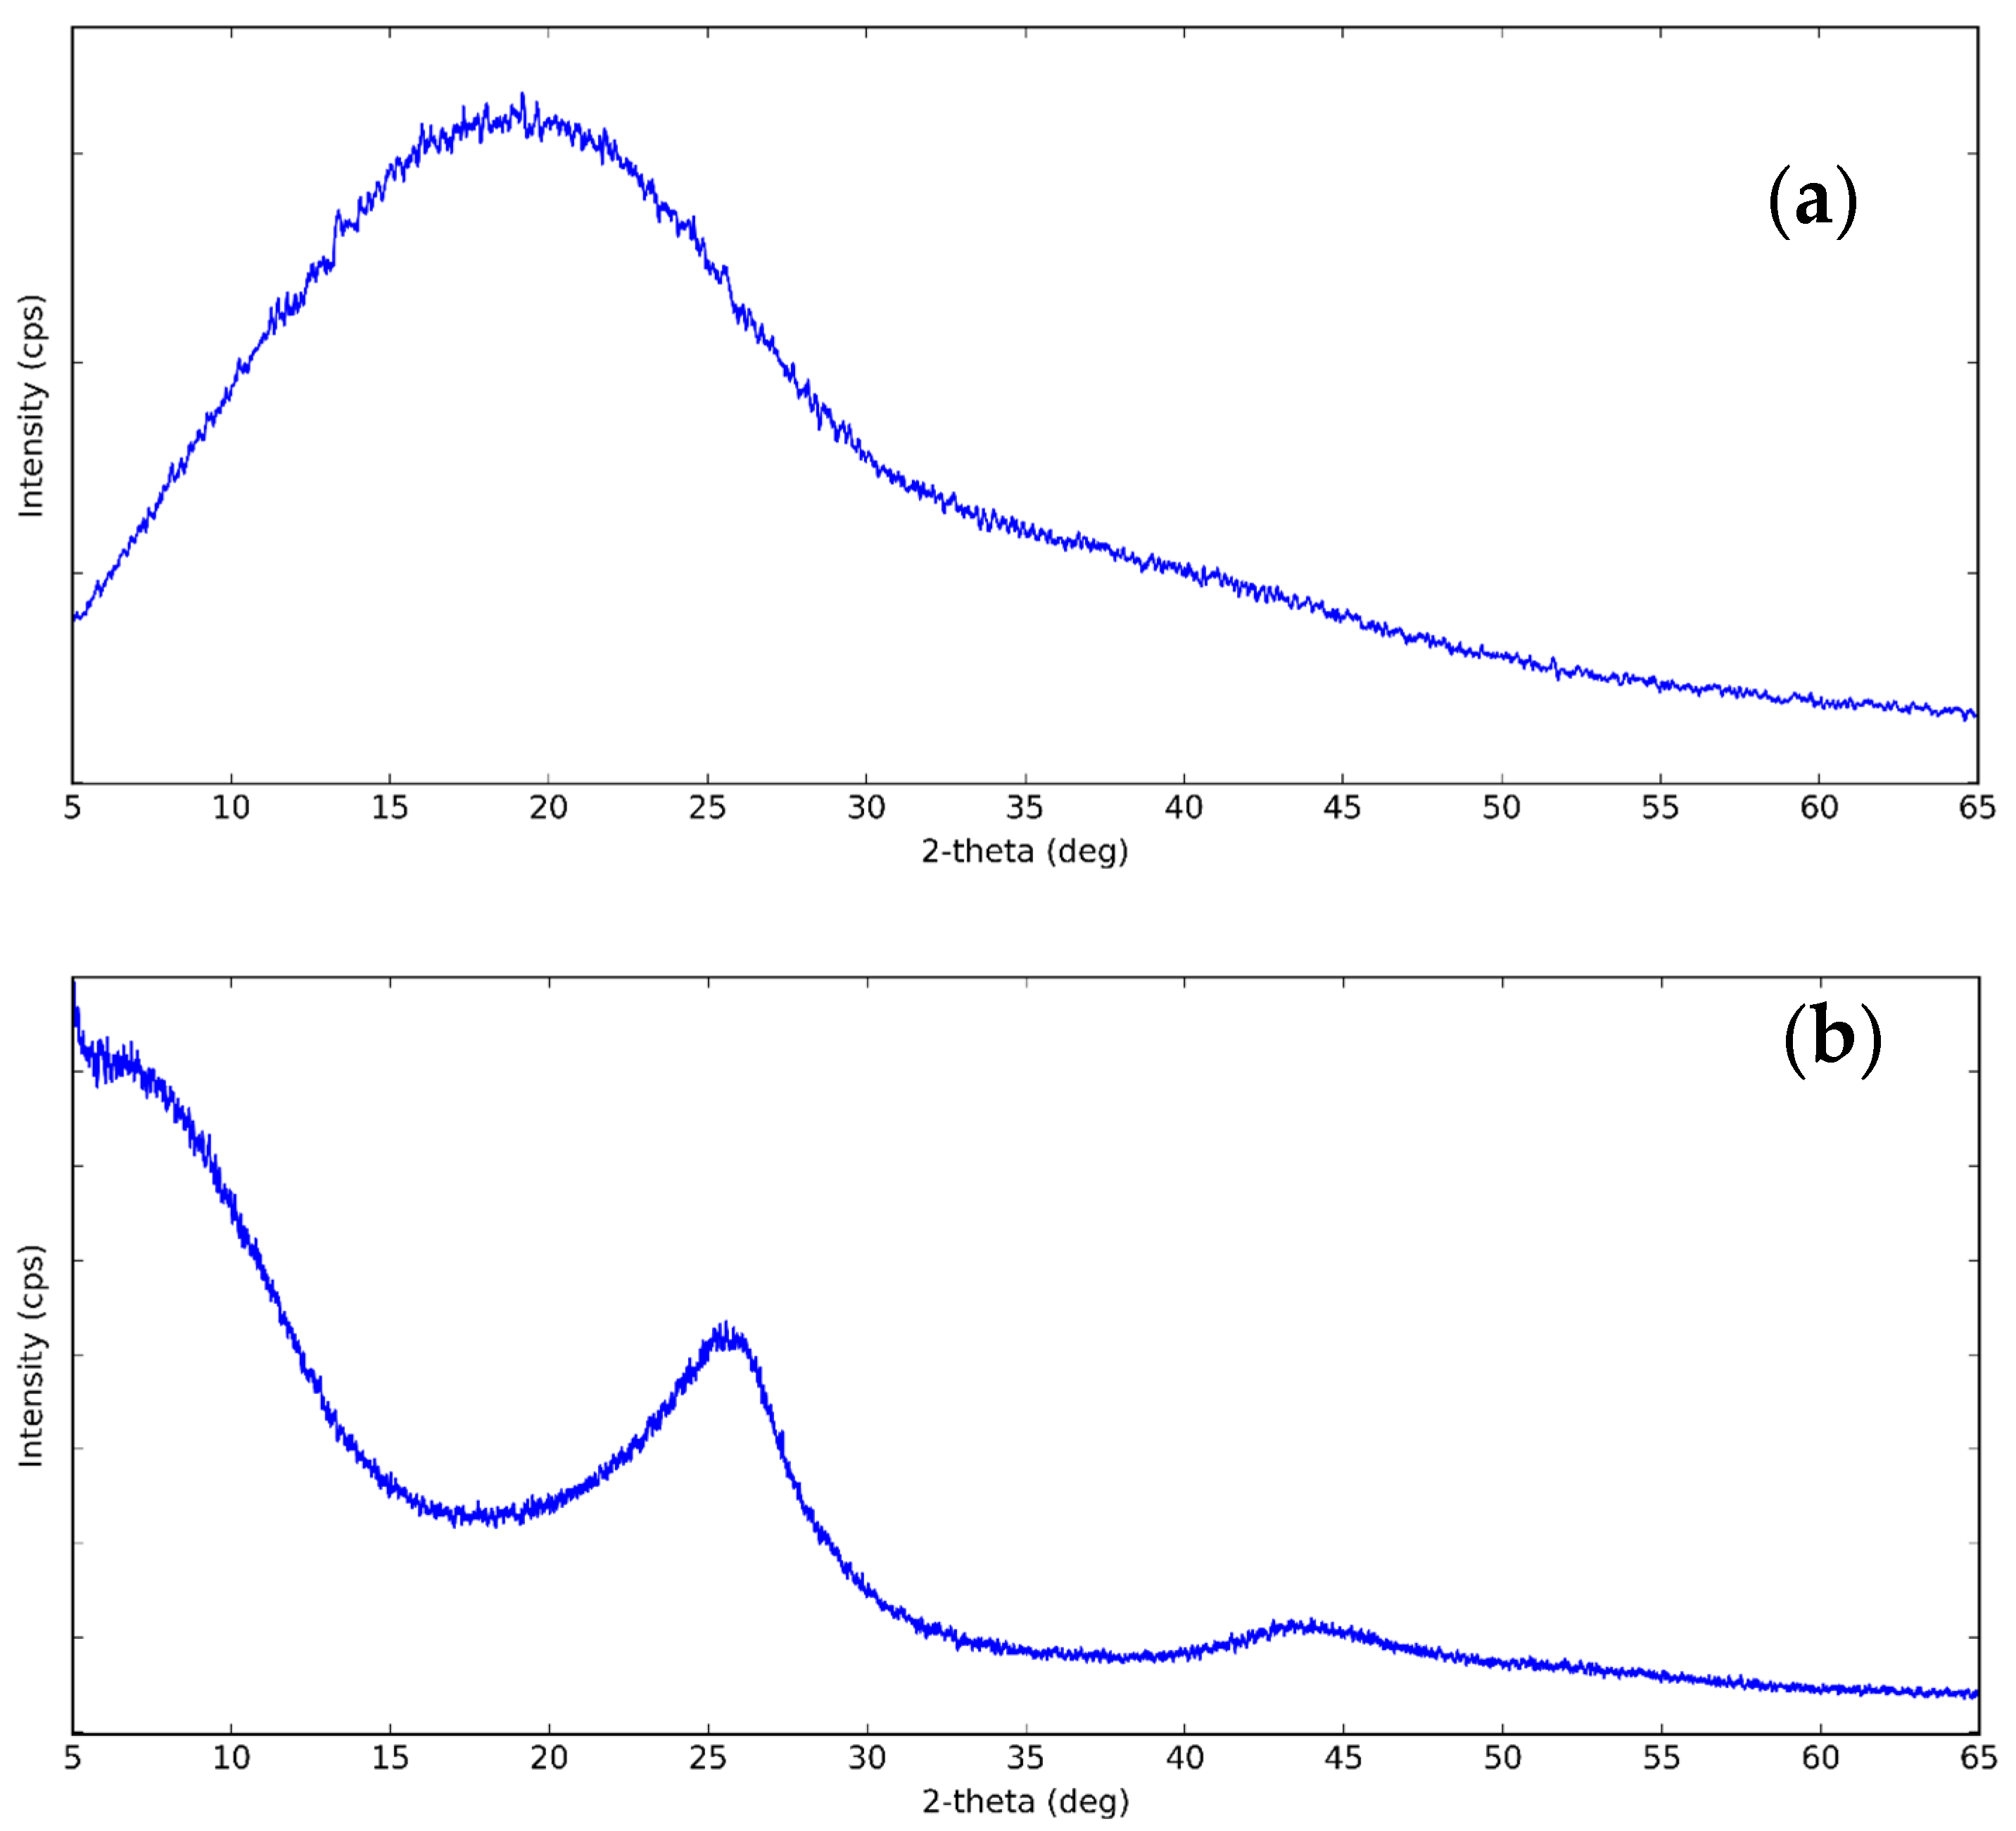
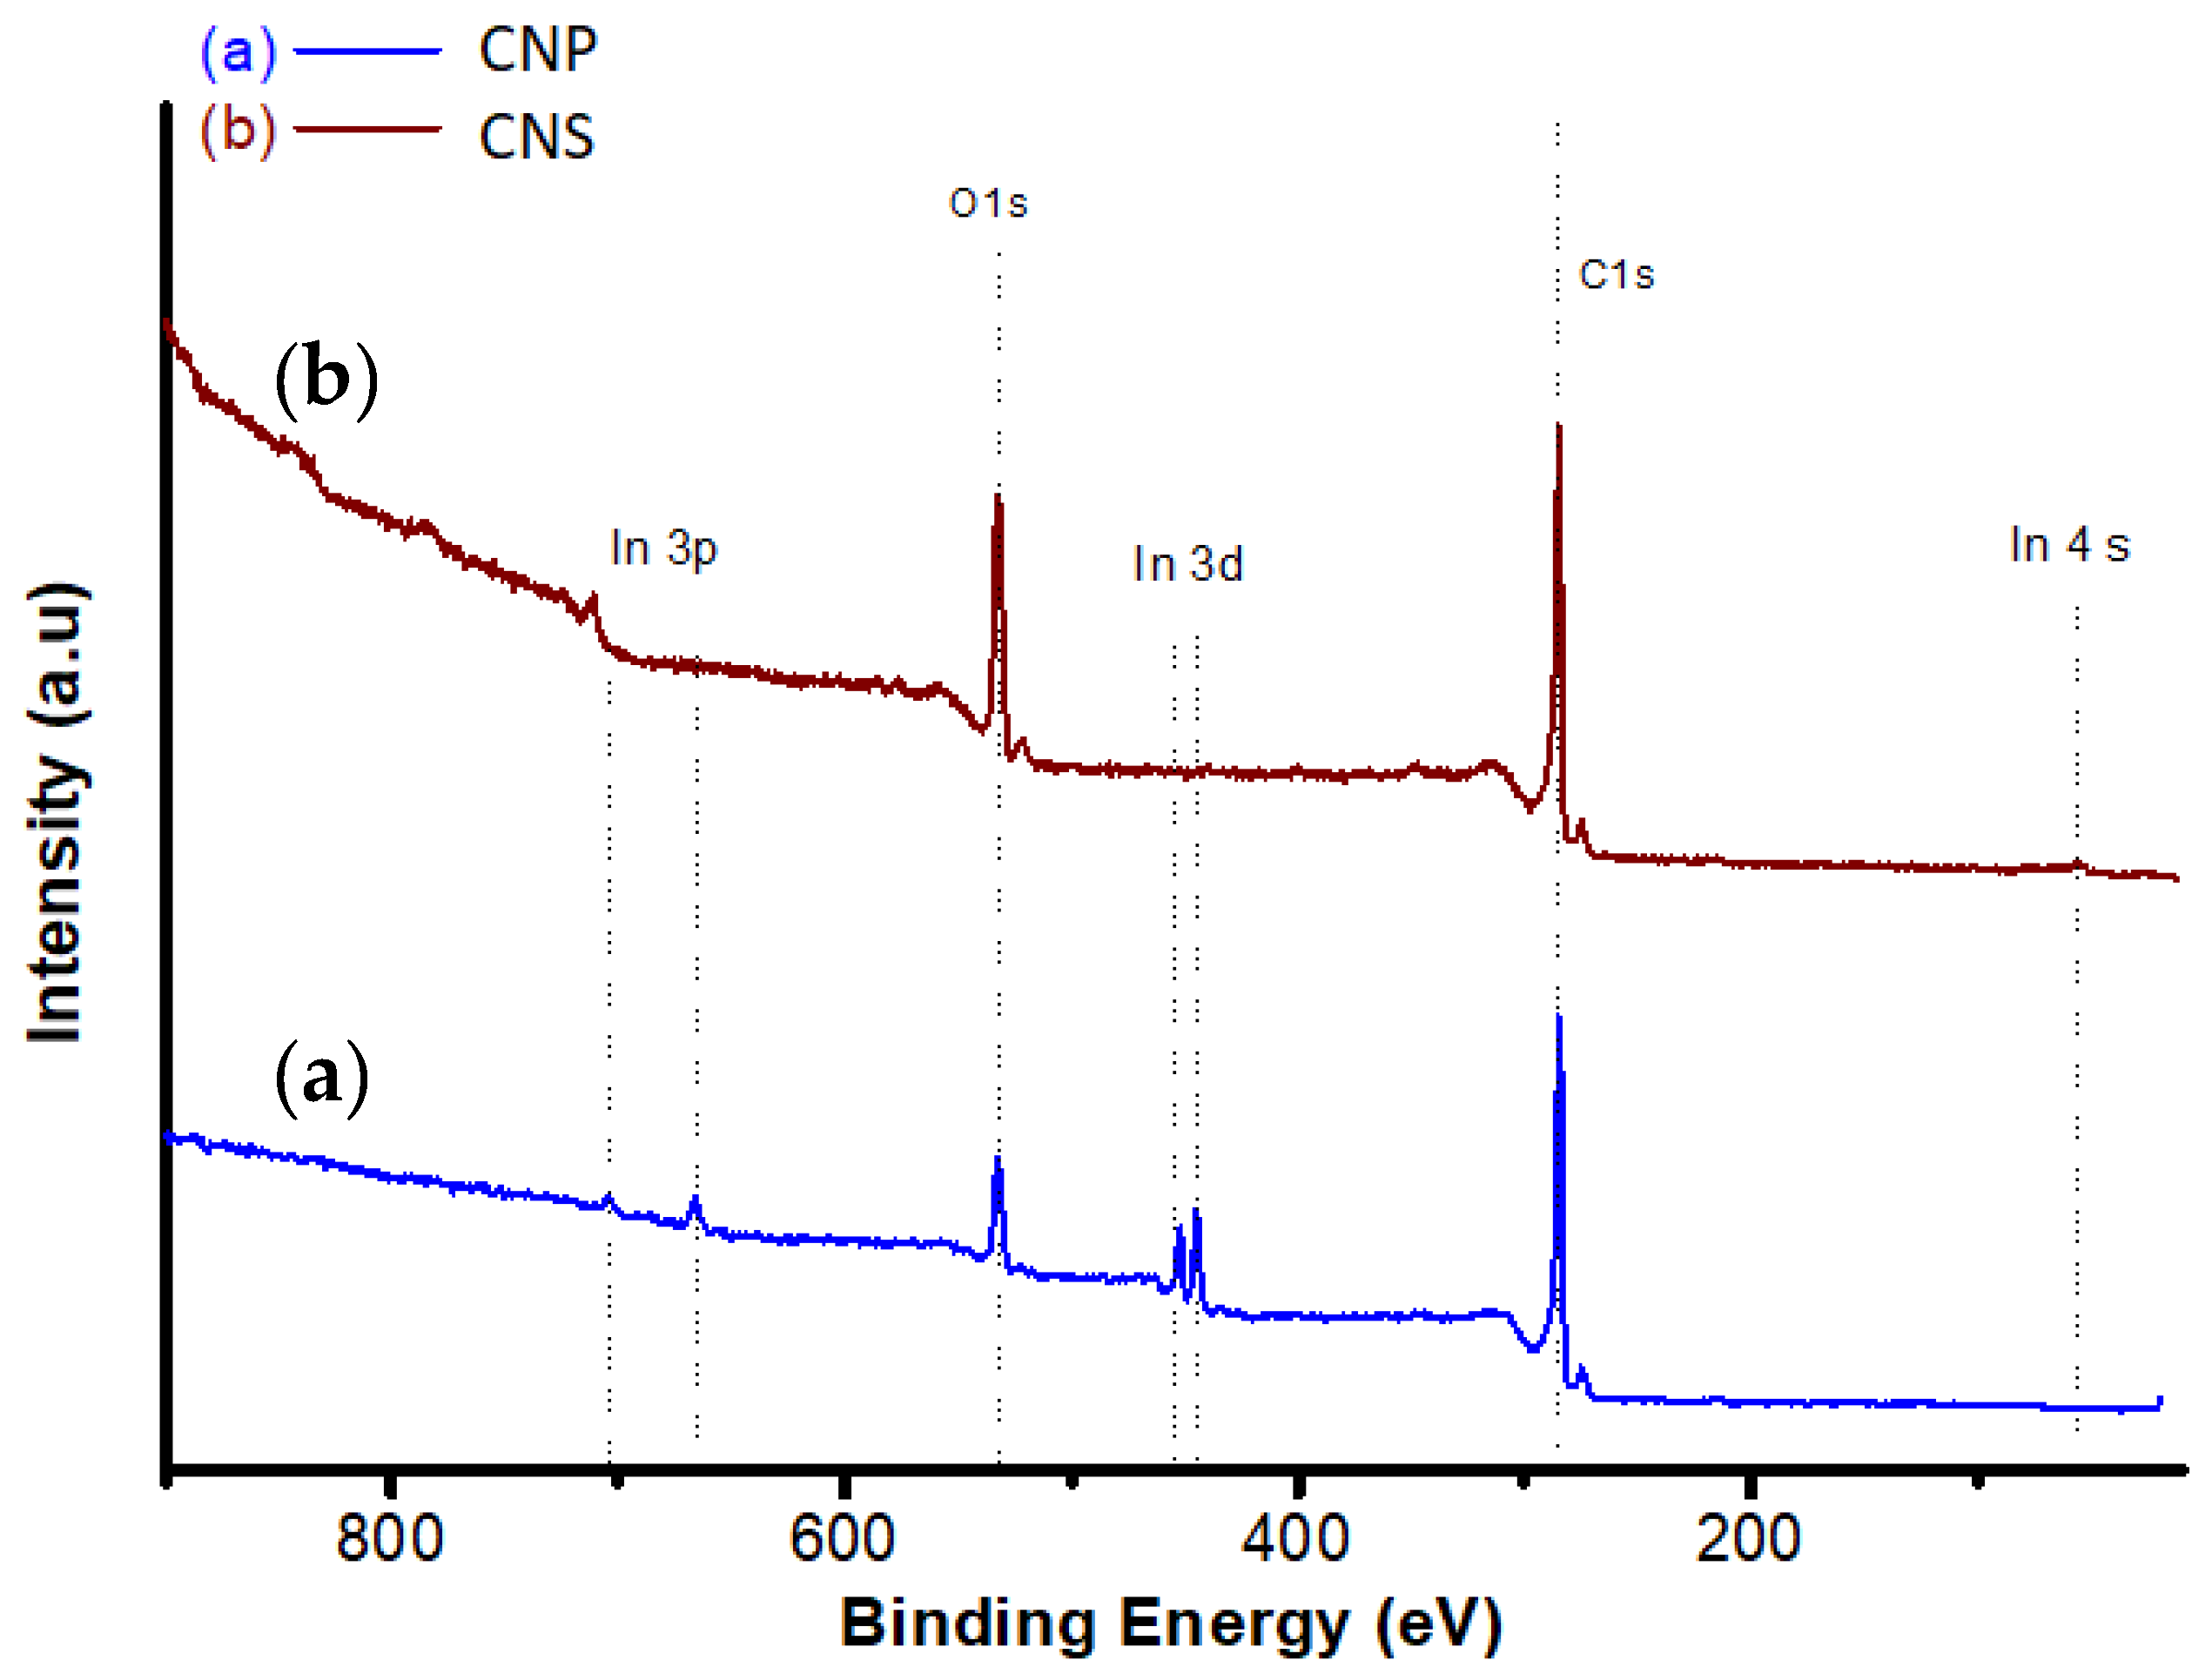
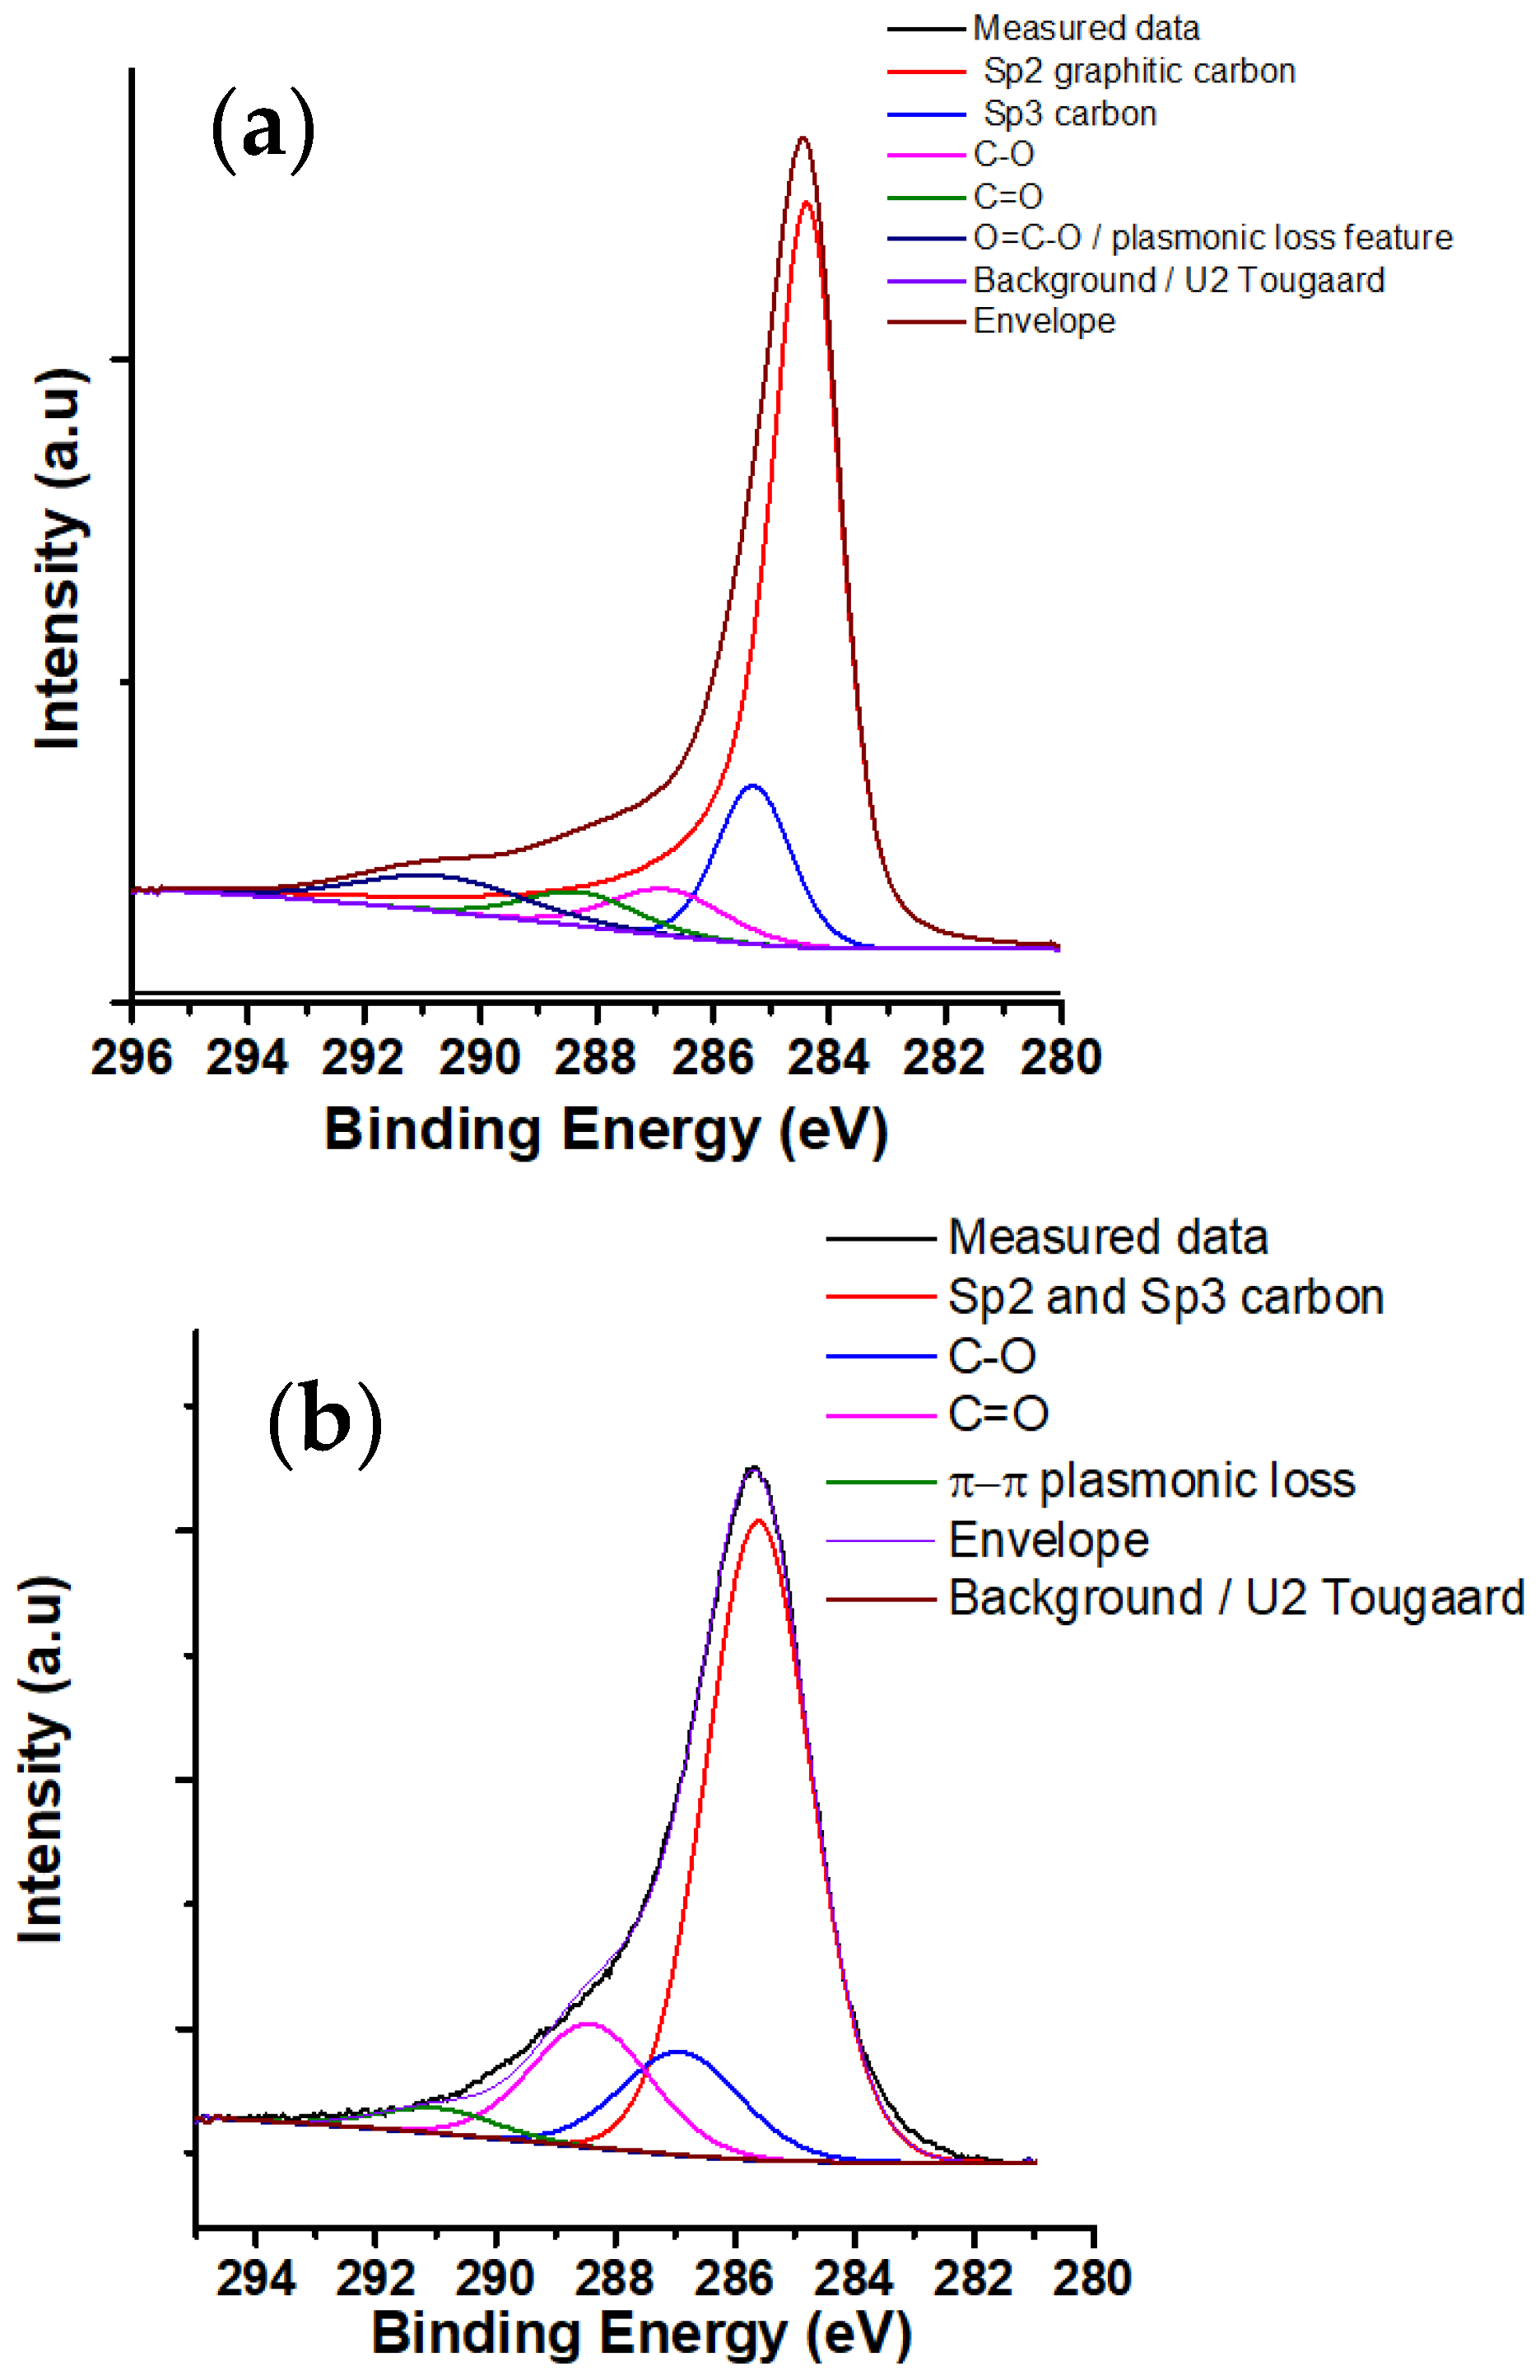
3.1. Structure of CNS and CNP

The XRD pattern of CNS and CNP is shown in Figure 1. The figure showed that the structure of CNS was amorphous due to the single broad diffraction peak centered at 20°. For CNP, it can be seen that there are two broad peaks at 2 θ = 25° and 2 θ = 43.8°. The diffraction peaks correspond to the (002) and (101) planes of graphite. The crystallinity in CNP is higher than in CNS because of the higher degree of graphitization [60]. This can increase the thermal conductivity of CNP nanofluids due to the amorphous particles scatter phonon [61].
Figure 2 shows the SEM photographs of the morphology of CNS (a, b) and CNP (c, d). From the figure, it can be seen that the CNS was uniformed in a well-shaped sphere with a smooth surface, while the CNP was irregular; and the particles of both types tend to aggregate. By treatment of the SEM images, the average diameter of the particles was obtained. The diameter of CNS and CNP was 198 and 60 nm, respectively. The size of the CNP is in agreement with the manufacturer (<100 nm). The size of the CNP is smaller than the CNS’s. This supports CNP nanofluids with higher k. However, the attractive force between CNP particles is larger, due to that most of the particles bond together to form a cluster; it makes the CNP nanofluid challenging to stabilize.
The nanoparticle shape strongly affects the transport processes in nanofluids [62], resulting in that the thermal conductivity and viscosity do not vary only on the volume fraction of nanoparticle, but in a different extent rely on the particle shape. As the molecular level interactions take place at the particle surface, the particle shapes impact the thermal and momentum transfer. The particle shape impacts on the particle–particle interaction (e.g., collision) and in the particle–fluid interaction (e.g., liquid layering) as well. These complex static and dynamic processes results in differences in augmentation, in the boundary (hydraulic and temperature) layer formation, in the role of radiation of the heat transfer, and in the liquid layering.
In order to investigate the functional groups of the used CNS and CNP to select the type of solvents and surfactants, FT-IR analysis was performed. The FT-IR spectrum of the used nanoparticles is shown in Figure 3.. For both types of nanoparticles, the property of vibration of –OH groups is at 3425 cm−1. At 1614 cm−1 and 1618 cm−1, the characteristic peak of the C=C double bonds is observed. The peaks at around 754, 796, and 840 cm−1 are caused by the hydrogen wagging absorption of aromatic rings [63]. For the CNS, the active mode at around 2930 cm−1 refers to the vibration of C–H bonds [60]. The peak at 1700 cm−1 and 1026 cm−1 is assigned to the –OH and C–O bonds, respectively [64]. For the CNP, the fingerprint bands at 616 and 473 cm−1 present the aromatic structure with monosubstitution [65].
The chemical composition of the CNS and CNP was obtained by EDX. The main elements, including C and O (H cannot be observed) from EDX and XPS measurements and SBET are presented in Table 1. The table presents the average of the atomic percentage at various measurement points. The atomic percent of the oxygen content in the CNP was lower than in the CNS. The CNP has 91.6 atomic percent of carbon from EDX analysis. The SBET of CNP is 10 times higher than that of CNS.
Figure 4 presents the thermal analysis of the CNS and CNP samples in air. For the CNS, there are two stages of weight loss observed. The first one refers to the removal of the absorbed water, the dehydration of the functional groups, and the densification of the surface layer of the CNS to 245 °C, and the weight loss is around 6.3%. The next one can be attributed to the oxidation of the carbonaceous nanomaterials to 450 °C [66]. For the CNP, the first stage lasts to 425 °C, and the weight loss is 3.9%; then, the oxidizing process happened to 650 °C [67]. The remaining ash from the oxidization was 0.5% and 5.5% for the CNS and CNP, respectively. This indicates that the structure of the CNP is more durable than that of CNS. This happened because the carbon atoms were oxidized more in the CNS nanoparticles. Similarly, reduced graphene oxide is highly stable compared to pure graphene oxide [68].
XPS spectrum and the deconvolution of the carbon 1s of CNS and CNP are shown in Figure 5 and Figure 6. From the figures, the carbon 1s contains five components: sp2, sp3, C–O, C=O, and O–C=O/loss feature observed at 284.3, 285.3, 286.8, 288.3, and 290.7 eV, respectively [69]. At 290.7 eV, the peak can be the mixture of plasmonic loss feature and carbon peak. Table 2 shows the concentration of chemical bonds from XPS measurements. The percentage of O–H in CNS is greater in CNS than in CNP. Also, the percentage of C–O and C=O of CNS is higher than that of CNP. This is consistent with the results of SBET. With greater carbon/oxygen ratio, the SBET values of particles are higher [70].
The maximum absorbance of CNS and CNP nanofluids over days is shown in Figure 7. It is obvious that the prepared nanofluids are stable for 4 days.

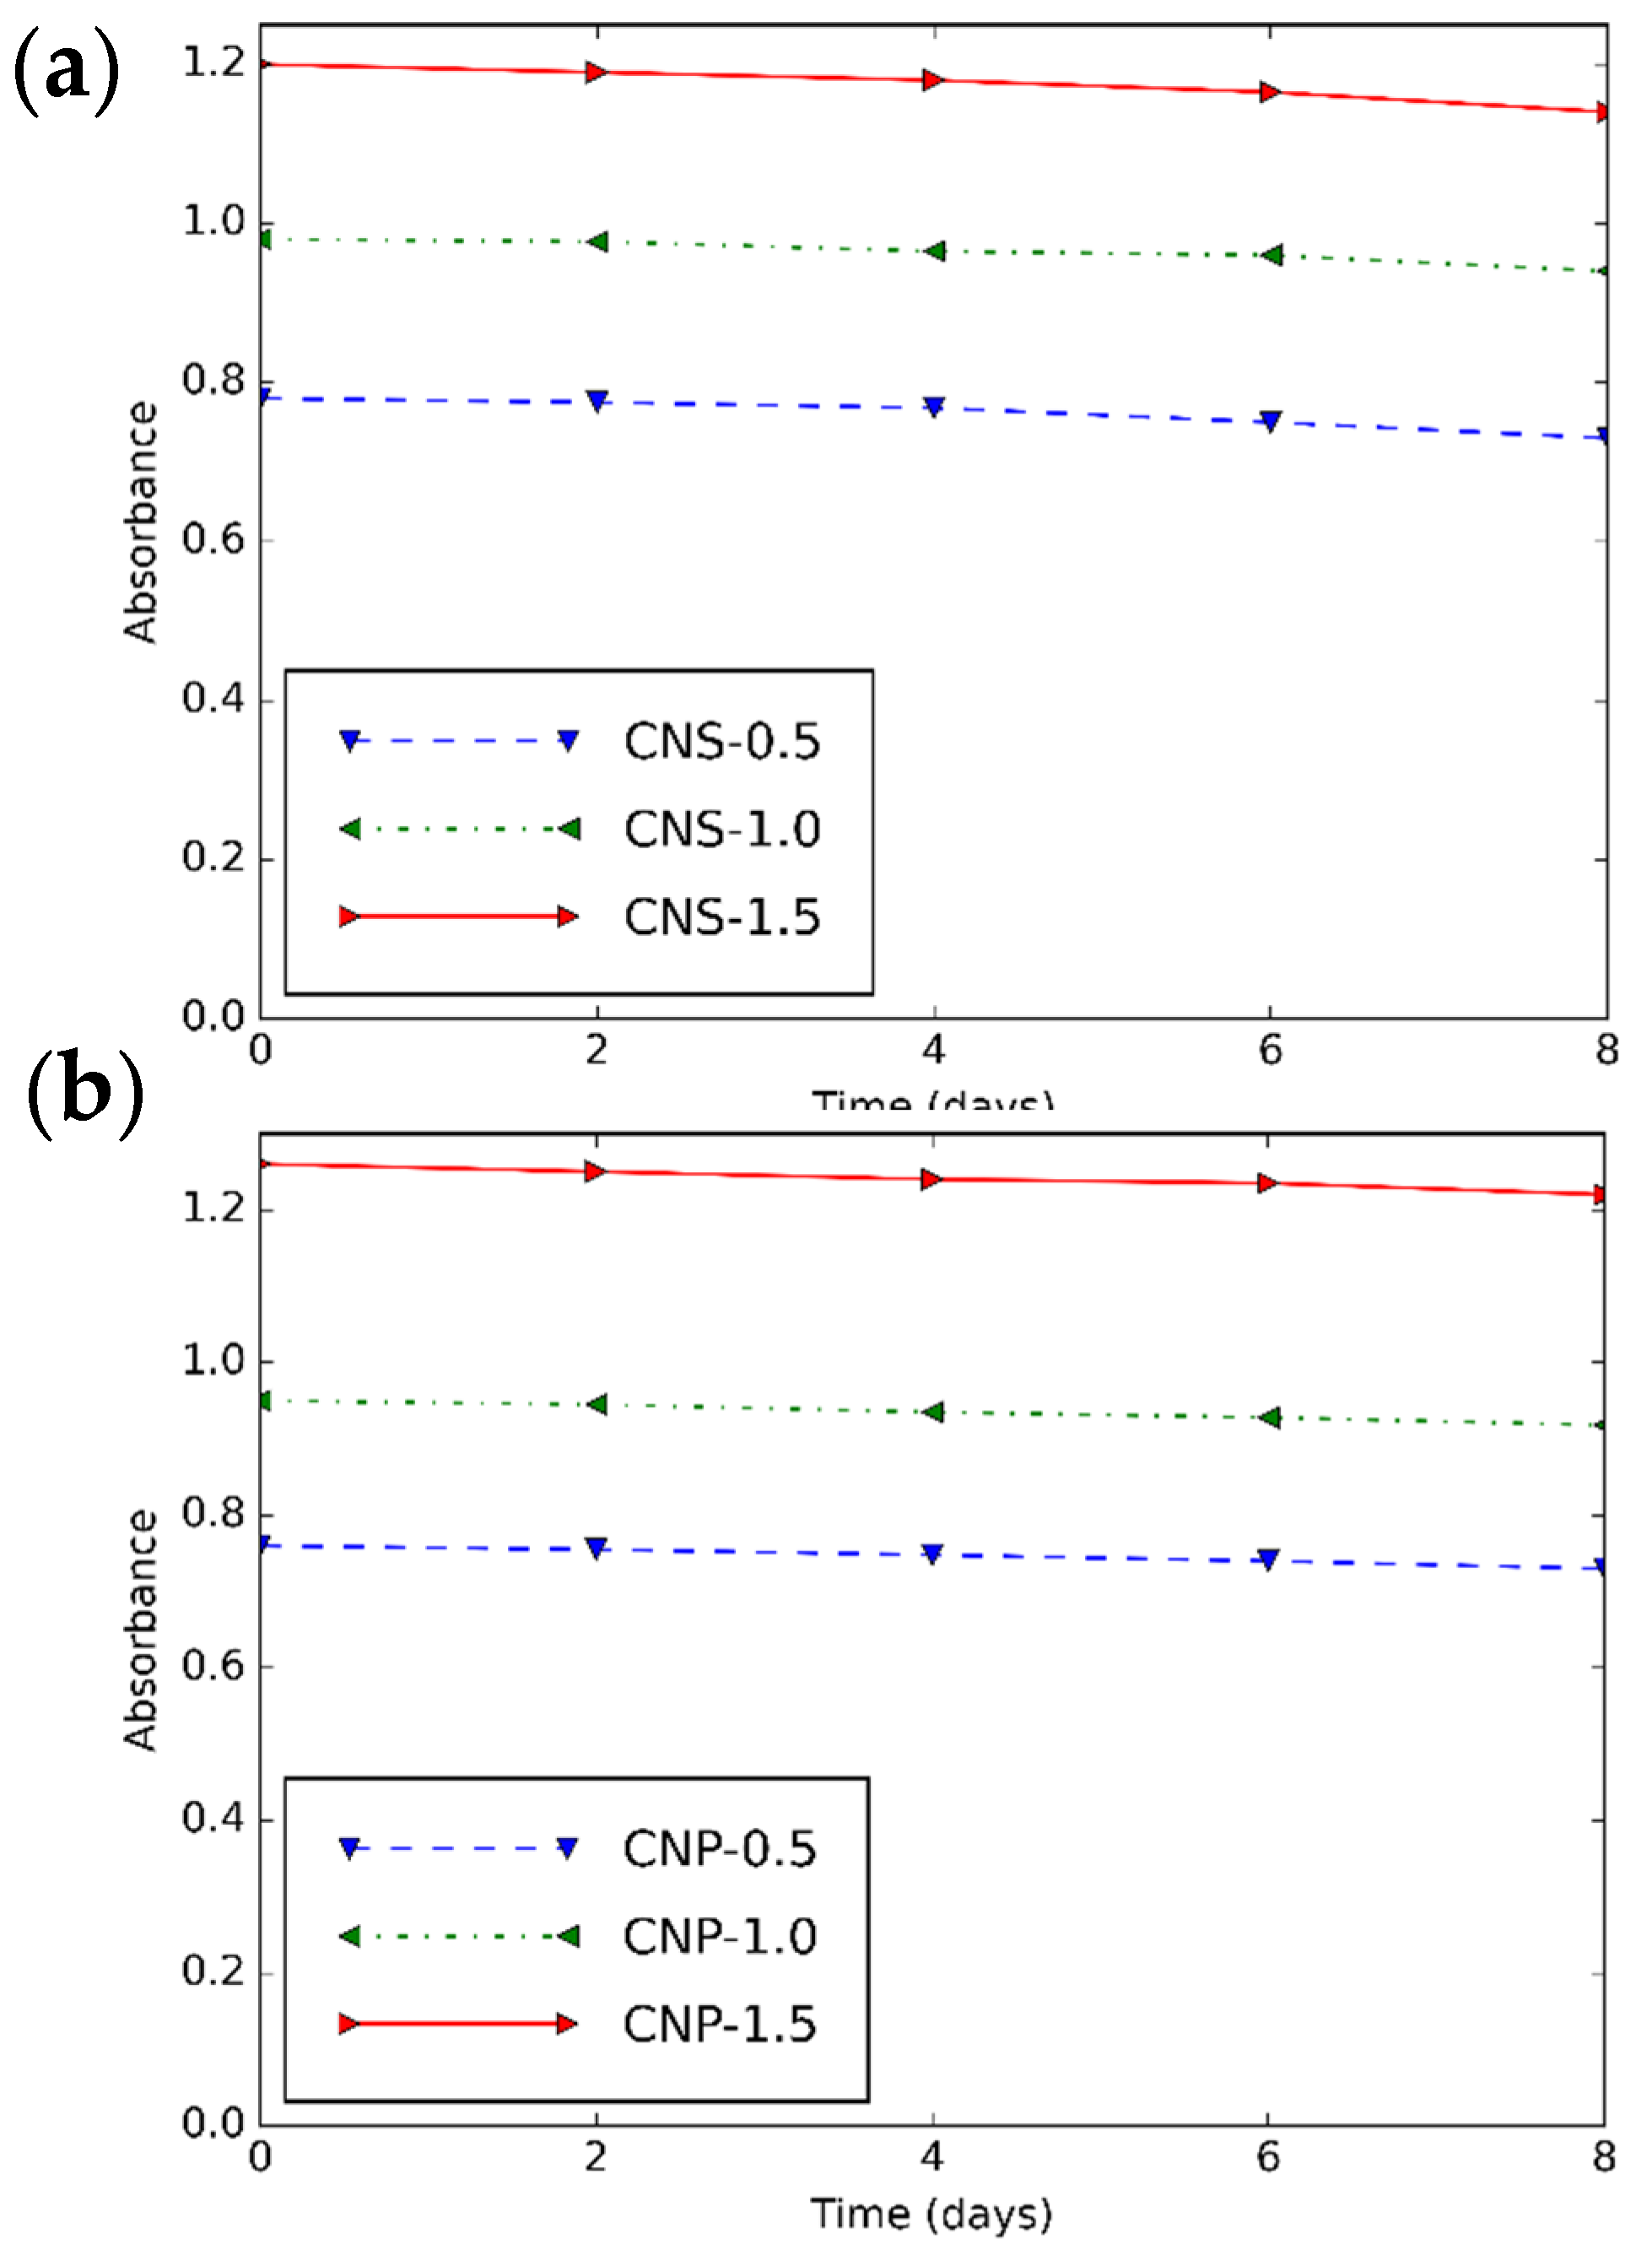
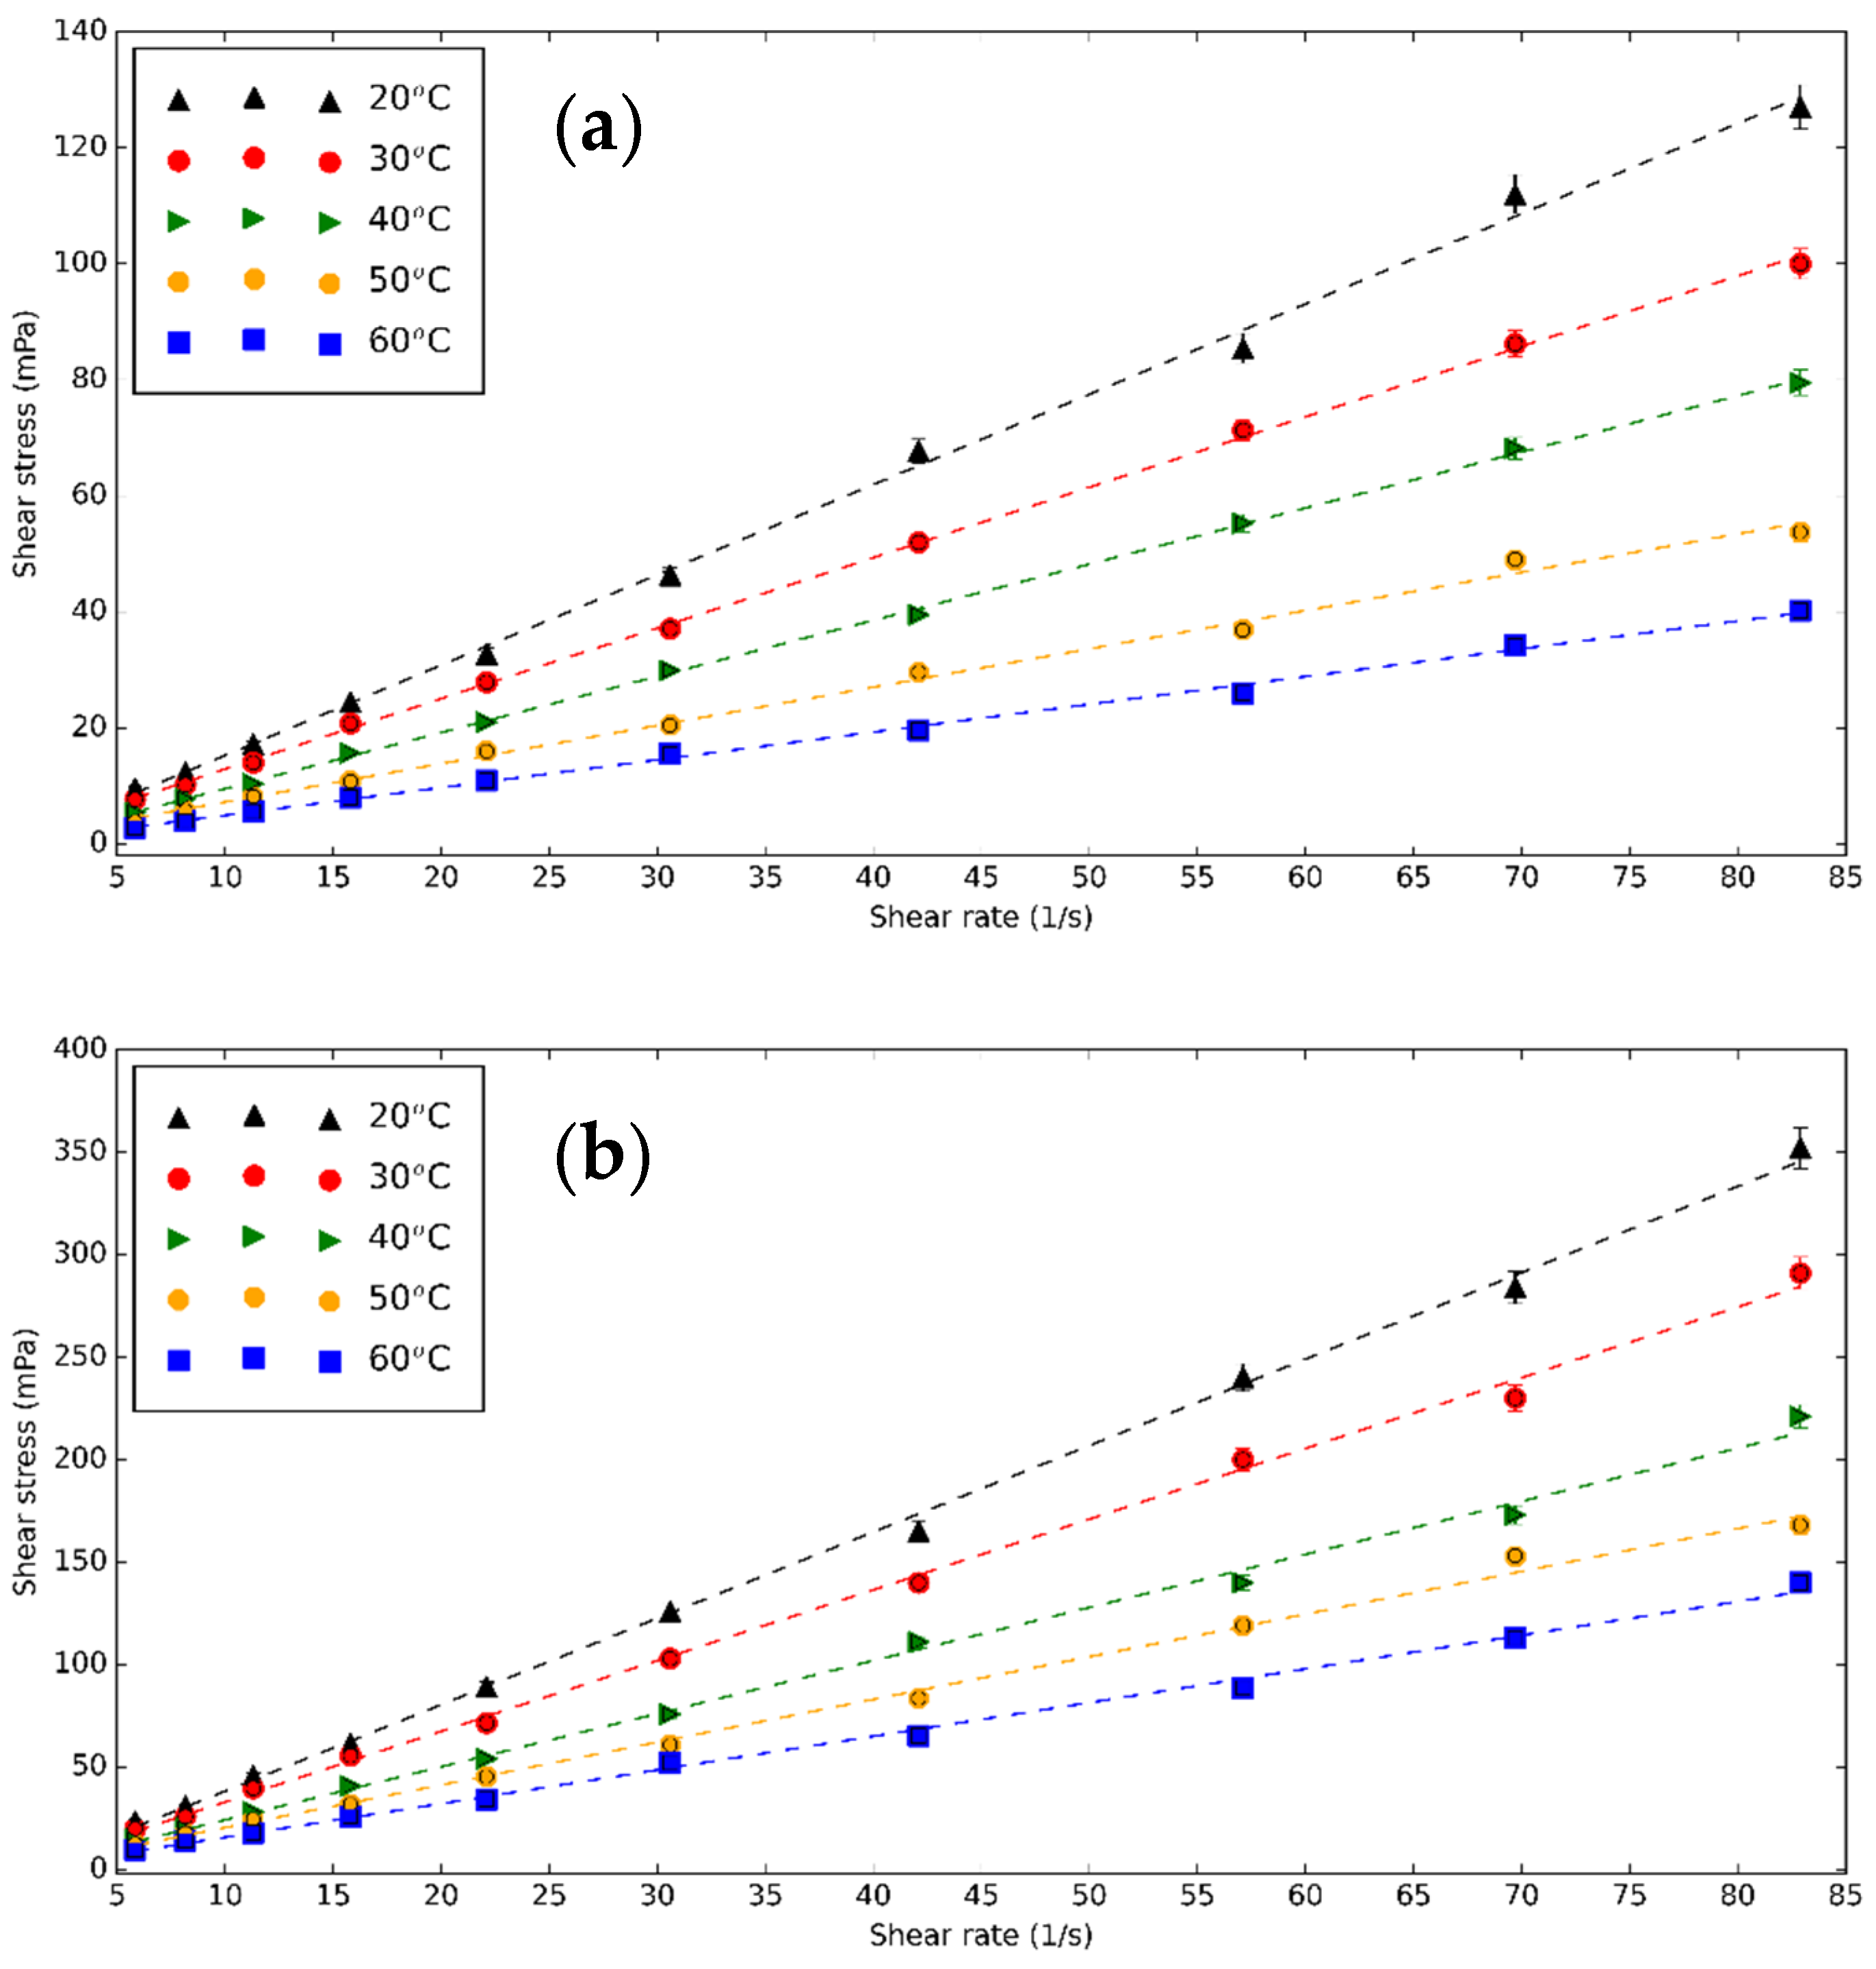
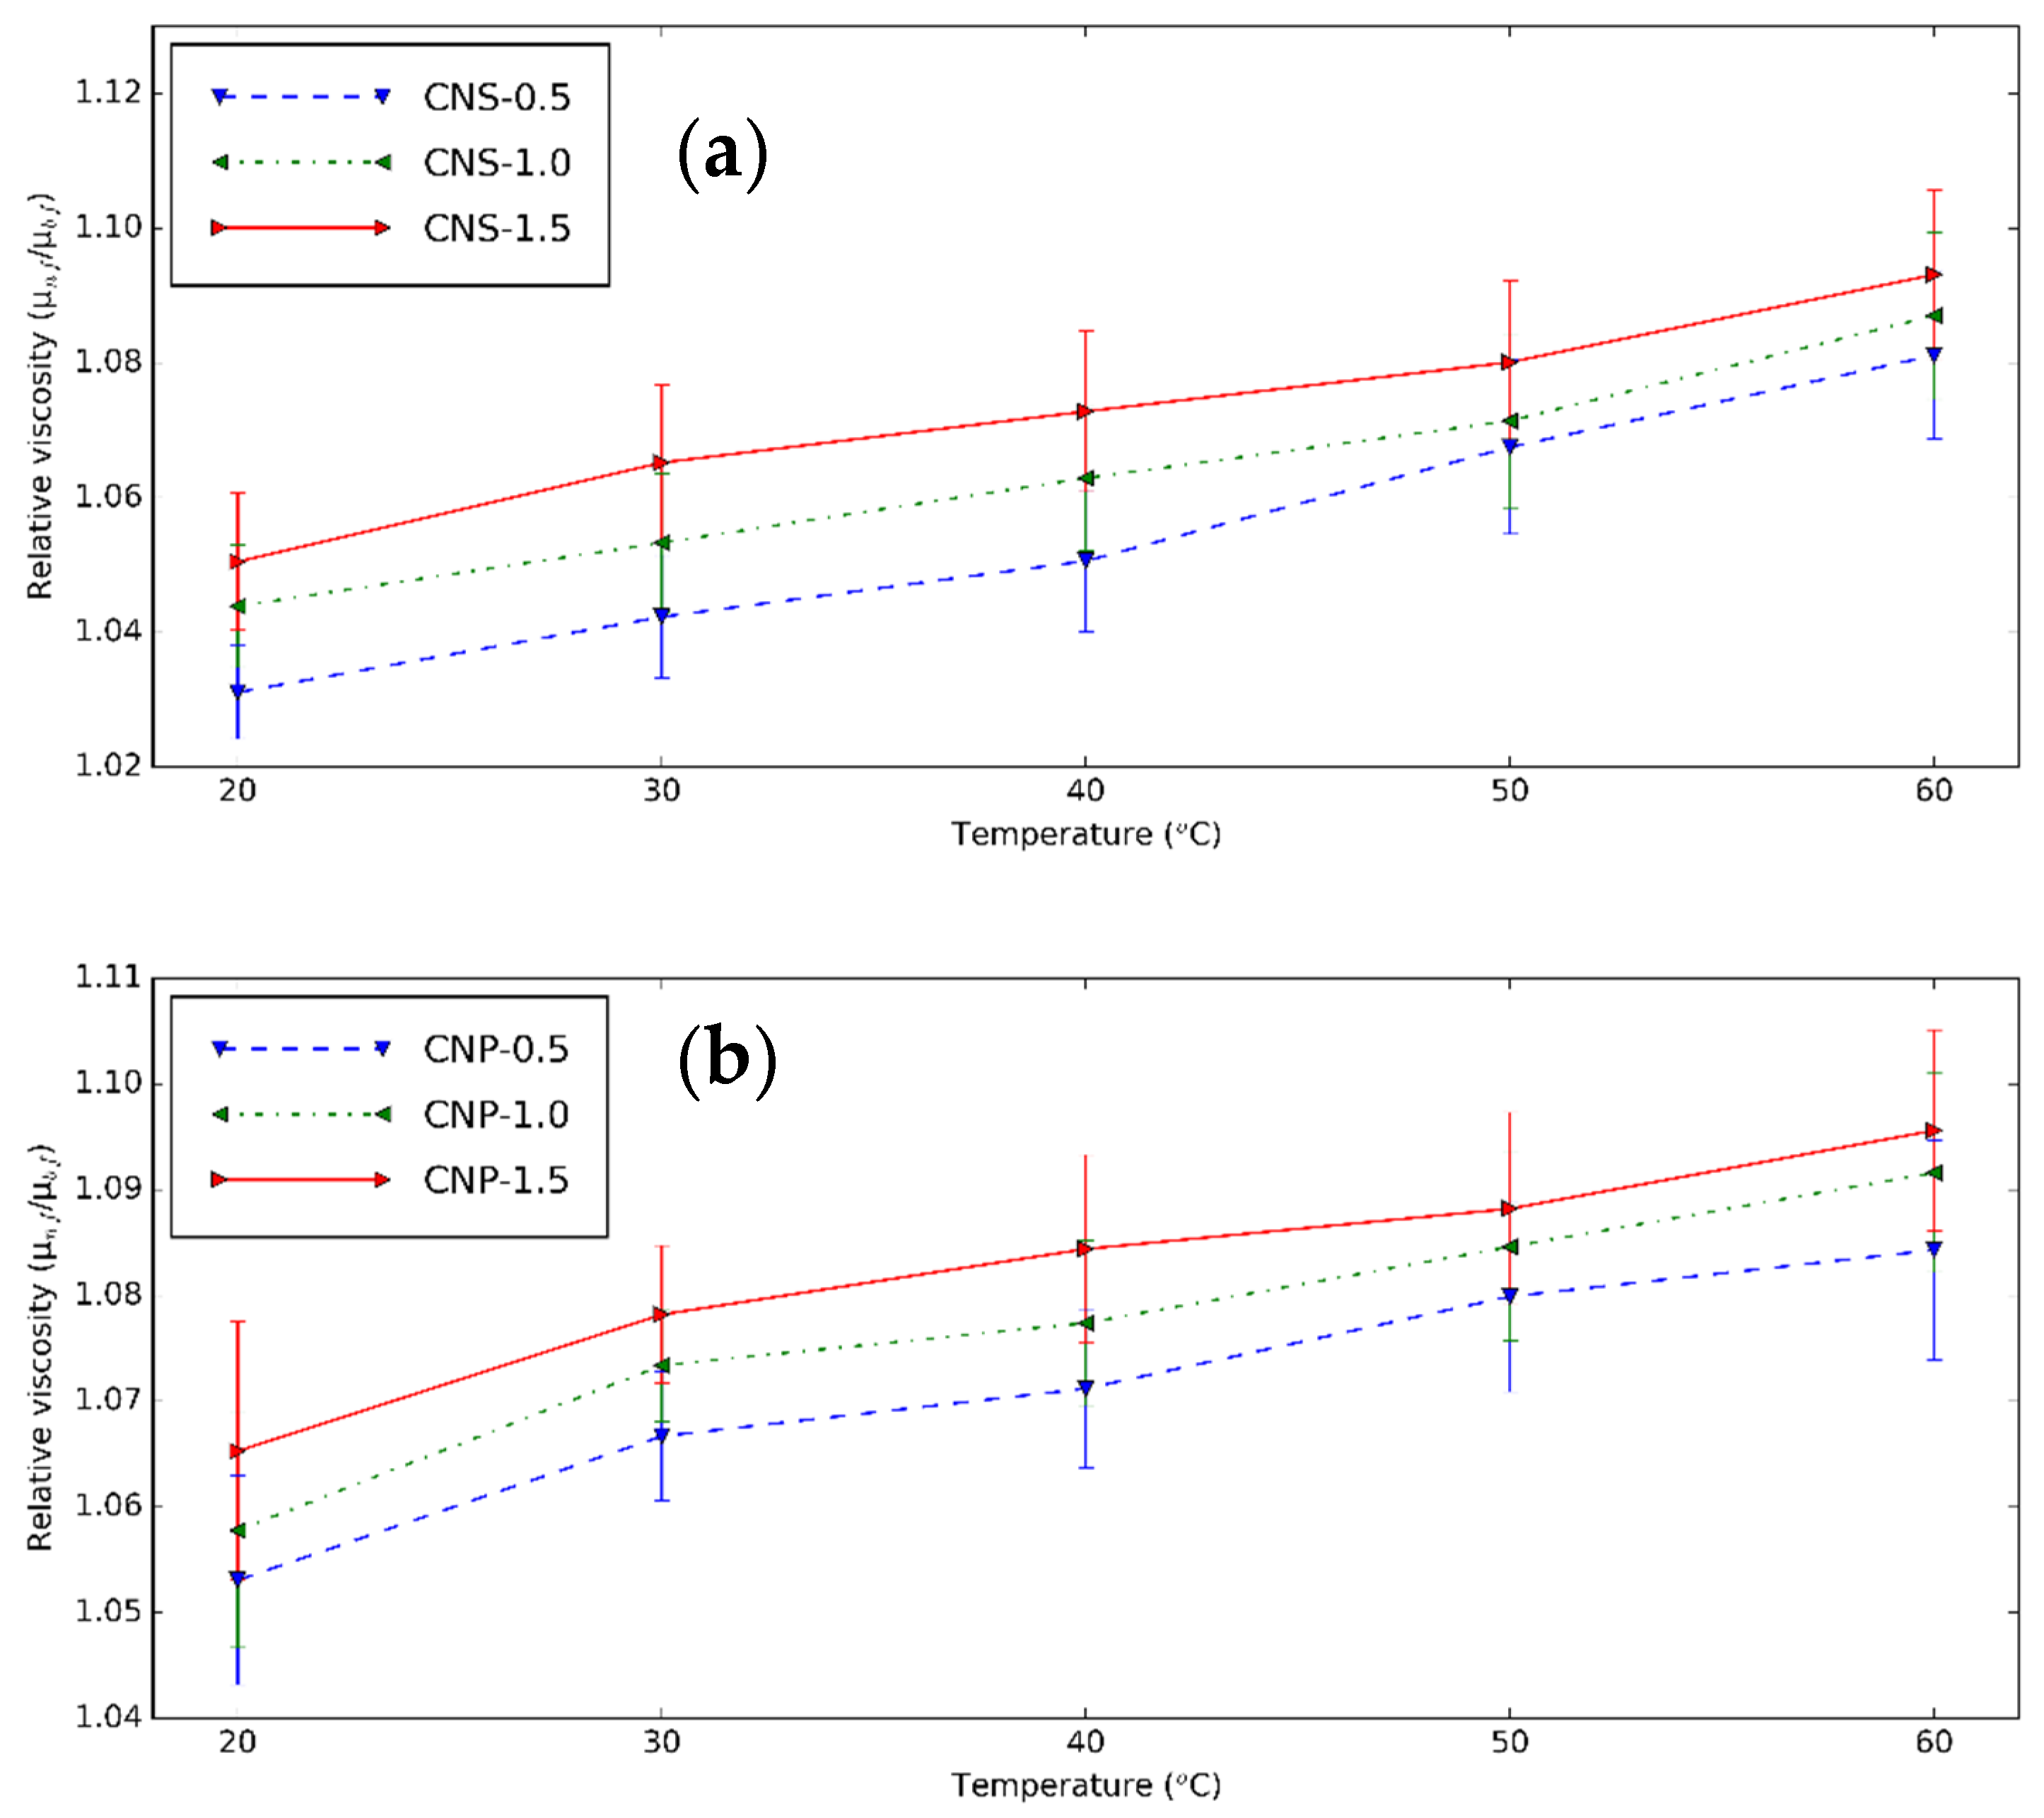
3.2. Rheological Characteristics of CNS and CNP Nanofluids

One of the most important factors determining the quality of the heat transfer fluid is µ because the increase of µ causes higher pumping energy. Similar to other fluids, temperature affects µnf. The viscometer is calibrated with DI and the measured value matches closely the theoretical result. The rheological measurements are performed on base fluid, CNS, and CNP nanofluids for three concentrations of 0.5, 1.0, and 1.5 vol% at different temperatures. Figure 8 presents the shear stress of 0.5 vol% CNS and CNP nanofluids as a function of shear rate at different temperatures. Increasing temperature makes the shear stress of the nanofluids lower due to the Brownian motion, while the concentration of CNS and CNP increases the shear stress [71,72]. The nanofluids are Newtonian because the chart line can be considered as linear.
The surface to volume ratio is significantly higher (see Figure 2) for CNP compared to the CNS. Forming nanofluid with the same concentration results more particle–fluid interaction resulting in higher shear stresses and higher viscosity.
The relative µ of CNS and CNP nanofluids, which is the ratio of the µ of nanofluids and base fluid, is shown in Figure 9 from 20 to 60 °C. The nanoparticle content increases µ. This is probably due to the formed clusters [3]. With temperature, µnf increases faster than that of the base fluid. The similar relative µnf are obtained for the two particles. However, the µ of CNP nanofluid (at 0.5 vol% at 20 °C, 3.911 mPas) is much higher than that of the CNS nanofluids (1.545 mPas) due to the usage of surfactant [73]. The µ increment of CNS nanofluid is between 3.11% and 9.31%, while this range of the CNP nanofluids is 5.31% and 9.56%.
The relative µ obtained in the current study was collated with the values published in the previous investigations to confirm the results [8,74]. The collation was performed with different concentrations and at 20 °C. Figure 10 shows the comparison between the present study and the previous results. This study has a result similar to the predicted values from Hatscheck et al. [74] and Wang et al. [8] at 0.5 vol%, while at higher concentrations, the Wang formula [8] overestimated the prepared nanofluid viscosities.

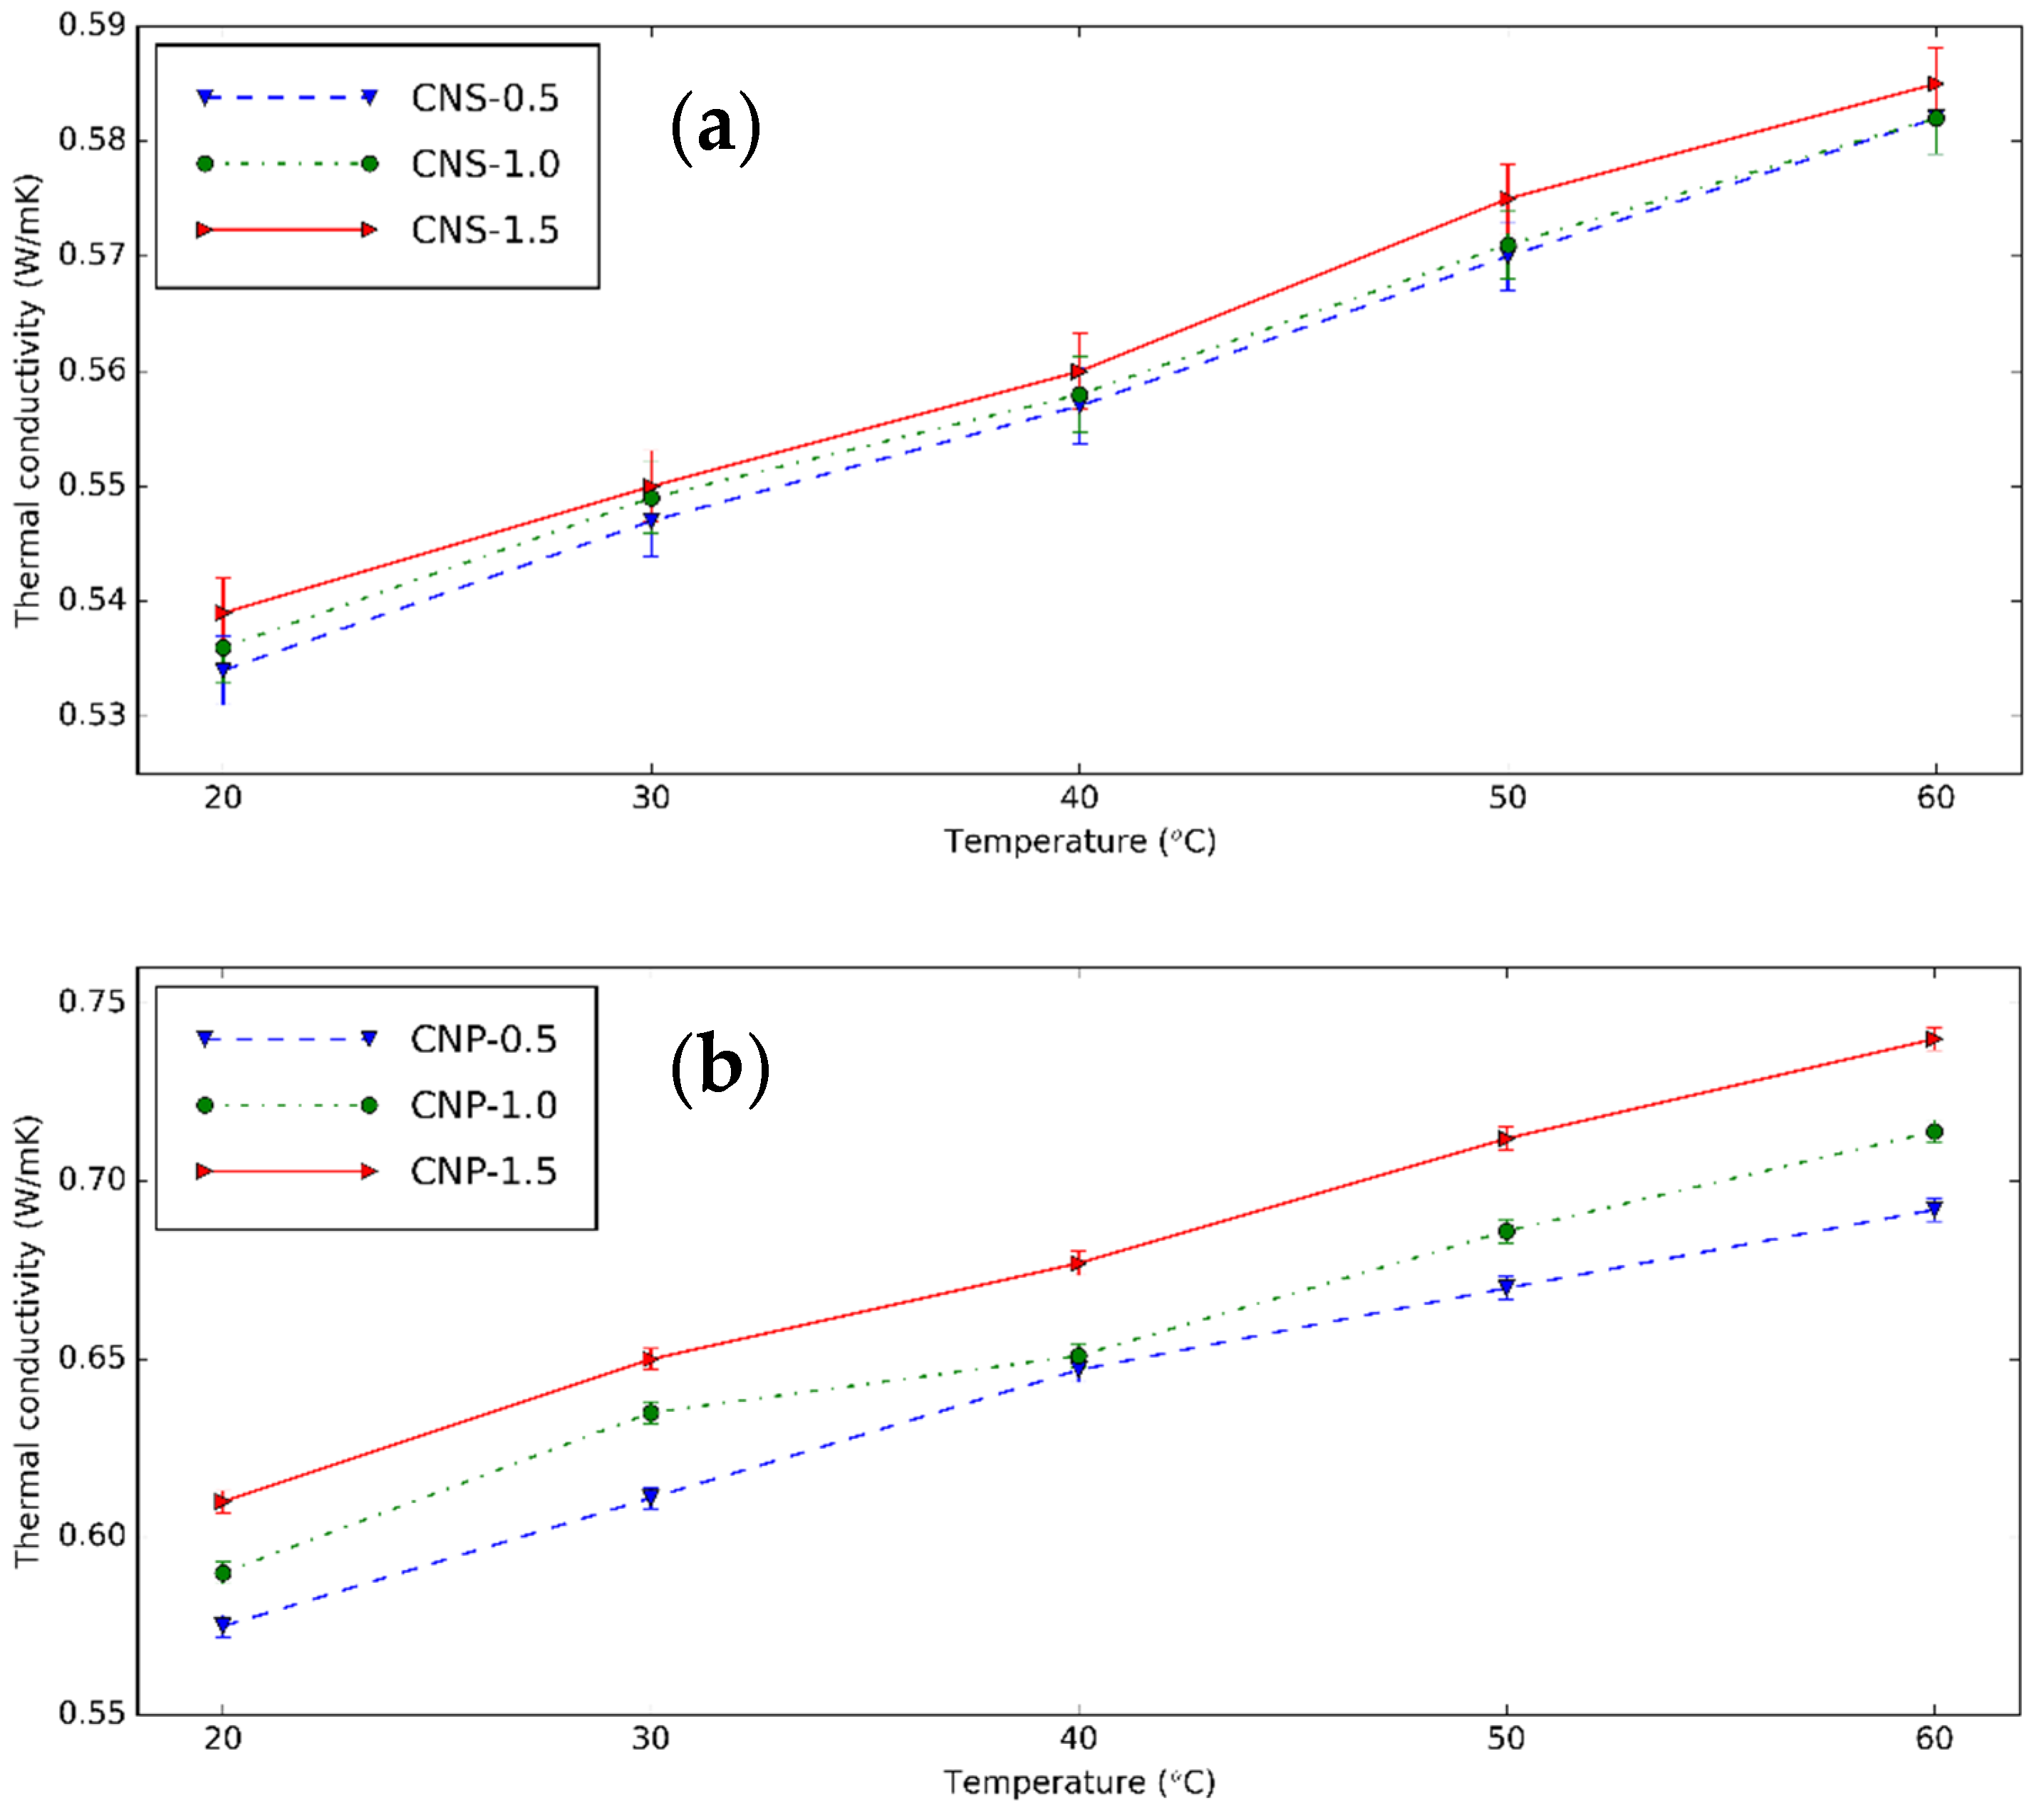
3.3. Thermal Conductivity of CNS and CNP Nanofluids

The k and its increment of CNS and CNP nanofluids is shown in Figure 11 and Figure 12 at different temperatures. The used device is trustable with a low error when k of distilled water was measured. The nanofluids have a higher k than these fluids without nanoparticles at experimental temperatures. Temperature increases knf because of the Brownian movement of nanoparticles. At 0.5 vol%, from 20 to 60 °C, k increases from 0.534 to 0.582 W/mK or 8.99% increment for CNS, and from 0.575 to 0.692 W/mK or 20.35% for CNP. The higher number of nanoparticles dispersed in the nanofluids or concentration of the nanofluids makes k greater. At 30 °C, from 0.5 vol% to 1.5 vol%, k increases by 0.55% for CNS and 6.38% for CNP nanofluids. In literature, from the results of Mirsaeidi et al. [19], the carbon dots nanofluids have k of 0.261 and 0.27 W/mK, the k enhancement of 3.6% and 7.1% for 0.4 and 1.0 vol%. Brzóska et al. [45] showed the k increments of MWCNT nanofluids were 15.4% and 29.3% for 0.5 and 1.0 vol%. Compared to the carbon dot nanofluids, the CNP nanofluids have a similar result, while the CNS nanofluids have lower k enhancement.
The k enhancement of CNP nanofluids is greater than that of the CNS nanofluids. This occurs due to the smaller sizes and higher crystallinity of the CNP nanoparticle. Moreover, based on the XPS analysis, CNP has higher carbon/oxygen ratio, this improves better the k of the CNP nanofluids [70]. It is concluded that although the CNP nanofluids are difficult for stabilization, these nanofluids have better k. The carbon dots with smaller size improve more k for the nanofluids based on them [19]. These results are lower than the k enhancement of MWCNT nanofluids [45]. This can be explained by the long shape of MWCNT.
The comparison of k enhancement between this study and the previous research is shown in Figure 13. Clearly, the results estimated from Pak’s model [75] match with CNP nanofluids, while the Maxwell model [76] is suitable for the CNS nanofluids.

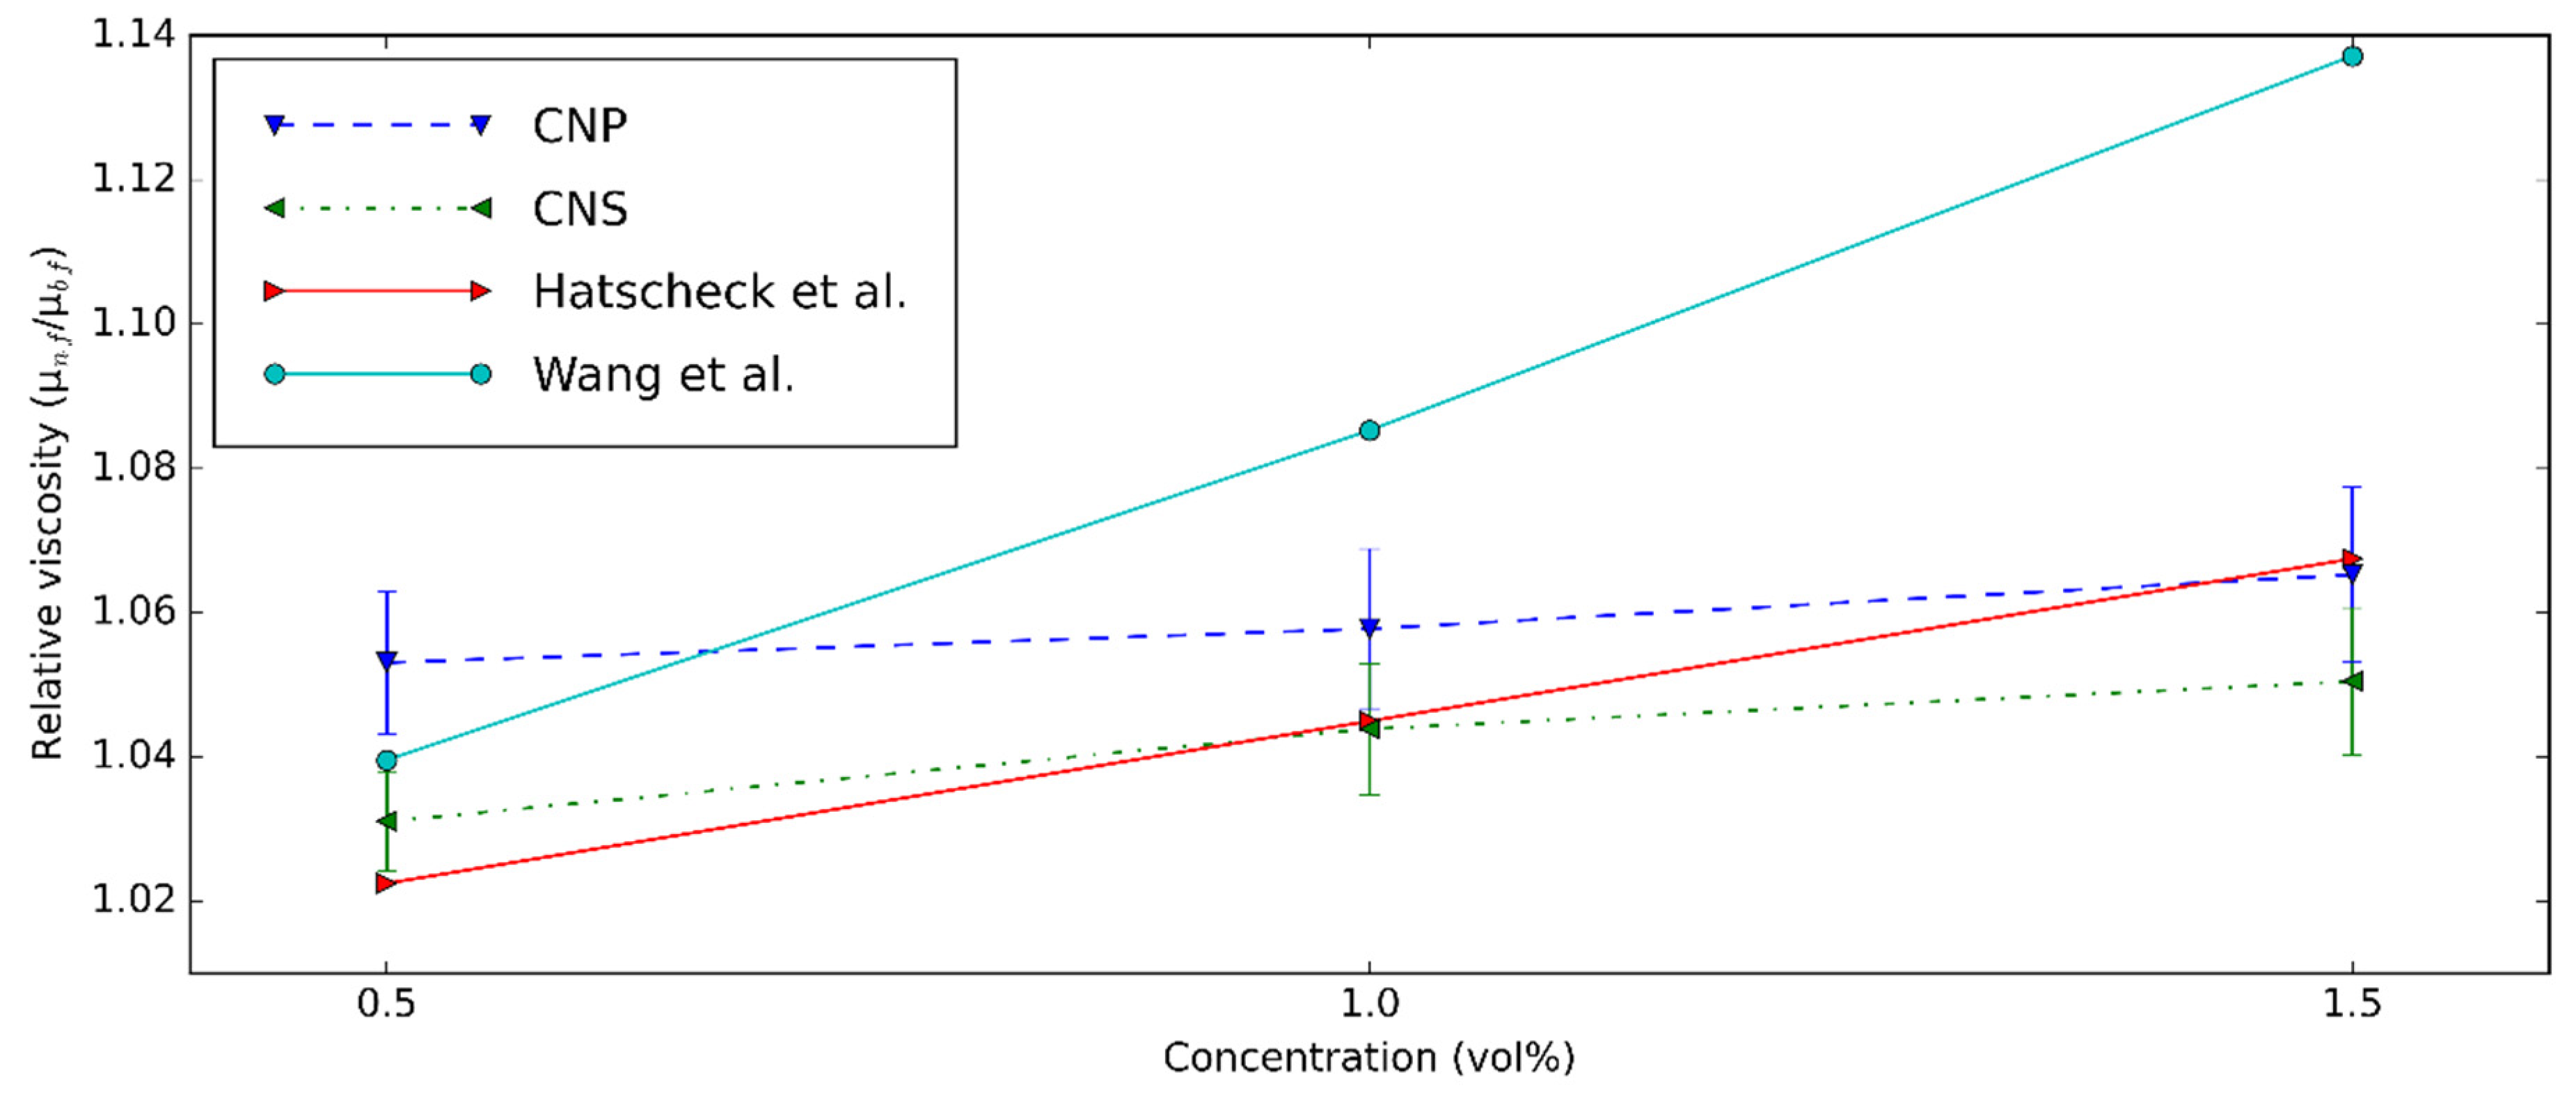
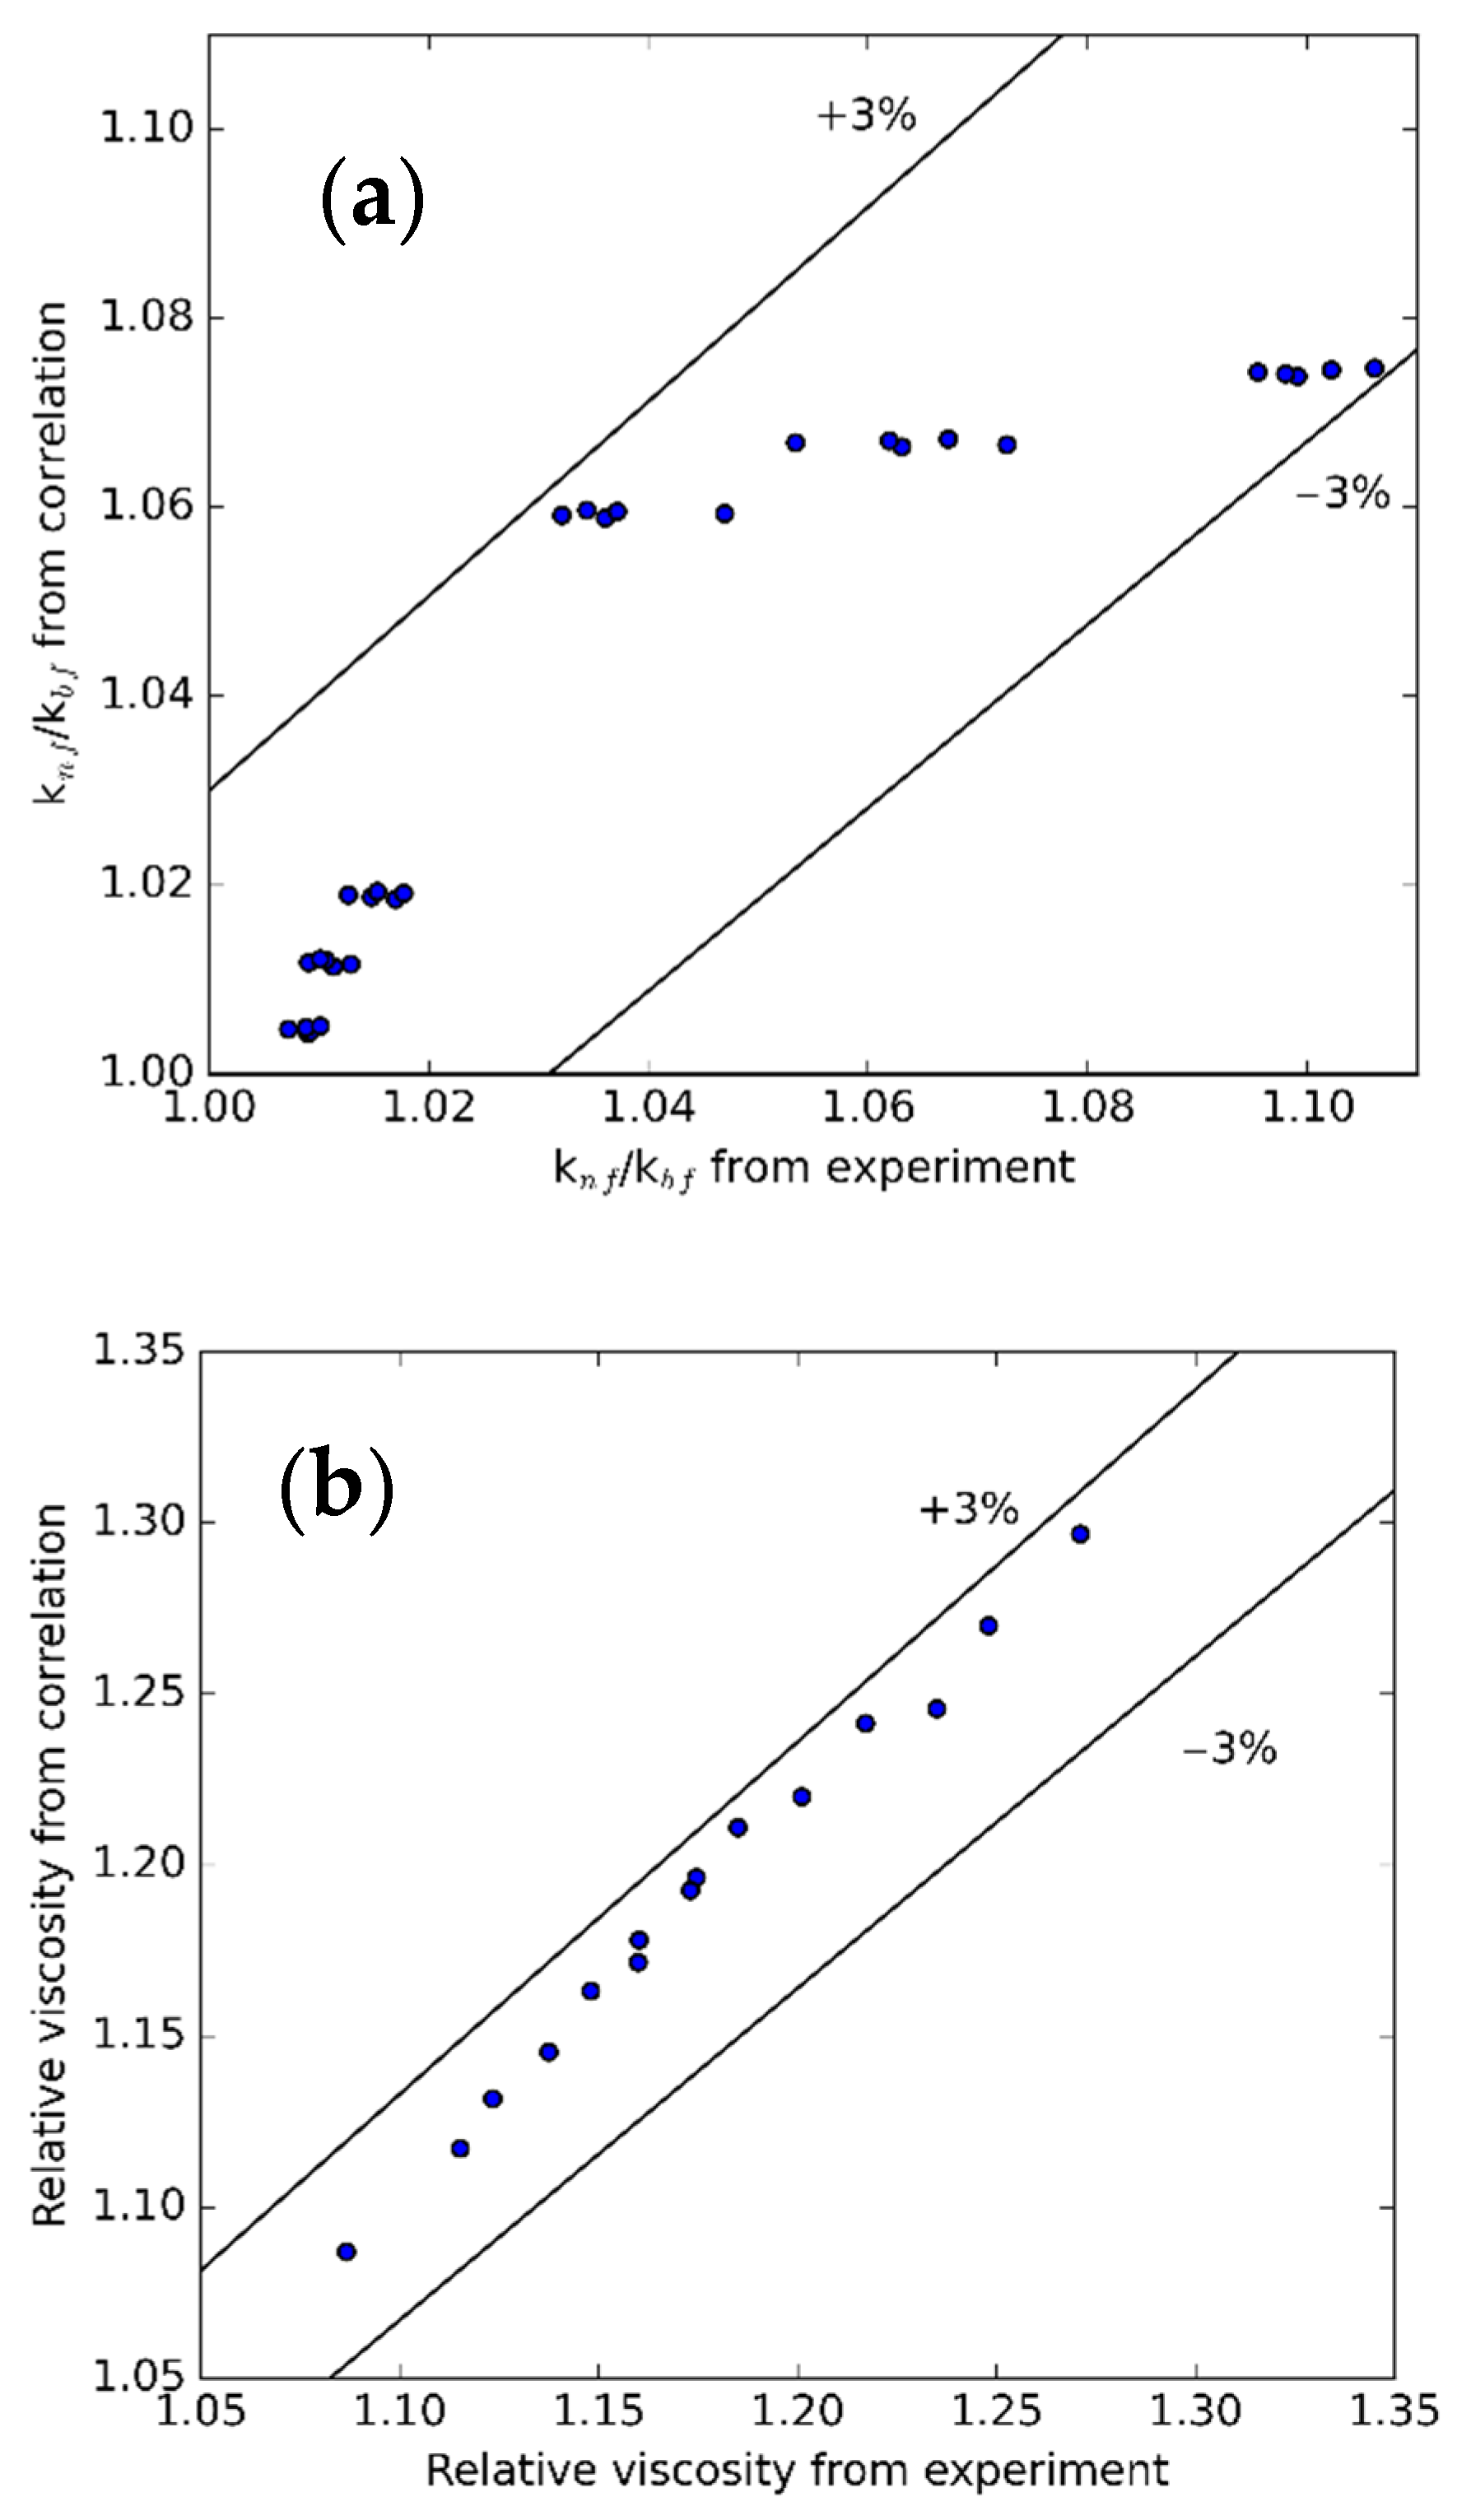
3.4. Regression Correlations

According to the research of Azmi et al. [77] and based on the mean values of the measured data, the following correlations are developed:
Relative   viscosity = μ nf μ bf = 1.029 ( 1 + T 60 ) 0.08543 ( 1 + ϕ 100 ) 1.379 ( 1 + d 60 ) 0.01628
k nf = k bf ×   1.102 ( 1 + T 60 ) 0.00192 ( 1 + ϕ 100 ) 1.142 ( 1 + d 60 ) 0.06916 ,
where φ, d, and T are volume concentration, particle size, and temperature.
Figure 14 presents the comparison of the k and µ from the measurement and regression equations. The average and standard deviations are 0.30% and 0.37% for µ; 1.04% and 0.74% for k. With these results, it can be proved that these correlations are applicable for future applications.

4. Conclusions

The CNS and CNP nanofluids were successfully prepared by using ultrasound and surfactants. The comparative research on stability, µ, and k was performed for the first time. The CNS and CNP nanoparticles were studied with XPS, SBET, FTIR, XRD, SEM-EDX, TG/DTA. The results present that the structure of CNP is more durable than that of CNS. While the uniformity of CNS is higher, the size of CNS is larger. The nanofluids with high concentrations can be considered as stable for at least 4 days.
The CNP nanofluids have the highest k enhancement of 10.61% for 1.5 vol% concentration compared to the base fluid, while the CNS does not make knf significantly higher. These nanofluids were Newtonian. The relative µ of CNS and CNP nanofluids was 1.04 and 1.07 at 0.5 vol% concentration and 30 °C. With CNP nanoparticles, the T80 surfactant was used for stabilizing the nanofluids. It makes the µ of CNP nanoparticles much higher. Based on the measured data, the regression correlations were proposed for future usage.

Author Contributions

Conceptualization, I.M.S. and T.L.B.; methodology, T.L.B., M.B., I.E.L., G.G., and K.H.; investigation, M.B. and T.L.B.; funding acquisition, I.M.S.; resources, I.M.S.; supervision, I.M.S.; writing—original draft preparation, T.L.B.; writing—review and editing, T.L.B., K.H., S.W., and I.M.S. All authors have read and agreed to the published version of the manuscript.

Funding

An NRDI K 124212 and an NRDI TNN_16 123631 grants are acknowledged. The research within project No. VEKOP-2.3.2-16-2017-00013 was supported by the European Union and the State of Hungary, co-financed by the European Regional Development Fund. The research reported in this paper was supported by the BME Nanotechnology and Materials Science TKP2020 IE grant of NKFIH Hungary (BME IE-NAT TKP2020) Stipendium Hungaricum scholarship grant.

Data Availability Statement

The data presented in this study are available on request from the corresponding author.

Acknowledgments

The authors thank Krisztina László (Budapest University of Technology and Economics, Department of Physical Chemistry and Materials Science) for help in specific surface area measurements and Zoltán Kónya (University of Szeged, Department of Applied and Environmental Chemistry) for help in XPS measurements.

Conflicts of Interest

The authors declare no conflict of interest.

References

  1. Mahian, O.; Kianifar, A.; Kalogirou, S.A.; Pop, I.; Wongwises, S. A review of the applications of nanofluids in solar energy. Int. J. Heat Mass Transf. 2013, 57, 582–594. [Google Scholar] [CrossRef]
  2. Murshed, S.; Leong, K.; Yang, C. Enhanced thermal conductivity of TiO2—water based nanofluids. Int. J. Therm. Sci. 2005, 44, 367–373. [Google Scholar] [CrossRef]
  3. Le Ba, T.; Mahian, O.; Wongwises, S.; Szilágyi, I.M. Review on the recent progress in the preparation and stability of graphene-based nanofluids. J. Therm. Anal. Calorim. 2020, 142, 1145–1172. [Google Scholar] [CrossRef] [Green Version]
  4. Sharma, A.K.; Tiwari, A.K.; Dixit, A.R. Rheological behaviour of nanofluids: A review. Renew. Sustain. Energy Rev. 2016, 53, 779–791. [Google Scholar] [CrossRef]
  5. Masuda, H.; Ebata, A.; Teramae, K.; Hishinuma, N. Alteration of Thermal Conductivity and Viscosity of Liquid by Dispersing Ultra-Fine Particles. Dispersion of Al2O3, SiO2 and TiO2 Ultra-Fine Particles. Netsu Bussei 1993, 7, 227–233. [Google Scholar] [CrossRef]
  6. Choi, S.U.; Eastman, J.A. Enhancing thermal conductivity of fluids with nanoparticles. In Proceedings of the 1995 International Mechanical Engineering Congress and Exhibition, San Francisco, CA, USA, 12–17 November 1995. [Google Scholar]
  7. Lee, S.; Choi, S.U.-S.; Li, S.; Eastman, J.A. Measuring Thermal Conductivity of Fluids Containing Oxide Nanoparticles. J. Heat Transf. 1999, 121, 280–289. [Google Scholar] [CrossRef]
  8. Wang, X.; Xu, X.; Choi, S.U.S. Thermal Conductivity of Nanoparticle—Fluid Mixture. J. Thermophys. Heat Transf. 1999, 13, 474–480. [Google Scholar] [CrossRef]
  9. Choi, S.U.S.; Zhang, Z.G.; Yu, W.; Lockwood, F.E.; Grulke, E.A. Anomalous thermal conductivity enhancement in nanotube suspensions. Appl. Phys. Lett. 2001, 79, 2252–2254. [Google Scholar] [CrossRef]
  10. Al-Anssari, S.; Arif, M.; Wang, S.; Barifcani, A.; Iglauer, S. Stabilising nanofluids in saline environments. J. Colloid Interface Sci. 2017, 508, 222–229. [Google Scholar] [CrossRef] [Green Version]
  11. Babu, K.; Kumar, T.P. Effect of CNT concentration and agitation on surface heat flux during quenching in CNT nanofluids. Int. J. Heat Mass Transf. 2011, 54, 106–117. [Google Scholar] [CrossRef]
  12. Ashtiani, D.; Akhavan-Behabadi, M.; Pakdaman, M.F. An experimental investigation on heat transfer characteristics of multi-walled CNT-heat transfer oil nanofluid flow inside flattened tubes under uniform wall temperature condition. Int. Commun. Heat Mass Transf. 2012, 39, 1404–1409. [Google Scholar] [CrossRef]
  13. Le Ba, T.; Várady, Z.I.; Lukács, I.E.; Molnár, J.; Balczár, I.A.; Wongwises, S.; Szilágyi, I.M. Experimental investigation of rheological properties and thermal conductivity of SiO2–P25 TiO2 hybrid nanofluids. J. Therm. Anal. Calorim. 2020, 1–15. [Google Scholar] [CrossRef]
  14. Le Ba, T.; Alkurdi, A.Q.; Lukács, I.E.; Molnár, J.; Wongwises, S.; Gróf, G.; Szilágyi, I.M. A Novel Experimental Study on the Rheological Properties and Thermal Conductivity of Halloysite Nanofluids. Nanomaterials 2020, 10, 1834. [Google Scholar] [CrossRef]
  15. Ding, Y.; Chen, H.; Wang, L.; Yang, C.-Y.; He, Y.; Yang, W.; Lee, W.P.; Zhang, L.; Huo, R. Heat Transfer Intensification Using Nanofluids. KONA Powder Part. J. 2007, 25, 23–38. [Google Scholar] [CrossRef] [Green Version]
  16. Pantzali, M.; Mouza, A.; Paras, S. Investigating the efficacy of nanofluids as coolants in plate heat exchangers (PHE). Chem. Eng. Sci. 2009, 64, 3290–3300. [Google Scholar] [CrossRef]
  17. Phuoc, T.X.; Massoudi, M.; Chen, R.-H. Viscosity and thermal conductivity of nanofluids containing multi-walled carbon nanotubes stabilized by chitosan. Int. J. Therm. Sci. 2011, 50, 12–18. [Google Scholar] [CrossRef]
  18. Razi, P.; Akhavan-Behabadi, M.; Saeedinia, M. Pressure drop and thermal characteristics of CuO–Base oil nanofluid laminar flow in flattened tubes under constant heat flux. Int. Commun. Heat Mass Transf. 2011, 38, 964–971. [Google Scholar] [CrossRef]
  19. Mirsaeidi, A.M.; Yousefi, F. Viscosity, thermal conductivity and density of carbon quantum dots nanofluids: An experimental investigation and development of new correlation function and ANN modeling. J. Therm. Anal. Calorim. 2021, 143, 351–361. [Google Scholar] [CrossRef]
  20. Devendiran, D.K.; Amirtham, V.A. A review on preparation, characterization, properties and applications of nanofluids. Renew. Sustain. Energy Rev. 2016, 60, 21–40. [Google Scholar] [CrossRef]
  21. Kumar, D.D.; Arasu, A.V. A comprehensive review of preparation, characterization, properties and stability of hybrid nanofluids. Renew. Sustain. Energy Rev. 2018, 81, 1669–1689. [Google Scholar] [CrossRef]
  22. Sajid, M.U.; Ali, H.M. Thermal conductivity of hybrid nanofluids: A critical review. Int. J. Heat Mass Transf. 2018, 126, 211–234. [Google Scholar] [CrossRef]
  23. Caccia, M.; Rodríguez, A.; Narciso, J. Diamond Surface Modification to Enhance Interfacial Thermal Conductivity in Al/Diamond Composites. JOM 2014, 66, 920–925. [Google Scholar] [CrossRef]
  24. Molina, J.; Prieto, R.; Narciso, J.; Louis, E. The effect of porosity on the thermal conductivity of Al–12wt.% Si/SiC composites. Scr. Mater. 2009, 60, 582–585. [Google Scholar] [CrossRef]
  25. Esfe, M.H.; Zabihi, F.; Rostamian, H.; Esfandeh, S. Experimental investigation and model development of the non-Newtonian behavior of CuO-MWCNT-10w40 hybrid nano-lubricant for lubrication purposes. J. Mol. Liq. 2018, 249, 677–687. [Google Scholar] [CrossRef]
  26. Eshgarf, H.; Afrand, M. An experimental study on rheological behavior of non-Newtonian hybrid nano-coolant for application in cooling and heating systems. Exp. Therm. Fluid Sci. 2016, 76, 221–227. [Google Scholar] [CrossRef]
  27. Esfe, M.H.; Rostamian, H.; Sarlak, M.R. A novel study on rheological behavior of ZnO-MWCNT/10w40 nanofluid for automotive engines. J. Mol. Liq. 2018, 254, 406–413. [Google Scholar] [CrossRef]
  28. Teng, T.-P.; Cheng, C.-M.; Pai, F.-Y. Preparation and characterization of carbon nanofluid by a plasma arc nanoparticles synthesis system. Nanoscale Res. Lett. 2011, 6, 293. [Google Scholar] [CrossRef] [Green Version]
  29. Teng, T.-P.; Lin, L.; Yu, C.-C. Preparation and Characterization of Carbon Nanofluids by Using a Revised Water-Assisted Synthesis Method. J. Nanomater. 2013, 2013, 1–12. [Google Scholar] [CrossRef]
  30. Afrand, M.; Esfe, M.H.; Abedini, E.; Teimouri, H. Predicting the effects of magnesium oxide nanoparticles and temperature on the thermal conductivity of water using artificial neural network and experimental data. Phys. E Low-Dimensional Syst. Nanostruct. 2017, 87, 242–247. [Google Scholar] [CrossRef]
  31. Esfahani, N.N.; Toghraie, D.; Afrand, M. A new correlation for predicting the thermal conductivity of ZnO–Ag (50%–50%)/water hybrid nanofluid: An experimental study. Powder Technol. 2018, 323, 367–373. [Google Scholar] [CrossRef]
  32. Ghadimi, A.; Saidur, R.; Metselaar, H. A review of nanofluid stability properties and characterization in stationary conditions. Int. J. Heat Mass Transf. 2011, 54, 4051–4068. [Google Scholar] [CrossRef]
  33. Estellé, P.; Halelfadl, S.; Mare, T. Lignin as dispersant for water-based carbon nanotubes nanofluids: Impact on viscosity and thermal conductivity. Int. Commun. Heat Mass Transf. 2014, 57, 8–12. [Google Scholar] [CrossRef]
  34. Zawrah, M.; Khattab, R.; Girgis, L.; El Daidamony, H.; Aziz, R.E.A. Stability and electrical conductivity of water-base Al2O3 nanofluids for different applications. HBRC J. 2016, 12, 227–234. [Google Scholar] [CrossRef] [Green Version]
  35. Manasrah, A.D.; Almanassra, I.W.; Marei, N.N.; Al-Mubaiyedh, U.A.; Laoui, T.; Atieh, M.A. Surface modification of carbon nanotubes with copper oxide nanoparticles for heat transfer enhancement of nanofluids. RSC Adv. 2018, 8, 1791–1802. [Google Scholar] [CrossRef] [Green Version]
  36. Buongiorno, J.; Venerus, D.C.; Prabhat, N.; McKrell, T.J.; Townsend, J.; Christianson, R.J.; Tolmachev, Y.V.; Keblinski, P.; Hu, L.-W.; Alvarado, J.L.; et al. A benchmark study on the thermal conductivity of nanofluids. J. Appl. Phys. 2009, 106, 094312. [Google Scholar] [CrossRef] [Green Version]
  37. Özerinç, S.; Kakaç, S.; Yazıcıoğlu, A.G. Enhanced thermal conductivity of nanofluids: A state-of-the-art review. Microfluid. Nanofluidics 2009, 8, 145–170. [Google Scholar] [CrossRef]
  38. Shima, P.D.; Philip, J.; Raj, B. Influence of aggregation on thermal conductivity in stable and unstable nanofluids. Appl. Phys. Lett. 2010, 97, 153113. [Google Scholar] [CrossRef]
  39. Estellé, P.; Halelfadl, S.; Maré, T. Thermal conductivity of CNT water based nanofluids: Experimental trends and models overview. J. Therm. Eng. 2015, 1, 381. [Google Scholar] [CrossRef]
  40. Talaei, Z.; Mahjoub, A.R.; Rashidi, A.M.; Amrollahi, A.; Meibodi, M.E. The effect of functionalized group concentration on the stability and thermal conductivity of carbon nanotube fluid as heat transfer media. Int. Commun. Heat Mass Transf. 2011, 38, 513–517. [Google Scholar] [CrossRef]
  41. Nanda, J.; Maranville, C.; Bollin, S.C.; Sawall, D.; Ohtani, H.; Remillard, J.T.; Ginder, J.M. Thermal Conductivity of Single-Wall Carbon Nanotube Dispersions: Role of Interfacial Effects. J. Phys. Chem. C 2008, 112, 654–658. [Google Scholar] [CrossRef]
  42. Aravind, S.S.J.; Baskar, P.; Baby, T.T.; Sabareesh, R.K.; Das, S.; Ramaprabhu, S. Investigation of Structural Stability, Dispersion, Viscosity, and Conductive Heat Transfer Properties of Functionalized Carbon Nanotube Based Nanofluids. J. Phys. Chem. C 2011, 115, 16737–16744. [Google Scholar] [CrossRef]
  43. Chen, L.; Xie, H. Surfactant-free nanofluids containing double- and single-walled carbon nanotubes functionalized by a wet-mechanochemical reaction. Thermochim. Acta 2010, 497, 67–71. [Google Scholar] [CrossRef]
  44. Nasiri, A.; Shariaty-Niasar, M.; Rashidi, A.; Khodafarin, R. Effect of CNT structures on thermal conductivity and stability of nanofluid. Int. J. Heat Mass Transf. 2012, 55, 1529–1535. [Google Scholar] [CrossRef]
  45. Brzóska, K.; Jóźwiak, B.; Golba, A.; Dzida, M.; Boncel, S. Thermophysical Properties of Nanofluids Composed of Ethylene Glycol and Long Multi-Walled Carbon Nanotubes. Fluids 2020, 5, 241. [Google Scholar] [CrossRef]
  46. Wang, Y.; Su, F.; Wood, C.D.; Lee, A.J.Y.; Zhao, X.S. Preparation and Characterization of Carbon Nanospheres as Anode Materials in Lithium-Ion Secondary Batteries. Ind. Eng. Chem. Res. 2008, 47, 2294–2300. [Google Scholar] [CrossRef]
  47. Jin, Y.Z.; Gao, C.; Hsu, W.K.; Zhu, Y.; Huczko, A.; Bystrzejewski, M.; Roe, M.; Lee, C.Y.; Acquah, S.; Kroto, H.; et al. Large-scale synthesis and characterization of carbon spheres prepared by direct pyrolysis of hydrocarbons. Carbon 2005, 43, 1944–1953. [Google Scholar] [CrossRef]
  48. Pol, V.G.; Motiei, M.; Gedanken, A.; Calderon-Moreno, J.; Yoshimura, M. Carbon spherules: Synthesis, properties and mechanistic elucidation. Carbon 2004, 42, 111–116. [Google Scholar] [CrossRef]
  49. Serp, P.; Feurer, R.; Kalck, P.; Kihn, Y.; Faria, J.; Figueiredo, J.L. Chemical vapour deposition process for the production of carbon nanospheres. Carbon 2001, 39, 621–626. [Google Scholar] [CrossRef]
  50. Ma, X.; Xu, F.; Chen, L.; Zhang, Y.; Zhang, Z.; Qian, J.; Qian, Y. Easy nickel substrate-assisted growth of uniform carbon microspheres and their spectroscopic properties. Carbon 2006, 44, 2861–2864. [Google Scholar] [CrossRef]
  51. Zhou, Z.; Yan, Q.; Su, F.; Zhao, X.S. Replicating novel carbon nanostructures with 3D macroporous silica template. J. Mater. Chem. 2005, 15, 2569–2574. [Google Scholar] [CrossRef]
  52. Tosheva, L.; Parmentier, J.; Valtchev, V.; Vix-Guterl, C.; Patarin, J. Carbon spheres prepared from zeolite Beta beads. Carbon 2005, 43, 2474–2480. [Google Scholar] [CrossRef]
  53. Kim, B.J.; Chang, J.Y. Preparation of Carbon Nanospheres from Diblock Copolymer Micelles with Cores Containing Curable Acetylenic Groups. Macromolecules 2006, 39, 90–94. [Google Scholar] [CrossRef]
  54. Zhang, X.; Manohar, S.K. Microwave synthesis of nanocarbons from conducting polymers. Chem. Commun. 2006, 2477–2479. [Google Scholar] [CrossRef] [PubMed]
  55. Sun, Y.-P.; Zhou, B.; Lin, Y.; Wang, W.; Fernando, K.A.S.; Pathak, P.; Meziani, M.J.; Harruff, B.A.; Wang, X.; Wang, H.; et al. Quantum-Sized Carbon Dots for Bright and Colorful Photoluminescence. J. Am. Chem. Soc. 2006, 128, 7756–7757. [Google Scholar] [CrossRef] [PubMed]
  56. Cao, L.; Wang, X.; Meziani, M.J.; Lu, F.; Wang, H.; Luo, P.G.; Lin, Y.; Harruff, B.A.; Veca, L.M.; Murray, D.; et al. Carbon Dots for Multiphoton Bioimaging. J. Am. Chem. Soc. 2007, 129, 11318–11319. [Google Scholar] [CrossRef] [Green Version]
  57. Poinern, G.E.J.; Brundavanam, S.; Shah, M.; Laava, I.; Fawcett, D. Photothermal response of CVD synthesized carbon (nano)spheres/aqueous nanofluids for potential application in direct solar absorption collectors: A preliminary investigation. Nanotechnology, Sci. Appl. 2012, 5, 49–59. [Google Scholar] [CrossRef] [PubMed] [Green Version]
  58. Deshmukh, A.A.; Mhlanga, S.D.; Coville, N.J. Carbon spheres. Mater. Sci. Eng. R Rep. 2010, 70, 1–28. [Google Scholar] [CrossRef]
  59. Bakos, L.P.; Justh, N.; Hernádi, K.; Kiss, G.; Réti, B.; Erdélyi, Z.; Parditka, B.; Szilágyi, I.M. Core-shell carbon nanosphere-TiO2 composite and hollow TiO2nanospheres prepared by atomic layer deposition. J. Phys.Conf. Ser. 2016, 764, 012005. [Google Scholar] [CrossRef]
  60. Wang, Y.; Yang, R.; Li, M.; Zhao, Z. Hydrothermal preparation of highly porous carbon spheres from hemp (Cannabis sativa L.) stem hemicellulose for use in energy-related applications. Ind. Crop. Prod. 2015, 65, 216–226. [Google Scholar] [CrossRef]
  61. Juangsa, F.B.; Muroya, Y.; Ryu, M.; Morikawa, J.; Nozaki, T. Comparative study of thermal conductivity in crystalline and amorphous nanocomposite. Appl. Phys. Lett. 2017, 110, 253105. [Google Scholar] [CrossRef]
  62. Mohammad, R.; Kandasamy, R. Nanoparticle shapes on electric and magnetic force in water, ethylene glycol and engine oil based Cu, Al2O3 and SWCNTs. J. Mol. Liq. 2017, 237, 54–64. [Google Scholar] [CrossRef]
  63. Zhang, M.; Yang, H.; Liu, Y.; Sun, X.; Zhang, D.; Xue, D. First identification of primary nanoparticles in the aggregation of HMF. Nanoscale Res. Lett. 2012, 7, 38. [Google Scholar] [CrossRef] [PubMed] [Green Version]
  64. Xue, M.; Zhan, Z.; Zou, M.; Zhang, L.; Zhao, S. Green synthesis of stable and biocompatible fluorescent carbon dots from peanut shells for multicolor living cell imaging. New J. Chem. 2015, 40, 1698–1703. [Google Scholar] [CrossRef]
  65. Kaçan, E.; Kutahyali, C. Adsorption of strontium from aqueous solution using activated carbon produced from textile sewage sludges. J. Anal. Appl. Pyrolys. 2012, 97, 149–157. [Google Scholar] [CrossRef]
  66. Sevilla, M.; Fuertes, A.B. Chemical and Structural Properties of Carbonaceous Products Obtained by Hydrothermal Carbonization of Saccharides. Chem. A Eur. J. 2009, 15, 4195–4203. [Google Scholar] [CrossRef] [PubMed]
  67. De Andrade, R.C.; De Almeida, C.F.; De Siqueira, A.B.; Treu-Filho, O.; Caires, F.J.; De Carvalho, C.T. Thermal and spectroscopic study of the 3,4-(methylenedioxy)cinnamate compounds of transition metals in the solid state. Thermochim. Acta 2014, 596, 56–62. [Google Scholar] [CrossRef]
  68. Kuila, T.; Mishra, A.K.; Khanra, P.; Kim, N.H.; Lee, J.H. Recent advances in the efficient reduction of graphene oxide and its application as energy storage electrode materials. Nanoscale 2013, 5, 52–71. [Google Scholar] [CrossRef]
  69. Varga, M.; Izak, T.; Vretenar, V.; Kozak, H.; Holovsky, J.; Artemenko, A.; Hulman, M.; Skakalova, V.; Lee, D.S.; Kromka, A. Diamond/carbon nanotube composites: Raman, FTIR and XPS spectroscopic studies. Carbon 2017, 111, 54–61. [Google Scholar] [CrossRef]
  70. Mohan, V.B.; Jakisch, L.; Jayaraman, K.; Bhattacharyya, D. Role of chemical functional groups on thermal and electrical properties of various graphene oxide derivatives: A comparative x-ray photoelectron spectroscopy analysis. Mater. Res. Express 2018, 5, 035604. [Google Scholar] [CrossRef]
  71. Afrand, M.; Toghraie, D.; Ruhani, B. Effects of temperature and nanoparticles concentration on rheological behavior of Fe3O4 –Ag/EG hybrid nanofluid: An experimental study. Exp. Therm. Fluid Sci. 2016, 77, 38–44. [Google Scholar] [CrossRef]
  72. Nguyen, C.; Desgranges, F.; Roy, G.; Galanis, N.; Maré, T.; Boucher, S.; Mintsa, H.A. Temperature and particle-size dependent viscosity data for water-based nanofluids—Hysteresis phenomenon. Int. J. Heat Fluid Flow 2007, 28, 1492–1506. [Google Scholar] [CrossRef]
  73. Wang, J.; Li, G.; Li, T.; Zeng, M.; Sundén, B. Effect of various surfactants on stability and thermophysical properties of nanofluids. J. Therm. Anal. Calorim. 2020, 1–14. [Google Scholar] [CrossRef] [Green Version]
  74. Hatschek, E. The general theory of viscosity of two-phase systems. Trans. Faraday Soc. 1913, 9, 80–92. [Google Scholar] [CrossRef] [Green Version]
  75. Pak, B.C.; Cho, Y.I. Hydrodynamic and heat transfer study of dispersed fluids with submicron metallic oxide particles. Exp. Heat Transf. 1998, 11, 151–170. [Google Scholar] [CrossRef]
  76. Maxwell, J.C.A. A Treatise on Electricity and Magnetism. Nature 1873, 7, 478–480. [Google Scholar] [CrossRef]
  77. Azmi, W.H.; Sharma, K.V.; Mamat, R.; Alias, A.B.S.; Misnon, I.I. Correlations for thermal conductivity and viscosity of water based nanofluids. IOP Conf. Ser. Mater. Sci. Eng. 2012, 36. [Google Scholar] [CrossRef] [Green Version]
Figure 1. XRD pattern of (a) carbon nanosphere (CNS) and (b) carbon nanopowder (CNP) at the following XRD conditions: X-Ray: 40 kV, 30 mA. Scan speed: 3.0 degree/min.
Nanomaterials 11 00608 g001
Figure 2. SEM images of (a,b) CNS and (c,d) CNP with magnification ×20,000 and ×100,000.
Nanomaterials 11 00608 g002
Figure 3. FT-IR spectrum of (a) CNS and (b) CNP dry particles.
Nanomaterials 11 00608 g003
Figure 4. Thermal analysis curve for (a) CNS and (b) CNP with a heating rate of 10 °C/min in airflow.
Nanomaterials 11 00608 g004
Figure 5. XPS analysis for (a) CNP and (b) CNS with 40 eV pass energy and 0.3 s dwell time.
Nanomaterials 11 00608 g005
Figure 6. C 1s XPS spectrum of (a) CNP and (b) CNS.
Nanomaterials 11 00608 g006
Figure 7. Maximum absorbance—time diagram of (a) CNS and (b) CNP nanofluids for different concentrations.
Nanomaterials 11 00608 g007
Figure 8. Shear stress—shear rates diagram of (a) CNS and (b) CNP nanofluids for 0.5 vol% at different temperatures.
Nanomaterials 11 00608 g008
Figure 9. Relative viscosity–temperature diagram of (a) CNS and (b) CNP nanofluids for different concentration at different temperatures.
Nanomaterials 11 00608 g009
Figure 10. Relative viscosity comparison between the present study and the result of Hatscheck et al. [74] and Wang et al. [8] at 20 °C and different concentrations.
Nanomaterials 11 00608 g010
Figure 11. k of (a) CNS and (b) CNP nanofluids with different concentrations at different temperatures.
Nanomaterials 11 00608 g011
Figure 12. k enhancement of (a) CNS and (b) CNP nanofluids with different concentrations at different temperatures.
Nanomaterials 11 00608 g012
Figure 13. k enhancement comparison between the present study and the result of Maxwell et al. [76] and Pak et al. [75].
Nanomaterials 11 00608 g013
Figure 14. Comparison between (a) k and (b) µ obtained from experiment and proposed correlation.
Nanomaterials 11 00608 g014
Table 1. SBET, XPS and EDX results of CNS and CNP dry particles.
NanoparticlesSBETAtomic Percent (XPS)Atomic Percent (EDX)
(m2/g)COCO
CNS976.923.181.418.6
CNP 10690.79.391.68.4
Table 2. Concentration of chemical bonds on the surface of CNS and CNP from XPS.
NanoparticlesC 1s (%)O 1s (%)
sp3sp2C–OC=OO–C=OC=OO–H
CNP72.112.35.54.06.135.464.6
CNS 69.312.615.03.18.291.8
Publisher’s Note: MDPI stays neutral with regard to jurisdictional claims in published maps and institutional affiliations.

