Article

Surface Properties of 1DTiO2 Microrods Modified with Copper (Cu) and Nanocavities

1
Institute of Inorganic Chemistry of the Czech Academy of Sciences, 250 68 Rez, Czech Republic
2
Faculty of Mechanical Engineering, JE Purkyně University, Pasteurova 1, 400 96 Ústí nad Labem, Czech Republic
3
Institute of Chemical Process Fundamentals of the Czech Academy of Sciences, Rozvojova 1/135, 165 02 Prague, Czech Republic
4
Institute of Physics of the Czech Academy of Sciences, Na Slovance 1999/2, 182 21 Prague, Czech Republic
5
Institute of Mineralogy and Crystallography, Bulgarian Academy of Sciences, Acad. Bonchev 107, 1113 Sofia, Bulgaria
*
Author to whom correspondence should be addressed.
Nanomaterials 2021, 11(2), 324; https://doi.org/10.3390/nano11020324
Submission received: 16 December 2020 / Revised: 13 January 2021 / Accepted: 14 January 2021 / Published: 27 January 2021

Abstract

:
This work deals with Cu-modified 1DTiO2 microrods (MRs) and their surface properties. The pristine lyophilized precursor Cu_1DTiO2, prepared by an environmentally friendly cryo-lyophilization method, was further annealed in the temperature interval from 500 to 950 °C. The microstructure of all samples was characterized by electron microscopy (SEM/EDS and HRTEM/SAED), X-ray powder diffraction (XRD), infrared spectroscopy, simultaneous DTA/TGA thermoanalytical measurement, and mass spectroscopy (MS). Special attention was paid to the surface structure and porosity. The 1D morphology of all annealed samples was preserved, but their surface roughness varied due to anatase-rutile phase transformation and the change of the nanocrystals habits due to nanocavities formation after releasing of confined ice-water. The introduction of 2 wt.% Cu as electronically active second species significantly reduced the direct bandgap of 1DTiO2 in comparison with undoped TiO2 and the standard Degussa TiO2_P25. All samples were tested for their UV absorption properties and H2 generation by PEC water splitting. We presented a detailed study on the surface characteristics of Cu doped 1DTiO2 MRs due to gain a better idea of their photocatalytic activity.

Graphical Abstract

1. Introduction

During the past decades, considerable effort has been put into the design and preparation of nanomaterials exhibiting unique physicochemical properties. The main objective of nanoscience is to discover new materials with completely different characteristics at the nanoscale level [1]. The development of new photocatalytic materials with improved stability, low cost, and high photocatalytic activity under solar light are one of the current challenges for photo-electrochemical (PEC) water splitting. Titania, in particular the anatase phase, has been used in PEC [2] very dynamically [3]. It is well established that one-dimensional 1DTiO2 (nanorods [4], nanotubes [5], and nanowires [6]) has significant potential in environmental application because of its stability, high specific surface area, and suitable porous structure. However, the large bandgap of TiO2 (3.2 eV for anatase), is the main obstacle to obtain highly efficient photocatalysts. The bandgap has a direct impact on the rate of electron-hole (e/h+) recombination. Therefore, a huge number of researchers investigate how to narrow the bandgap of TiO2 to maximize the utilization of solar energy and to increase the (e/h+) pair recombination lifetime, which is a key factor for any TiO2-based photocatalyst. One very attractive approach is doping of TiO2 with transition metals such as the very low-cost copper (Cu). Cu was previously investigated in this context, including doping of the standard Degussa TiO2-P25 [7]. The effect of Cu doping in titania and its importance for photocatalysis has recently been highlighted in several reports [8,9,10,11,12,13,14]. Nevertheless, the results concerning the photocatalytic properties of Cu-doped TiO2 nanomaterials are very controversial and this is due to the different methods of preparation used of the materials. Byrne et al. [15] and Obregon et al. [16] indicating the negligible photocatalytic activity of Cu-doped TiO2, despite the prevailing anatase phase in samples, arises from the charge recombination at surface lattice defects. Likewise, the recent study of Bensouici et al. has shown the forming of CuO in Cu-doped TiO2 thin films decreases its photocatalytic efficiency [17]. Moreover, Wang et al. found that Cu-doped TiO2 thin films obtained by RF magnetron sputtering could be used for H2 production by water splitting [18]. Also, the incorporation of 0.5 M% of copper ions into the TiO2 structure seems to enhance the photoactivity of the system when acidic conditions occur. A possible explanation of this photocatalytic improvement might be related to the stabilization of Cu2O species and oxygen vacancies generated in doped TiO2 during the preparation procedure using sulfuric acid [9].
Among existing reports, there are no studies on the impact of Cu dopant on the TiO2 with 1D morphology. Although many studies focused on the influence of Cu on TiO2 microstructure-grain size evolution, specific surface area, and anatase to rutile transformation, scarce experimental research has been carried out in the field of PEC water splitting by Cu-doped 1DTiO2 materials.
The Cu2+ ionic radius (0.730 Å) is close to the Ti4+ radius (0.605 Å) therefore, the dispersion of Cu2+ into TiO2 crystal lattice is naturally expected by substitutional incorporation of the Ti4+ [19]. This substitution with aliovalent Cu2+ ion is expected to contribute to the formation of impurity levels, as well as to modify the electronic density of states inside the bandgap of pristine TiO2 structure [3].
To the best of the authors’ knowledge, there is no previously published work presenting Cu-doped TiO2 microrods (MRs) obtained by annealing of lyophilized 1DTiO2 precursor, and their application for H2 generation by PEC water splitting. This work presents a complete study of the influence of Cu dopant on the TiO2 MRs phase transition from the metastable anatase phase to the stable rutile phase. The characterization of as-prepared materials was carried out using X-ray powder diffraction, Raman, and FTIR spectroscopy, BET/BJH surface analysis. HRTEM microscopy was applied to analyze Cu-doped TiO2 MRs grain size evolution at different annealing temperatures. Optical properties and direct bandgap energy (Eg) measurements were performed using UV-vis spectroscopy. The PEC water splitting and hydrogen evolution were performed in the PEC cell composed of three compartments (for working, counter, and standard saturated Ag/AgCl electrodes).

2. Materials and Methods

2.1. Materials

Titanium (IV) oxysulfate (titanyl sulfate, TiOSO4, Sigma-Aldrich spol. s.r.o., Prague, Czech Republic) was used as a TiO2 precursor. Cu(NO3)2.3H2O assay spec. 99%, served as the Cu dopant source. During material synthesis, an aqueous solution of ammonia (NH3, hydroxide, purum p.a., 25–29% solution, Fisher Scientific, spol. s.r.o., Pardubice Czech Republic) was used for precipitation of the precursor. AEROXIDE TiO2-P25 (Evonik, Prague, Czech Republic) were used for the PEC experiments.

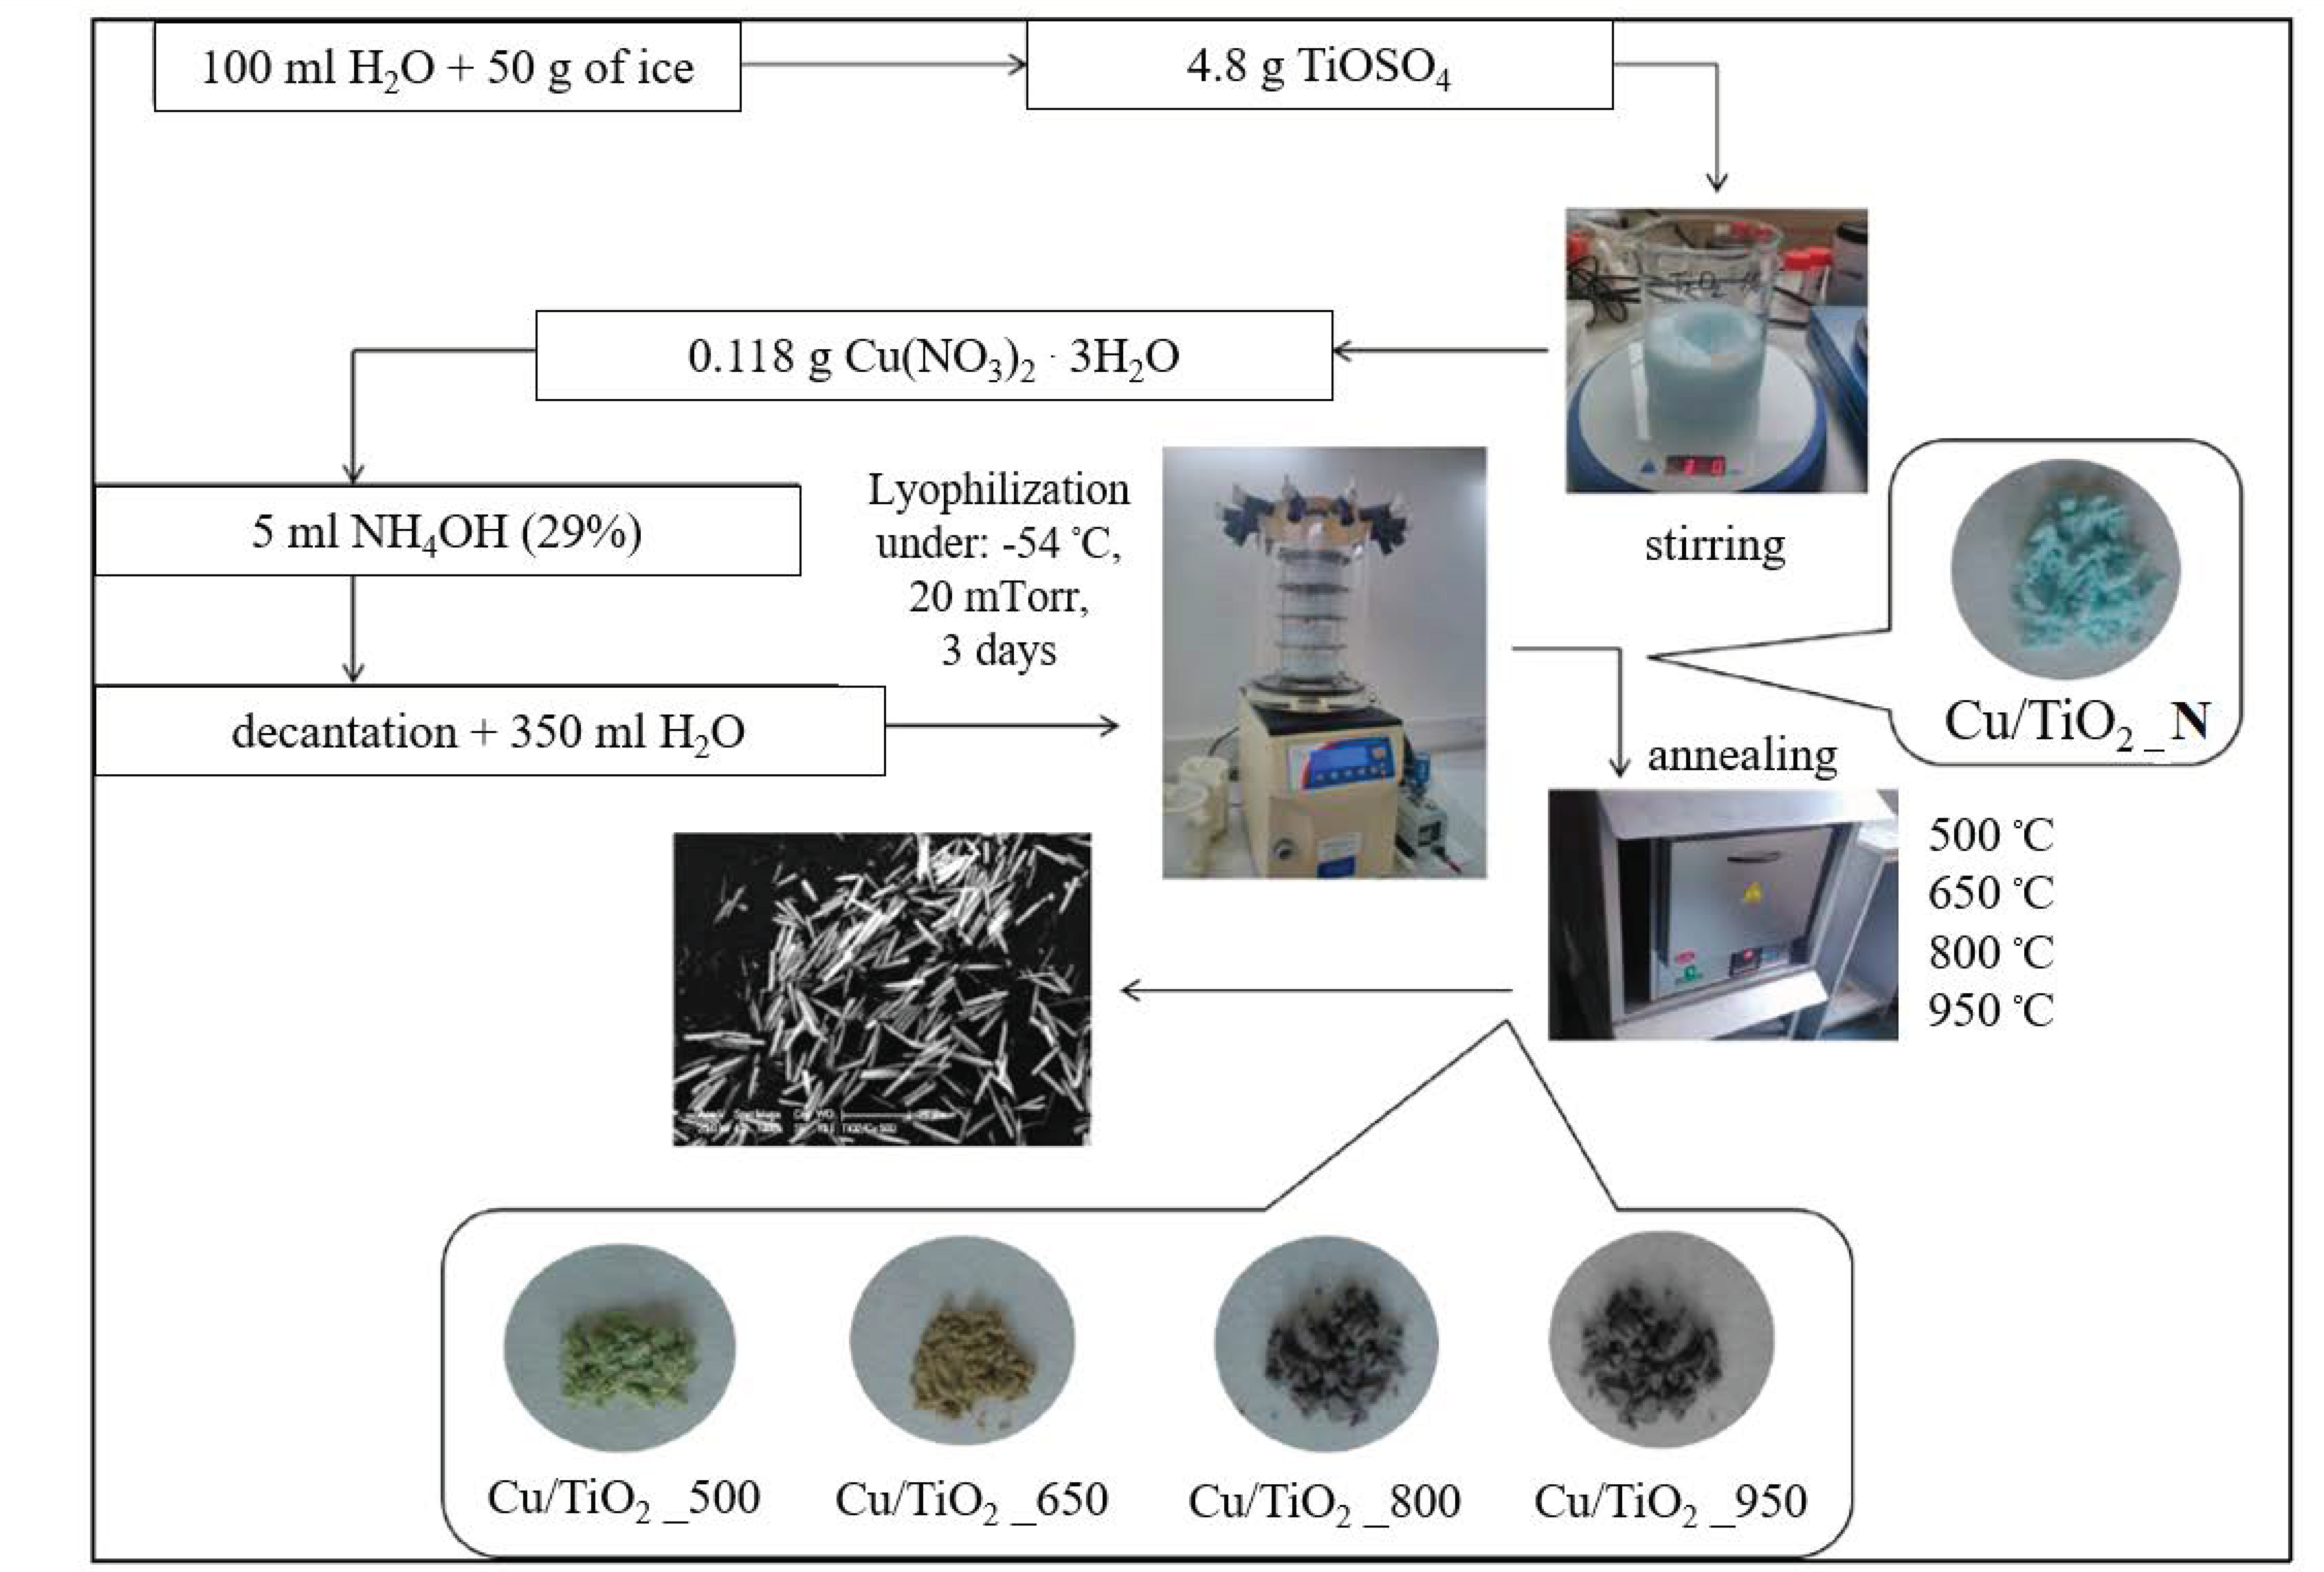
2.2. Synthesis of Cu-Doped 1D TiO2 MRs

The Cu doped 1DTiO2 MRs were prepared via a green freeze-casting method, known as lyophilization (see Scheme 1) [20]. In a typical experiment a mixture of 100 mL of deionized water and 50 mL of crushed ice was prepared in a 350 mL laboratory beaker (step 1). Immediately afterward, 4.8 g of hydrated titanyl sulfate TiOSO4 was added to the as-obtained mixture (step 2), and after continuously stirring, 0.118 g of Cu(NO3)2·3H2O was used to yield a calculated value of 2 wt.% of copper to give a blue-colored solution (step 3). Subsequently, the precipitation was carried out at ∼0 °C in aqueous ammonia until the pH reached 8. The precipitate as obtained was transferred into a beaker and resuspended into 350 mL of distilled water. The resulting precursor was immediately lyophilized (freeze-dried) (step 6) at 20 mTorr, at (−54) °C for 72 h by using VirTis Benchtop K lyophilizer, Core Palmer UK, Ipswich, UK). Lyophilized product was isolated in the last step 7. Visualization with SEM microscopy confirmed that the lyophilized precursor labeled Cu/TiO2_N (Non-annealed) has well-defined 1D MRs morphology. The lyophilized precursor Cu/TiO2_N was further heat-treated under air at 500, 650, 800, and 950 °C for 1 h in each case (with rate 3 °C min−1), and four new samples denoted as Cu/TiO2_500, Cu/TiO2_650, Cu/TiO2_800 and Cu/TiO2_950 were obtained (Scheme 1).

2.3. Methods of Characterization

Prepared materials were characterized by X-ray powder diffraction (XRD), scanning electron microscopy (SEM), transmission electron microscopy (TEM), specific surface area (BET) and porosity (BJH) measurement, thermal analysis (TG/DTA), Fourier transform infrared (FTIR), Raman spectroscopy, UV-Vis spectroscopy and PEC experiments (H2 generation by PEC water splitting). The whole set of instrumental characterization is described in our previous publication as you can see in [20,21,22,23,24,25].
Morphology and elemental analysis were investigated using FERA 3 (Tescan, Warrendate, PA, USA) and JSM-6510 LV (JEOL, Peabody, MA, USA) scanning electron microscopes equipped with an energy dispersive X-ray (EDX) detector (Oxford, UK). The measurements were carried out in a low vacuum mode (with a secondary electron detector) at an accelerating voltage of 30 kV. Powdered samples were placed on carbon tape and SEM images were observed without any coating to study their original texture.
Transmission electron microscopy (TEM) was carried out on a JEOL JEM 3010 microscope operated at 300 kV (LaB6 cathode, point resolution 1.7 Å) and equipped with an EDS spectrometer. The images were recorded on a CCD camera (Gatan, Pleasanton, CA, USA) with a resolution of 1024 × 1024 pixels. Digital Micrograph and INCA software packages were used for structural and chemical analyses, respectively. Electron diffraction patterns were evaluated using the Process Diffraction program [26].
Room temperature diffraction (XRD) patterns were collected using an X’pert PRO diffractometer (PANalytical, Cambridge, UK) equipped with a conventional X-ray tube (Cu 40 kV, 30 mA, line focus) in transmission mode. An elliptic focusing mirror, a divergence slit 0.5°, a 0.5° anti-scatter slit, and a Soller slit of 0.02 rad were used in the primary beam. A PIXcel (Cambridge, UK) fast-linear position-sensitive detector with an anti-scatter shield and a Soller slit of 0.02 rad was used in the diffracted beam. All patterns were collected in the range of 10 to 80° 2 θ with the step of 0.013° and 400 s per step producing a scan of about 2.4 h. Samples were grounded in an agate mortar in a suspension with cyclohexane. The suspension was then placed on top of a Mylar foil to a transmission sample holder. After solvent evaporation, a thin layer of the prepared sample was then covered with the second Mylar foil. Qualitative analysis was performed with the HighScorePlus software package (PANalytical, version 4.8.0), DiffracPlus software package (Bruker AXS, Karlsruhe, Germany, version 8.0), and the JCPDS PDF-4 database. International Centre for Diffraction Data (JCPDS PDF-4 Database, release 2019/1 ed; ICDD: Newtown Square, PA, USA, 2019). For quantitative phase analysis, we used DiffracPlus Topas (Bruker AXS, version 4.2) with structural models based on the ICSD database (Fiz Karlsruhe–Leibniz Institute for Information Infrastructure. ICSD Database; FIZ Karlsruhe GmbH: Eggenstein-Leopoldshafen, Karlsruhe, Germany, 2019). This program allows the estimation of the weight fractions of crystalline phases through the Rietveld refinement procedure. The estimation of the size of crystallites was performed based on the Scherrer formula as implemented within the DiffracPlus Topas software.
Thermal analysis (TA/MS) measurements were performed on a SetSys Evolution system (Setaram, Prague, Cyech Republic) coupled with a QMG 700 SuperSonic quadrupole mass spectrometer (Pfeiffer, by Setaram) system. Decomposition of prepared samples was performed in an open alumina crucible in argon (60 mL min–1), and the sample mass was approximately 10 mg. The used temperature range was 30–1100 °C with a heating rate of 5 °C min–1. Gaseous products were measured as the intensity of individually selected fragments, with the m/z (mass-to-charge ratios) at 16, 17, 18, 28, 30, 32, 44, 46, and 64. FTIR spectra were measured on a Nexus 670 FTIR spectrometer (Thermo Nicolet, Brno, Czech Republic) in the region 4000–400 cm–1 at a resolution of 4 cm–1 using KBr pellets. Raman spectra were acquired with an XDR AIY 0900237 Raman microscope (Thermo Scientific, Brno, Czech Republic), 256 two-second scans were accumulated with a laser at 532 nm (0.1 mW or 0.5 mW), 25 μm slit under a 10× objective of a microscope (Olympus, Prague, Czech Republic) in full range with the distinction of 4 cm–1. Diffuse reflectance UV-Vis spectra were recorded in the diffuse reflectance mode (R) and transformed to a magnitude proportional to the extinction coefficient (K) through the Kubelka–Munk function, F() [27]. A Lambda 35 spectrometer (PerkinElmer, Waltham, MA, USA) equipped with an RSA-PE-20 integration sphere (Labsphere, North Sutton, NH, USA) using BaSO4 as a standard was used. The band-gap energy Ebg was calculated by the extrapolation of the linear part of equation λbg = 1240/Ebg (eV) [28,29].

2.4. Photoelectrochemical Experiments

The water splitting and hydrogen evolution were performed in a photoelectrochemical cell composed of three compartments (for working, counter, and standard saturated Ag/AgCl electrodes) filled with an electrolyte and separated by semi-permeable membranes made of sintered glass. Sulfuric acid (H2SO4, 0.5 M in distilled water) was used as the electrolyte. As a source of the incident light, the 100W solar simulator (LCS-100, Oriel, Edmonton, AB, USA) was used. The incident power of the light was measured using a light meter (DT-8809A, CEM, Prague, Czech Republic) and the intensity was 710.103 lux, which is equal to 0,104W/cm2 at 555 nm. The electrochemical response of layers on incident light during cyclic voltammetry was studied by a potentiostat (2450 SourceMeter, Keithley, Houten, The Netherlands). The aperture between the light source and the electrodes allowed light/dark operation. The material studied was deposited on a fluorine-doped tin oxide-coated glass (FTO-glass) electrode with a working area of about 3 cm2. The samples were deposited from an ultrasound dispersed powder material (0.01 g) in 50 mL distilled water onto the electrode (12 mm × 42 mm), immersed in the dispersion overnight. Subsequently, the sample was annealed for 1 h in the air at a temperature of 500 °C. Cyclic voltammetry (CV) data was measured by applying a potential between −0.7 and 0.7 V on the working electrode against a standard saturated Ag/AgCl electrode with a constant scanning speed of 25 mV/s. Four cycles were monitored to evaluate the stability of the photoperiods, reproducibility, and stability of deposited layers [21]. The measurements were repeated three times to evaluate the stability of the studied layers.

3. Results and Discussion

This section presents the results obtained during the characterization of the Cu/TiO2_N and Cu/TiO2_500, Cu/TiO2_650, Cu/TiO2_800, and Cu/TiO2_950 materials and their interpretation.

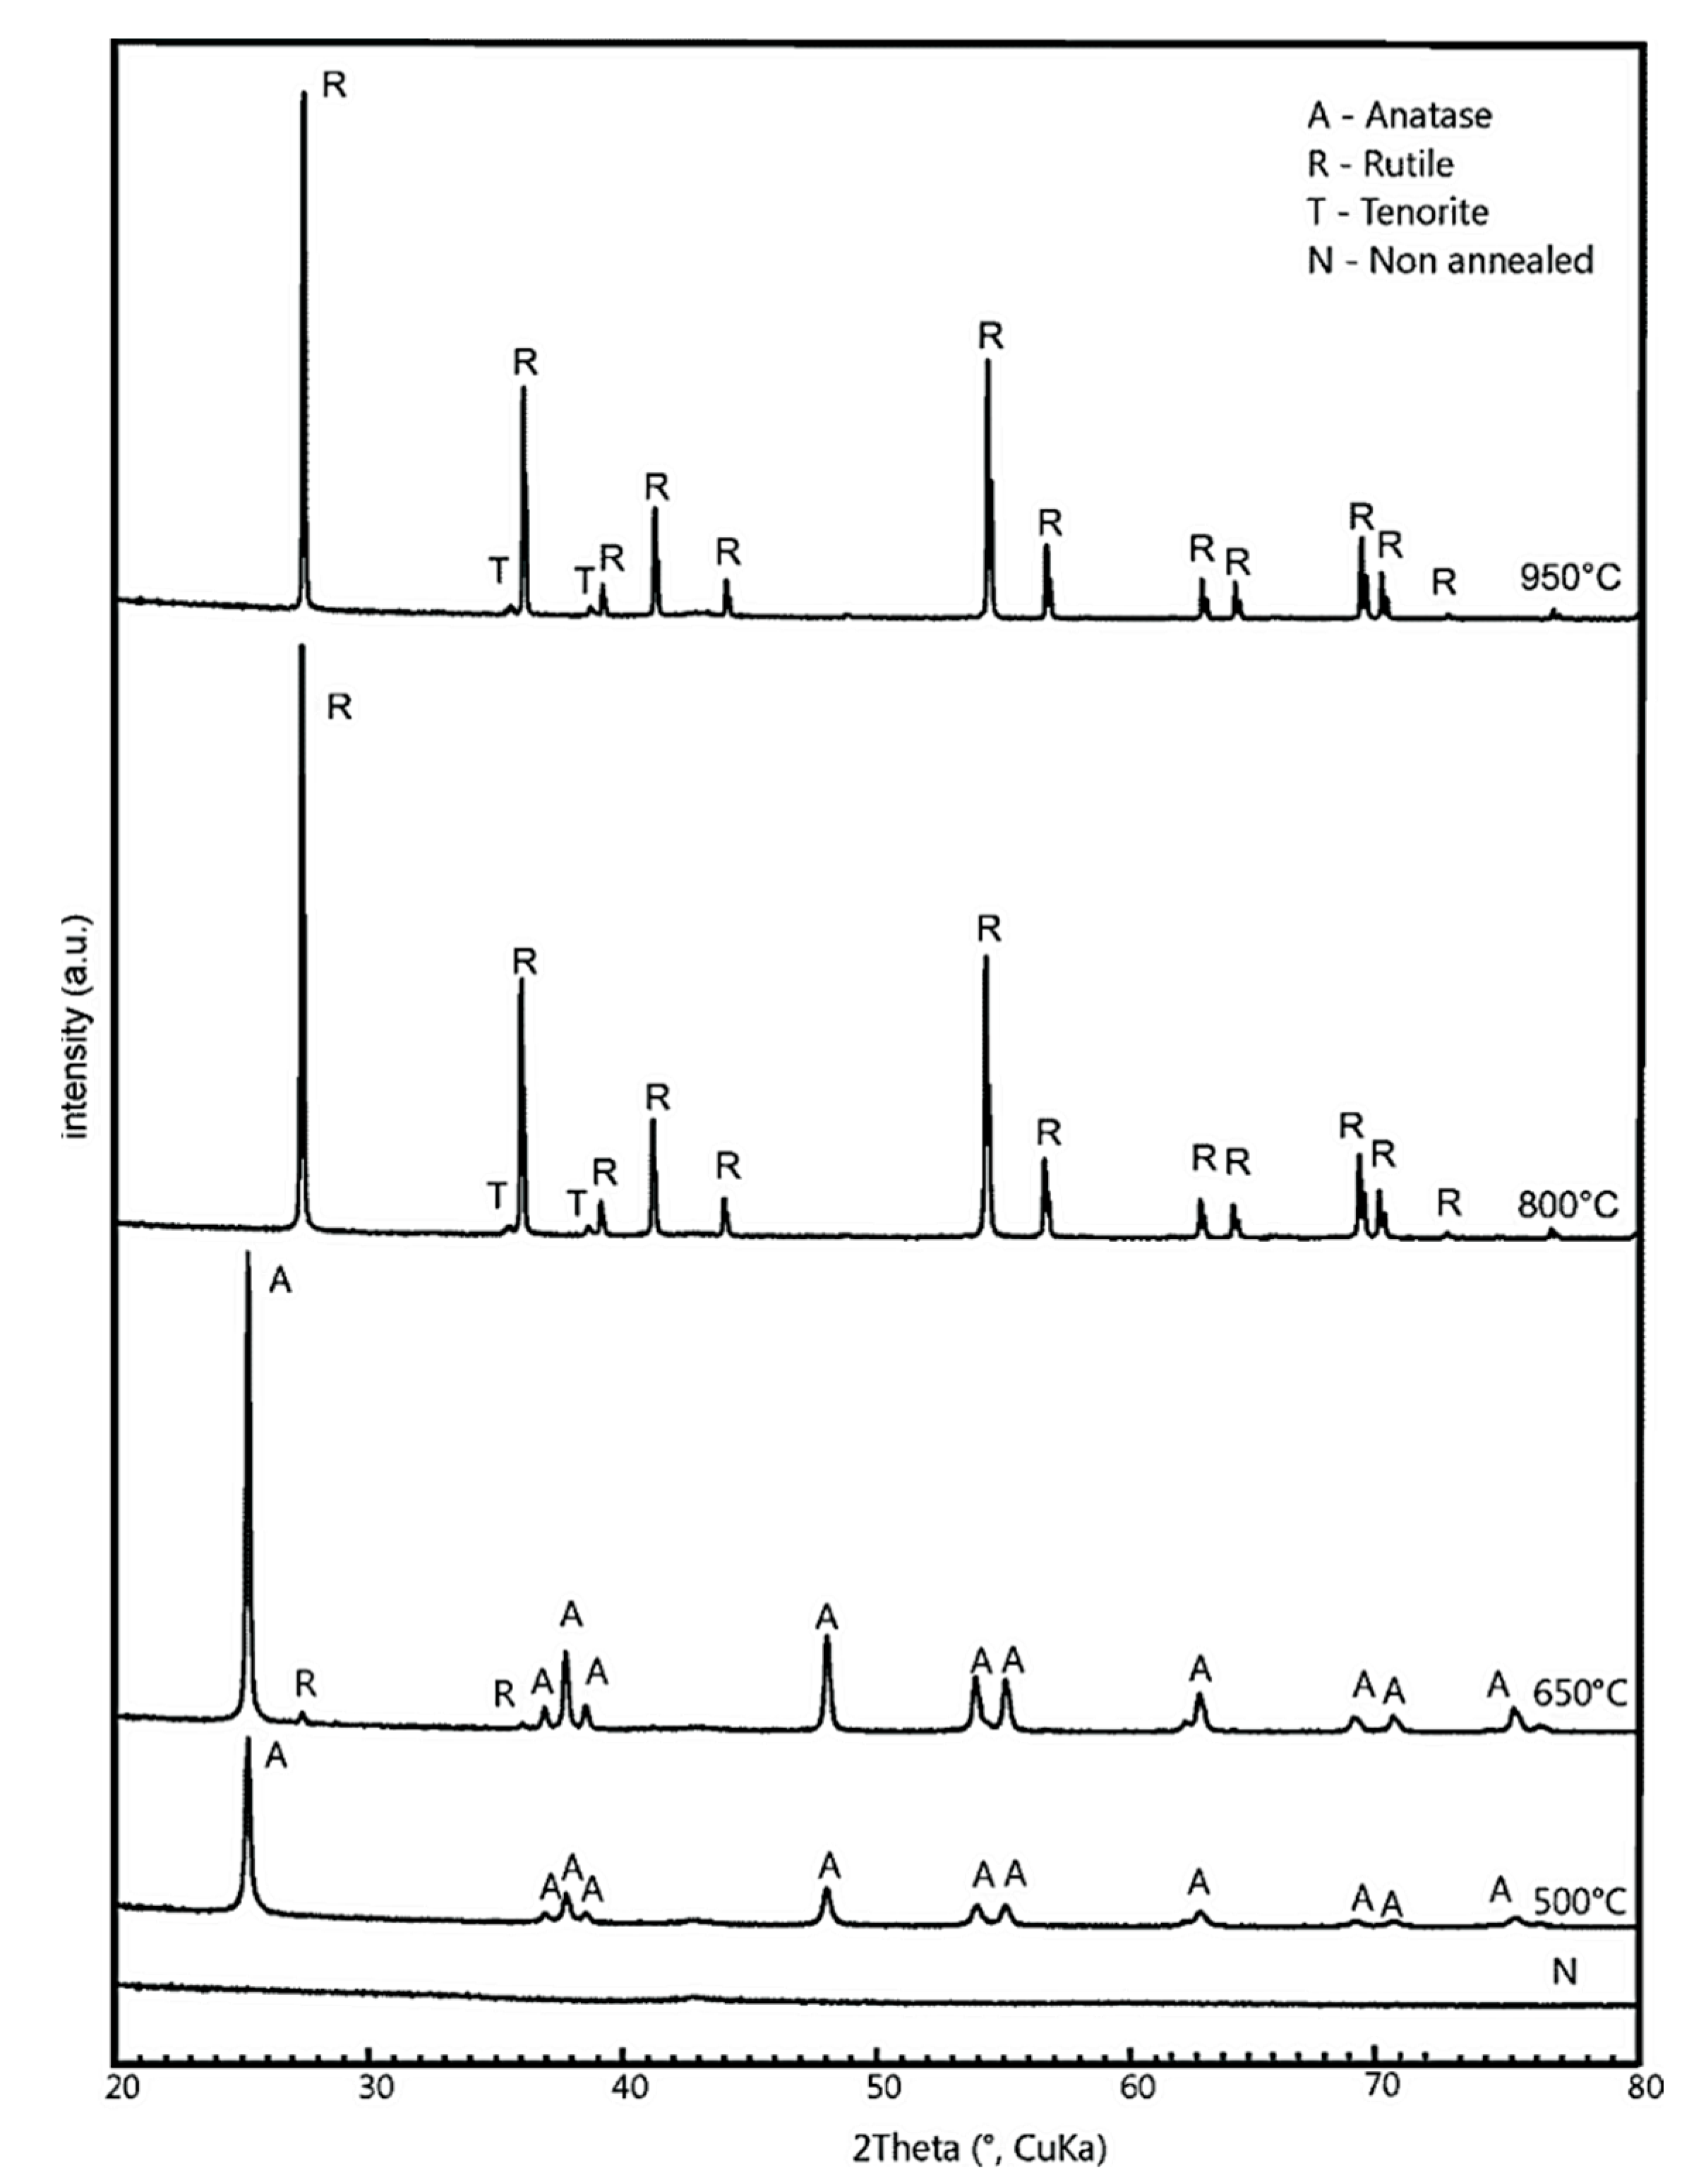
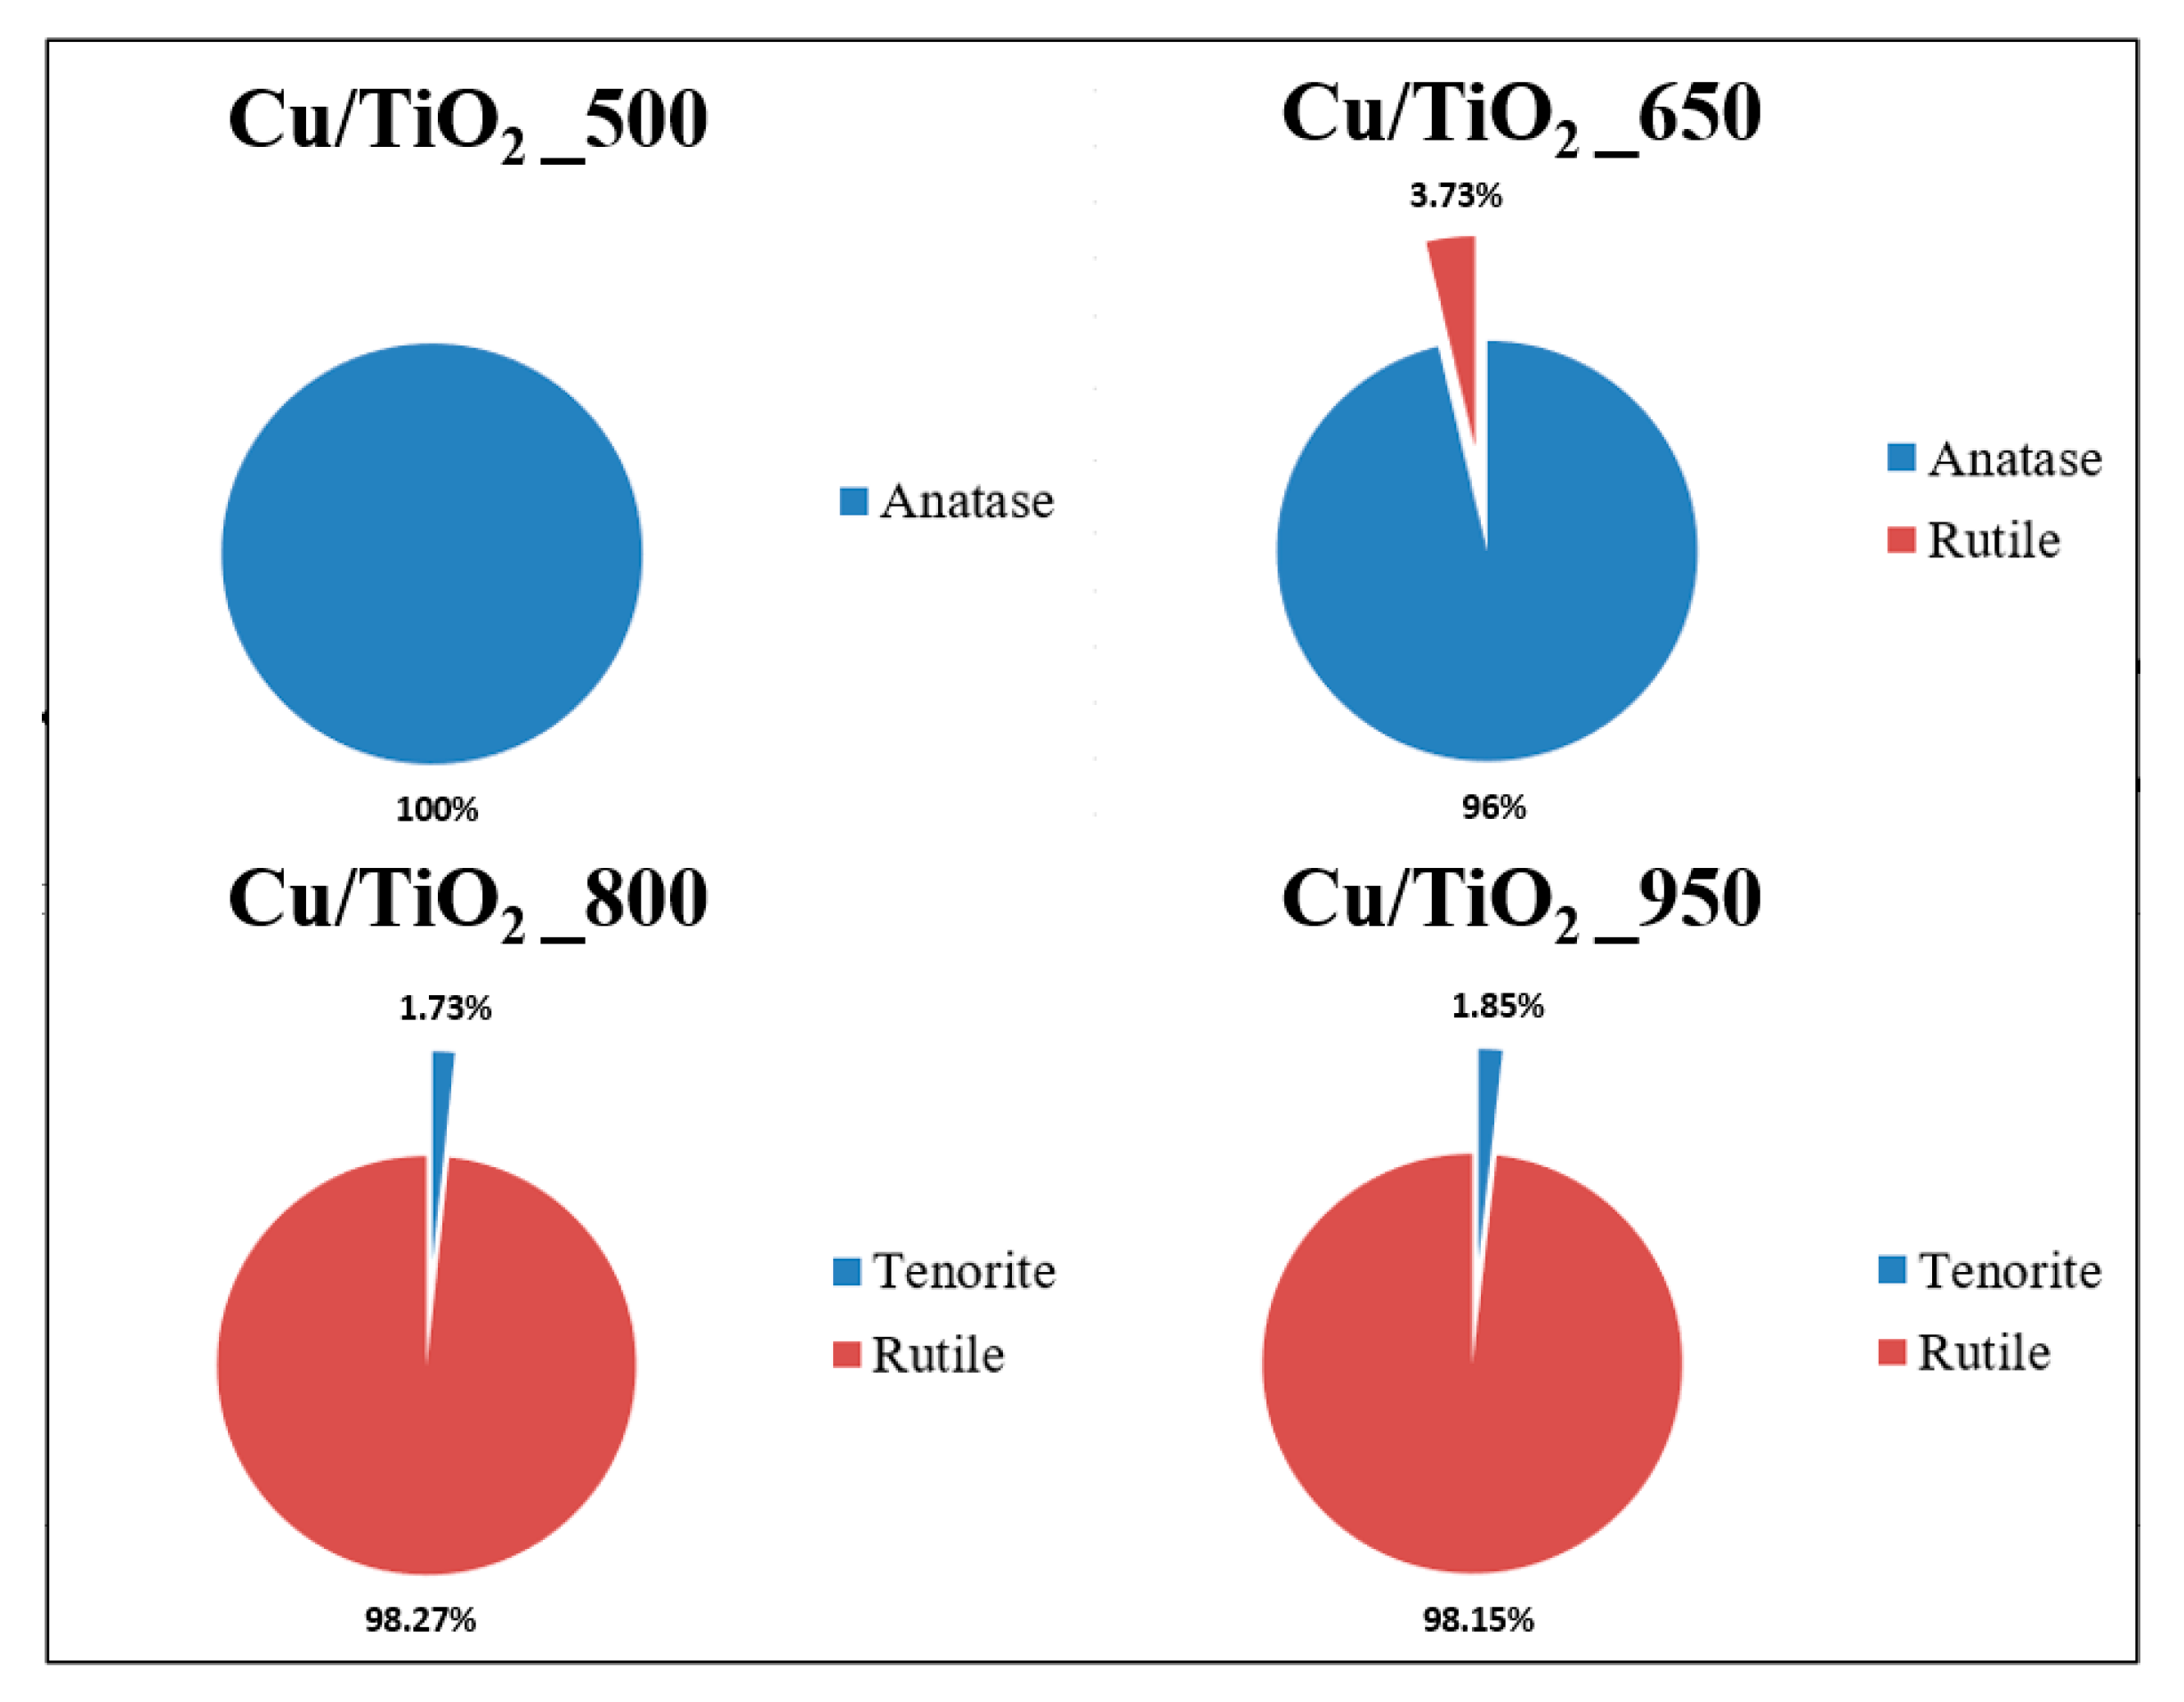
3.1. X-ray Diffraction (XRD) Characterization

XRD patterns of Cu/TiO2_N and post-annealed materials (Cu/TiO2_500, Cu/TiO2_650, Cu/TiO2_800, and Cu/TiO2_950) are shown in Figure 1. Analysis of lyophilized precursor Cu/TiO2_N confirmed non-crystalline, completely amorphous material. Sample Cu/TiO2_500 (Figure 1) shown a diffraction pattern consistent with a single phase of TiO2 that can be assigned to tetragonal anatase (JCPDS database PDF file 21-1272), indicating that the crystal structure was not changed after Cu doping. When annealed at 650 °C. Rutile polymorph of TiO2 (3.7 wt.%) began to appear (JCPDS database PDF 21-1276) (Figure 1 and Figure 2). No diffraction lines of any copper-containing phases were observed in the samples Cu/TiO2_500 and Cu/TiO2_650 implying that Cu2+ can preferentially substitute Ti4+ in the anatase phase before the transition to rutile. A complete transformation of anatase to rutile is achieved at 800 °C (Figure 1). Sample Cu/TiO2_800 is a mixture of 98.3% rutile and 1.7% CuO (Figure 2). The transformation from thermodynamically metastable anatase to stable rutile is accompanied by segregation of monoclinic copper (II) oxide CuO, known as tenorite (JCPDS database PDF 48-1548). At this temperature, the Cu2+ starts to escape from the anatase lattice. Annealing at the highest temperature of 950 °C causes the CuO to grow rapidly, and the amount of CuO increases at the expense of rutile (Figure 1). The percentage estimation (wt.% of phases) of any individual phase in each stage of annealing temperature, based on the Rietveld refinement, is shown in Figure 2.
The phase composition, lattice parameters, and crystal sizes obtained by Rietveld refinement are given in Table 1. The changes in lattice parameters as a function of temperature shown that in samples Cu/TiO2_500 and Cu/TiO2_650, the lattice parameter a decreases, and the parameter c increases with the increasing temperature. The increase of c axis lattice parameter with metal ions doping (Mo and Sc) in anatase NCs has already been reported in our recent works [22,23,24,25]. This further supports the substitutional incorporation of Cu2+ ions into the anatase lattice. Also, the ionic radii of Cu2+ ions are higher than that of Ti4+ (RCu2+ = 0.730 nm vs. RTi4+ = 0.605 nm) and such changes of lattice parameters and lattice volume are expected [30]. We should recall, that beyond 650 °C, the anatase starts to transform to rutile, and lattice parameters in samples Cu/TiO2_800 and Cu/TiO2_950 are estimated for rutile. It is observed that in both samples, parameter a is almost invariant with temperature, whereas the parameter c slightly decreases. The Cu doping progressively reduces the concentration of Ti in the Cu/TiO2_800 and Cu/TiO2_950 samples. Also, a change of the cation distribution could be expected since the arising of the tenorite phase.
The average crystallite size of Cu/TiO2_500, Cu/TiO2_650, Cu/TiO2_800, and Cu/TiO2_950 samples has been estimated from the XRD data using Scherrer’s formula [31]. The values presented in Table 1, indicated that the grain growth of anatase and rutile varies exponentially with annealing temperature. Once formed at 650 °C, the rutile NPs grew very rapidly and coarsening up to 157 nm at 950 °C (sample Cu/TiO2_950) [32]. At this temperature, an energetically stable TiO2 polymorph is formed. We believed that substitutional Cu2+ doping plays an important role in anatase to rutile phase transformation and NPs growth. Here, the transformation has occurred at a higher temperature than that reported in the literature (400 °C for undoped anatase [33].

3.2. Effect of Cu and Temperature on Surface Area (BET) and Porosity (BJH)

The BET/BJH analysis was performed to examine the surface area and porosity of Cu/TiO2_500, Cu/TiO2_650, Cu/TiO2_800, and Cu/TiO2_950 samples. Table 1 shows that increasing temperature led to a decrease in the surface area due to NPs growth. Sample Cu/TiO2_500 with 100% anatase structure and smaller NP size shown the highest surface area, followed by sample Cu/TiO2_650 (96.3% anatase and 3.76% rutile). During annealing at 800 and 950 °C, both samples Cu/TiO2_800 and Cu/TiO2_950 with almost pure rutile structure (Figure 2), showing a tendency for decreasing the specific surface area. An increasing the degree of agglomeration by the effect of coarsening occurring in these materials. The specific surface area of sample Cu/TiO2_950 decreases to 2.7061 m2g−1 suggested by the largest size of rutile NPs and their faster growth compared to anatase. According to the IUPAC nomenclature, materials with a pore size of 2–50 nm, are referring to the mesoporous compounds. Therefore, annealing of lyophilized Cu/TiO2_N precursor has led to the formation of mesoporous Cu/TiO2_500, Cu/TiO2_650, Cu/TiO2_800, and Cu/TiO2_950 materials. While surface area decreases, the pore radius of Cu/TiO2_500, Cu/TiO2_650, Cu/TiO2_800, and Cu/TiO2_950 samples increase probably due to elimination of chemically bonded water during annealing up to 950 °C (see Table 1). These results are supported by TA/MS analysis presented in the Supplementary Materials (Figure S1).

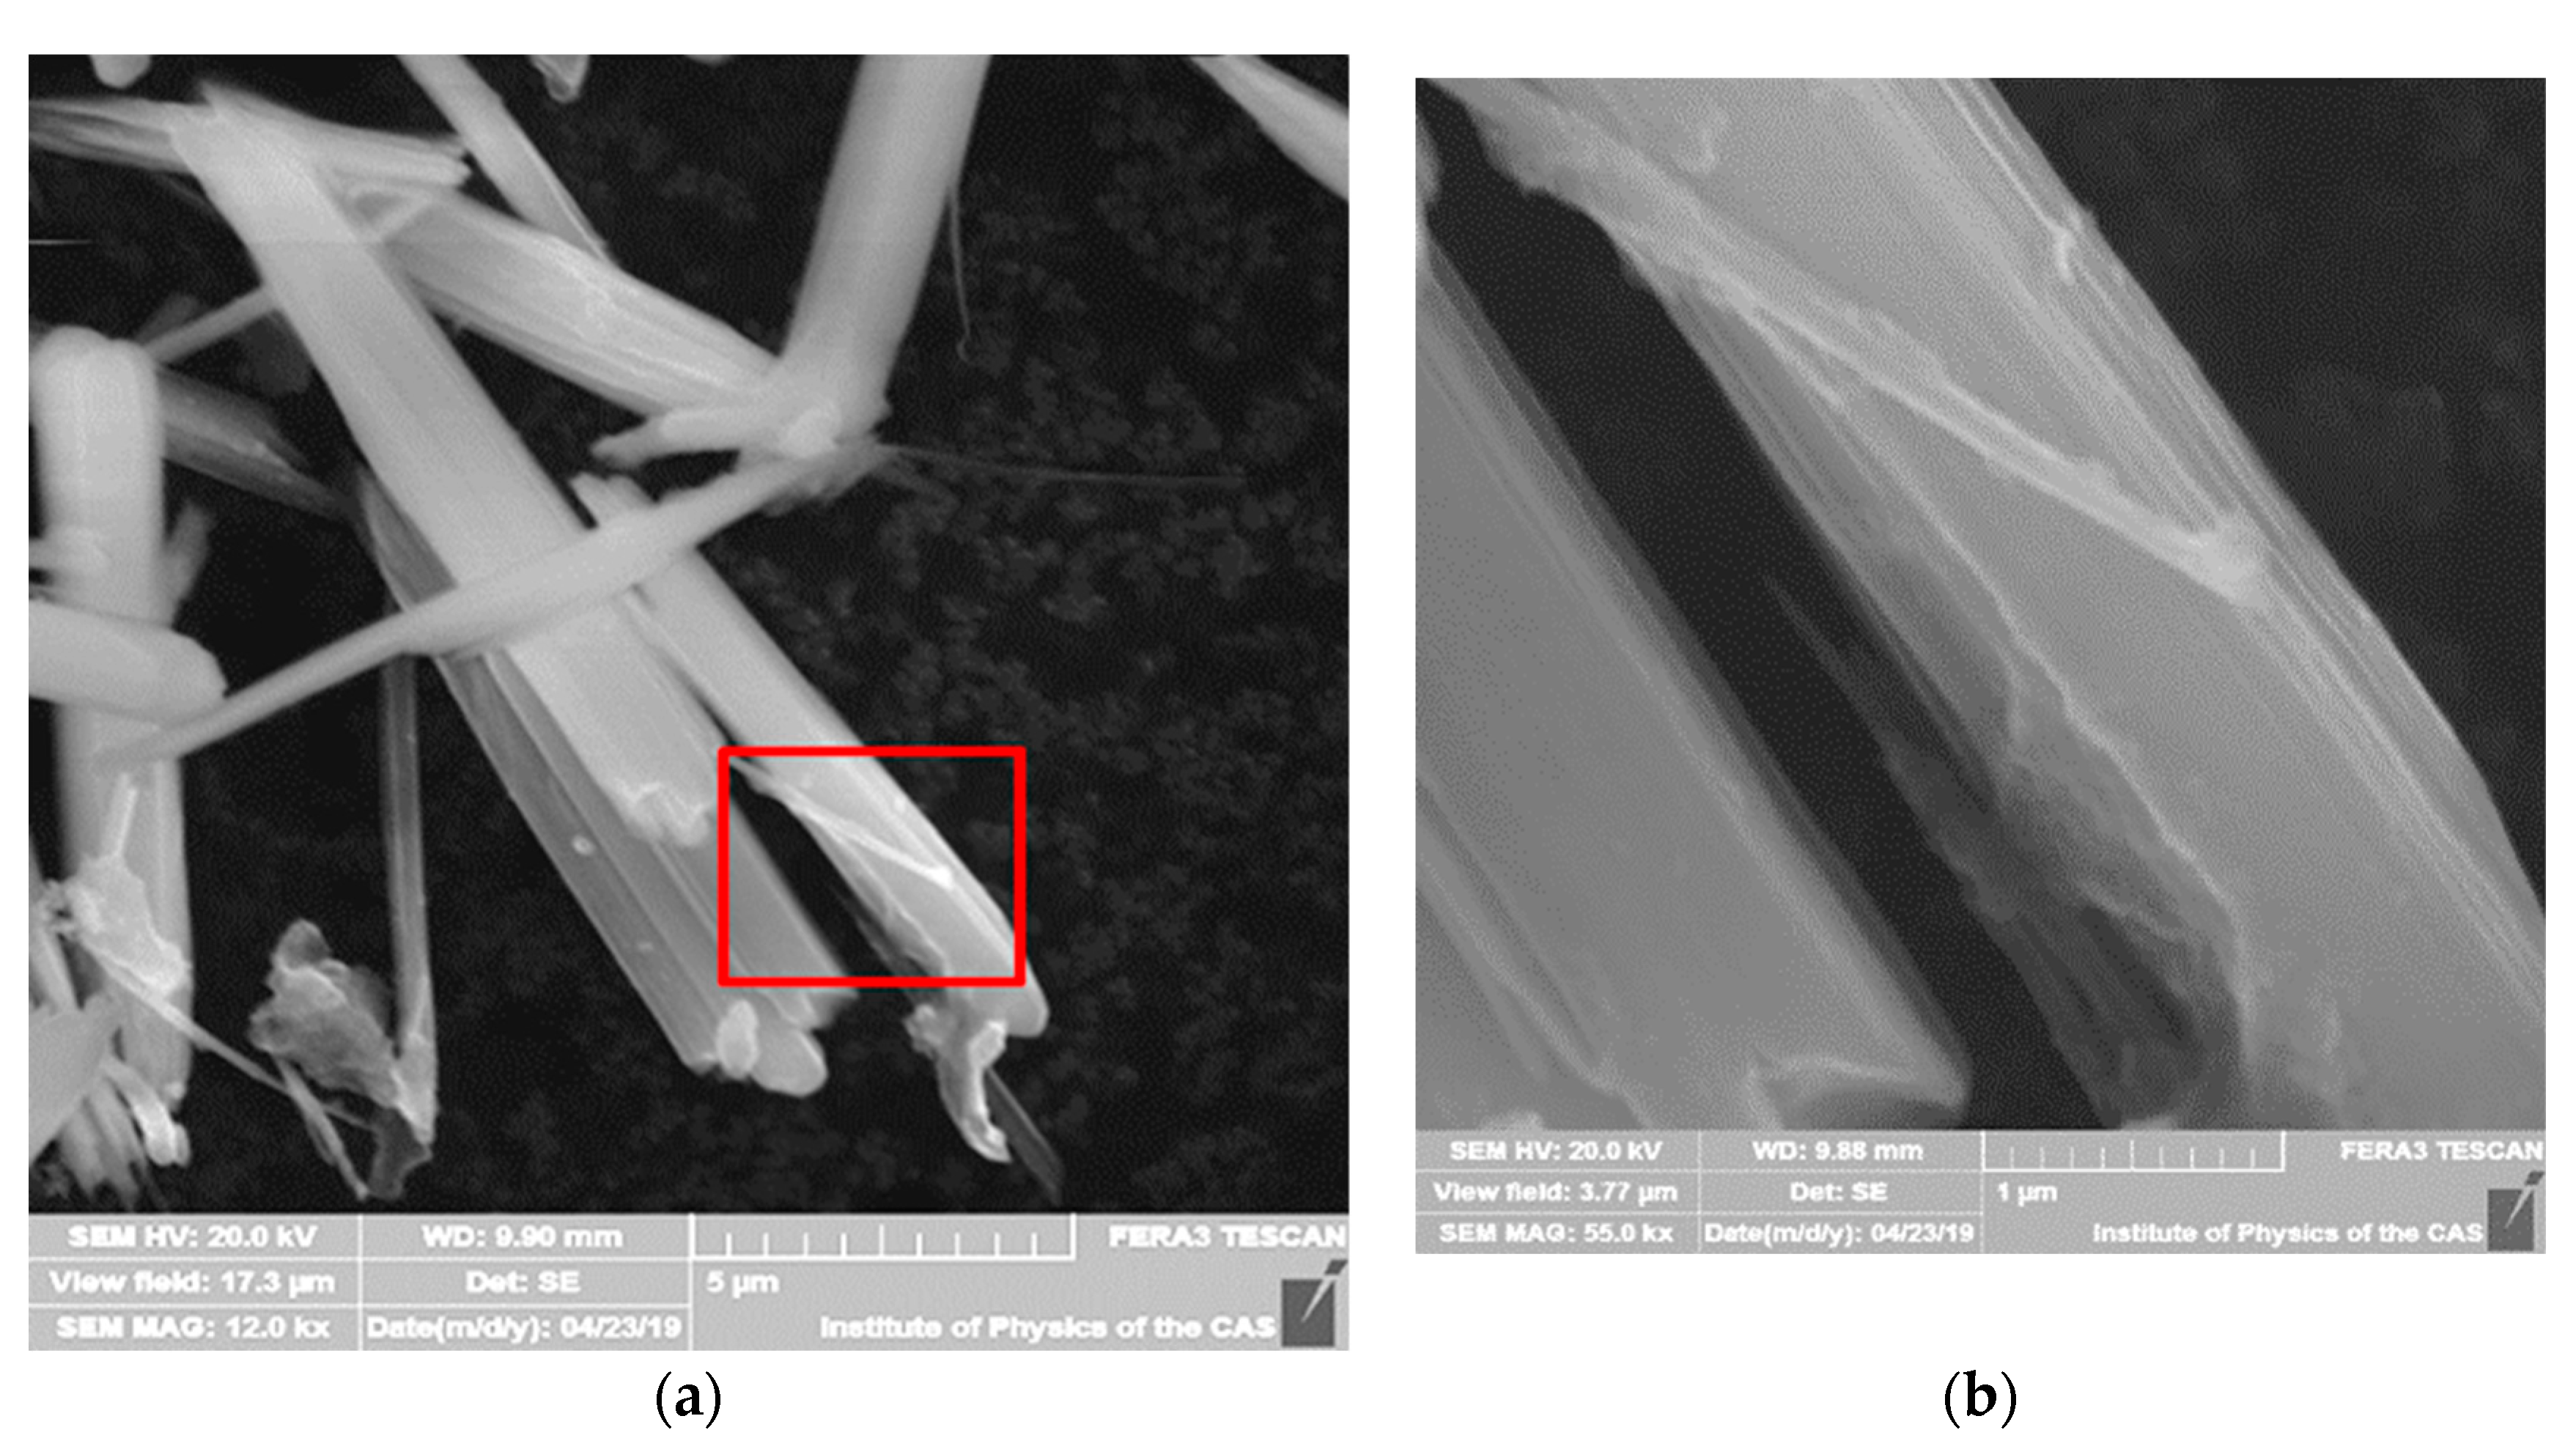
3.3. Scanning Electron Microscopy (SEM) and Energy-Dispersive X-ray Analysis (EDS)

The morphology and surface roughness changes in Cu/TiO2_500, Cu/TiO2_650, Cu/TiO2_800 and Cu/TiO2_950 materials with annealing temperature are presented in a set of SEM micrographs.

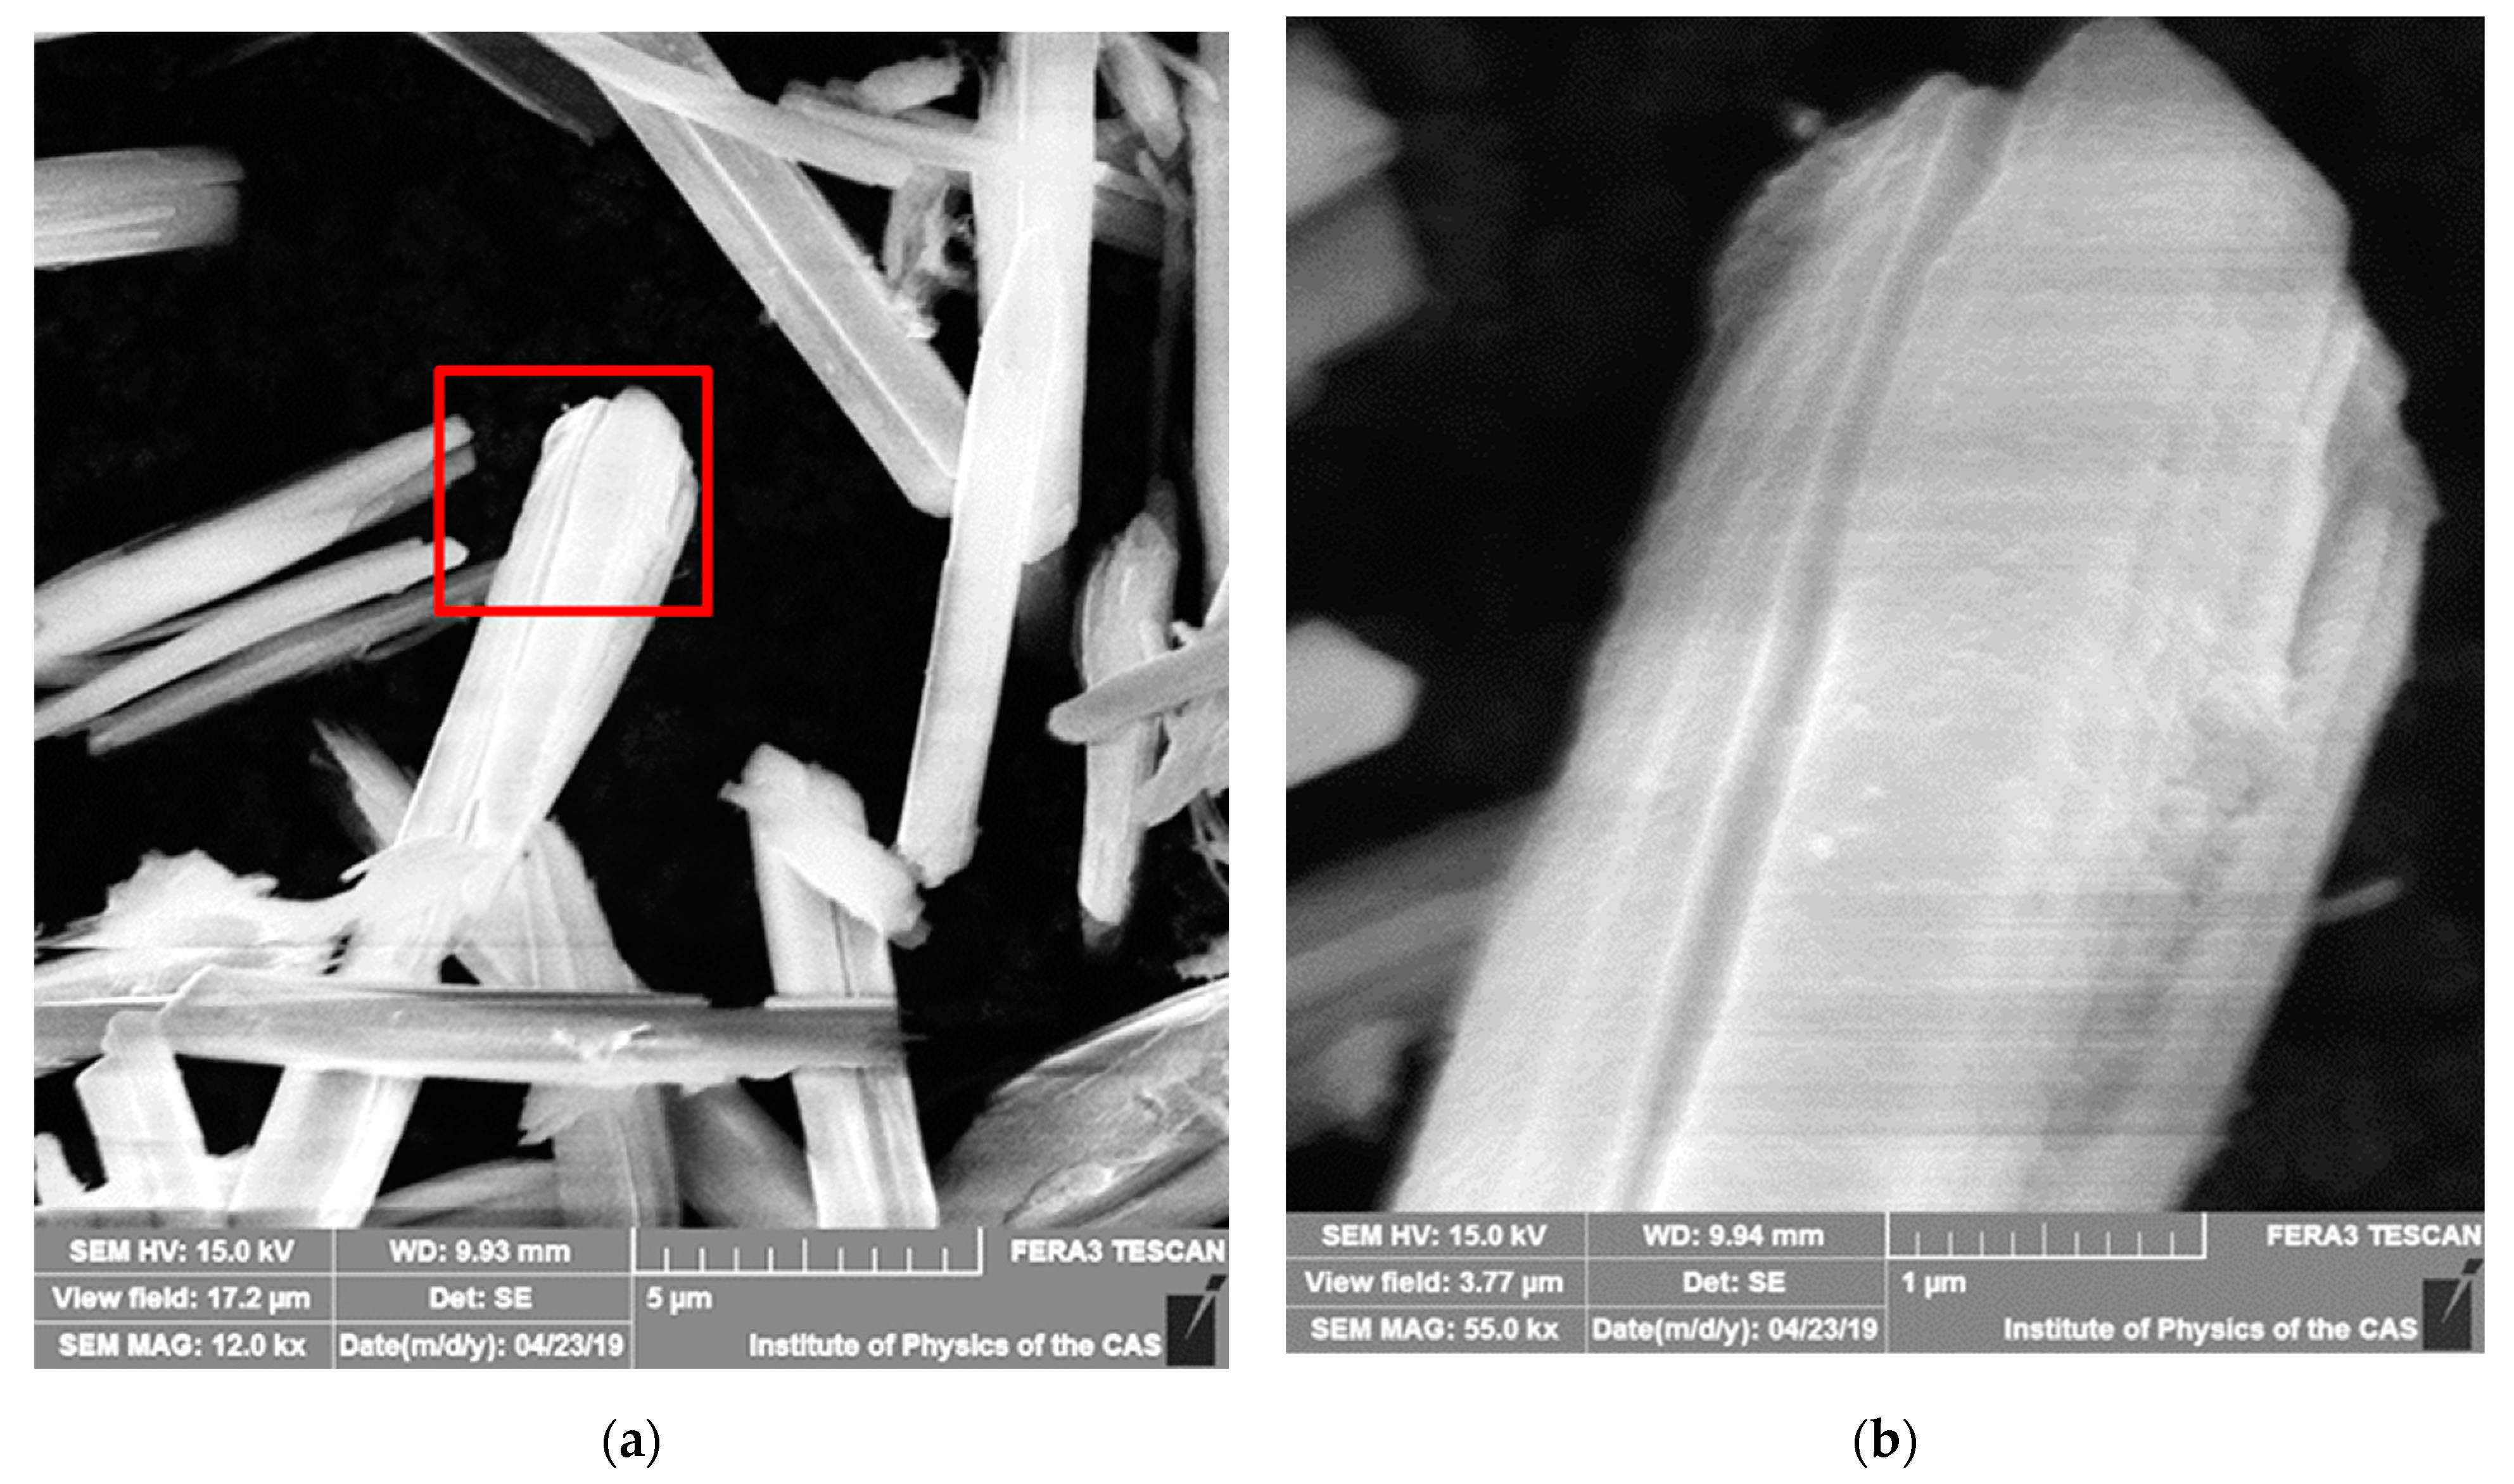
3.3.1. SEM/EDS of Sample Cu/TiO2_500

Figure 3a is an SEM image of the Cu/TiO2_500 sample at low magnification confirmed its 1D morphology. MRs with 10–20 μm in length and 1 μm in diameter are visible. Figure 3b, which is a high magnification of the red boxed area in Figure 3a documents that the 1D Cu/TiO2_500 MRs are composed of densely stacked thin layers with an outermost layer keeping a very clean smooth surface.

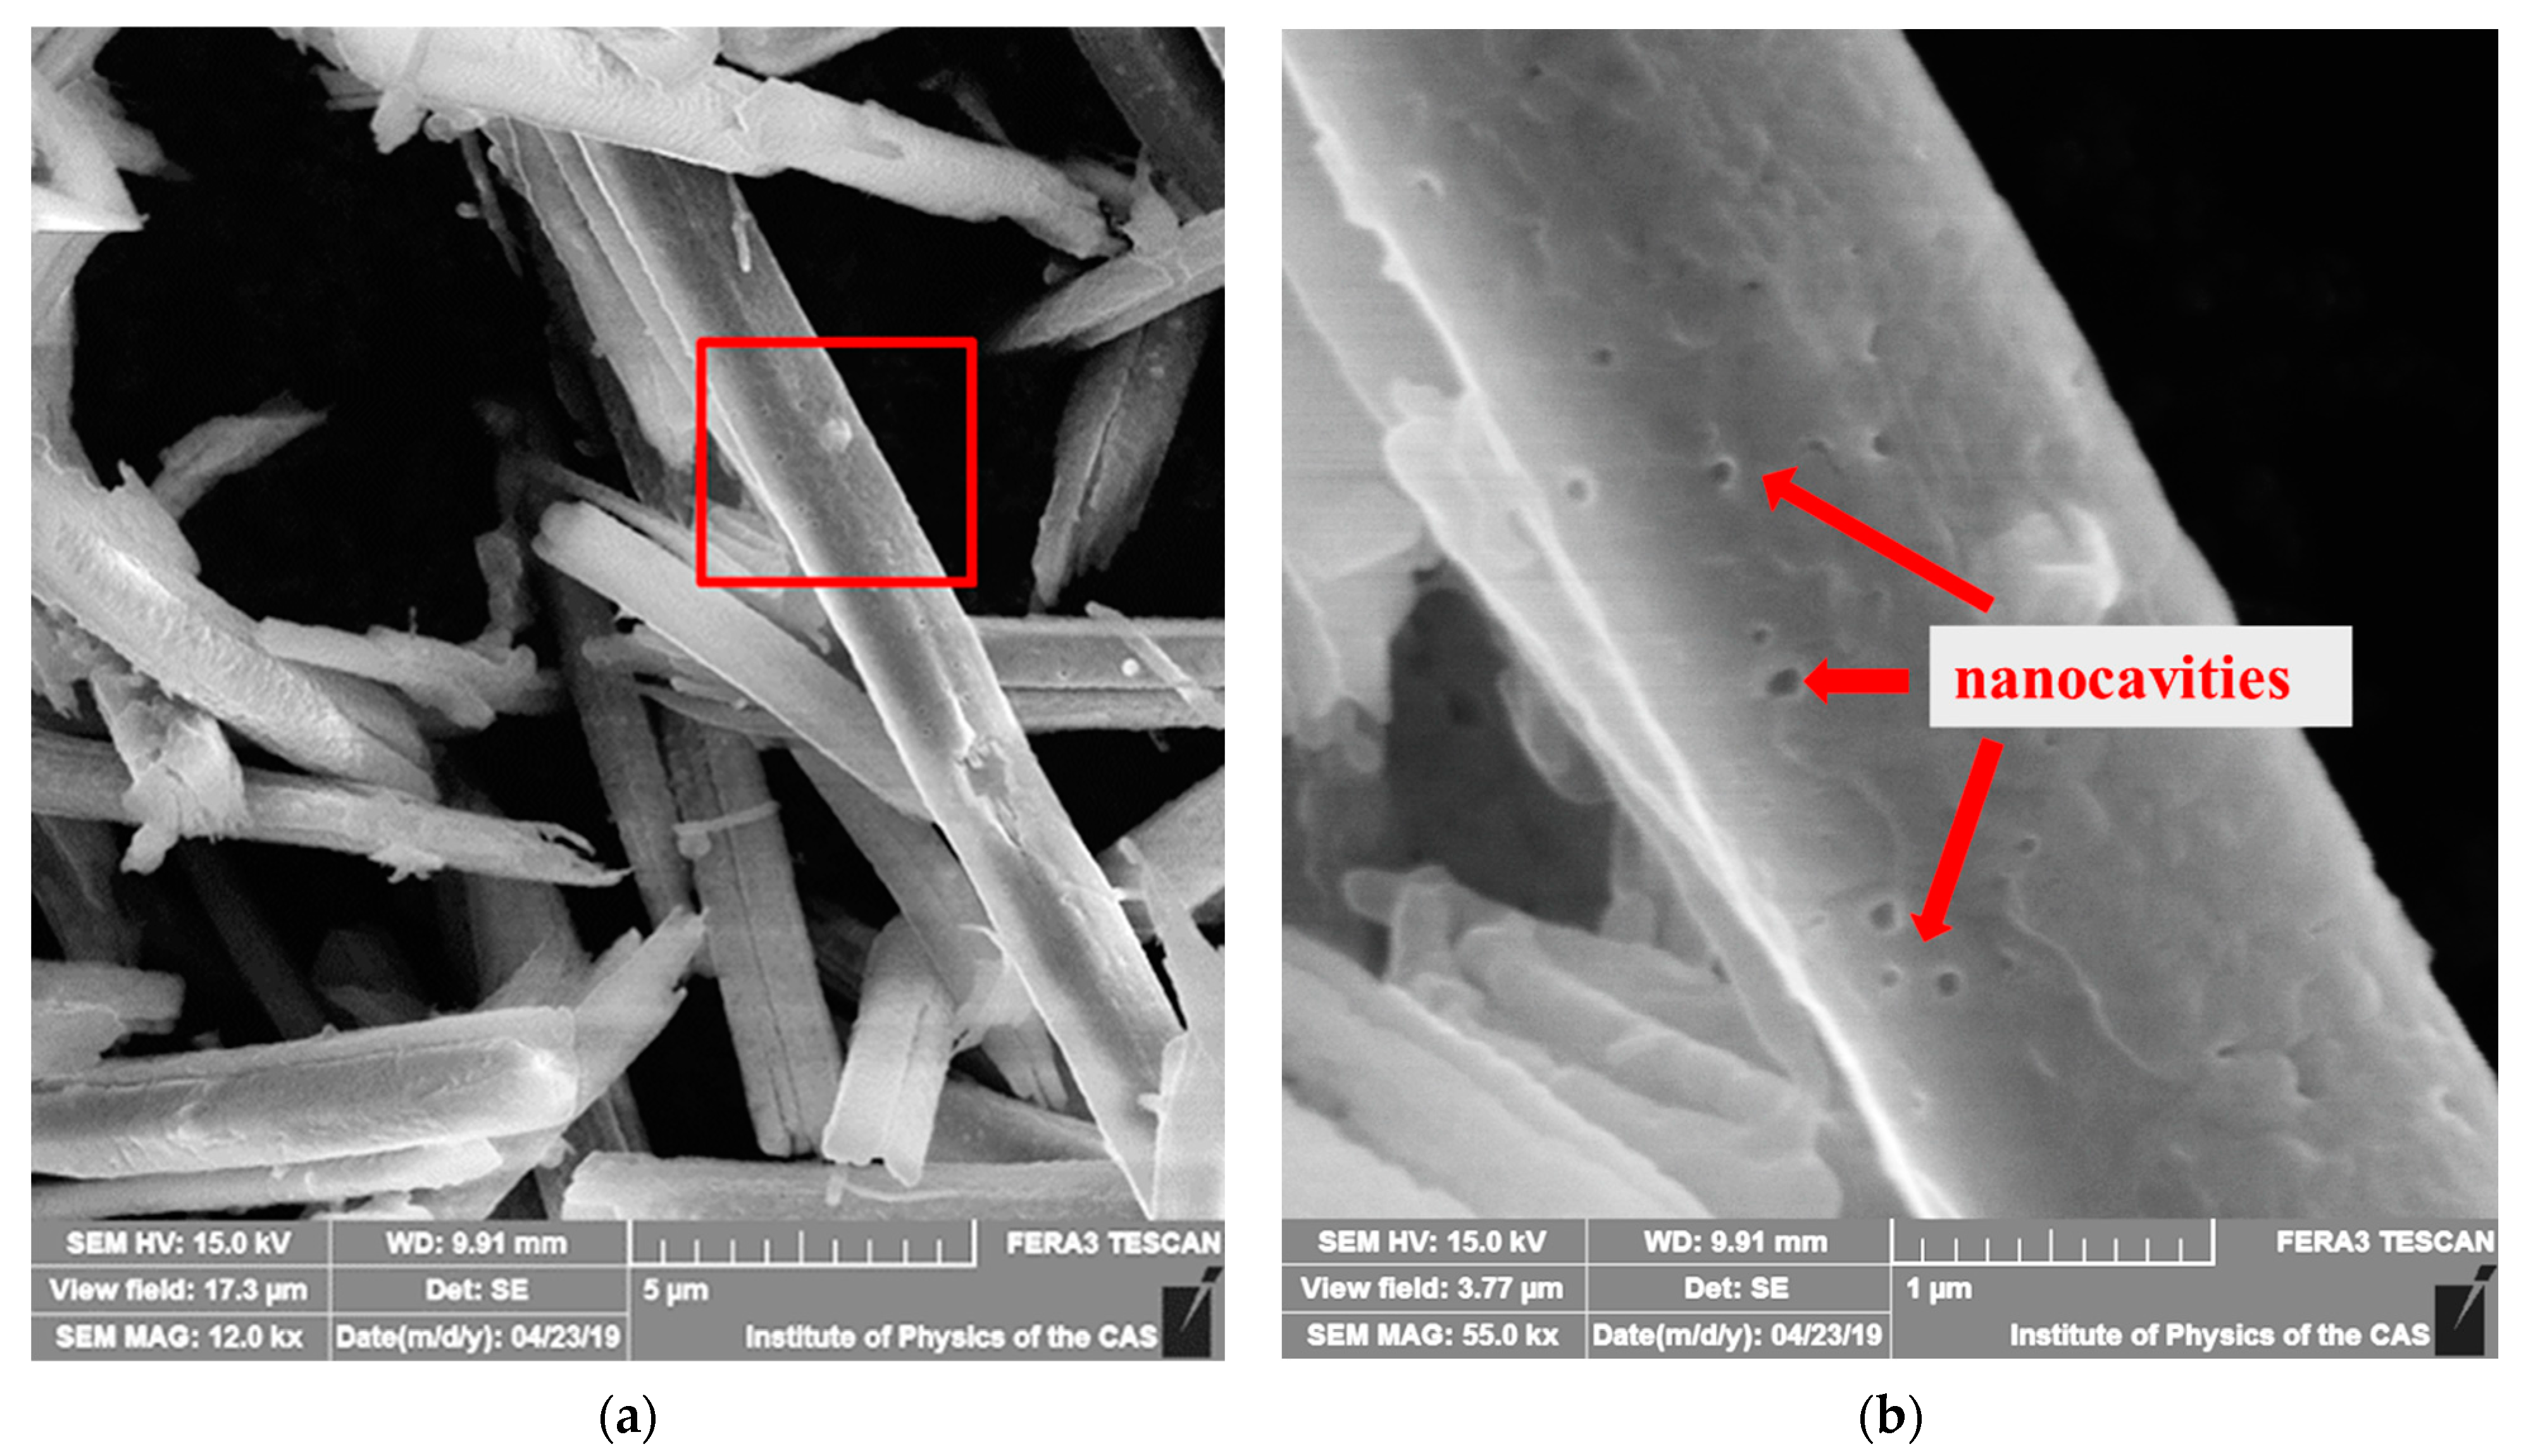
3.3.2. SEM/EDS of Sample Cu/TiO2_650

In Figure 4a,b are shown SEM images of a Cu/TiO2_650 sample at low and high magnifications, respectively. The layered morphology of the MRs and their length were preserved at annealing at 650 °C.

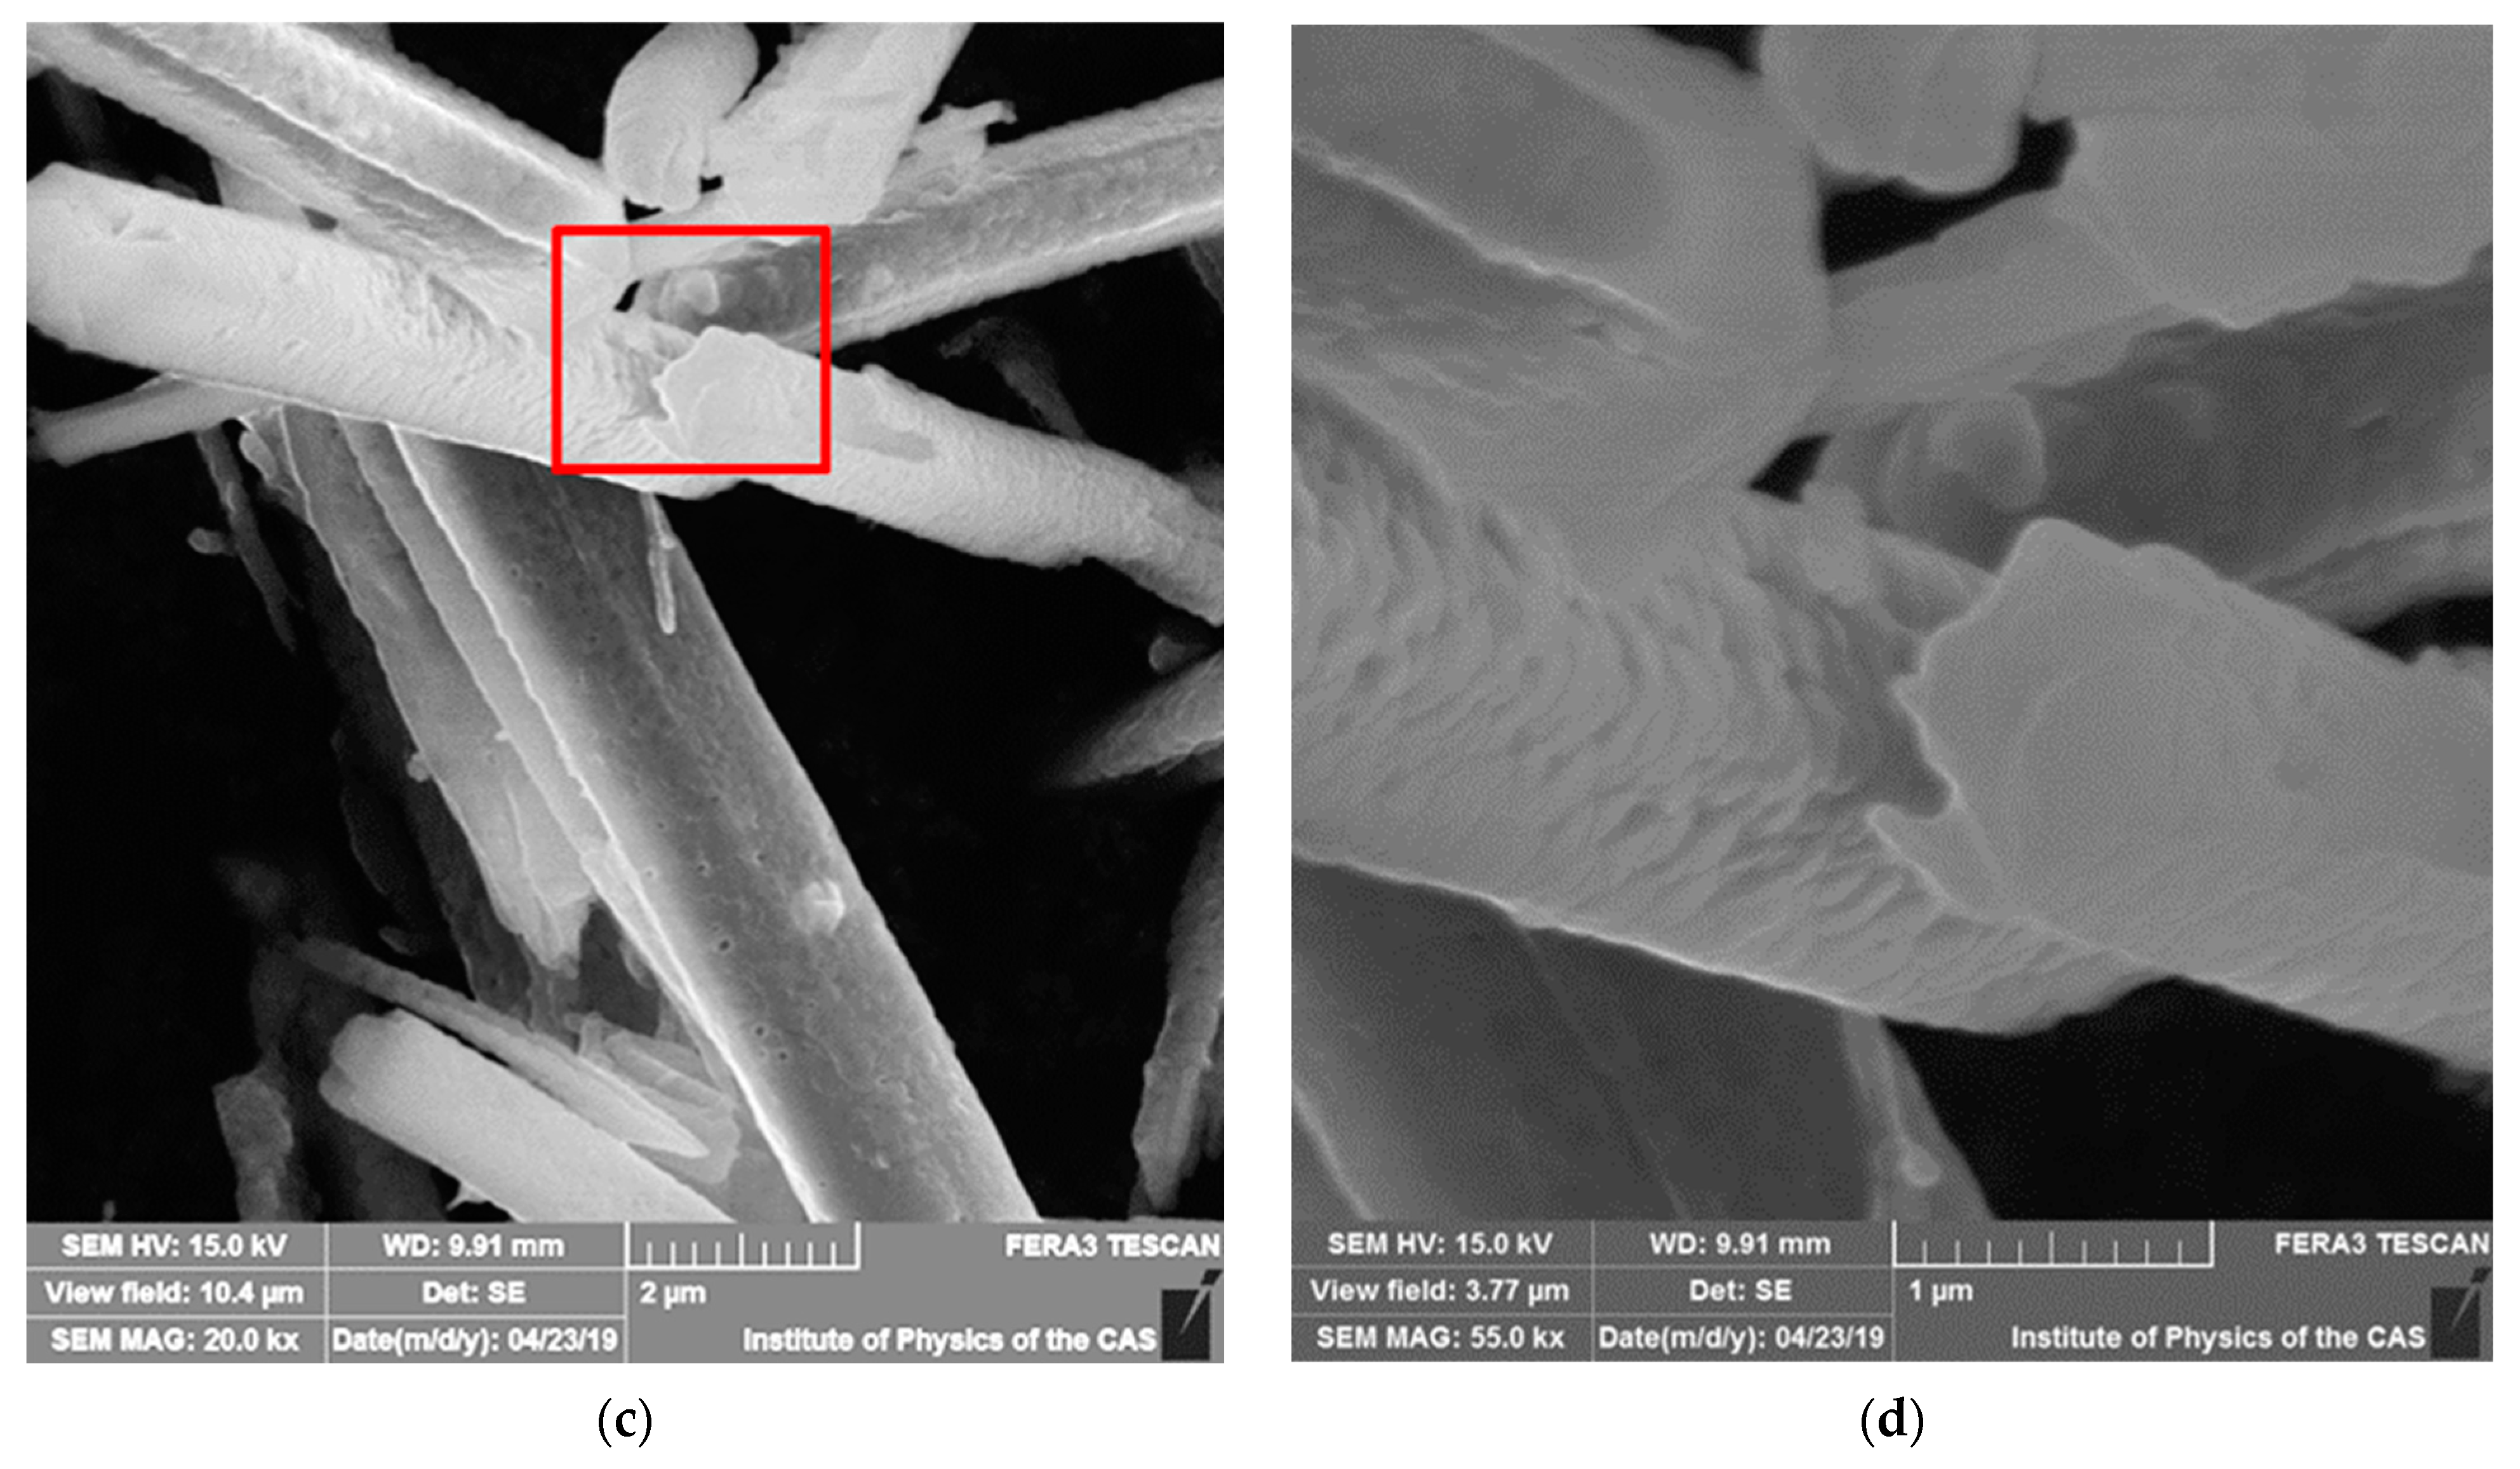
3.3.3. SEM/EDS of Sample Cu/TiO2_800

While annealing at 800 °C, the MRs morphology was preserved (Figure 5a), but the surface of the Cu/TiO2_800 material was changed significantly. Figure 5b,c presented the formation of spherical cavities with a size of 20–50 nm in diameter on the outermost layer attributed to water, NOx, COx, and SOx species releasing upon annealing (see Figures S1–S10). Furthermore, newly wave-like bulge features can be observed in Figure 5c,d. We can suggest that changes in surface morphology can be provoked by anatase to rutile transformation and tenorite (CuO) NCs segregation on the MRs surface (Figure 5d).

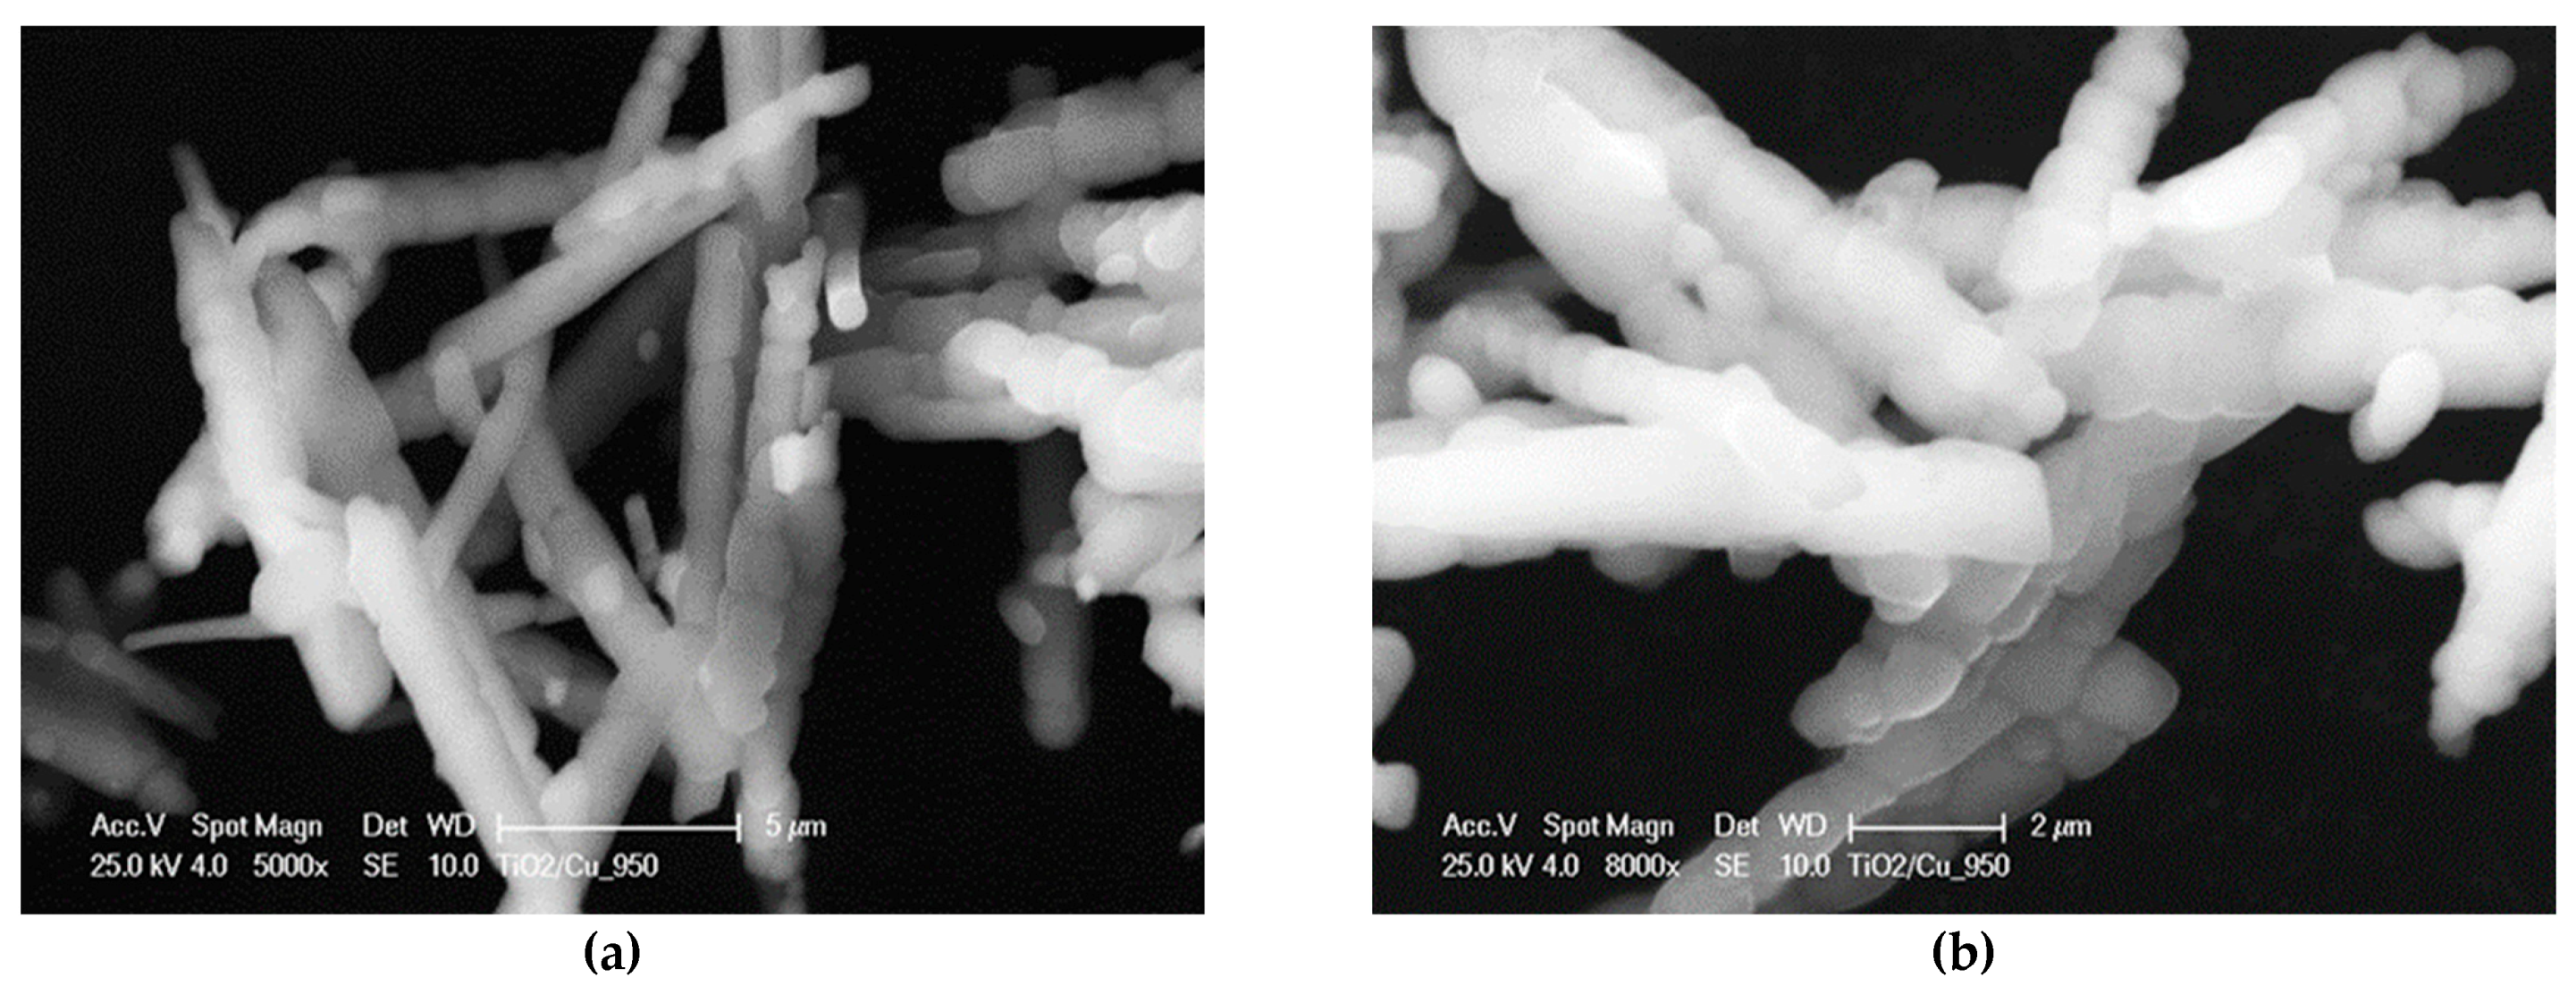
3.3.4. SEM/EDS of Sample Cu/TiO2_950

It is evident that Cu/TiO2_950 MRs showed different shapes from Cu/TiO2_500, Cu/TiO2_650, Cu/TiO2_800 MRs; they are constructed from 1D oriented close-packed single crystals. One can observe that the Cu/TiO2_950 MRs are high-temperature stable structures (Figure 6a,b) preserved 1D morphology even at such high temperatures.
EDS analysis (Table 2) confirmed the presence of oxygen, titanium, and copper with average values in wt.% and at.%. It can be noted that the stoichiometric ratio of titanium to oxygen in all annealed samples differs from the stoichiometric ratio of titanium dioxide (TiO2). The substitution of Cu2+ into the Ti4+ site in anatase could generate oxygen vacancies (Vo) and titanium interstitials (Tii) due to charge balance. Also, the crystallization of CuO NCs at higher temperature could lead to significant non-stoichiometry in Cu/TiO2_500, Cu/TiO2_650, Cu/TiO2_800 and Cu/TiO2_950 materials.

3.4. High-Resolution Transmission Electron Microscopy (HRTEM) and Selected Area Electron Diffraction (SAED)

An HRTEM and SAED study was applied to verify the structures of Cu/TiO2_500, Cu/TiO2_650, Cu/TiO2_800, and Cu/TiO2_950 materials on an atomic level.

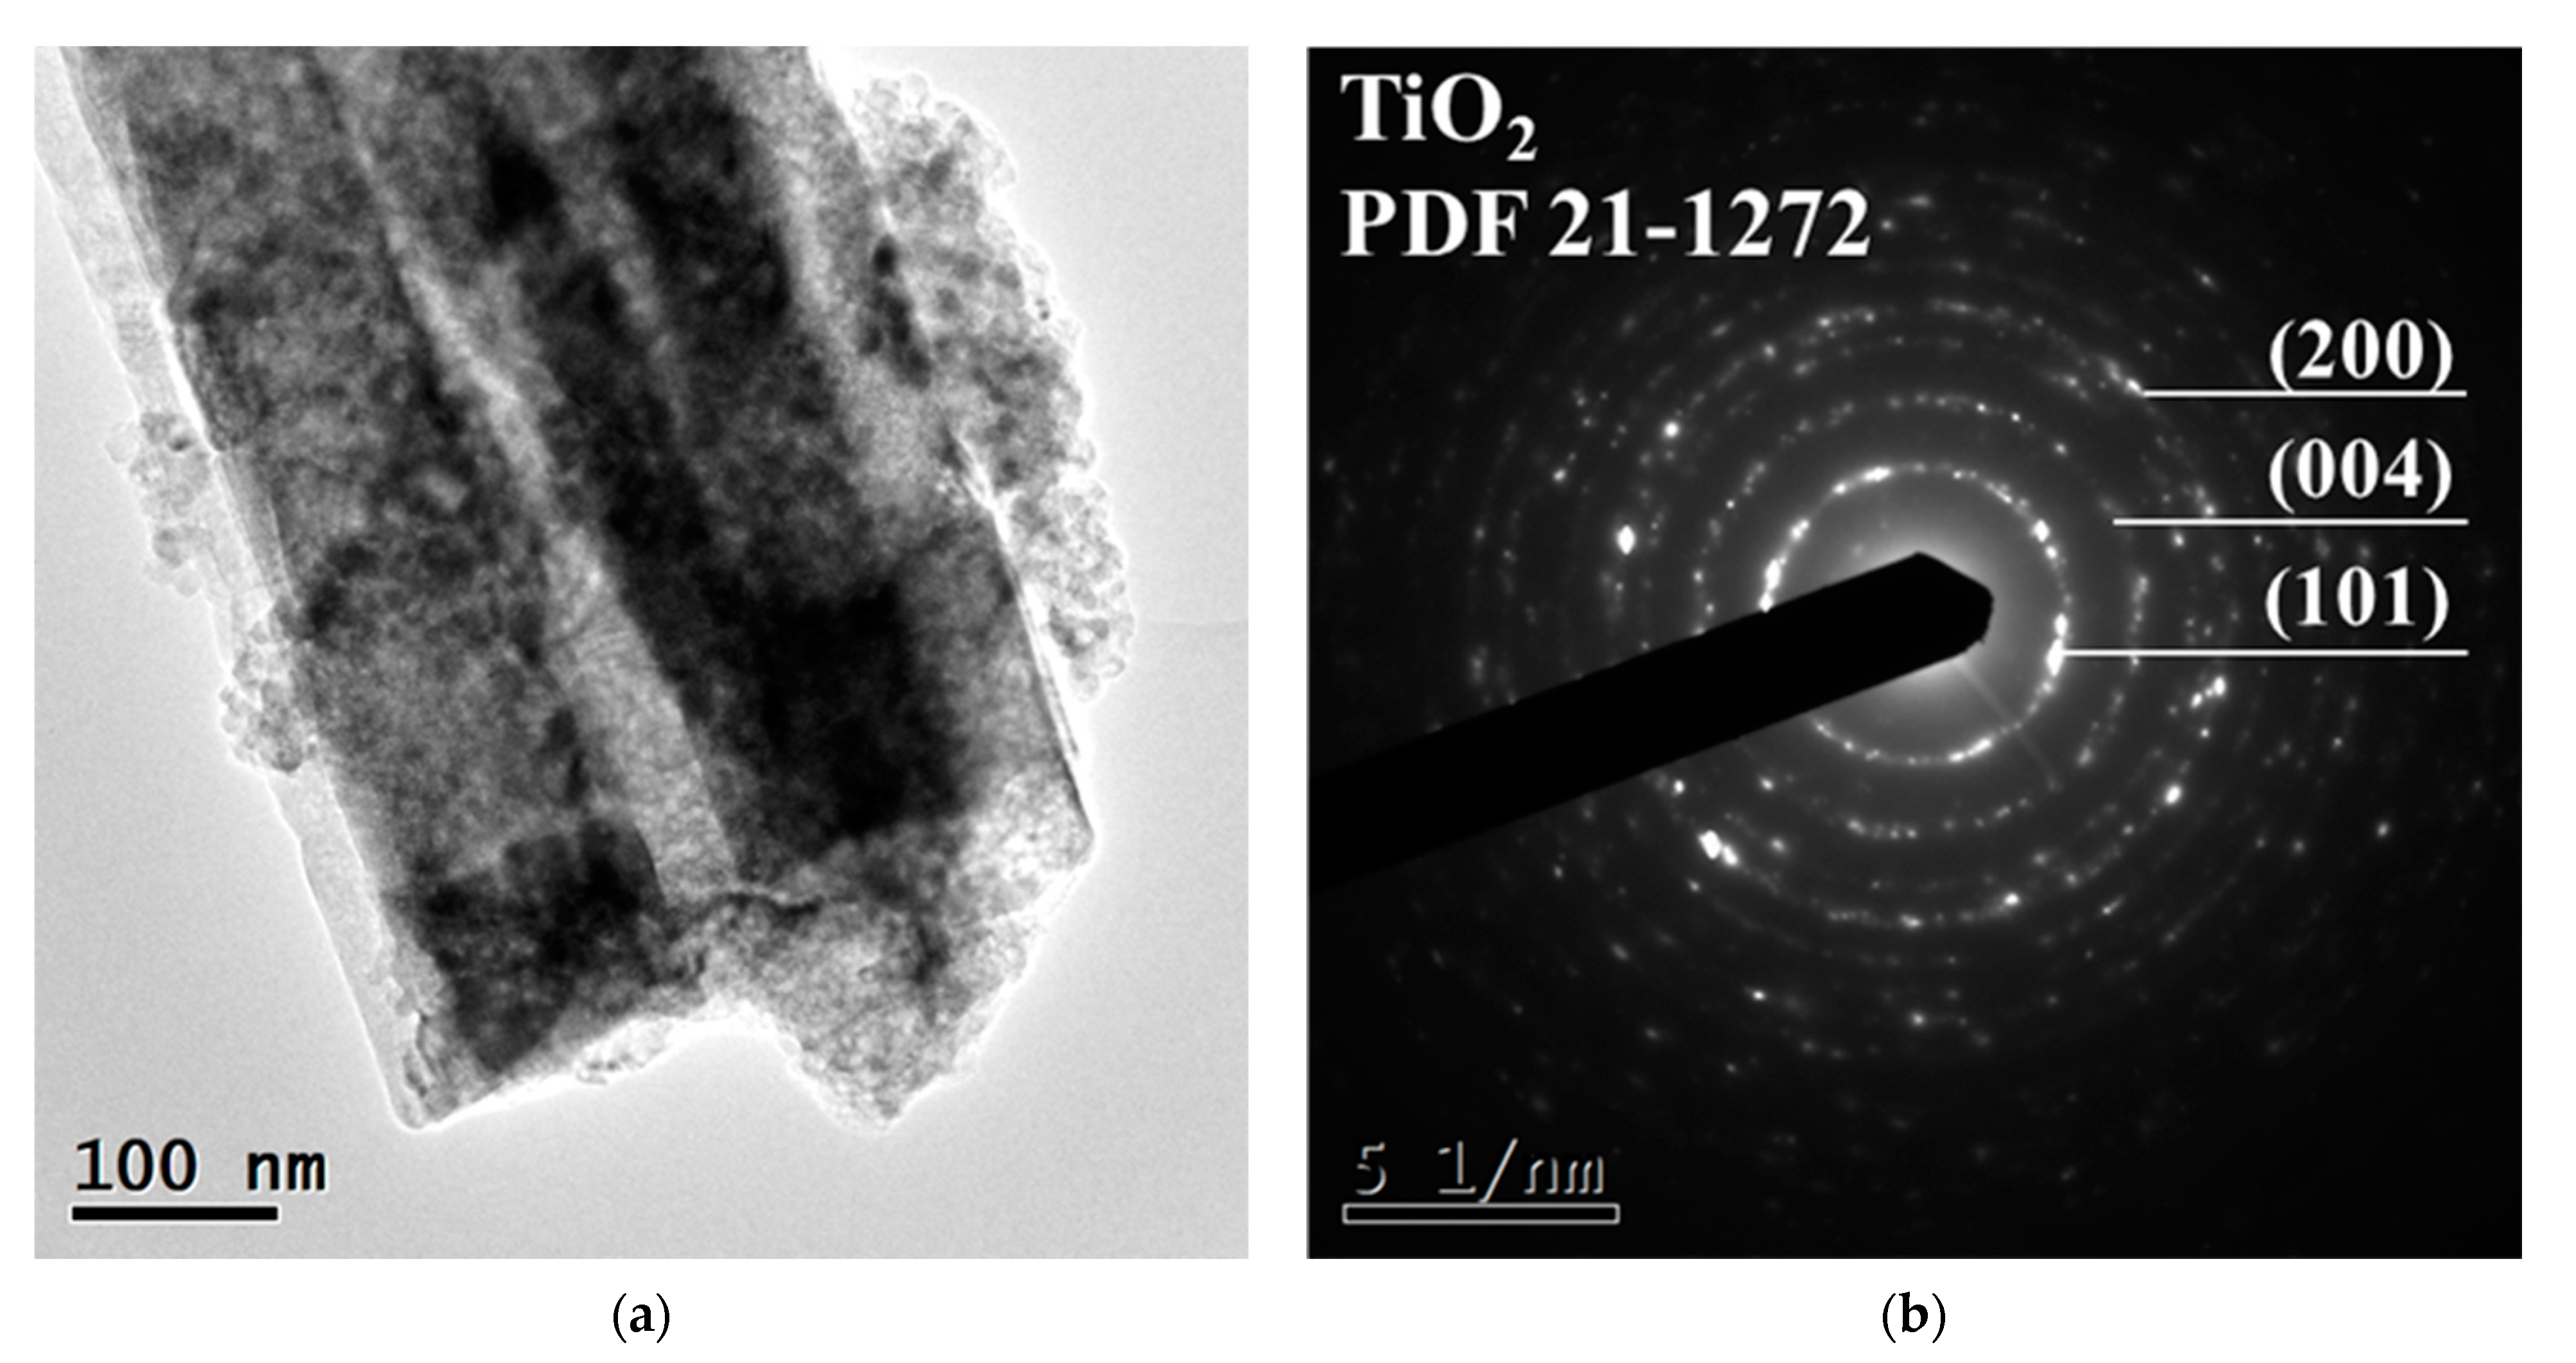
3.4.1. HRTEM/SAED of Sample Cu/TiO2_500

A bright filed image of Cu/TiO2_500 MRs taken by HRTEM demonstrated 1D morphology (Figure 7a). The corresponding SAED pattern (Figure 7b) exhibited concentric diffraction rings with intermittent dots, implying that the Cu/TiO2_500 is polycrystalline material. The analysis of a ring pattern identified anatase TiO2 (JCPDS database PDF file 21-1272) with crystal planes (101), (004), and (200) and relevant interplanar spacing of 0.352 nm, 0.237 nm, and 0.189 nm. The indexing of the SAED pattern revealed no Cu containing NCs or nanoclusters, suggesting that Cu is incorporated in anatase lattice. These results corroborated with XRD analysis.

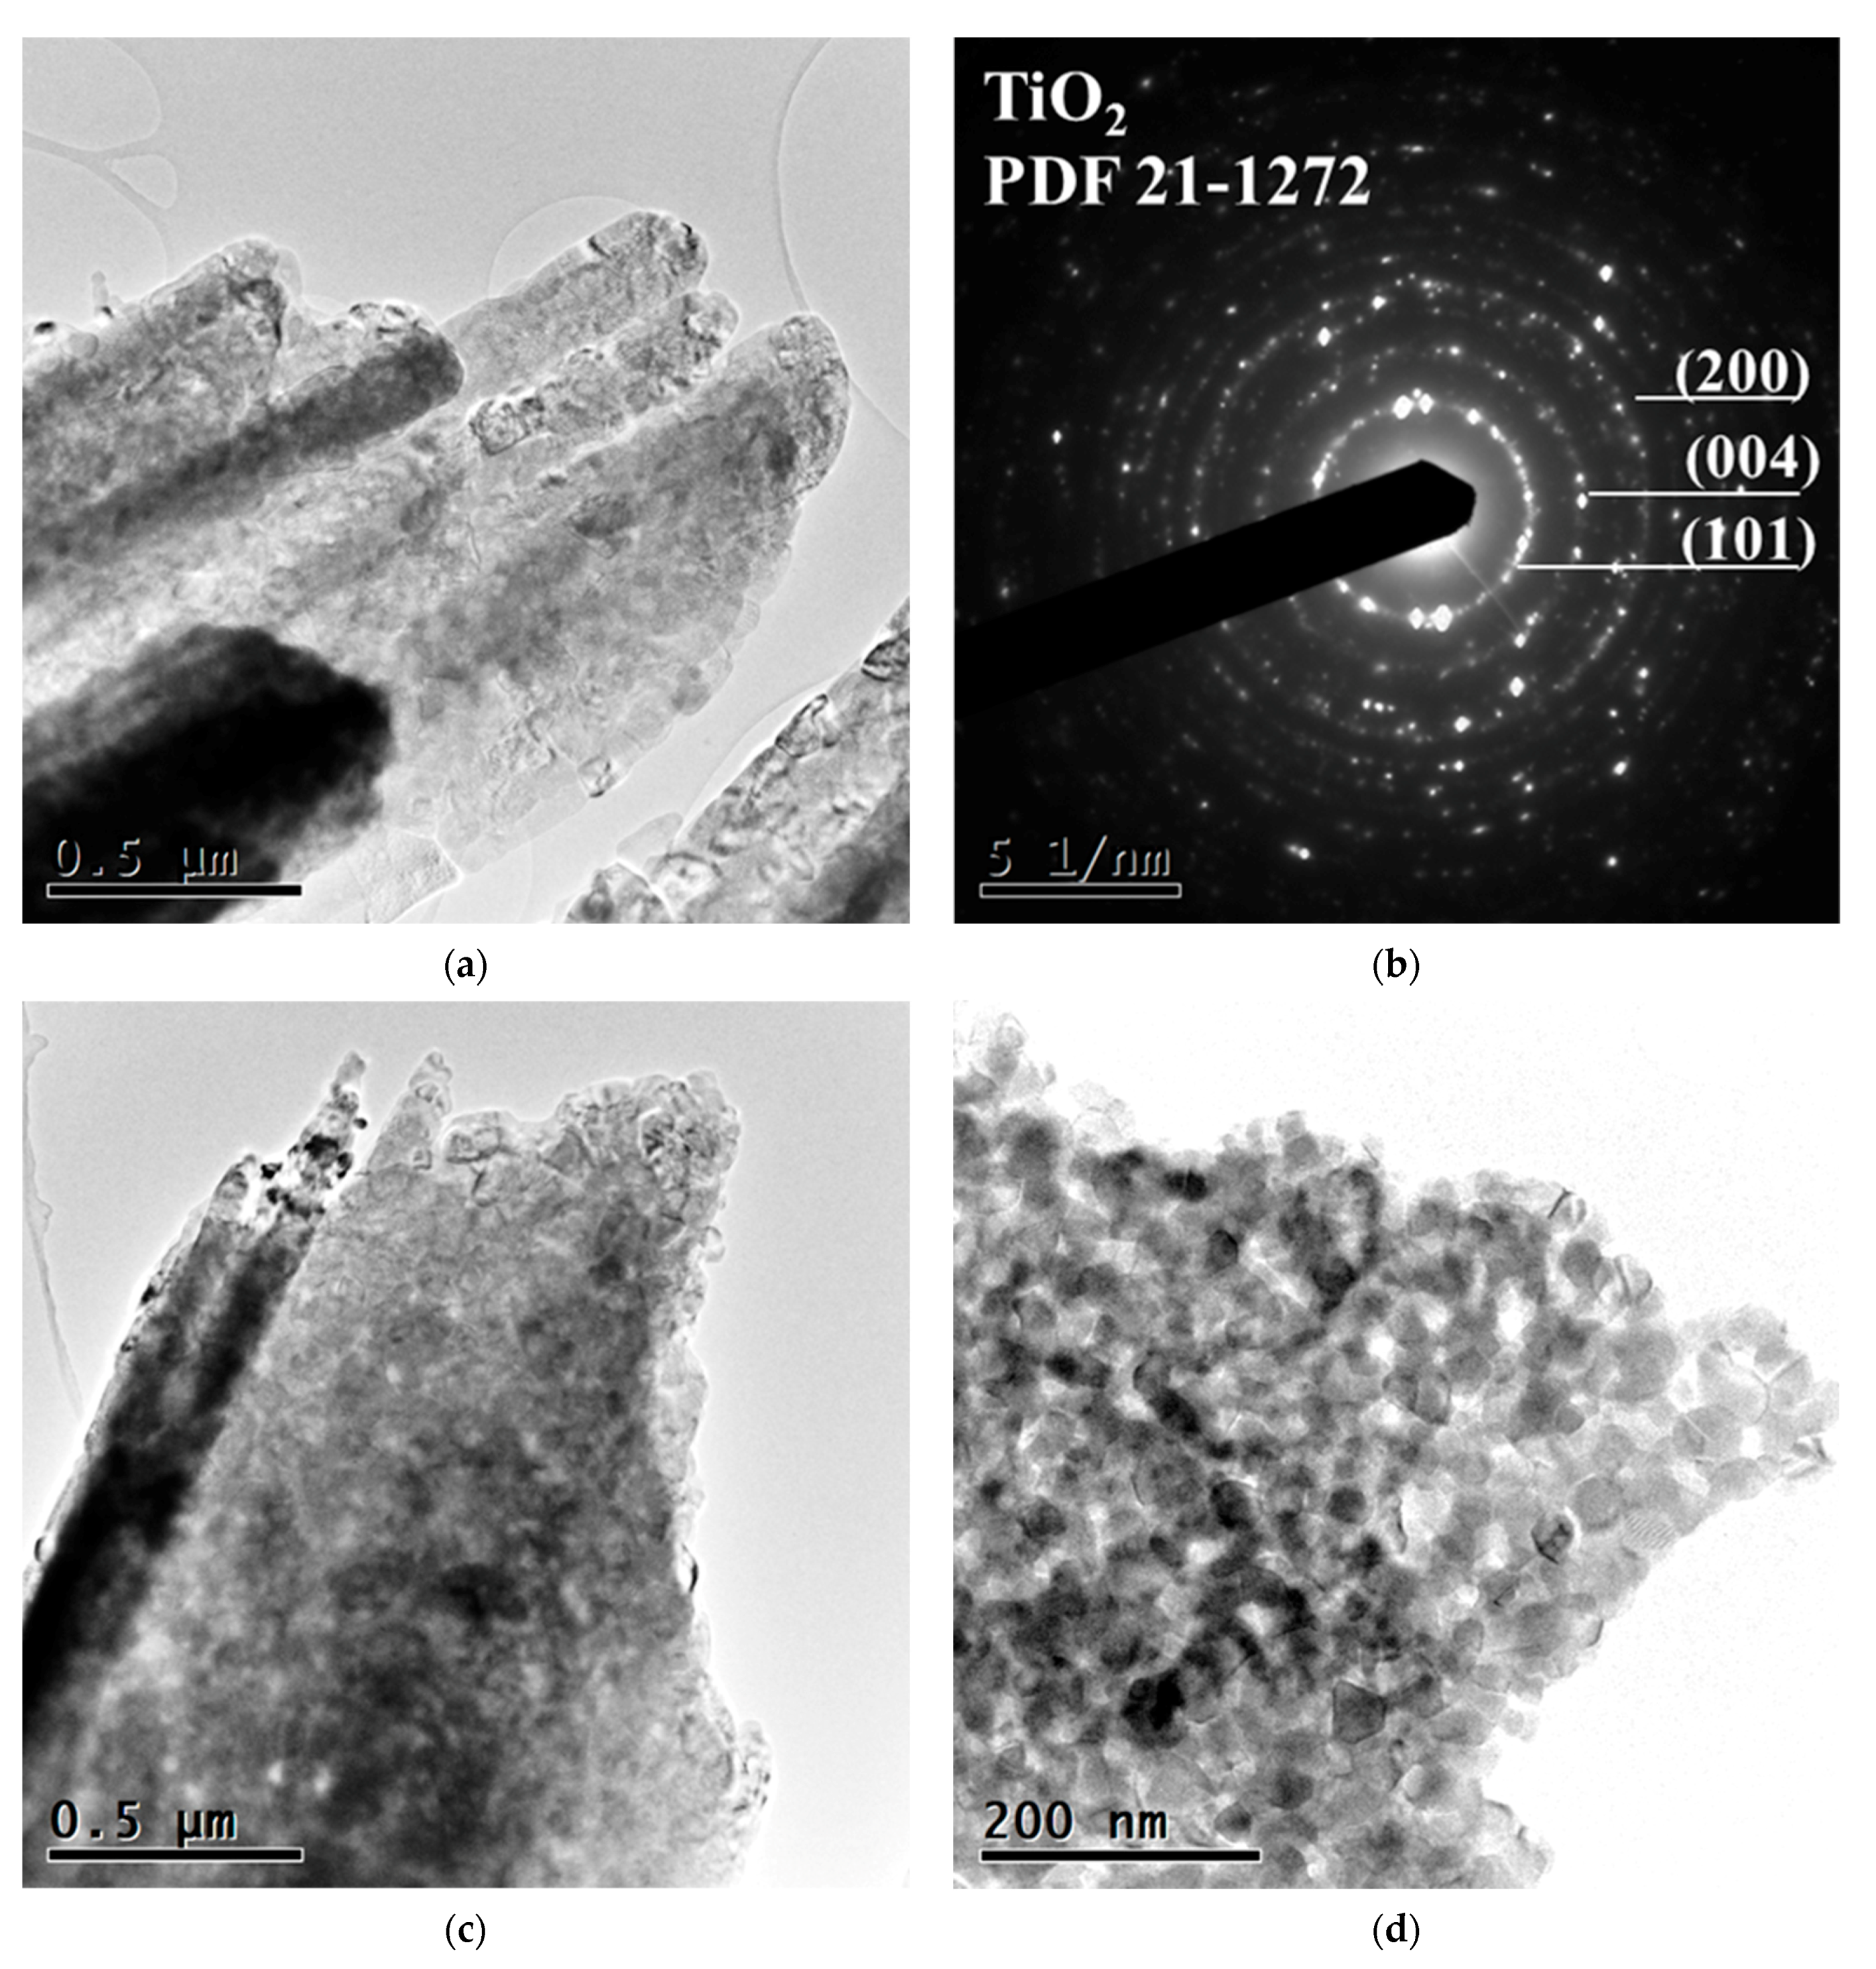
3.4.2. HRTEM/SAED of Sample Cu/TiO2_650

Low magnification HRTEM image and SAED pattern of the Cu/TiO2_650 MRs is shown in Figure 8a,b. According to the SAED pattern, it is an anatase phase of titanium dioxide (JCPDS database PDF file 21-1272) with an identical structure as the Cu/TiO2_500 material. At higher magnification (Figure 8c,d) it is possible to observe well-crystallized material formed by the spontaneous agglomeration of numerous closely packed anatase NCs with a size of 10–15 nm into 1D oriented MRs. Even XRD analysis confirmed 3.73 wt.% of rutile NCs in Cu/TiO2_650 material, we did not observe rutile diffraction spots by indexing the Cu/TiO2_650 SAED pattern.

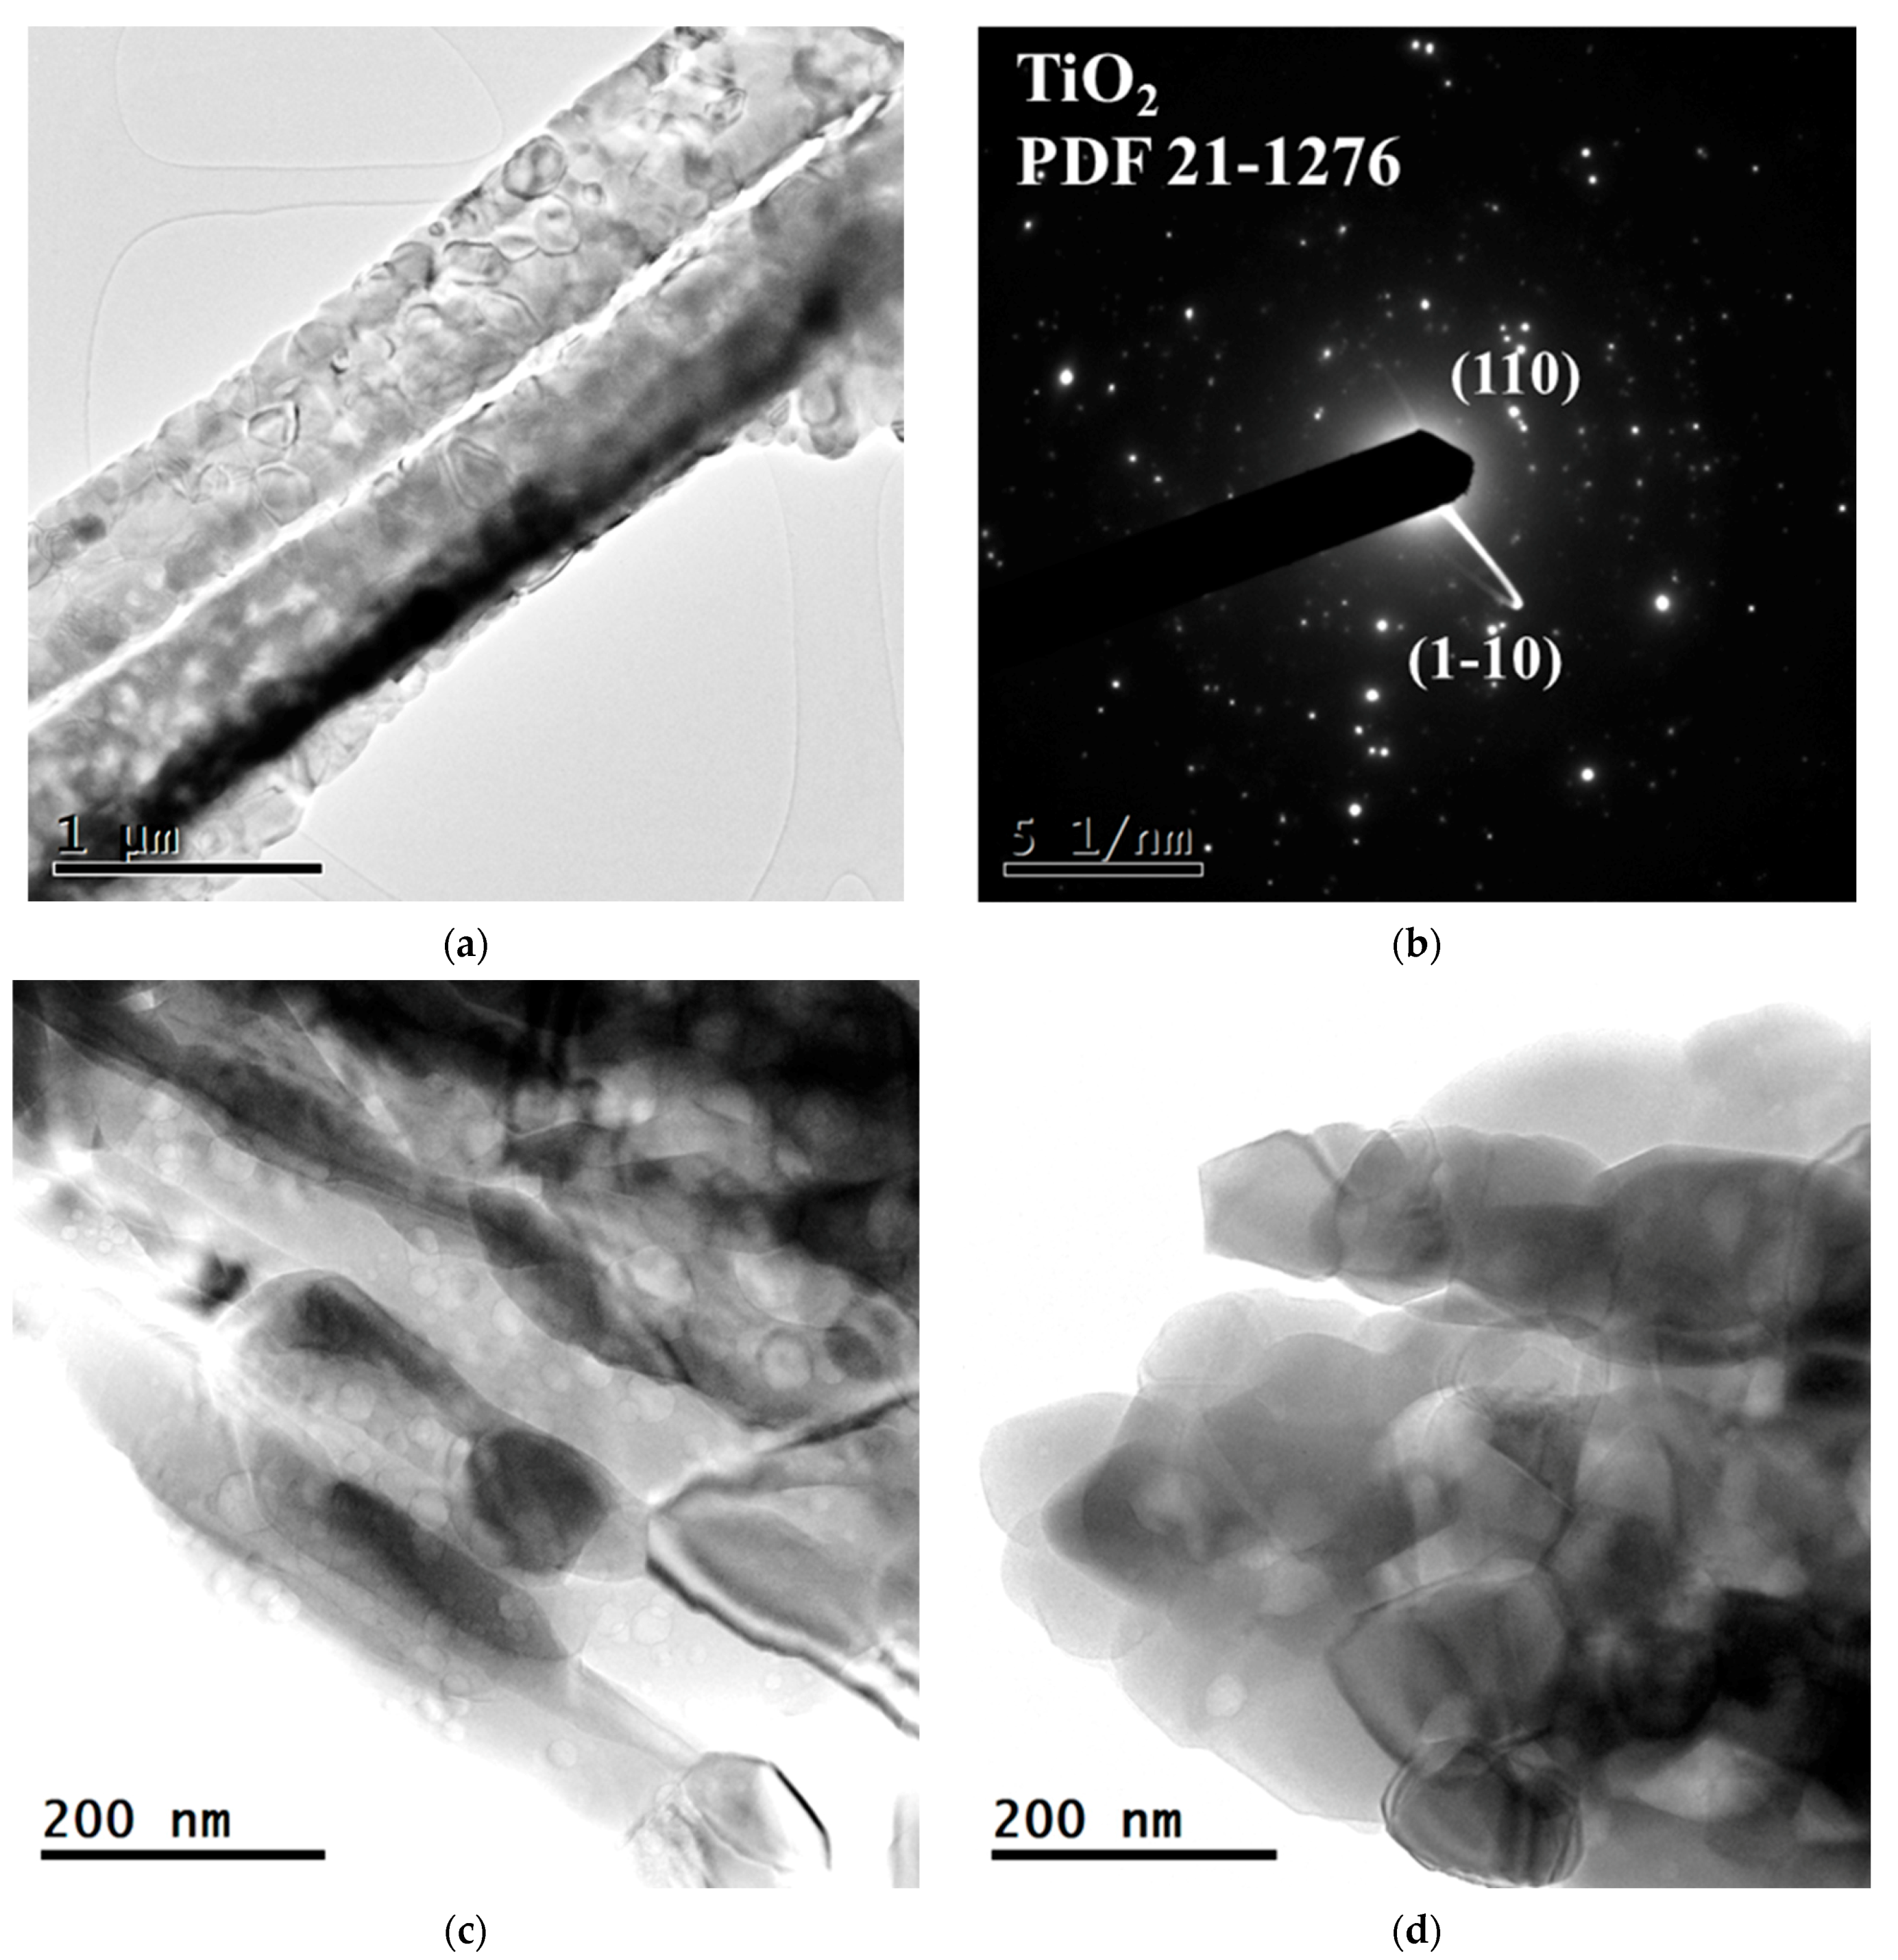
3.4.3. HRTEM/SAED of Sample Cu/TiO2_800

Low magnification HRTEM image and SAED pattern of the Cu/TiO2_800 material are shown in Figure 9a,b. One can see elongated close-packed NCs and spot SEAD pattern confirmed that annealing at 800 °C led to larger and still 1D oriented NCs. Here, we indexed crystal planes (110), corresponding to the interplanar spacing of 0.324 nm of rutile TiO2 (JCPDS database PDF file 21-1276). The HRTEM revealed that there are many nanocavities inside the NCs building the MRs, visible at higher magnification (Figure 9c). Nanocavities appeared as white spots at the surface of Cu/TiO2_800 MRs. Similar findings on the nanocavities detected by HRTEM were reported by [34,35]. Additionally, here we can detect not only spherical-shaped nanocavities (see SEM section), but also hexagon-shaped nanocavities (Figure 9c,d), which could be formed due to the six-fold symmetry in ice crystals grown/melting from water vapor upon lyophilization/annealing processes.

3.4.4. HRTEM/SAED of Sample Cu/TiO2_950

It is evident from the HRTEM image (Figure 10a) that Cu/TiO2_950 MRs show 1D morphology, but with different nanocavity sizes and distribution compared with Cu/TiO2_800. The higher annealing temperature generated larger nanocavities at the surface that can be explained by the enhanced coarsening of ice crystals in Cu/TiO2_950 due to freezing–thaw cycling and annealing. The interpretation normally set up forward the dissolution–regrowth mechanism: first, the smallest ice particles are dissolved upon heating, leading to fewer nuclei. Second, upon lyophilization, the amount of dissolved ice crystals is regrown on the remaining nuclei, leading to larger particles. The larger ice particle becomes soft and liquid with increasing temperature up to 950 °C, and further, evaporate leaving behind bigger cavities on the surface [36]. Furthermore, one can observe a small dark spot on the surface of Cu/TiO2_950 MRs (marked with the red arrow in Figure 10a). We can speculate that this is CuO crystallized during annealing and segregated on the surface of rutile grains. The precipitation of tenorite (CuO) on the surface of Cu/TiO2_950 MRs can be explained as a change of an inhomogeneous structure over the temperature in TiO2-CuO solid solution. The process involves matter relocation, i.e., crystallization of small CuO NCs on the surface of larger TiO2 NCs. This process can be explained based on the Oswald ripening phenomenon [37]. The IUPAC in 2007 recommended the definition of Ostwald ripening as the “dissolution of small crystals or soil particles and the redeposition of the dissolved species on the surfaces of larger crystals or soil particles.” [38]. The ripening process occurs in Cu/TiO2_950 MRs because larger particles TiO2 NPs become spatially quite close to each other which leads to the coarsening and rise of their crystallite’s size during annealing (Table 1). Also, such a process is more energetically favored since giving rise to an apparent higher solubility for the smaller NCs to segregate on the surface of the biggest one [39].
SEAD of the Cu/TiO2_950 MRs (Figure 10b) revealed a spot diffraction pattern. It should be pointed out that the presence of strong and well-defined spots is due to the increase in rutile grain size to the dimensions of 300 × 450 nm single crystals. The structure of rutile NC (Figure 10c) taken from the red boxed area in Figure 10a, fitted very well the tabulated rutile (JCPDS database PDF file 21-1276). Also, a magnified part (inset in Figure 10d) of the red marked region, revealing the atomic resolution image with nanooctahedra atomic arrangement, which is characteristic of stable rutile TiO2 structure. The HRTEM results of Cu/TiO2_950 are consistent with XRD analysis. The mean grain size in Cu/TiO2_950 material is closely related to the amount of rutile phase; the more rutile percentage found in Cu/TiO2_950, the bigger the mean grain size was estimated (Table 1, Figure 10a).

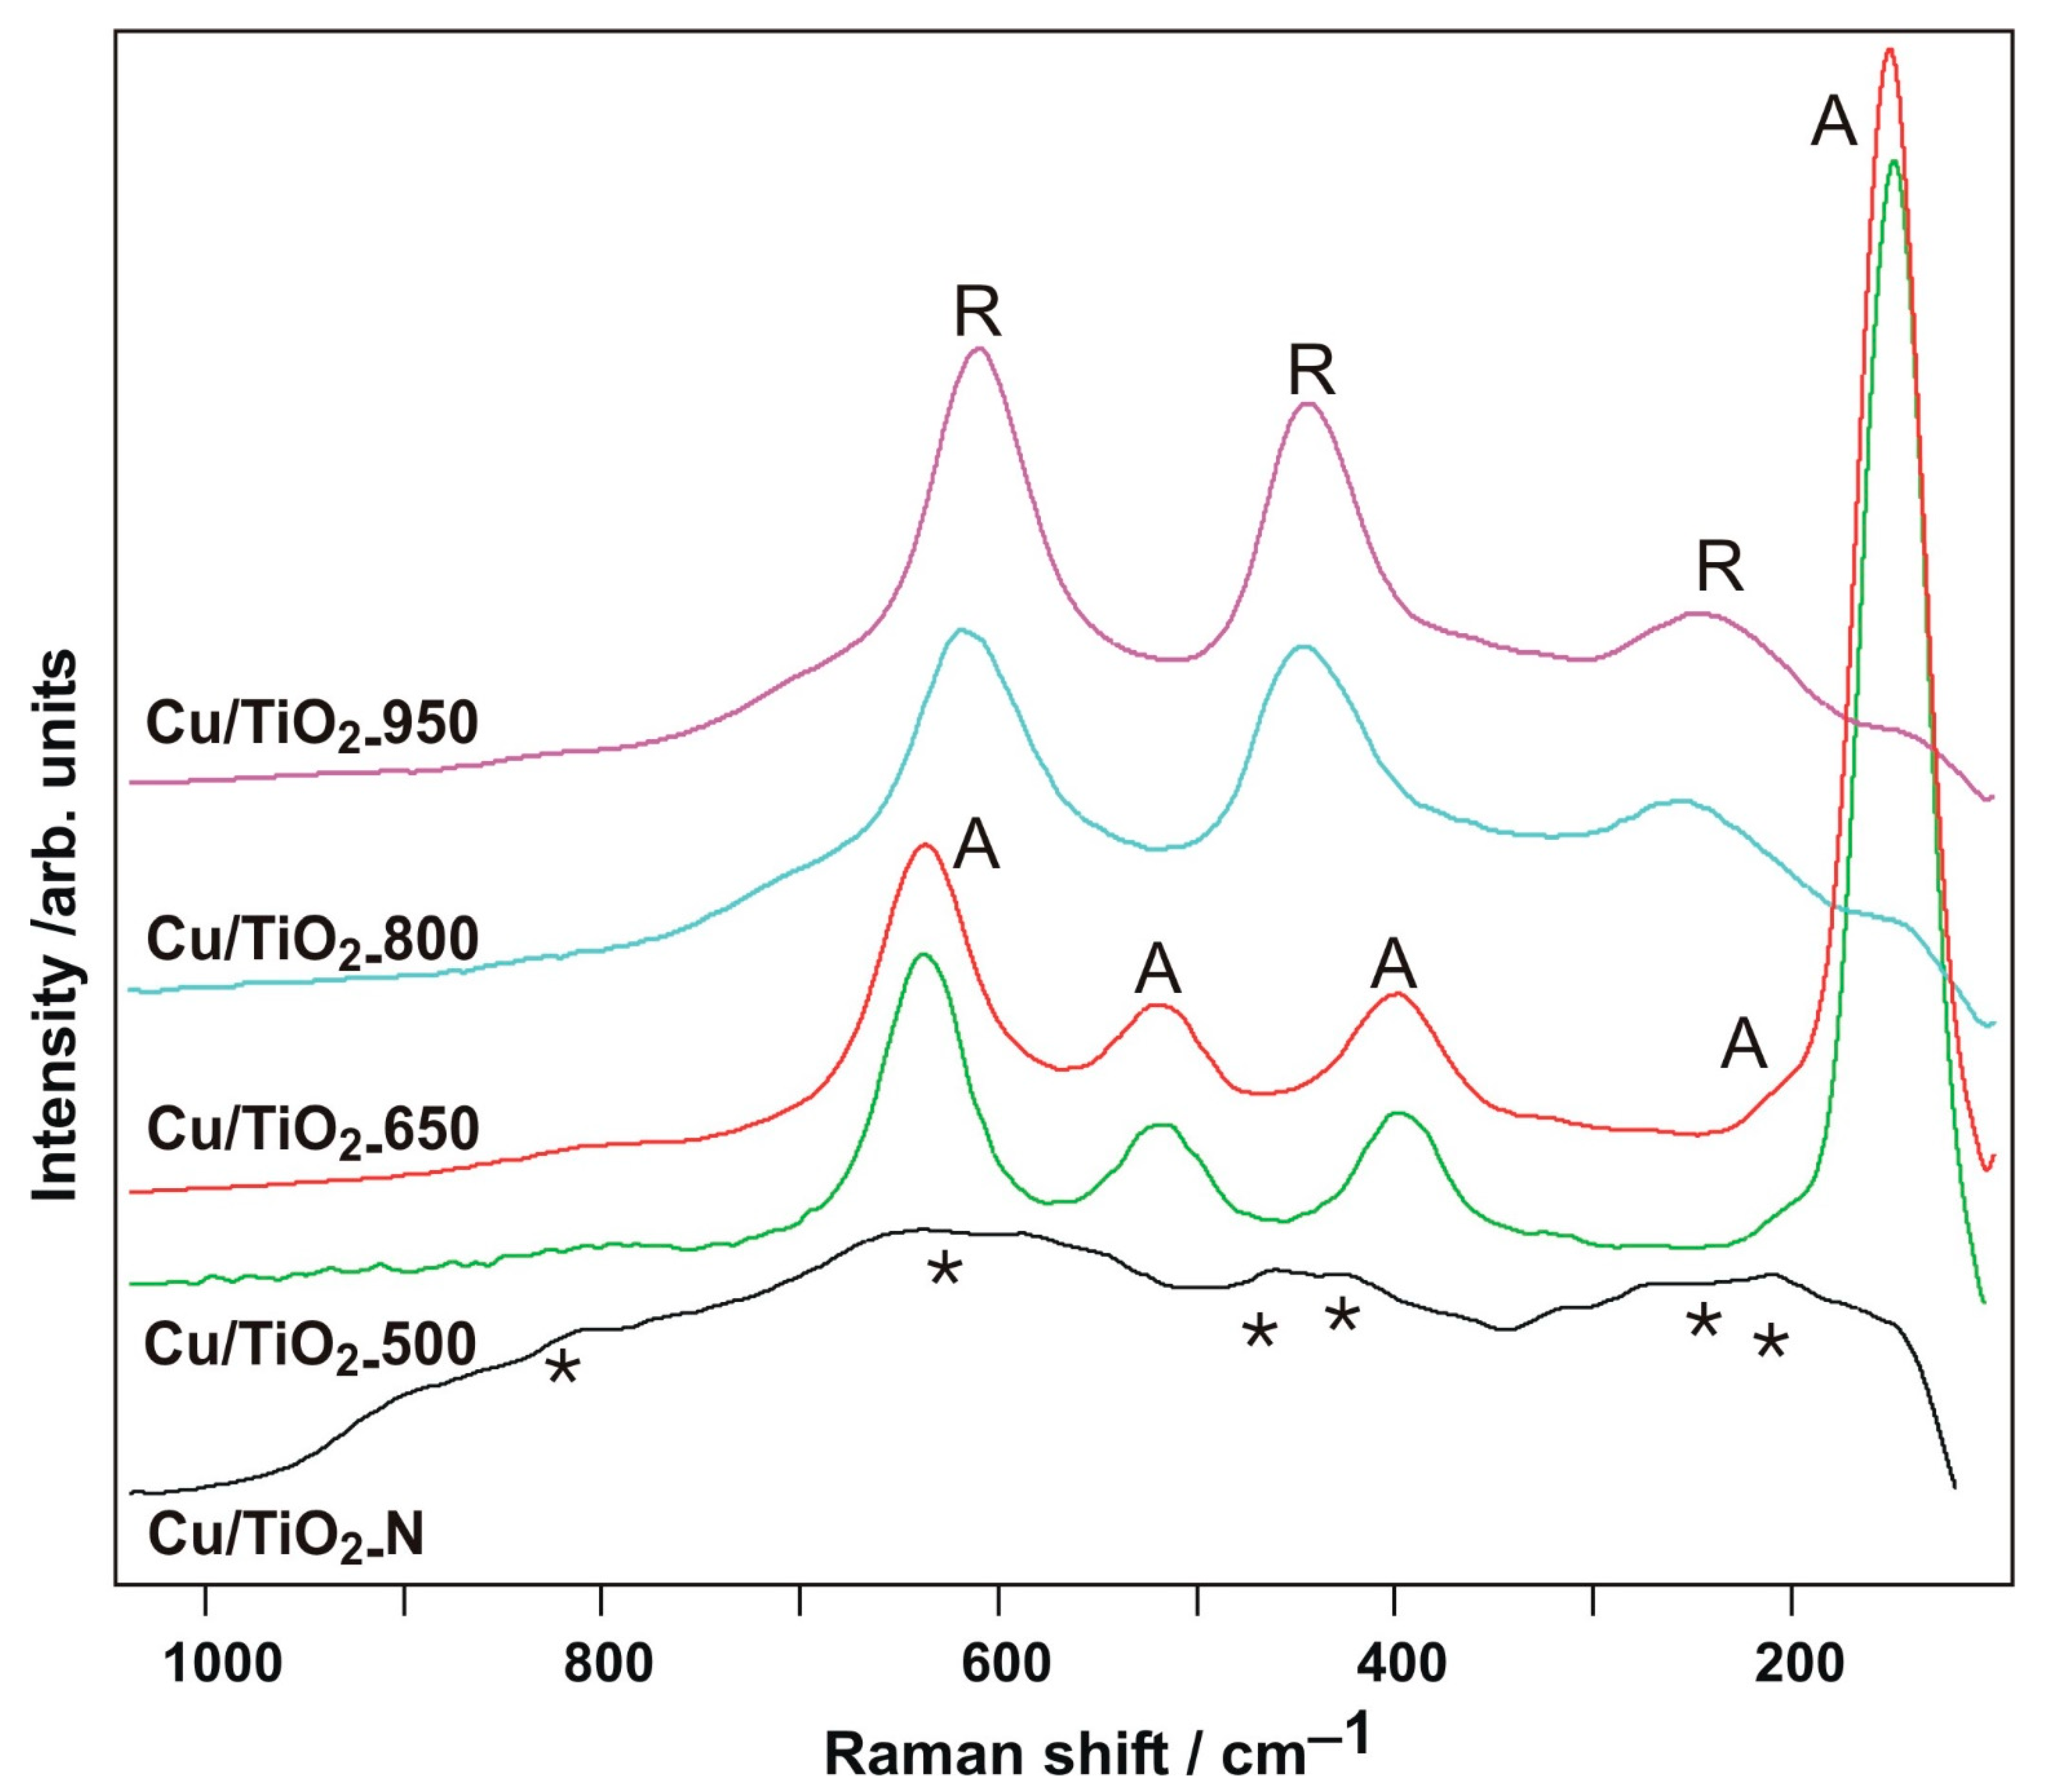
3.5. Raman Spectroscopy

As revealed by XRD, the Cu/TiO2_N is highly amorphous. The Raman spectrum of the sample shows broad convolution bands, typical for highly unoriented titania (Figure 11). The bands, marked by an asterisk were recognized in the TiO2(B) structures [40]. In the samples, annealed at 500 and 650 °C, five bands representing anatase vibration modes (3Eg + 2B1g + A1g) appear and confirm the XRD results. In the high-temperature samples (800 and 950 °C), the rutile structure has been proved by bands at 609, 444, and 243 cm−1. On the other hand, tenorite CuO observed as weak reflections in the XRD are not visible at expected 295 and 345 cm−1 due to low concentration of copper (Figure 11).

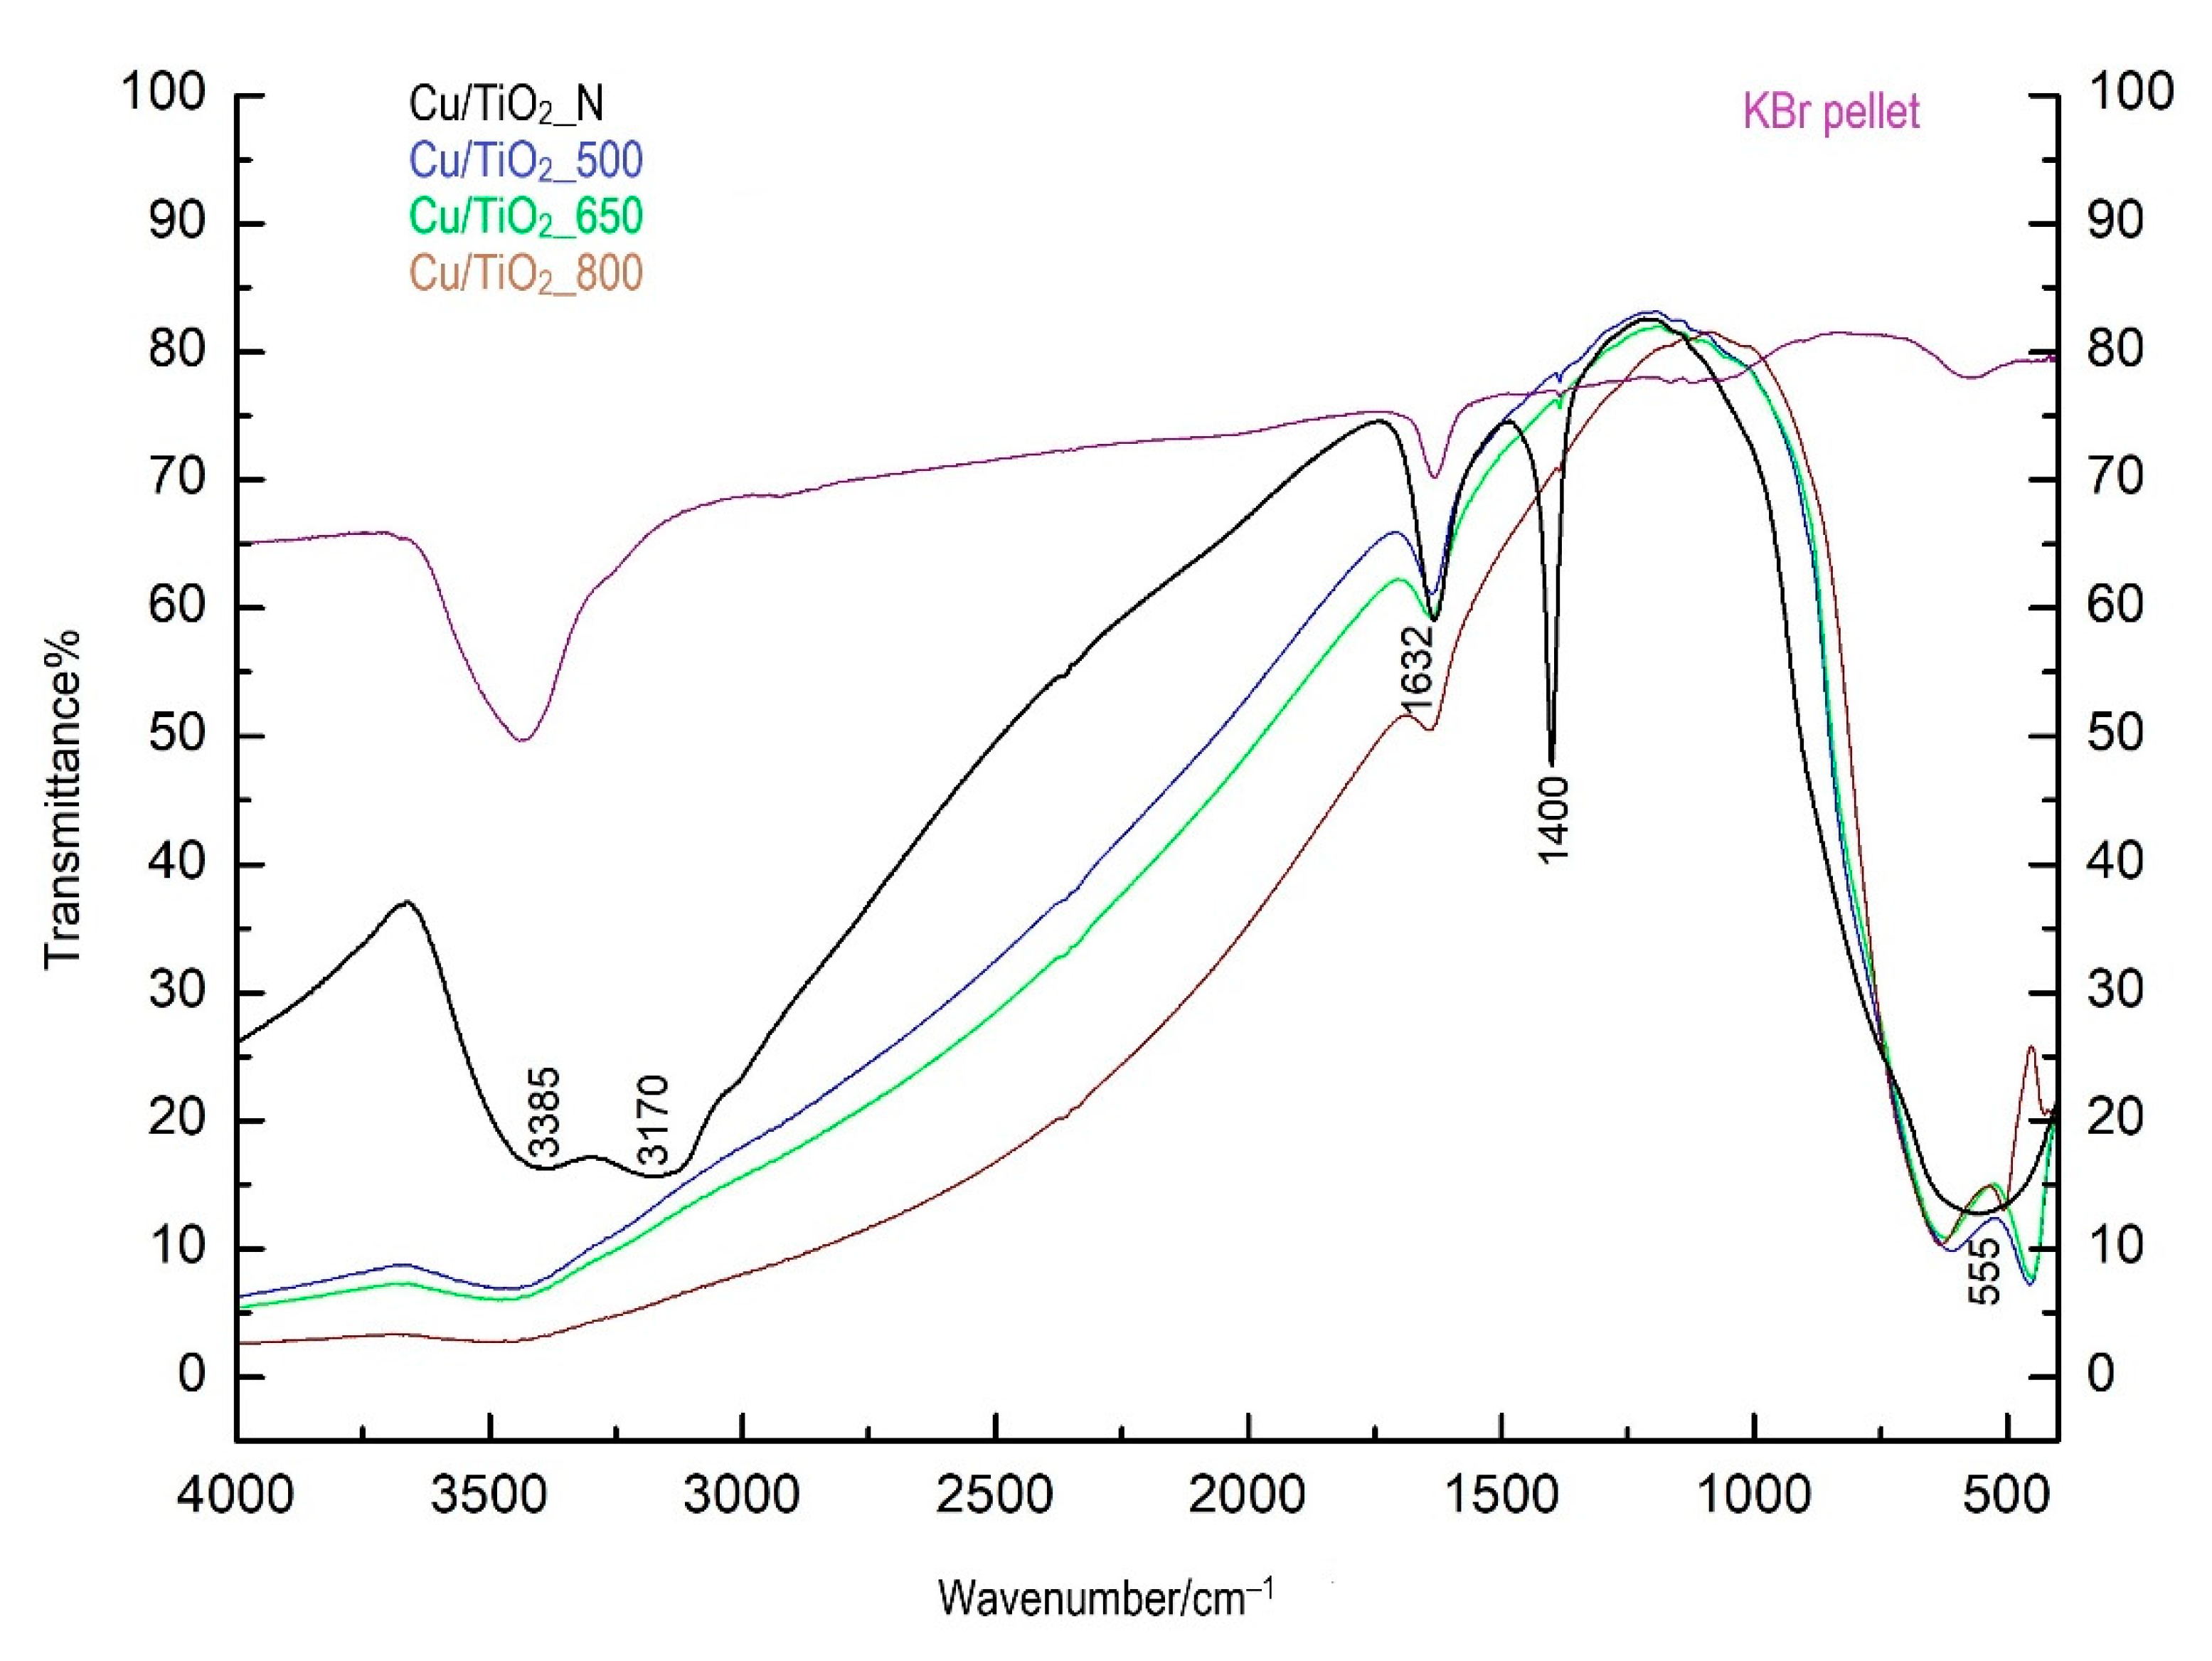
3.6. Fourier-Transform Infrared Spectroscopy

Figure 12 shows the infrared spectra of the examined samples annealed at temperatures of 500, 650, 800, and 950 °C, and nonannealed Cu/TiO2_N also. In the area above the wavenumber of 3000 cm−1, a wide absorption band with maxima at 3385 cm−1 is visible, which corresponds to the stretching vibration of water-bound on the surface of substances. Following the stretching vibration, the samples show a bending vibration at 1632 cm−1. The band visible at 3170 cm−1 belongs to the stretching vibration of the ammonium cation and the value of 1400 cm−1 belongs to its bending vibration, which is typical of ammonium salts. The presence of ammonium ions is related to the use of aqueous ammonia solution during the preparation of the default sample. The band position is also typical of nitrate anion, having weaker bands at 1050 and 830 cm−1, visible as shoulders in the as-prepared sample. Annealing of the Cu/TiO2_N leads to the disappearance of these bands due to the decomposition of ammonium nitrate. In the as-prepared sample, the formation of Ti–O, Ti–OH, and Ti–O–Ti bonds is demonstrated by a broadband at about 555 cm−1. In the annealed Cu/TiO2_500, Cu/TiO2_650, Cu/TiO2_800, and Cu/TiO2_950 MRs, two bands corresponding to Ti–O and Ti–O–Ti appear (620 and 470 cm−1 in the anatase structures, 660 and 500 cm−1 in the rutile structures).

3.7. Optical Spectroscopy Results

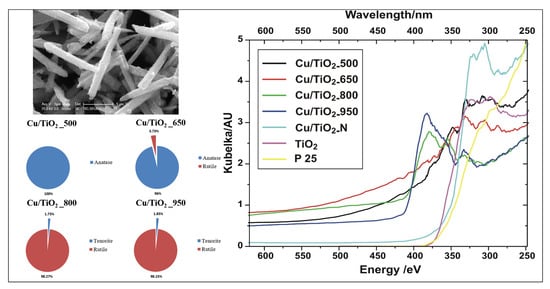
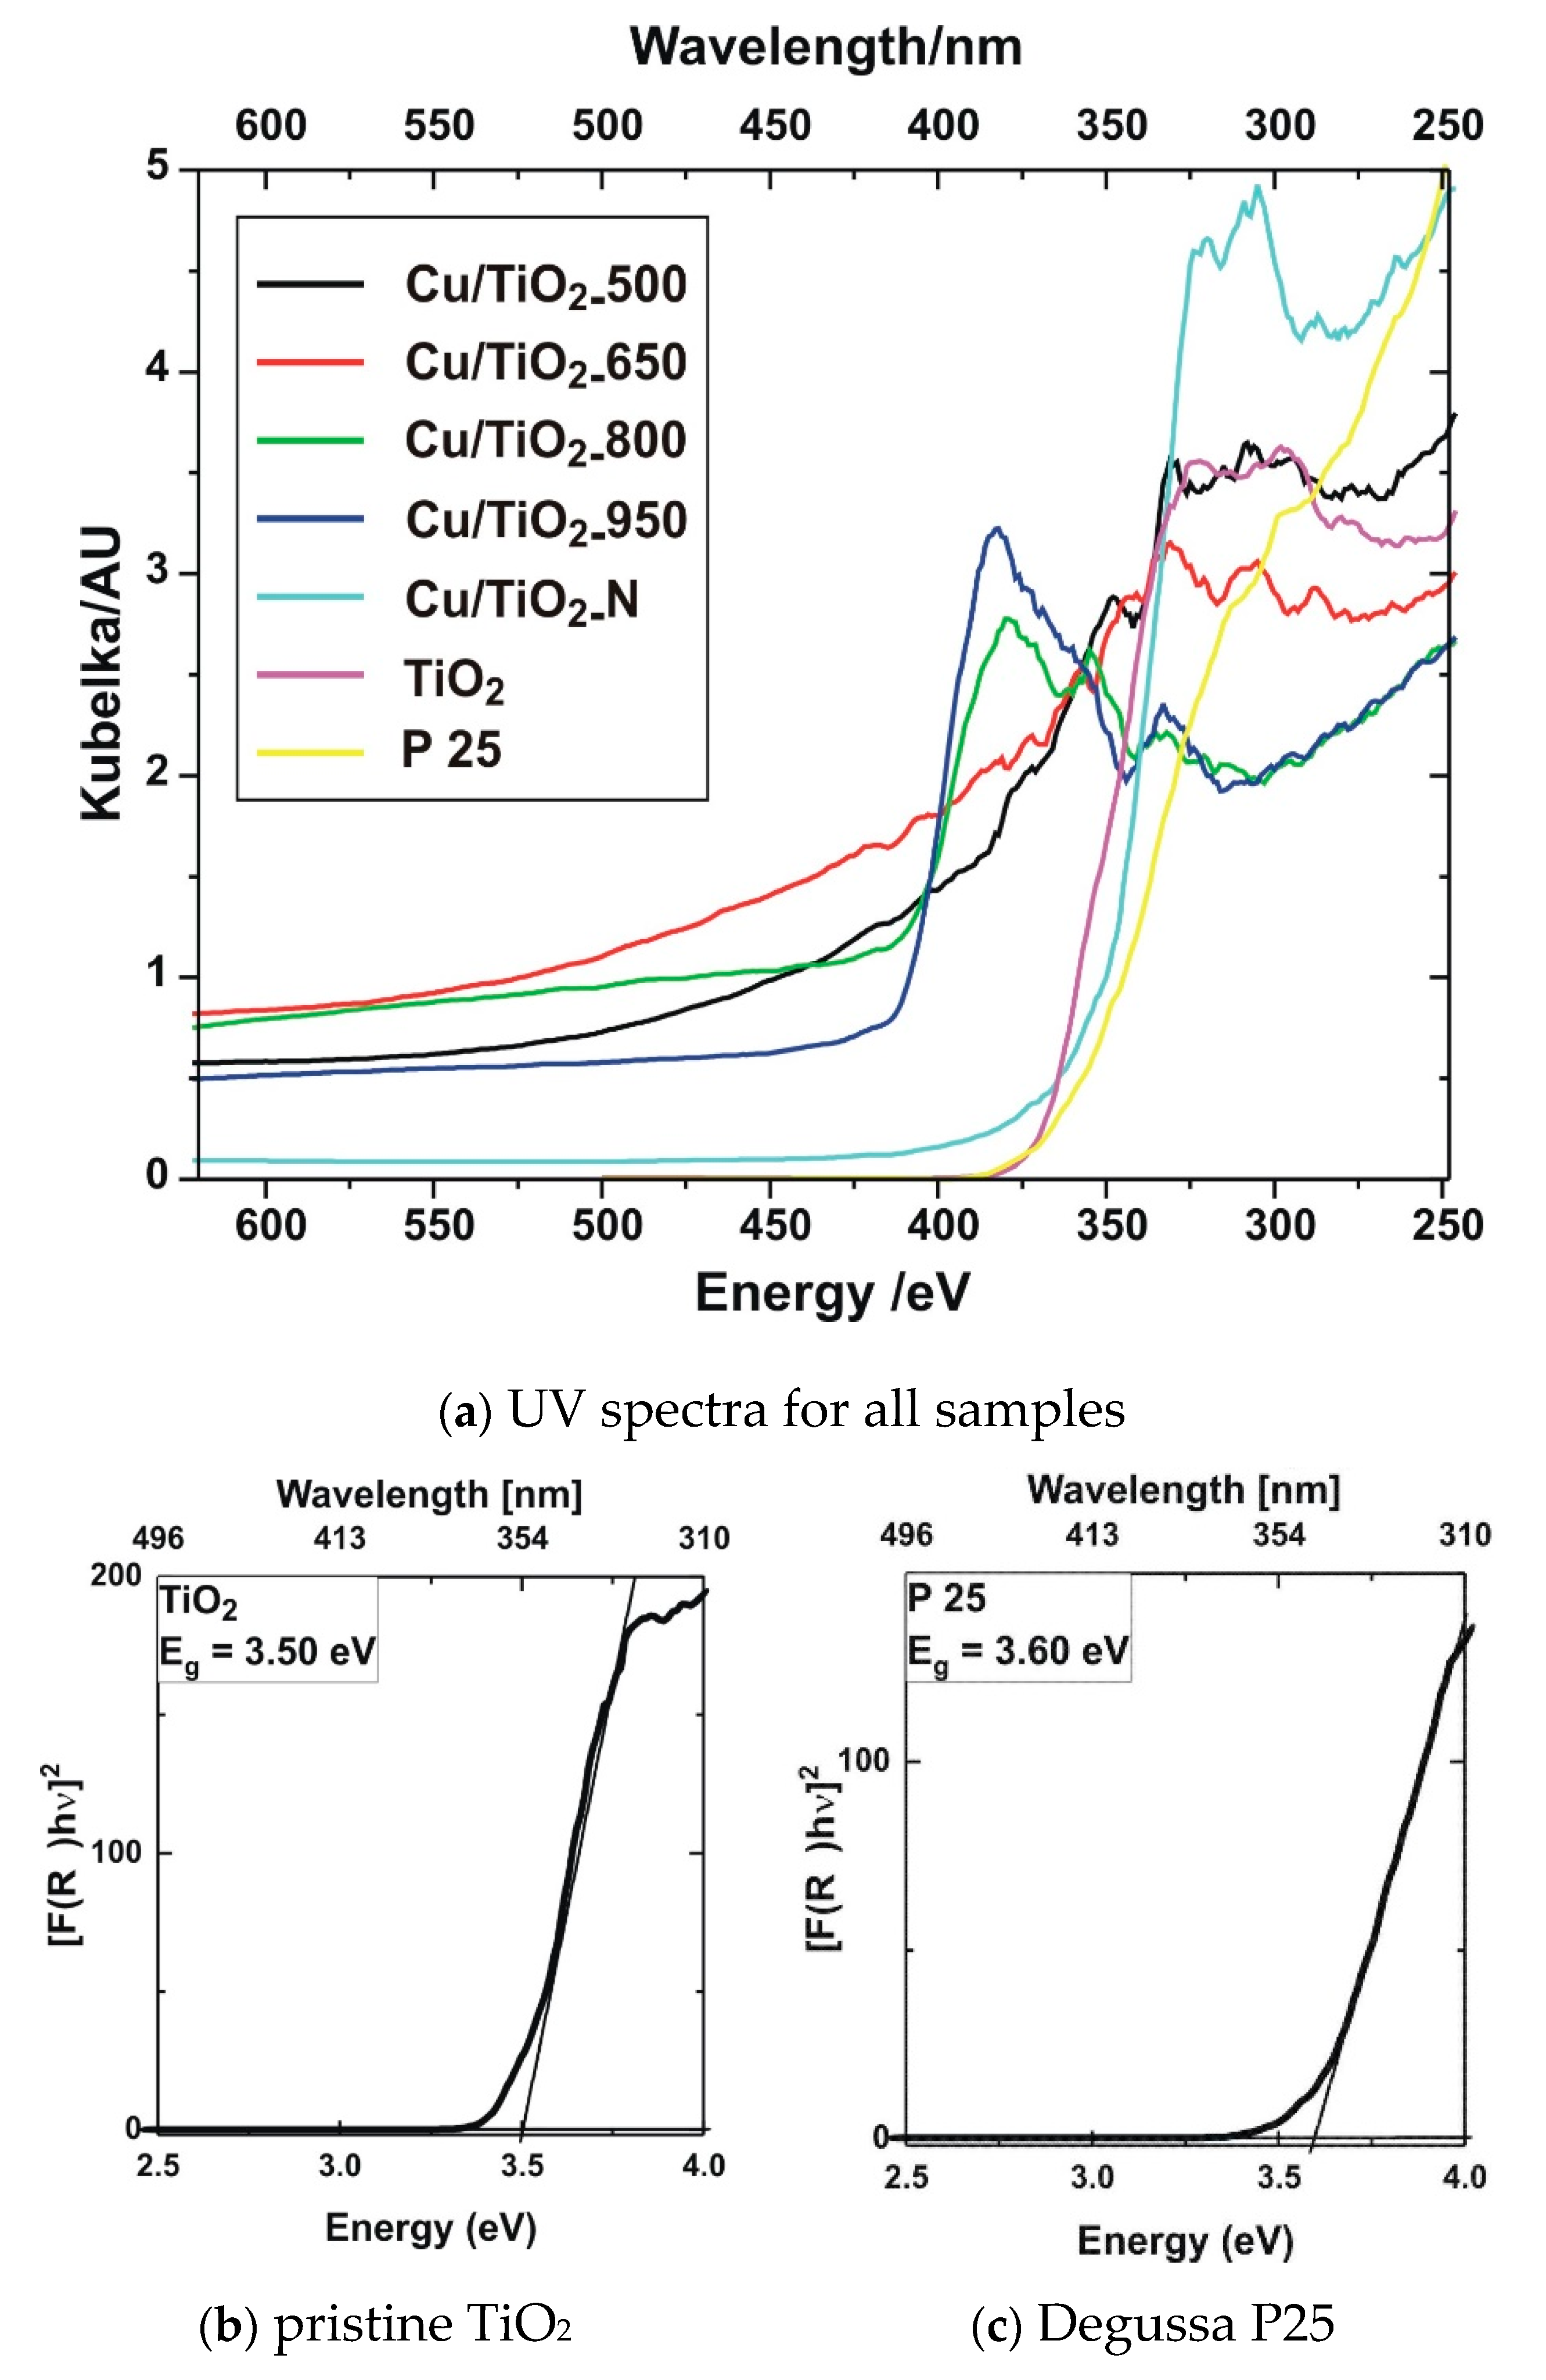
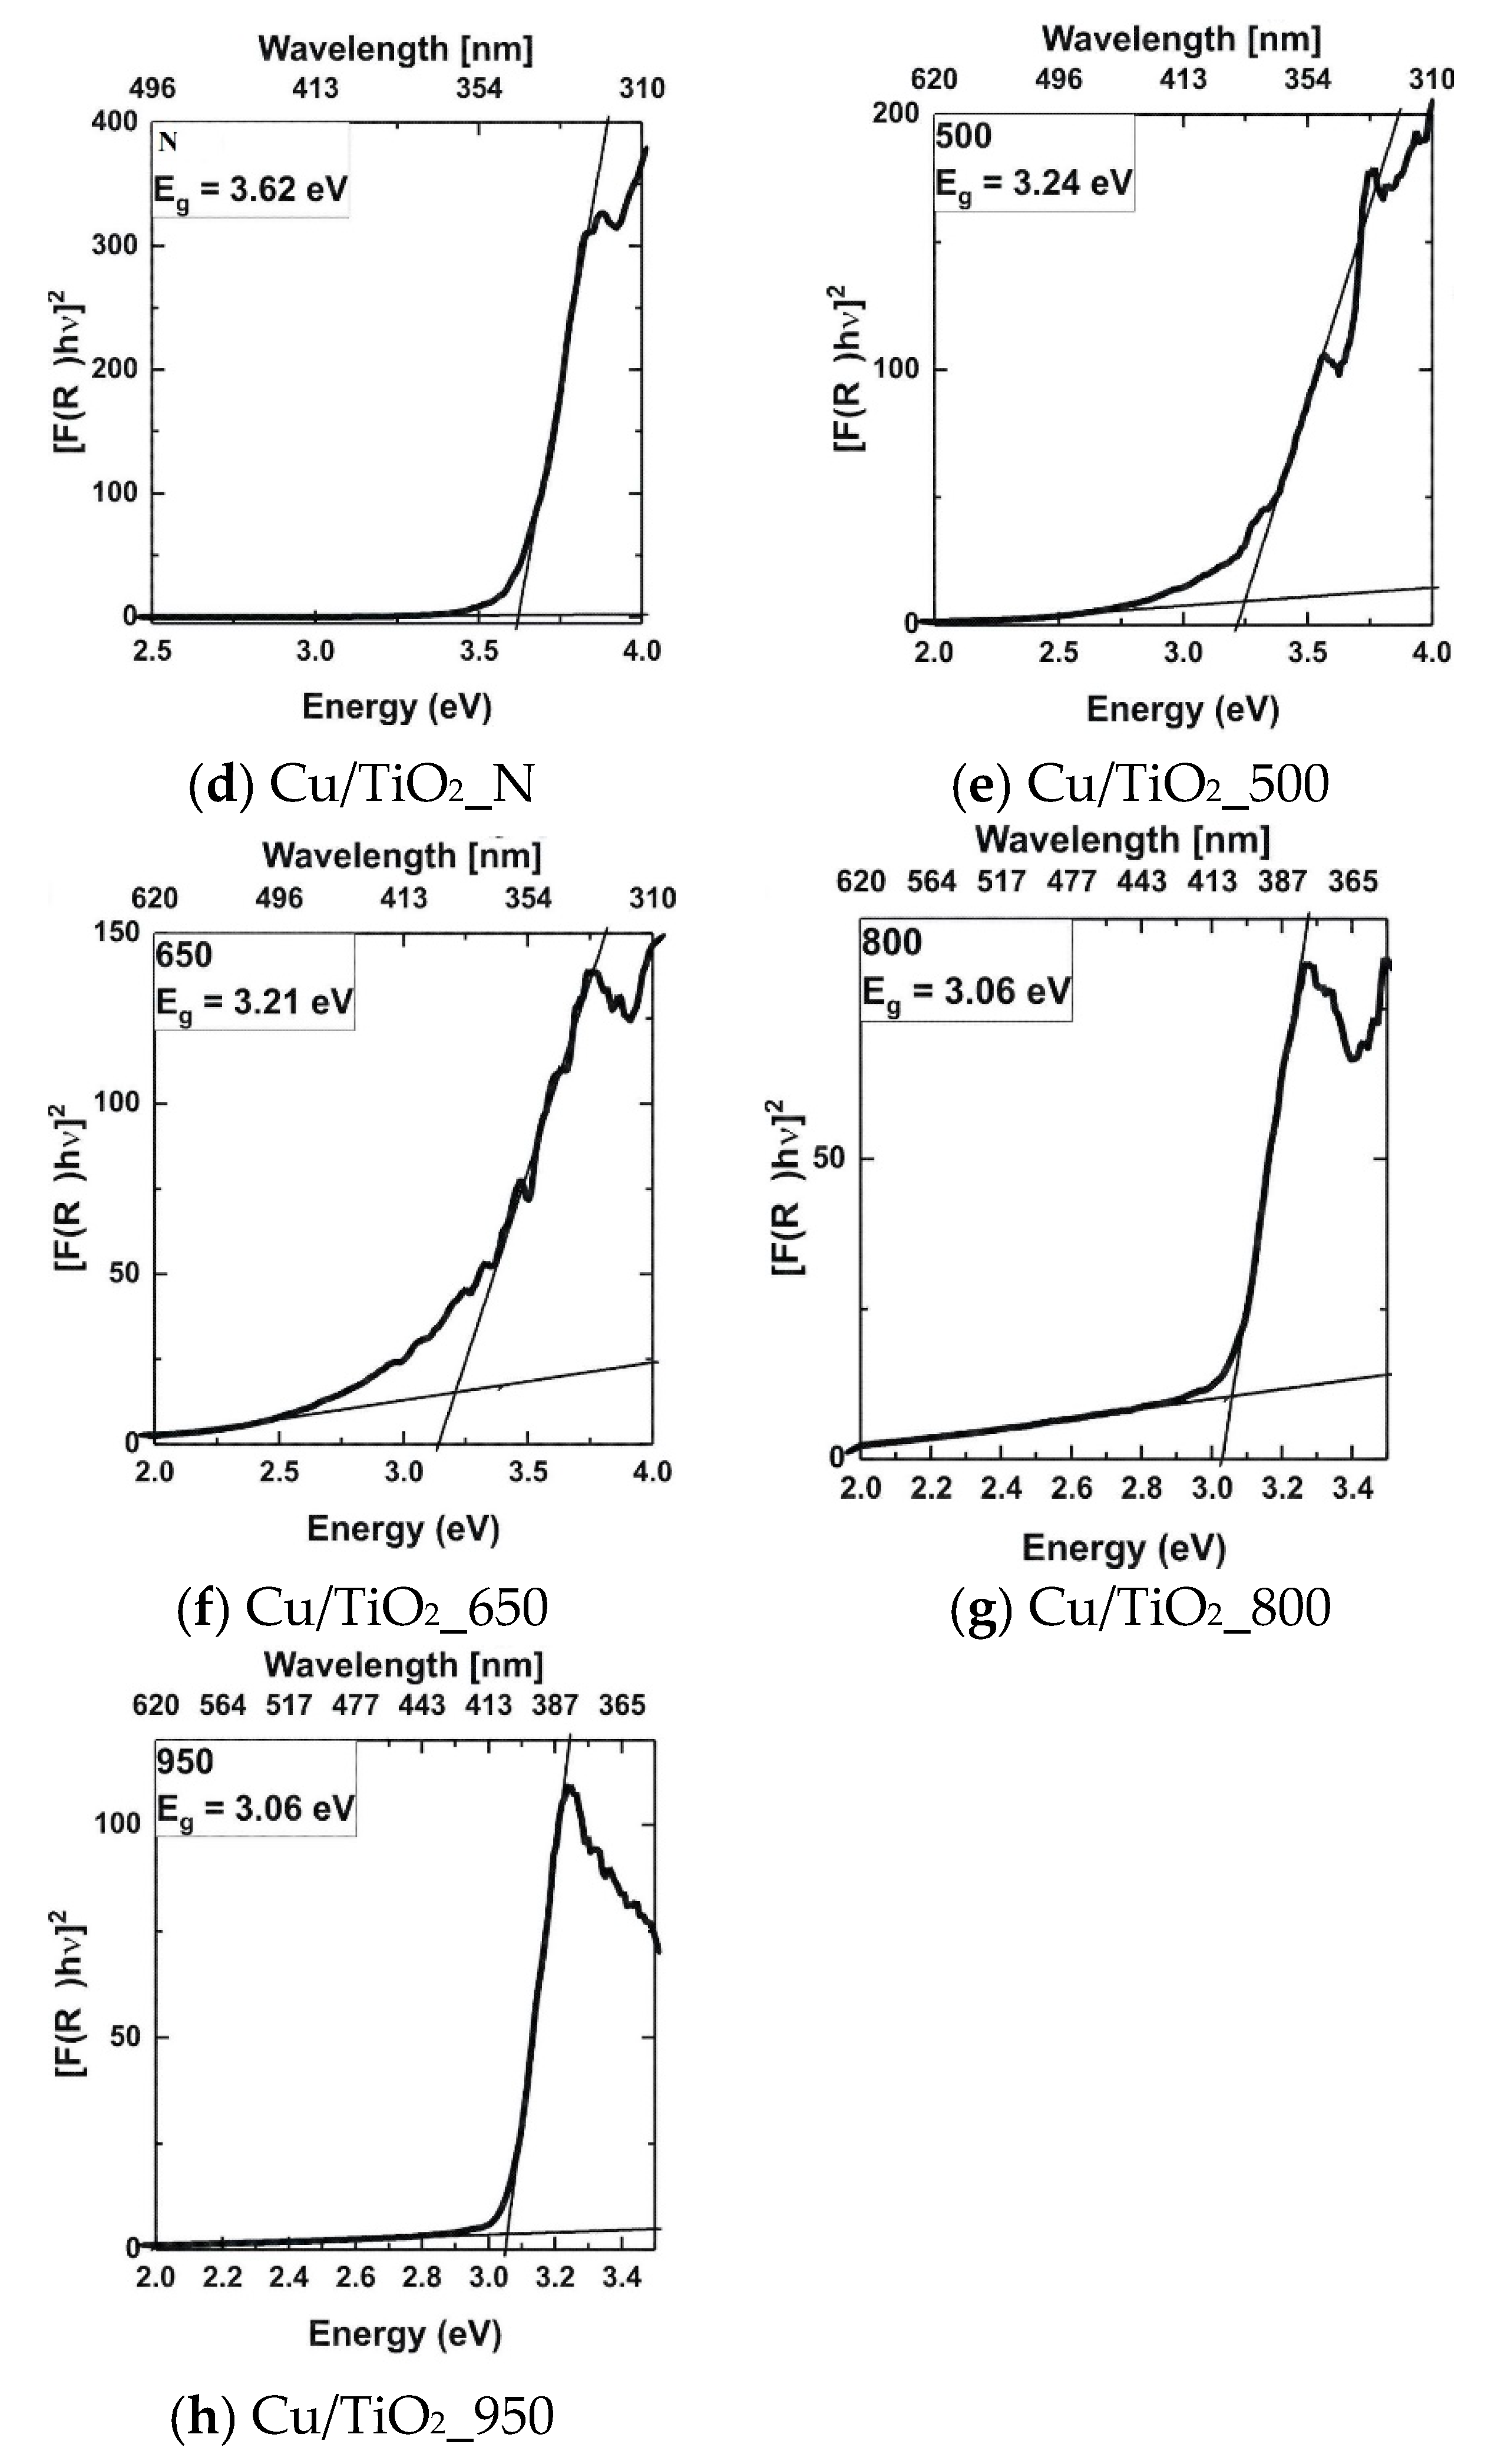
3.7.1. UV-Visible Analysis

UV-visible studies and direct bandgap estimation of the Cu/TiO2_N, Cu/TiO2_500, Cu/TiO2_650, Cu/TiO2_800 and Cu/TiO2_950 materials are shown in Figure 13a–h. Also, the results of the pristine 1D TiO2 MRs prepared by the same method and standard TiO2-P25 are presented for comparison.
All annealed materials show a clear red shift and absorption in the visible region. By increasing the temperature, considerable bandgap narrowing is observed as depicted in Figure 13e–h. The estimated band gap of pristine TiO2 was found to be 3.50 eV, whereas the band-gap of Cu/TiO2_500, Cu/TiO2_650, Cu/TiO2_800 and Cu/TiO2_950 is 3.24 eV, 3.21 eV, 3.06 and 3.06 eV, respectively. One plausible explanation for the bandgap narrowing could be the presence of Tii defects in TiO2 NCs [41]. It is reported that the formation of Tii is generally due to the preparation conditions and annealing under air [42]. Doping with 2 at.% Cu atom substitutes some of the Ti sites in the TiO2 lattice, which could lead to a strong d–p coupling between Cu and O, and to O 2p orbital upward movement, resulting in a reduction of the bandgap. Further, Cu 3d orbital could form an impurity band above the TiO2 valence band causes a reduction in the overall bandgap [43]. Since annealing at a temperature higher than that of 650 °C promoted the rutile polymorph formation, there is a high chance of having a defect contributed to the Eg as a result of structural transformation. Theoretical studies on metal-doped TiO2 predict also the formation of an empty band very close to the conduction band due to high vacancy concentrations [44]. From the absorption spectra, it is evident that the absorption edge of the TiO2_P25 material is near 347 nm, whereas the redshift associated with the Cu doping in Cu/TiO2_500 and Cu/TiO2_650 MRs may arise as a result of surface trap centers generated by Vo defect sites after Cu doping. Our results obtained by EDS analysis are in line with this observation. Recall, that Cu/TiO2_800 and Cu/TiO2_950 materials are mixtures with 98 wt.% of rutile and a small amount of CuO (see Table 1). To our knowledge, there are no publications have been reported on the optical properties of photocatalysts with such composition and structure. Both materials have shown a bandgap of 3.06 eV, which can be related to the different strategies of how the conduction-valence band edge changed from anatase to rutile structure. It is worth mentioning that CuO is a well-known p-type semiconductor owing to suitable direct bandgap energy (2.17 eV) and an optical gap (2.62 eV) predicting its application as a promising photocatalyst for visible light [43]. However, the photocatalytic efficiency of CuO has been low because of its even-parity symmetry of the conduction and valence band minimum states that prohibit the band edge radiative transition [45,46].

3.7.2. PEC Water Splitting

Photocatalytic activity of the synthesized Cu/TiO2_500, Cu/TiO2_650, Cu/TiO2_800, and Cu/TiO2_950 MRs was s quantitatively examined for H2 generation by PEC water splitting. Figure 14 shows the effect of Cu doping on photocatalytic activity under solar light irradiation. It is evident, that even a significant reduction of bandgaps, the Cu/TiO2_500, Cu/TiO2_650, Cu/TiO2_800, and Cu/TiO2_950 MRs did not satisfy the criteria for efficient photocatalysts and show weak H2 generation from H2O splitting.
PEC experiments were used to evaluate both the electrochemical (in the dark) and photoelectrochemical (under light irradiation) behavior of the prepared layers on FTO electrodes under the same experimental conditions. During the PEC experiment, the sample stabilization test was first performed, which is consisted of charging/discharging it in the dark This was followed by the experiment itself, where the sample was illuminated by a lamp that simulated the spectrum of the solar radiation with intensity 0.104 W/cm2. A dark test was then also performed. The photoactivity of the sample is then determined by comparing the test in the dark and under solar light. The voltammograms are shown in Figure 14, where two photoelectrochemical curves, namely the 2nd and 7th cycle are depicted. Higher cycles (8th–12th) show similar curves which means that system is relatively stable. The dark electrochemical curves do not show major differences and therefore only one typical curve is demonstrated.
The electrochemical curves are dominated by a peak at −0.51 V vs. Ag/AgCl reference electrode (−0.360 V against RHE), which is typical for oxidation Cu0 → Cu+ in the oxidation part of the curves. The reduction parts of the curves show broad reduction peaks between −0.4 and −0.6 V. The minima of these reduction peaks are shifted to the higher potential in comparison with the oxidation peak, which means that the oxidation/reduction process is not fully reversible. The PEC experiments were repeated 12 times and the curves were observed to shift due to oxidation/reduction processes in the samples. Under −0.6 V, evolving of gaseous hydrogen was observed on the platinum counter electrode. The highest activity was observed with the sample annealed at 650 °C (Cu/TiO2_650). In the corresponding voltammograms we observe the highest difference between dark and light curves, reaching about 1 mA. In the Cu/TiO2_650 sample, the lowest degree of Cu oxidation/reduction is proved by the weakest corresponding Cu/Cu+ peaks. In this sample, the photoelectrochemical activity is even improving with several cycles, while other samples show slowly decreasing photoactivity between 7th and 12th cycles. With increasing voltage, the current approaches zero, and voltages above +0.8 V induce releasing particles from the FTO substrates and damaging of the layers. Preparation of highly adhesive doped TiO2 films can solve loose binding between the substrate surface and TiO2. Due to this effect, there is not possible to achieve a higher potential to reversibly reduce copper oxides. The photoactivity of samples Cu/TiO2_500 and Cu/TiO2_800 is much weaker in comparison with Cu/TiO2_650 and it is gradually decreasing with the rising number of the PEC cycles. Except for non-reversible oxidation of Cu, low activity of the samples can be explained by (a) the rapid recombination of e and h+ due to the occupancy of active surface sites by the Cu atoms, (b) the surface nanocavities acting as point defects, which interrupt charge carrier transportation (instead of providing multiple reflections of the adsorbed light) and (c) photocorrosion suffering when materials are in contact with water (although that Cu doping manipulated the electronic structure of Cu/TiO2_500, Cu/TiO2_650, Cu/TiO2_800 and Cu/TiO2_950 materials). In recently published articles [47,48] the authors discussed how CuO based materials can be utilized for PEC hydrogen evolution: the reduction potential of p-type low bandgap CuO in aqueous electrolyte lies above the reduction potential of wateFr. This implies the possibility of a competitive reduction of water and the photoabsorber itself, leading to the formation of reduced copper species and metallic copper, and consequently to a significant change of the morphology of the photoabsorber due to photocorrosion. The abovementioned study reveals that the transformations taking place in copper (II) oxide electrodes, with special attention to the role of photo-induced electrons, are the most important points, which could be considered for a various copper amount (% of the Cu dopant). Yoong [7] reported that Cu dopant concentration and size range of Cu NPs (20 and 110 nm) are the main factors affecting the properties of Cu-doped TiO2 photocatalysts for hydrogen production under UV-Vis light irradiation. Among the dopant loading ranging from 2–15 wt.% on Degussa P25 TiO2, and annealing from 300 to 500 °C, it was observed that sample 10 wt.% Cu/TiO2/300 °C yielded the maximum hydrogen generation. In contrast to this work, Bandara et al [49] reported a copper loading of 7 wt.% into TiO2 to be the best photocatalyst for the reduction of H2O under sacrificial conditions (CH3OH scavenger for photoinduced holes). The amount of CuO and its crystalline structure were found to be crucial for the catalytic activity since the negative shift in the Fermi level was caused by an accumulation of excess electrons in CuO. It is worth mentioning that the concentration of Cu dopant strongly influenced the oxidation state of Cu species (Cu0, Cu2O, CuO), the rate of rutilization process, and photocatalytic properties of the Cu-TiO2 system. A report by Song et al. [50] documented that the evolution of Cu0 toward Cu1+ and Cu2+ progressively lead to a lowering in photocatalytic activity. Colon et al. [51] observed that 0.5 at.% Cu loading and annealing up to 600 °C led to the highest photocatalytic activity due to prevailing anatase phase, high surface area, and copper ions in form of Cu1+ as photoactive homogeneously dispersed Cu2O species into the anatase matrix. Stabilized Cu2O NPs are responsible for the improved electron transfer to the surface oxygen and further photocatalytic activity. According to XRD analysis, TiO2 systems with 1 at.% Cu showed lower anatase content; when Cu concentration is higher than that of 0.5 at.% then accelerated rutile microdomains are observed. Also, 1 at.% Cu content can generate CuO species; the existence of Cu2+ was considered as electron/hole recombination center, which progressively may deteriorate the photoactivity. Therefore, careful Cu amount loading and controlled Cu2+/Cu1+ redox reactions can adjust the satellite CuO/Cu2O structures, which participated in TiO2 photoreactivity [9].
We could suggest that 2 at.% Cu doping is not the optimum amount in TiO2 lattice to produce enhanced H2 generation for PEC water splitting. Modification of Cu dopant concentration, and involving of appropriate scavenger for photoinduced holes, maybe a more promising strategy for utilization of Cu-modified 1DTiO2 materials in PEC water splitting processes.

4. Conclusions

We have developed an original and green lyophilization based method for the synthesis of anatase TiO2 MRs doped with 2 wt.% Cu. We used a nitrogen-containing Cu(NO3)2 reagent as a source of Cu, reported to affect the photocatalytic activity of TiO2 [52]. A series of new materials with MRs morphology denoted as Cu/TiO2_500, Cu/TiO2_650, Cu/TiO2_800, and Cu/TiO2_950 were obtained after annealing at 500, 650, 800, and 950 °C from lyophilized 1DTiO2 MR precursor. We have found that the photocatalytic activity of Cu/TiO2_500, Cu/TiO2_650, Cu/TiO2_800, and Cu/TiO2_950 MRs is strongly dependent on their phase structure, crystallite size, specific surface areas, and pore structure. The substitution of 2 at.% Ti4+ with Cu2+ ions has a substantial influence on the materials’ optical and electronic properties. The optical bandgap of Cu/TiO2_500, Cu/TiO2_650, Cu/TiO2_800 and Cu/TiO2_950 MRs is reduced significantly. All materials show a clear red shift and absorption in the visible region. Although Cu doping modified the electronic structure of the Cu/TiO2_500, Cu/TiO2_650, Cu/TiO2_800, and Cu/TiO2_950 materials, all of them appeared slightly active during the PEC water splitting experiments. The PEC water splitting activity is decreasing in the order: Cu/TiO2_650 >> Cu/TiO2_500 > Cu/TiO2_800 >> Cu/TiO2_950. The low activity can be explained by (a) the rapid recombination of e and h+ due to the occupancy of active surface sites by the Cu atoms, deteriorating the chance of photoexcited e and h+ to participate in surface chemical reactions, (b) photocorrosion suffering due to contact with water [53] (c) nanocavities acting as recombination charge centers instead to confine light into their volume and (d) negligible specific surface area SBET (reduced from 10.8 to 2.7 m2g−1) with the rise of temperature, even preserved mesoporous structure.
We presented a detailed study on the surface properties of Cu-doped 1DTiO2 MRs to provide a better understanding of their chemical and physical properties and photocatalytic activity. In the future, our attention will be focused on the synthetic conditions for producing anatase doping with less than 2 wt.% Cu. Some computational works can also be provided due to predict the preparation conditions leading to an efficient photocatalyst, combining n-type TiO2 and p-type CuO, with eventual n-p junction conductivity.

Supplementary Materials

The following are available online at https://www.mdpi.com/2079-4991/11/2/324/s1, Figure S1: Results of thermal and MS analysis, Figure S2: Evolution of NO2 gas fragments by MS, Figure S3: Evolution of NO gas fragments by MS, Figure S4: Evolution of N2O gas fragments by MS, Figure S5: Evolution of NH3 gas fragments by MS, Figure S6: Evolution of N2 gas fragments by MS, Figure S7: Evolution of H2O fragments by MS, Figure S8: Evolution of CO2 gas fragments by MS, Figure S9: Evolution of CO gas fragments by MS, Figure S10: Evolution of SO2 gas fragments by MS.

Author Contributions

Conceptualization, F.M. and Z.P.; Methodology, S.M.; Software, N.M.; Validation, E.K., R.N. and A.L.; Formal Analysis, S.B. and I.J.; Investigation, S.M.; Resources, S.M.; Data Curation, T.B.; Writing—Original Draft Preparation, S.B.; Writing—Review & Editing, T.B.; Visualization, F.M.; Supervision, S.B.; Project Administration, S.B.; Funding Acquisition, S.B., R.F. and A.L. All authors have read and agreed to the published version of the manuscript.

Funding

This research is supported by the Czech Science Foundation (project No. 18-15613S).

Informed Consent Statement

Informed consent was obtained from all subjects involved in the study.

Data Availability Statement

Data is contained within the article or supplementary material.

Acknowledgments

The authors acknowledge the Research Infrastructure NanoEnviCz, supported by the Ministry of Education, Youth and Sports of the Czech Republic under Project No. LM2018124. Supported by the OP VVV Project Development of new nano and micro coatings on the surface of selected metallic materials NANOTECH ITI II. No CZ.02.1.01/0.0/0.0/18_069/0010045. Nanomaterials 11 00324 i001

Conflicts of Interest

There are no conflicts to declare.

References

  1. Klabunde, K.J.; Erickson, L.; Koper, O.; Richards, R. Review of Nanoscale Materials in Chemistry: Environmental Applications. Nanoscale Materials in Chemistry: Environmental Applications. ACS Symp. Ser. 2010, 1045, 1–13. [Google Scholar]
  2. Negishi, N.; Iyoda, T.; Hashimoto, K.; Fujishima, A. Preparation of Transparent TiO2 Thin Film Photocatalyst and Its Photocatalytic Activity. Chem. Lett. 1995, 9, 841–842. [Google Scholar] [CrossRef]
  3. Kudo, A.; Miseki, Y. Heterogeneous photocatalyst materials for water splitting. Chem. Soc. Rev. 2009, 38, 253–278. [Google Scholar] [CrossRef]
  4. Mor, G.K.; Shankar, K.; Pauloze, M.; Varghese, O.K.; Grimes, C.A. Highly Efficient Solar Cells using TiO2 Nanotube Arrays Sensitized with a Donor-Antenna Dye. Nano Lett. 2006, 6, 215–218. [Google Scholar] [CrossRef]
  5. Xu, H.; Jia, F.; Ai, Z.; Zhang, L. A General Soft Interface Platform for the Growth and Assembly of Hierarchical Rutile TiO2 Nanorods Spheres. Cryst. Growth Des. 2007, 7, 1216–1219. [Google Scholar] [CrossRef]
  6. Francioso, L.; Taurino, A.M.; Forleo, A.; Siciliano, P. TiO2 nanowires array fabrication and gas sensing properties. Sens. Actuators B 2008, 130, 70–76. [Google Scholar] [CrossRef]
  7. Yoong, L.; Chong, F.K.; Dutta, B.K. Development of copper-doped TiO2 photocatalyst for hydrogen production under visible light. Energy 2009, 34, 1652–1661. [Google Scholar] [CrossRef]
  8. Byrnea, C.; Moran, L.; Hermosilla, D.; Merayo, N.; Blanco, Á.; Rhatigan, S.; Hinder, S.; Ganguly, P.; Nolan, M.; Pillai, S.C. Effect of Cu doping on the anatase-to-rutile phase transition in TiO2 photocatalysts: Theory and experiments. Appl. Catal. B Environ. 2019, 246, 266–276. [Google Scholar] [CrossRef]
  9. Colon, G.; Maicu, M.; Hidalgo, M.C.; Navio, J.A. Cu-doped TiO2 systems with improved photocatalytic activity. Appl. Catal. B 2006, 67, 41–51. [Google Scholar] [CrossRef]
  10. Yadav, H.M.; Otari, S.V.; Koli, V.B.; Mali, S.S.; Hong, C.K.; Pawar, S.H.; Delekar, S.D. Preparation and characterization of copper-doped anatase TiO2 nanoparticles with visible light photocatalytic antibacterial activity. J. Photochem. Photobiol. A Chem. 2014, 280, 32–38. [Google Scholar] [CrossRef]
  11. Wong, R.S.; Feng, J.; Hu, X.; Yue, P.L. Discoloration and mineralization of non-biodegradable azo dye orange II by copper-doped TiO2 nanocatalysts. J. Environ. Sci. Health 2004, 39, 2583–2595. [Google Scholar] [CrossRef] [PubMed]
  12. Lalitha, K.; Sadanandam, G.; Kumari, V.D.; Subrahmanyam, M.; Sreedhar, B.; Hebalkar, N.Y. Highly stabilized and finely dispersed Cu2O/TiO2: A promising visible sensitive photocatalyst for continuous production of hydrogen from glycerol: Water mixtures. J. Phys. Chem. 2010, 114, 22181–22189. [Google Scholar] [CrossRef]
  13. Momeni, M.M.; Ghayeb, Y.; Ghonchegi, Z. Fabrication and characterization of copper doped TiO2 nanotube arrays by in situ electrochemical method as efficient visiblelight photocatalyst. Ceram. Int. 2015, 41, 8735–8741. [Google Scholar] [CrossRef]
  14. Nishikiori, H.; Sato, T.; Kubota, S.; Tanaka, N.; Shimizu, Y.; Fujii, T. Preparation of Cudoped TiO2 via refluxing of alkoxide solution and its photocatalytic properties. Res. Chem. Intermed. 2012, 38, 595–613. [Google Scholar] [CrossRef] [Green Version]
  15. Mathew, S.; Ganguly, P.; Rhatigan, S.; Kumaralev, V.; Byrne, C.; Hinder, S.; Bartlett, J.; Nolan, M.; Pillai, S. Cu-Doped TiO2: Visible Light Assisted Photocatalytic Antimicrobial Activity. Appl. Sci. 2018, 11, 2067. [Google Scholar] [CrossRef] [Green Version]
  16. Obregon, S.; Munoz-Batista, M.; Fernandez-Garcia, M.; Kubacka, A.; Colon, G. Cu/TiO2 system for the photocatalytic H2 production: Influence of structural and surface support features. Appl. Catal. B Environ. 2015, 176, 468–478. [Google Scholar] [CrossRef]
  17. Bensouici, F.; Bououdina, M.; Dakhel, A.; Tala-Ighil, R.; Tounane, M.; Iratni, A.; Souier, T.; Liu, S.; Cai, W. Optical, structural and photocatalytic properties of Cu doped TiO2 thin films. Appl. Surf. Sci. 2017, 395, 110–116. [Google Scholar] [CrossRef]
  18. Wang, C.; Hu, Q.; Huang, J.; Zhu, C.; Deng, Z.; Shi, H.; Wu, L.; Liu, Z.; Cao, Y. Enhanced hydrogen production by water splitting using Cu doped TiO2 film with prefered (001) orientation. Appl. Surf. Sci. 2014, 292, 161–164. [Google Scholar] [CrossRef]
  19. Hernández, J.V.; Coste, S.; Murillo, A.G.; Romo, F.C.; Kassiba, A. Effects of Metal Doping (Cu, Ag, Eu) on the Electronic and Optical Behavior of Nanostructured TiO2. J. Alloy. Compd. 2017, 710, 355–363. [Google Scholar] [CrossRef]
  20. Bakardjieva, S.; Mares, J.; Fajgar, R.; Zenou, V.; Maleckova, M.; Chatzisymeon, E.; Bibova, H.; Jirkovsky, J. The relationship between microstructure and photocatalytic behavior in lanthanum-modified 2D TiO2 nanosheets upon annealing of a freeze-cast precursor. RSC Adv. 2019, 9, 22988–23003. [Google Scholar] [CrossRef] [Green Version]
  21. Mamon, F.; Fajgar, R.; Jandova, V.; Koci, E.; Jakubec, I.; Zhigunov, A.; Brovdyova, T.; Bakardjieva, S. TiO2 microrods with stacked 3D nanovoids for photoelectrochemical water splitting. Pure Appl. Chem. 2019, 91, 1733–1747. [Google Scholar] [CrossRef]
  22. Stengl, V.; Bakardjieva, S. Molybdenum-doped anatase and its extraordinary photocatalytic activity in the degradation of Orange II in the UV and Vis regions. J. Phys. Chem. C 2010, 114, 19308–19317. [Google Scholar] [CrossRef]
  23. Zenou, V.; Bakardjieva, S. Microstructural analysis of undoped and moderately Sc doped TiO2 anatase nanoparticles using Scherre equation and debye function analysis. Mater. Charact. 2018, 144, 287–296. [Google Scholar] [CrossRef]
  24. Volfova, L.; Plizingrova, E.; Ecochard, P.; Motlochova, M.; Klementova, M.; Janosikova, P.; Bezdicka, P.; Kupcik, J.; Krysa, J.; Lančok, A.; et al. Tailoring Photocatalytic Activity of TiO2 Nanosheets by 57Fe. J. Phys. Chem. C. 2020, 124, 6669–6682. [Google Scholar] [CrossRef]
  25. Zenou, V.; Bertolotti, F.; Guagliardi, A.; Toby, B.H.; Dreele, R.V.; Bakardjieva, S. In situ high temperature X ray diffraction study of Sc-doped titanium oxide nanocrystallites. J. Appl. Cryst. 2020, 53, 1452–1461. [Google Scholar] [CrossRef]
  26. Labar, J.L. Consistent indexing of a (set of) single crystal SAED pattern(s) with the ProcessDiffraction program. Ultramicroscopy 2005, 103, 237–249. [Google Scholar] [CrossRef]
  27. Colón, G.; Hidalgo, M.C.; Navío, J.A. Effect of ZrO2 incorporation and calcination temperature on the photocatalytic activity of commercial TiO2 for salicylic acid and Cr (VI) photodegradation. Appl. Catal. A Gen. 2002, 231, 185–189. [Google Scholar] [CrossRef]
  28. Satuf, M.L. Photocatalytic degradation of 4-chlorophenol: A kinetic study. Appl. Catal. B Environ. 2008, 82, 37–49. [Google Scholar] [CrossRef]
  29. Grätzel, M.; Serpone, N.; Pelizzetti, E. Kinetic studies in heterogeneous photocatalysis. 2. Titania-mediated degradation of 4-chlorophenol alone and in a three-component mixture of 4-chlorophenol, 2,4-Dichlorophenol, and 2,4,5-Trichlorophenol in Air-Equilibrated Aqueous Media. Langmuir 1989, 5, 250–255. [Google Scholar]
  30. Shannon, R. Revised effective ionic radii and systematic studies of interatomic distances in halides and chalcogenides. Acta Crystallogr. Sect. A 1976, 32, 751–767. [Google Scholar] [CrossRef]
  31. Scherrer, P. Bestimmung der Größe und der inneren Struktur von Kolloidteilchen mittels Röntgenstrahlen. In Kolloidchemie Ein Lehrbuch; Springer: Heidelberg/Berlin, Germany, 1912; pp. 387–409. [Google Scholar]
  32. Ranade, M.R.; Navrotsky, A.; Zhang, H.Z.; Banfield, J.F.; Elder, S.H.; Zaban, A.; Borse, P.H.; Kulkarni, S.K.; Doran, G.S.; Whitfield, H.J. Energetics of nanocrystalline TiO2. PNAS. Proc. Natl. Acad. Sci. USA 2002, 99, 6476–6481. [Google Scholar] [CrossRef] [Green Version]
  33. Hanaor, D.; Sorrell, C. Review of the anatase to rutile phase transformation. J. Mater. Sci. 2011, 46, 855–874. [Google Scholar] [CrossRef] [Green Version]
  34. Zhu, H.; Tao, J.; Dong, X. Preparation and Photochemical activity of Cr-doped TiO2 nanorods with nanocavities. J. Phys. Chem. C 2010, 114, 2873–2879. [Google Scholar] [CrossRef]
  35. Kumar, D.P.; Reddy, N.L.; Kumari, M.M.; Srinivas, B.; Kumari, V.D.; Sreedhar, B.; Roddatis, V.; Bondarchuk, O.; Karthik, M.; Neppolian, B.; et al. Cu2O-sensitized TiO2 nanorods with nanocavities for highly efficient photocatalytic hydrogen production under solar irradiation. Sol. Energy Mater. Sol. Cells 2015, 136, 157–166. [Google Scholar] [CrossRef]
  36. Westen, T.V.; Groot, R. Effect of temperature Cycling on Qswald Ripening. Cryst. Growth Des. 2018, 18, 4952–4962. [Google Scholar] [CrossRef] [PubMed] [Green Version]
  37. Ostwald, W.Z. Biomolecule-assisted synthesis of cobalt sulfide nanowires for application in supercapacitors. J. Phys. Chem. 1900, 34, 495–503. [Google Scholar]
  38. Aleman, J.; Chadwick, A.V.; He, J.; Hess, M.; Horie, K.; Jones, R.G. Definitions of terms relating to the structure and processing of sols, gels, networks, and inorganic-organic hybrid materials. Pure Appl. Chem. 2007, 79, 1801–1827. [Google Scholar] [CrossRef]
  39. Zhao, Q. Advanced Nanomaterials for Pollutant Sensing and Environmental Catalysis. In Micro Nano Technologies, 1st ed.; Elsevier: Liaoning, China, 2020; p. 442. ISBN 9780128147962. [Google Scholar]
  40. Fu, N.; Wu, Y.; Jin, Z.; Li, G. Structural dependent photoactivities of TiO2 nanoribbon for visible light induced H2 evolution: The role of nanocavities and alternate structutes. Langmuir 2010, 26, 447–455. [Google Scholar] [CrossRef]
  41. Akshay, V.R.; Arun, B.; Mandal, G.; Chanda, A.; Vasundhara, M. Significant reduction in the optical band-gap and defect assisted magnetic response in Fe-doped anatase TiO2 nanocrystals as dilute magnetic semiconductors. New J. Chem. 2019, 43, 6048–6062. [Google Scholar] [CrossRef]
  42. Santara, B.; Giri, P.K.; Imakita, K.; Fujii, M. Evidence for Ti Interstitial Induced Extended Visible Absorption and Near Infrared Photoluminescence from Undoped TiO2 Nanoribbons: An In Situ Photoluminescence Study. J. Phys. Chem. C 2013, 117, 23402–23411. [Google Scholar] [CrossRef]
  43. Kale, G.; Arbuj, S.; Chothe, U.; Khore, S.; Nikam, L.; Kale, B. Highly Crystalline Ordered Cu-doped TiO2 Nanostructure by Paper Templated Method: Hydrogen Production and Dye Degradation under Natural Sunlight. J. Compos. Sci. 2020, 4, 48. [Google Scholar] [CrossRef]
  44. Justicia, I.; Ordejon, P.; Canto, G.; Mozos, J.L.; Fraxedes, J.; Battiston, G.A.; Gerbasi, R.; Figueras, A. Designed Self-Doped Titanium Oxide Thin Films for Efficient Visible-Light Photocatalysis. Adv. Mater. 2002, 14, 1399–1402. [Google Scholar] [CrossRef]
  45. Barreca, D.; Fornasiero, P.; Gasparotto, A.; Gombac, V.; Maccato, C.; Montini, T. The potential of supported Cu2O and CuO nanosystems in photocatalytic H2 production. Chemsuschem 2009, 23, 30–33. [Google Scholar]
  46. Lim, Y.F.; Chua, C.S.; Lee, C.J.J.; Chi, D. Sol-gel deposited Cu2O and CuO thin films for photocatalytic water splitting. Phys. Chem. Chem. Phys. 2014, 16, 25928–25934. [Google Scholar] [CrossRef] [PubMed]
  47. Shaislamov, U.; Lee, H.J. Synthesis and photoelectrochemical properties of a novel CuO/ZnO nanorod photocathode for solar hydrogen generation. J. Korean Phys. Soc. 2016, 69, 1242–1246. [Google Scholar] [CrossRef]
  48. Kampmann, J.; Betzler, S.; Hajizani, H.; Haringer, S.; Beetz, M.; Harzer, T.; Kraus, J.; Lotsch, B.; Scheu, C.; Pantcheva, R.; et al. How photocorrosion can trick you: A detailed study on lowbandgap Li doped CuO photocathodes for solar hydrogen production. Nanoscale 2020, 12, 7766–7775. [Google Scholar] [CrossRef]
  49. Bandara, J.; Udawatta, C.; Rajapakse, C. Highly stable CuO incorporated TiO2 catalyst for photocatalytic hydrogen production from H2O. Photochem. Photobiol. Sci. 2005, 4, 857–861. [Google Scholar] [CrossRef]
  50. Song, K.Y.; Kwon, Y.T.; Choi, G.J.; Lee, W.I. Photocatalytic activity of Cu/TiO2 with the oxidation state of surface-loaded copper. Bull. Korean Chem. Soc. 1999, 20, 957. [Google Scholar]
  51. Colon, G. Towards the hydrogen production by photocatalysis. Appl. Catal. A Gen. 2016, 518, 48–59. [Google Scholar] [CrossRef]
  52. Fisher, M.B.; Keane, D.A.; Fernandez-Ibanez, P.; Colreavy, J.; Hinder, S.J.; McGuigan, K.G.; Pillai, S.C. Nitrogen and copper doped solar light active TiO2 photocatalysts for water decontamination. Appl. Catal. B 2013, 130, 8–13. [Google Scholar] [CrossRef] [Green Version]
  53. Xing, H.; Guo, L.E.Z.; Zhao, D.; Li, X.; Liu, Z. Exposing the photocorrosion mechanism and control strategies of a CuO photocathode. Inorg. Chem. Front. 2019, 6, 2488–2499. [Google Scholar] [CrossRef]
Scheme 1. Synthetic method for the preparation of precursor Cu/TiO2_N and Cu/TiO2_500, Cu/TiO2_650, Cu/TiO2_800 and Cu/TiO2_950 materials.
Nanomaterials 11 00324 sch001
Figure 1. X-ray patterns of Cu/TiO2_N, Cu/TiO2_500, Cu/TiO2_650, Cu/TiO2_800 and Cu/TiO2_950 MRs.
Nanomaterials 11 00324 g001
Figure 2. Percentage charts of phases in Cu/TiO2_500, Cu/TiO2_650, Cu/TiO2_800 and Cu/TiO2_950. Samples in each stage of annealing temperature.
Nanomaterials 11 00324 g002
Figure 3. SEM images of the Cu/TiO2_500 sample, (a) Cu/TiO2_500 at low magnification (b) Cu/TiO2_500 detail from red boxed area in Figure 3a.
Nanomaterials 11 00324 g003
Figure 4. SEM images of the Cu/TiO2_650 sample, (a) Cu/TiO2_650 with a magnification of 12,000×, (b) Cu/TiO2_650 detail from red boxed area.
Nanomaterials 11 00324 g004
Figure 5. SEM images of the Cu/TiO2_800 sample, (a) Cu/TiO2_800 with a magnification of 12,000×, (b) Cu/TiO2_800 detail of nanocavities, (c) Cu/TiO2_800 with a magnification of 20,000×, (d) Cu/TiO2_800 surface detail.
Nanomaterials 11 00324 g005aNanomaterials 11 00324 g005b
Figure 6. SEM images of the Cu/TiO2_950 sample, (a) Cu/TiO2_950 with 5000× magnification, (b) Cu/TiO2_950 with 8000× magnification.
Nanomaterials 11 00324 g006
Figure 7. HRTEM analysis of sample Cu/TiO2_500, (a) Cu/TiO2_500 at low magnification of 100 nm, (b) Cu/TiO2_500 SAED pattern.
Nanomaterials 11 00324 g007
Figure 8. HRTEM analysis of sample Cu/TiO2_650, (a) Cu/TiO2_650 with a magnification of 0.5 μm, (b) Cu/TiO2_650 SAED pattern, (c) Cu/TiO2_650 with a magnification of 0.5 μm, (d) Cu/TiO2_650 with a magnification of 200 nm.
Nanomaterials 11 00324 g008
Figure 9. HRTEM analysis of sample Cu/TiO2_800, (a) Cu/TiO2_800 with a magnification of 1 μm, (b) Cu/TiO2_800 SAED pattern, (c,d) Cu/TiO2_800 with a magnification of 200 nm.
Nanomaterials 11 00324 g009
Figure 10. HRTEM analysis of sample Cu/TiO2_950 (a) Cu/TiO2_950 with a magnification of 1 μm, (b) Cu/TiO2_950 SAED pattern, (c,d) Cu/TiO2_950 with a magnification of 2 nm.
Nanomaterials 11 00324 g010
Figure 11. Raman spectra of the Cu/TiO2_500, Cu/TiO2_650, Cu/TiO2_800 and Cu/TiO2_950.
Nanomaterials 11 00324 g011
Figure 12. The IR spectra of the examined samples.
Nanomaterials 11 00324 g012
Figure 13. Diffuse reflectance spectra and band gaps for pristine TiO2, standard TiO2_P25, Cu/TiO2_500, Cu/TiO2_650, Cu/TiO2_800 and Cu/TiO2_950.
Nanomaterials 11 00324 g013aNanomaterials 11 00324 g013b
Figure 14. Results of PEC water splitting for samples Cu/TiO2_500, Cu/TiO2_650, Cu/TiO2_800 and Cu/TiO2_950. Black lines (2nd photoelectrochemical cycle) and red ones (7th photoelectrochemical cycle) were obtained for the experiments carried out under irradiation. Green lines represent the dark electrochemical experiments.
Nanomaterials 11 00324 g014
Table 1. Microstructural parameters of anatase, rutile, tenorite and samples Cu/TiO2_500, Cu/TiO2_650, Cu/TiO2_800 and Cu/TiO2_950.
SampleBET [m2g−1]Average Pore
Radius [nm]
PhaseLattice Parameters [Å]Crystal Size [nm]
abc
TiO2 PDF 21-1272--anatase3.78523.78529.5139-
TiO2 PDF 21-1276--rutile4.59334.59332.9592-
CuO PDF 48-1548--tenorite4.68833.42295.1319-
Cu/TiO2_50010813.2anatase3.78523.78529.507753
Cu/TiO2_6506.916.1anatase3.78413.78419.514194
rutile4.59344.59342.959347
Cu/TiO2_8003.725.1rutile4.59314.59312.9592147
tenorite4.68983.42055.1328122
Cu/TiO2_9502.728.2rutile4.59314.59312.9587157
tenorite4.69063.41935.1320145
Table 2. EDS analysis of annealed Cu/TiO2_500, Cu/TiO2_650, Cu/TiO2_800 and Cu/TiO2_950.
Cu/TiO2_500Cu/TiO2_650
Chemical ElementWt [%]At [%]Chemical ElementWt [%]At [%]
O K37.364.2O K37.264.1
Ti K60.935.0Ti K61.235.2
Cu K1.70.7Cu K1.60.7
Cu/TiO2_800Cu/TiO2_950
Chemical ElementWt [%]At [%]Chemical ElementWt [%]At [%]
O K37.364.1O K35.462.2
Ti K61.235.2Ti K63.237.2
Cu K1.50.7Cu K1.40.6
Publisher’s Note: MDPI stays neutral with regard to jurisdictional claims in published maps and institutional affiliations.

