Article

First-Principle Insight into Ga-Doped MoS2 for Sensing SO2, SOF2 and SO2F2

1
College of Engineering and Technology, Southwest University, Chongqing 400715, China
2
Chongqing Electric Power Research Institute, State Grid Chongqing Electric Power Company, Chongqing 401123, China
3
College of Materials Science and Engineering, Chongqing University, Chongqing 400044, China
*
Authors to whom correspondence should be addressed.
Nanomaterials 2021, 11(2), 314; https://doi.org/10.3390/nano11020314
Submission received: 24 December 2020 / Revised: 12 January 2021 / Accepted: 15 January 2021 / Published: 26 January 2021
(This article belongs to the Special Issue State-of-the-Art Nanomaterials and Nanotechnology in China)

Abstract

:
First-principle calculations were carried out to simulate the three decomposition gases (SO2, SOF2, and SO2F2) of sulfur hexafluoride (SF6) on Ga-doped MoS2 (Ga-MoS2) monolayer. Based on density functional theory (DFT), pure MoS2 and multiple gas molecules (SF6, SO2, SOF2, and SO2F2) were built and optimized to the most stable structure. Four types of Ga-doped positions were considered and it was found that Ga dopant preferred to be adsorbed by the top of Mo atom (TMo). For the best adsorption effect, two ways of SO2, SOF2, and SO2F2 to approach the doping model were compared and the most favorable mode was selected. The adsorption parameters of Ga-MoS2 and intrinsic MoS2 were calculated to analyze adsorption properties of Ga-MoS2 towards three gases. These analyses suggested that Ga-MoS2 could be a good gas-sensing material for SO2 and SO2F2, while it was not suitable for SOF2 sensing due to its weak adsorption. This work provides a theoretical basis for the development of Ga-MoS2 materials with the hope that it can be used as a good gas-sensing material for electrical equipment.

1. Introduction

SF6 is known as a colorless, odorless, non-toxic, and incombustible inert gas [1]. It has an octahedral molecular structure and high chemical stability with short bond length and high bond energy [2]. SF6 is used for the insulation of Gas-Insulated-Switchgear (GIS) installations and arc extinguishing dielectric due to its extraordinary arc extinguishing property, insulation performance, and adequate chemical steadiness [3]. During the long running times, GIS installations may get some insulation defects such as metal particle defects, metal protrusion defects, air gap defects, etc. [4]. Insulating defects will initiate partial discharge and lead to the disintegration components of SF6, such as SO2, SOF2, and SO2F2, etc. [5]. On the one hand, some decomposition products are corrosive, which may cause certain damages to the equipment [6,7]. On the other hand, the stability and insulation of the decomposition gases are far inferior than that of SF6 [8]. In order to ensure the stable and safe operation of GIS equipment, the specific types and degree of equipment defects could be evaluated by measuring the types and concentrations of SF6 disintegration components [9]. At present, one of the main methods to detect SF6 disintegration products is the gas sensor detection method [10]. MoS2 monolayer is a new member of two-dimensional materials like graphene, which has unique physical, chemical, and electrical characters [11]. According to previous papers, MoS2 monolayers have a bandgap of 2.06 eV, suitable carrier fluidity, and high thermal stability [12,13]. In general, its unique structure makes it exhibit good gas sensitivity and adsorption characteristics [14]. Furthermore, published literature already proved that some metal or non-metal doping on MoS2 monolayers could further enhance their sensitivity to gas molecules [15,16]. The reason was the fit doped atoms regulate the electrons on the surface of MoS2 monolayers and improve the electron density of the doping points to realize the orbital interaction between the doped atoms and some atoms of the gas molecules [17]. Wang J.X. et al. developed a hydrothermal synthesis of Au-MoS2 microspheres, whose conductivities were better than that of the intrinsic MoS2 material [18]. Abbas H.G. et al. modified MoS2 with non-metallic atoms N and P, and tested the adsorption of O2 and NO. They found that the adsorption effects of modified N-MoS2 and P-MoS2 were stronger than that of intrinsic MoS2 [19]. Ga is a common semiconductor dopant, which is used as the dopant of nitrogen, arsenic, phosphorus, and other elements. However, as far as we know, the Ga-MoS2 monolayer has not been reported for its application in SF6 decomposition products detection.
In this paper, Ga-MoS2 was selected as sensitive material for adsorption of three typical SF6 disintegration components (SO2, SOF2, and SO2F2). We performed density functional theory (DFT) method and simulated the adsorption of three gas molecules onto the intrinsic MoS2 and Ga-MoS2, aiming to shed light on its adsorption ability [20,21]. The optimal configuration of each structure, adsorption energy, charge conversion, density of states (DOS), and band structure were calculated through the DFT method [22]. Furthermore, the simulation results were compared, and the conclusions of material adsorption performance were obtained.

2. Computational Details

Our calculations were designed to qualitatively analyze the effects of Ga doping on sensing properties of MoS2 at the atomic level. The calculation method was basically consistent with the previous research, so that the results were comparable. The adsorption between MoS2-based materials and gas molecules were studied with the DFT method, which is one of the most effective ways to predict the performance of materials by calculating their electronic structures [23]. The molecular spin-polarized algorithms were achieved using DMol3 package of Material Studio (MS). The generalized gradient approximation (GGA), which is the Perdew–Burke–Ernzerhof (PBE) functional, was chosen to figure out the doping and hybridization between electrons [24,25]. Within the function of MS software, the double numerical plus polarization (DNP) was utilized as the atomic orbital base install. Meanwhile, the DFT semi-core pseudopotential (DSSP) method was selected to deal with the influence of core electron relativity [26,27,28].
The Brillouin zone of MoS2 monolayer systems was sampled with k-point of 5 × 5 × 1, and Self-Consistent Field (SCF) convergence criterion was set to 1 × 10⁻⁶ Ha [29]. The convergence criteria of geometry optimizations were set to 5 × 10⁻³ A for displacement, 2 × 10⁻³ Ha/Å for force, and 10−5 Ha for energy [30]. A 4 × 4 × 1 MoS2 monolayer supercell was built, including 16 Mo and 32 S atoms with a vacuum zone of 15 Å [31].
In this paper, the difficulty of doping could be judged by analyzing the energy of formation, adsorption energy, and charge transfer capacity.
We obtained the energy of formation ( E f o r m ) through the calculation:
E f o r m = E G a M o S 2 E M o S 2 E G a
E G a M o S 2 is the energy of the system after Ga doping. E M o S 2 and E G a denote the energy of pure MoS2 and Ga atom, respectively [32,33].
The adsorption energy ( E a d ) of each gas molecules on Ga-MoS2 monolayer were calculated by the following equation:
E a d = E G a M o S 2 / g a s E G a M o S 2 E g a s
E G a M o S 2 / g a s is the total energy of gas-adsorbed Ga-MoS2 monolayers and E g a s represents the energy of gas molecules before adsorption [34,35].
Mulliken charge characterized the number of electrons carried by gas molecules adsorbed. It was utilized to calculate the charge transfer between Ga-MoS2 and gas molecules. The definition of charge transfer ( Q t ) used in this paper is:
Q t = Q a d s o r b e d ( g a s ) Q i s o l a t e d ( g a s )
Q a d s o r b e d ( g a s ) and Q i s o l a t e d ( g a s ) mean the number of charges carried by gas molecules before and after adsorption. Normally, the figure of Q a d s o r b e d ( g a s ) is zero. If electrons are shifted from gas molecules to Ga-MoS2 monolayers, Q t is positive [36,37,38].

3. Results and Discussion

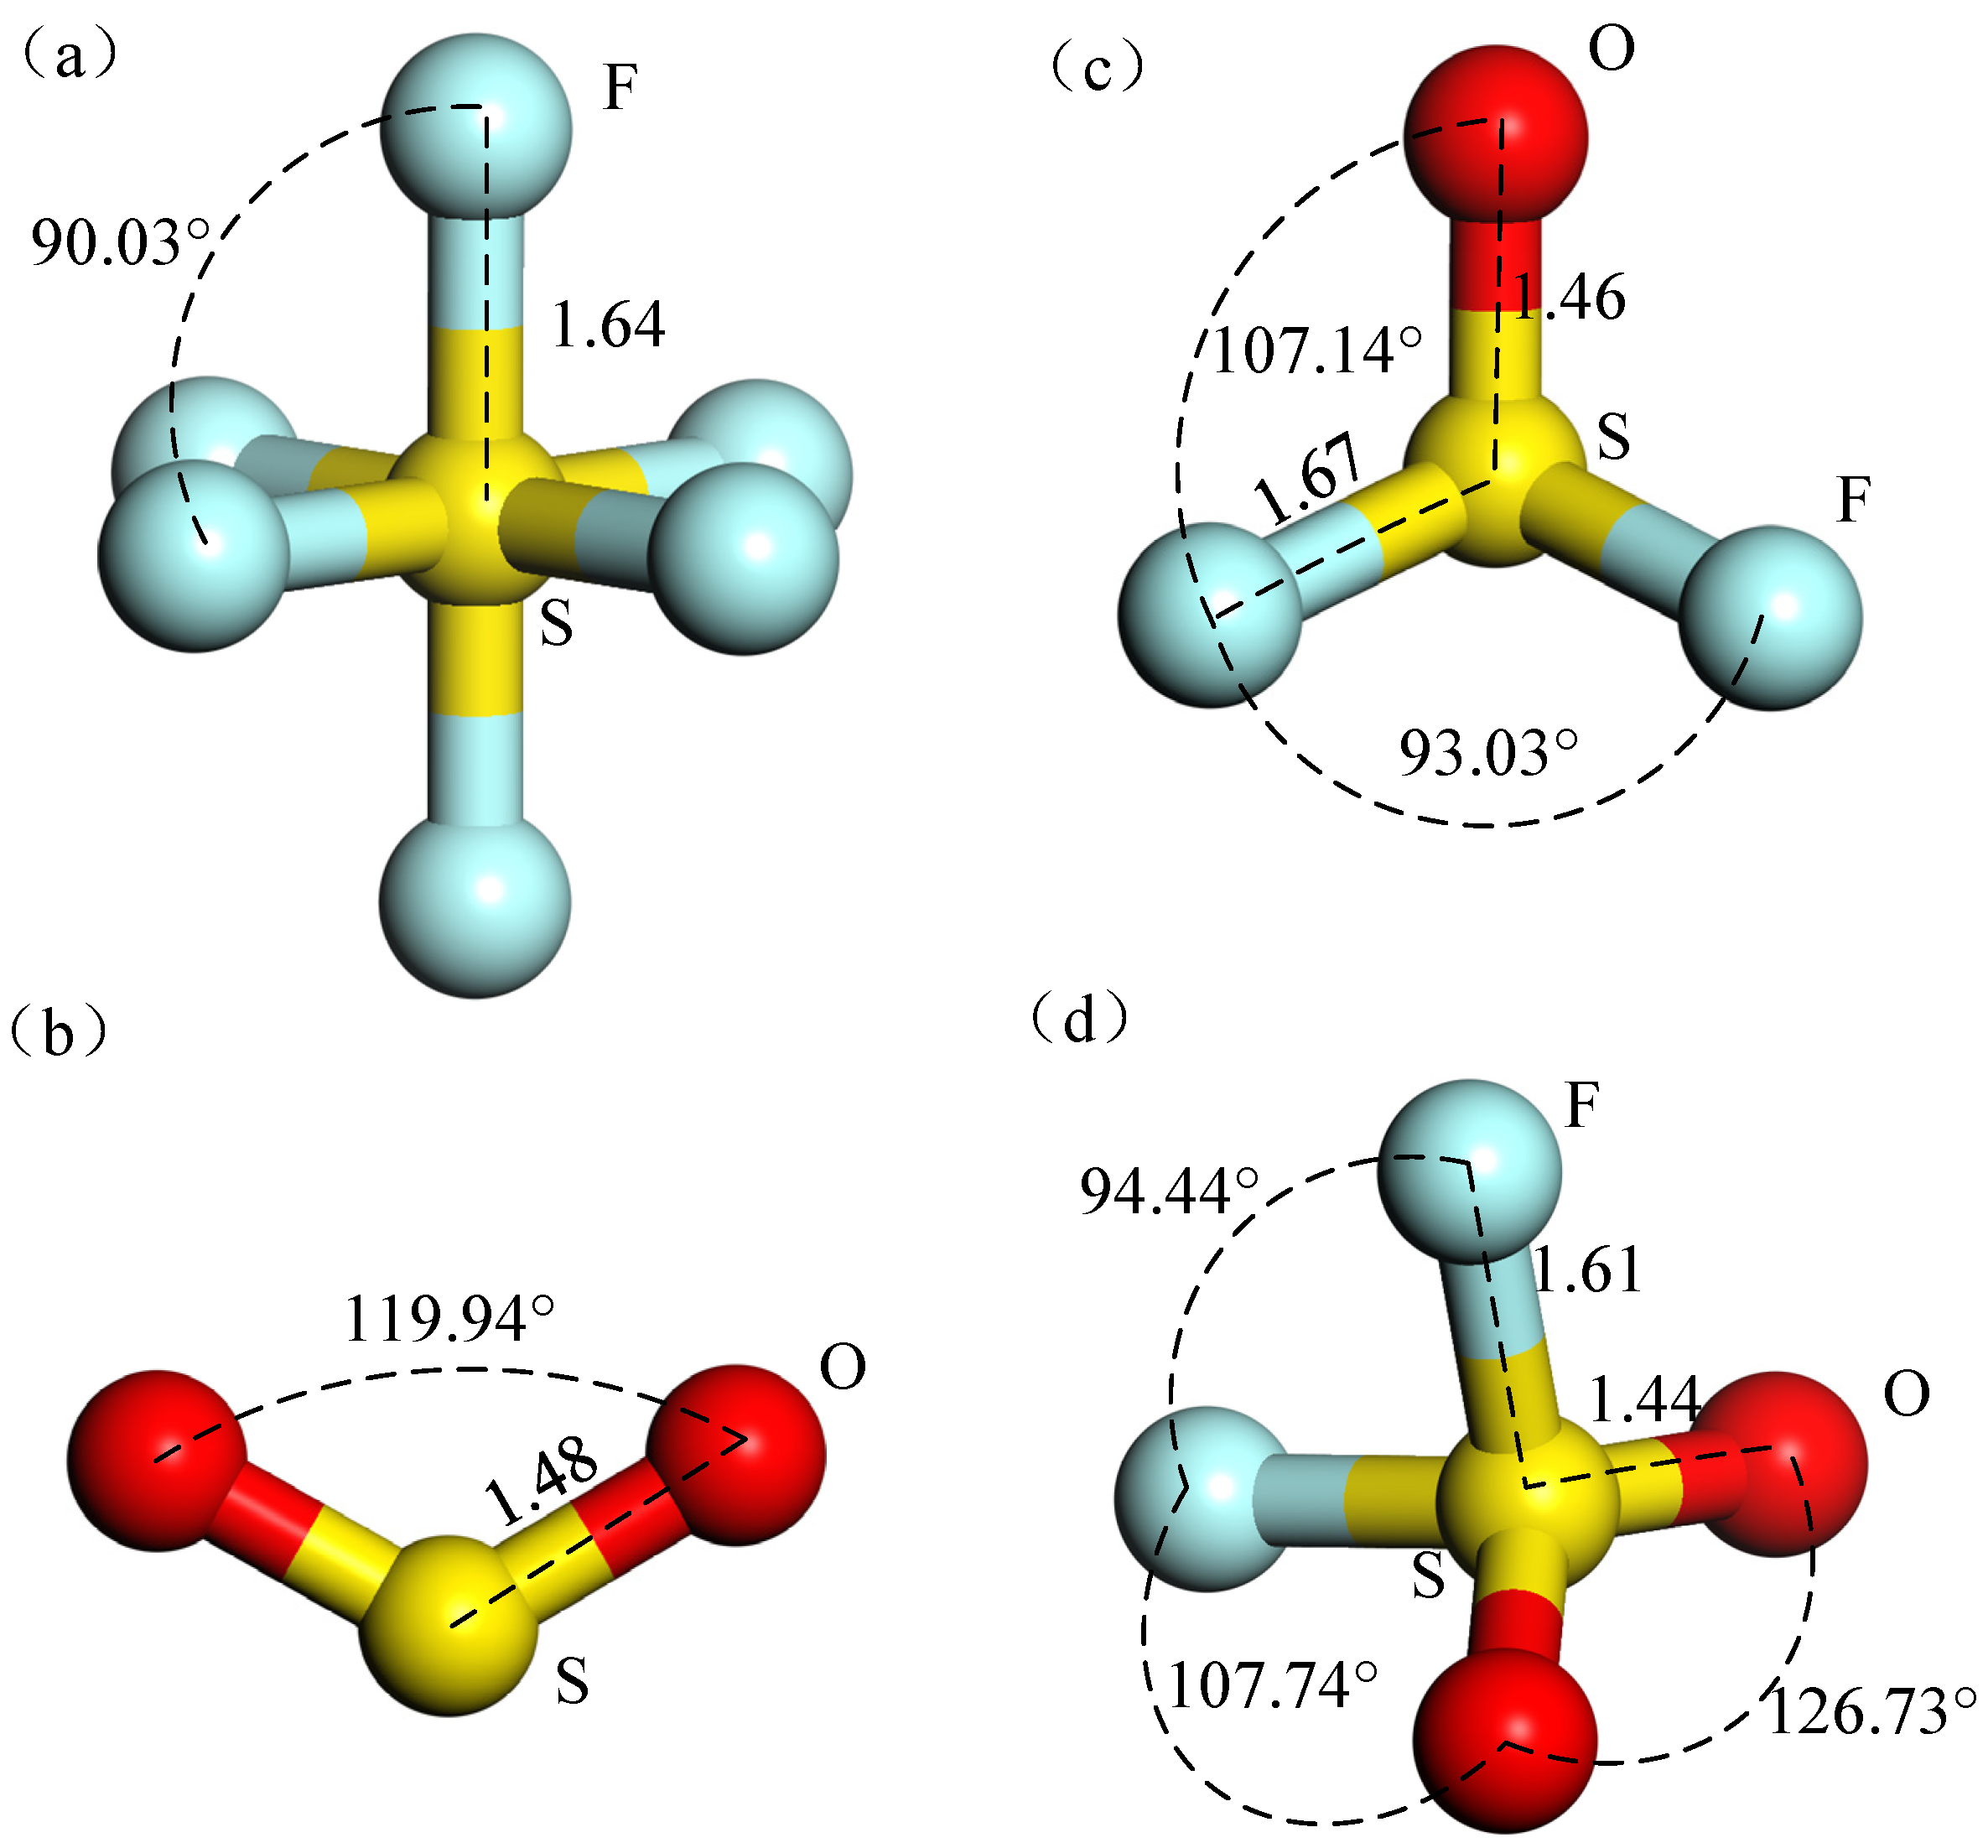
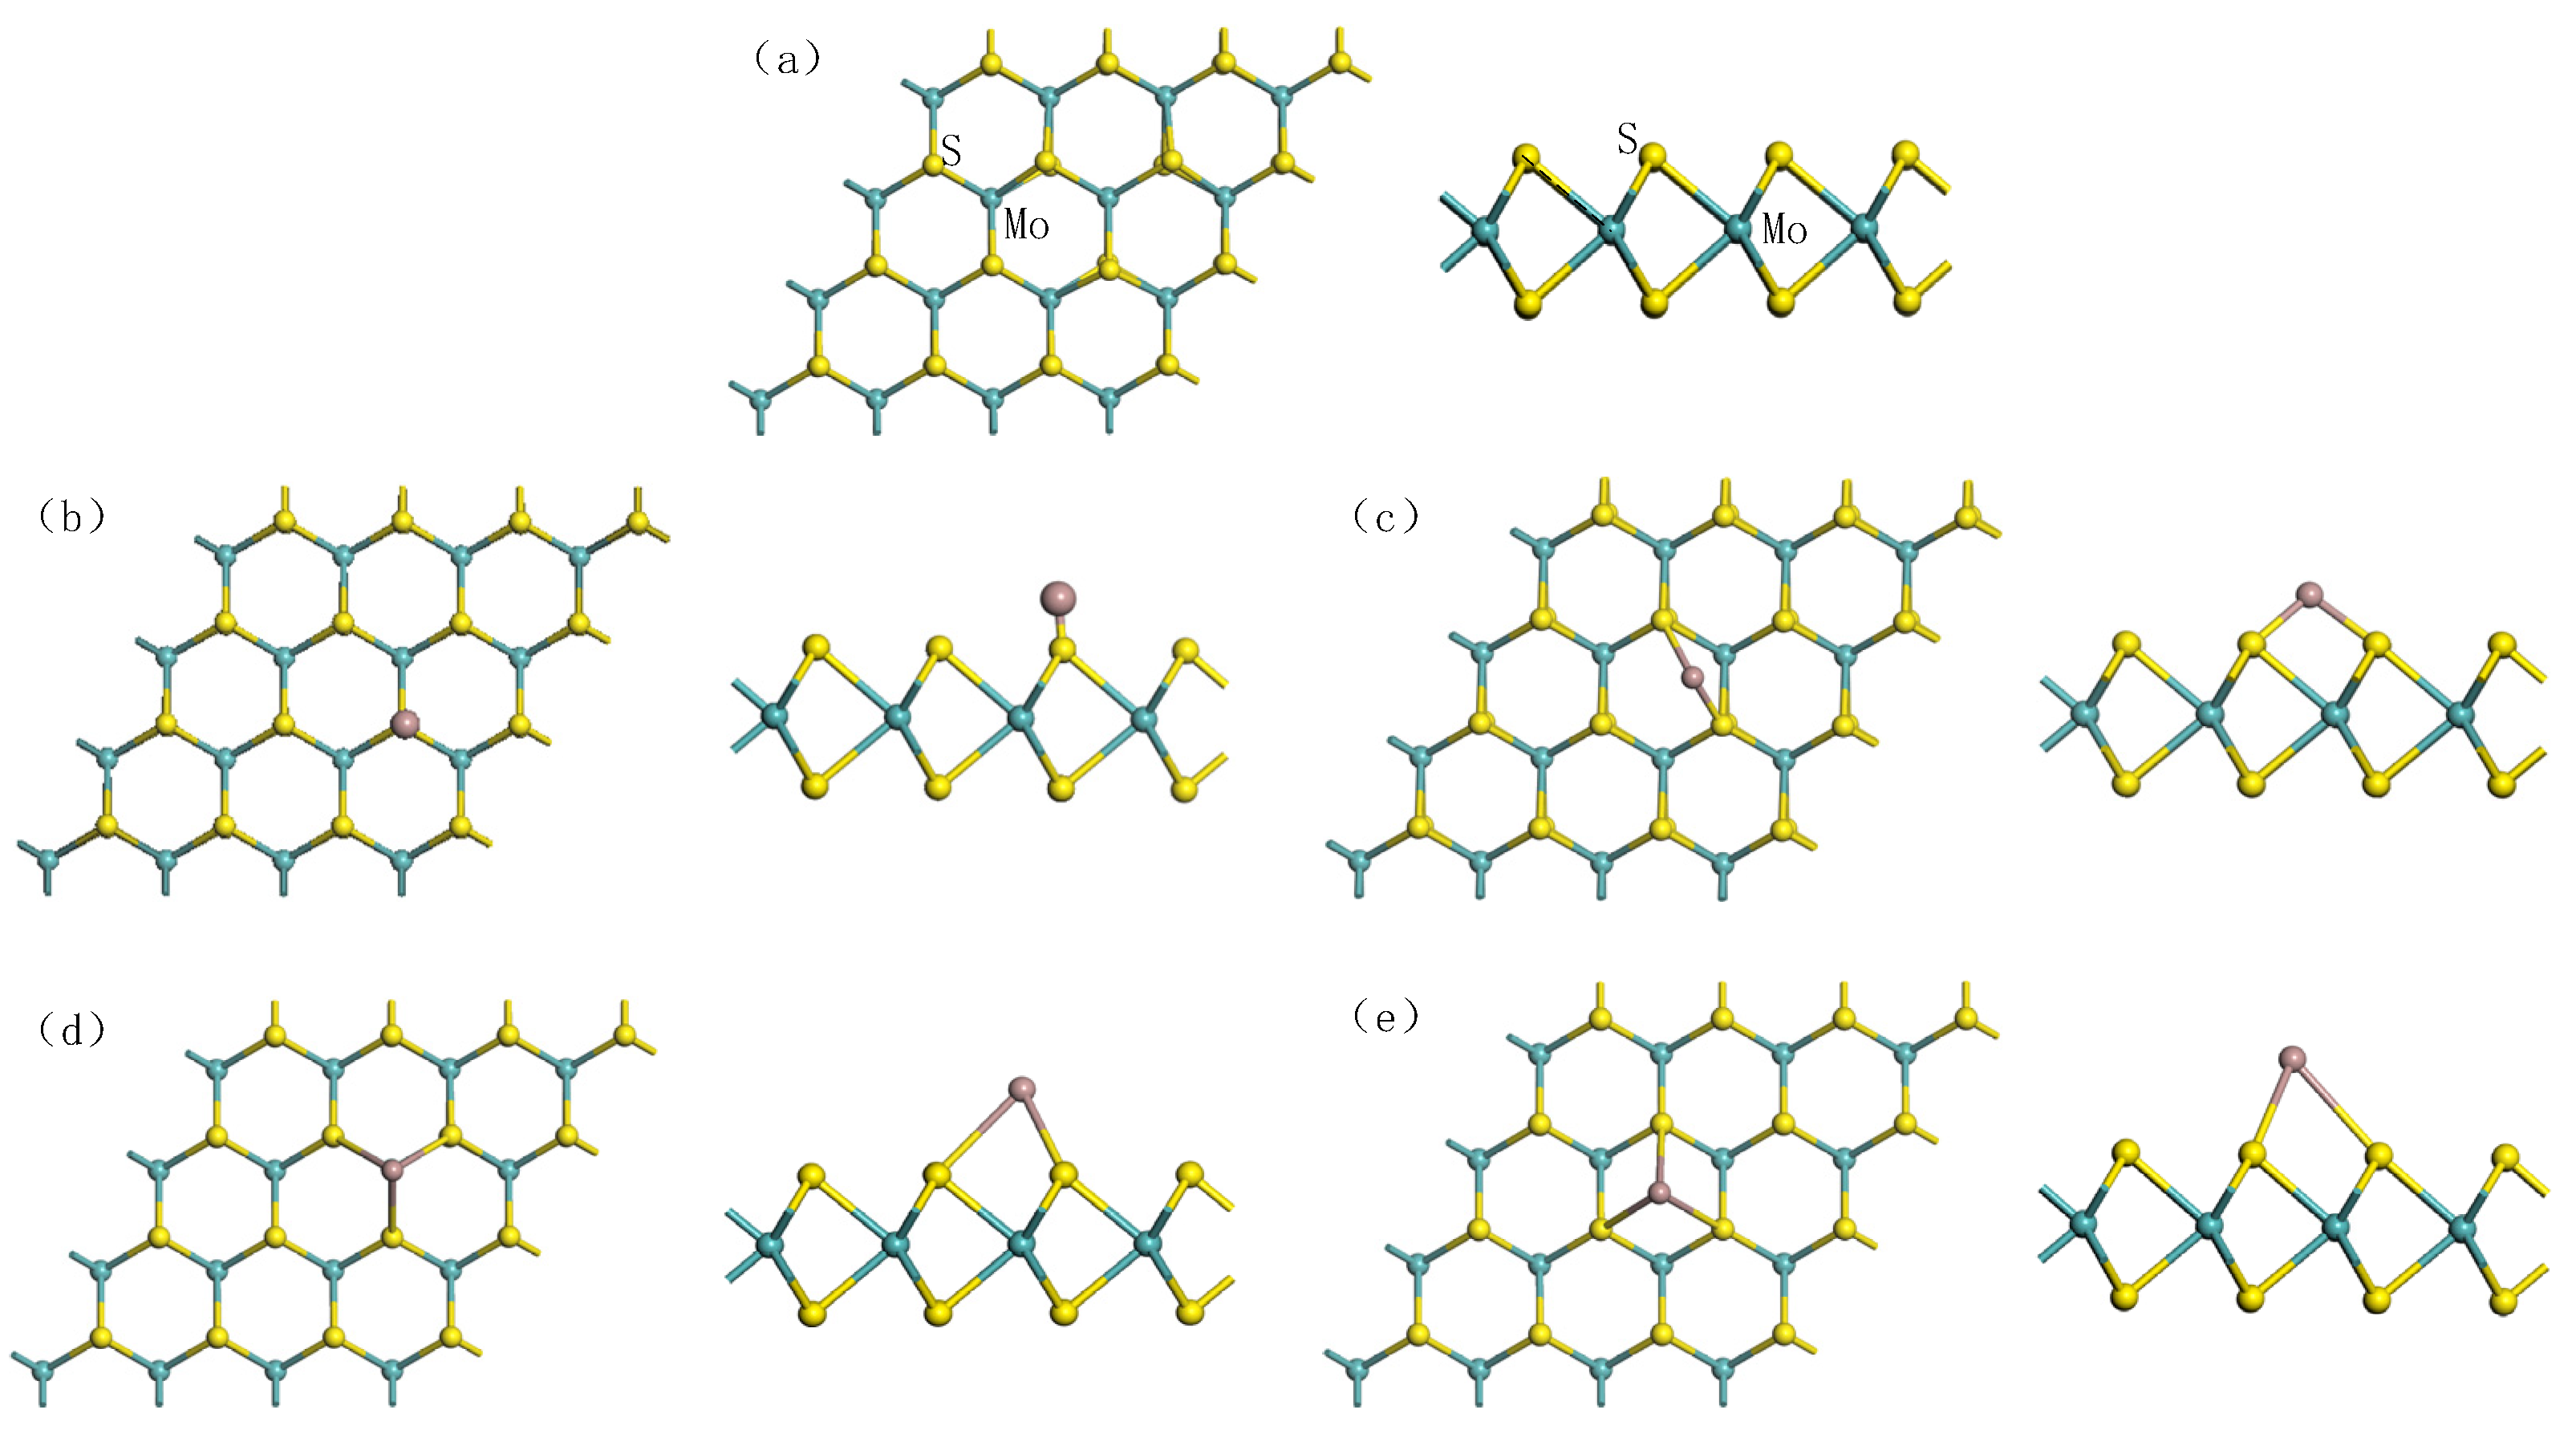
3.1. Geometric Structure of Gas Molecules, MoS2, and Ga-MoS2 Monolayer

First, the geometric structures of SF6, SO2, SOF2, and SO2F2 were optimized to their steadiest configuration before studying their adsorption. Figure 1 displays the four structures and the information of bond lengths and angles are shown in Table 1.
A SF6 molecule has a regular octahedral structure with six F atoms arranged symmetrically around an S atom. It is difficult to accumulate enough energy for collision ionization because of the large molecular diameter of SF6. When electrons attach and collide with SF6 molecules, energy loss will increase and further weaken its ionization ability. Form Figure 1b, the SO2 molecule had structure presenting a highly symmetrical “V” shape. SOF2 molecule presented a tetrahedral structure, as shown in Figure 1c. SO2F2 molecule had a similar structure to SOF2. Figure 1d indicates that SO2F2 was symmetrical about the plane where the mid-perpendicular line of two F atoms or two O atoms were connected. The bond length and bond angle of the optimized structure of these gases were consistent with the previous reference [39]. The optimized pure MoS2 monolayer is shown in Figure 2a. The bandgap of the optimized structure is displayed in Figure 3a. The energy gap was 2.06 eV, which was less than the experimental value (3.2 eV) and consistent with the simulation value (2.06 eV) [40]. It indicates that the energy required for the electrons to jump between the valence band and conduction band was large and the electrons were difficult to be excited.
Four types of Ga-doped positions on pure MoS2 monolayers were considered, which were TS (at the top of the S atom) in Figure 2b, BS-S (the bridge site between two S atoms) in Figure 2c, TMo (at the top of the Mo atom) in Figure 2d, and TH (above the hexagonal ring center of MoS2) in Figure 2e, respectively [41].
As shown in Table 2, we calculated E f o r m for the four Ga doping models. It was evident that the most favorable doping position had the lowest formation energy, which means that the reaction occurred most easily [42,43]. The TMo site had the smallest formation energy of −1.75 eV. Therefore, for the optimization model obtained by the four ways Ga can be doped on MoS2, the optimization model of TMo position was the best. From the bond-forming parameters, Ga atoms preferred to approach MoS2 monolayers from the top of Mo atoms. Three of Ga-S bonds were formed between Ga and MoS2 monolayers, all of which were closed to 2.70 Å in length, indicating the strong interaction between Ga and S atoms. The results show that the surface structure of MoS2 did not change much with the doping of Ga. The bond angles of Mo-S-Mo and S-Mo-S were 81.225° and 82.445°, respectively, which had little change from 81.962° before doping. Simultaneously, the distance between the Ga atom and Mo atom was a bit long (3.55 Å), showing the inferior attractive force between them. In conclusion, Figure 2d displays the most stable structure, which is the optimal model used for subsequent adsorption calculations.
Figure 3 displays the bandgap structures comparison before and after the Ga doping of MoS2. Besides, to compare more intuitively the similarities or differences of electronic structures before and after Ga doping, the DOS contrast was carried out as displayed in Figure 4. In Figure 3, the bandgap between the valence band and conduction band decreased to 1.90 eV. The separation distance corresponds to the width between the two peaks near the Fermi level of DOS. Figure 4 shows that the total density of states (TDOS) shifted to the lower energy direction compared with that before Ga doping. From the Fermi level, it can be seen that the distance between the valence band and the conduction band shortened. It shows that the conductivity of Ga-MoS2 ameliorated due to the doping of Ga.

3.2. Adsorption Analysis of Ga-MoS2 Monolayer to Gas Molecules

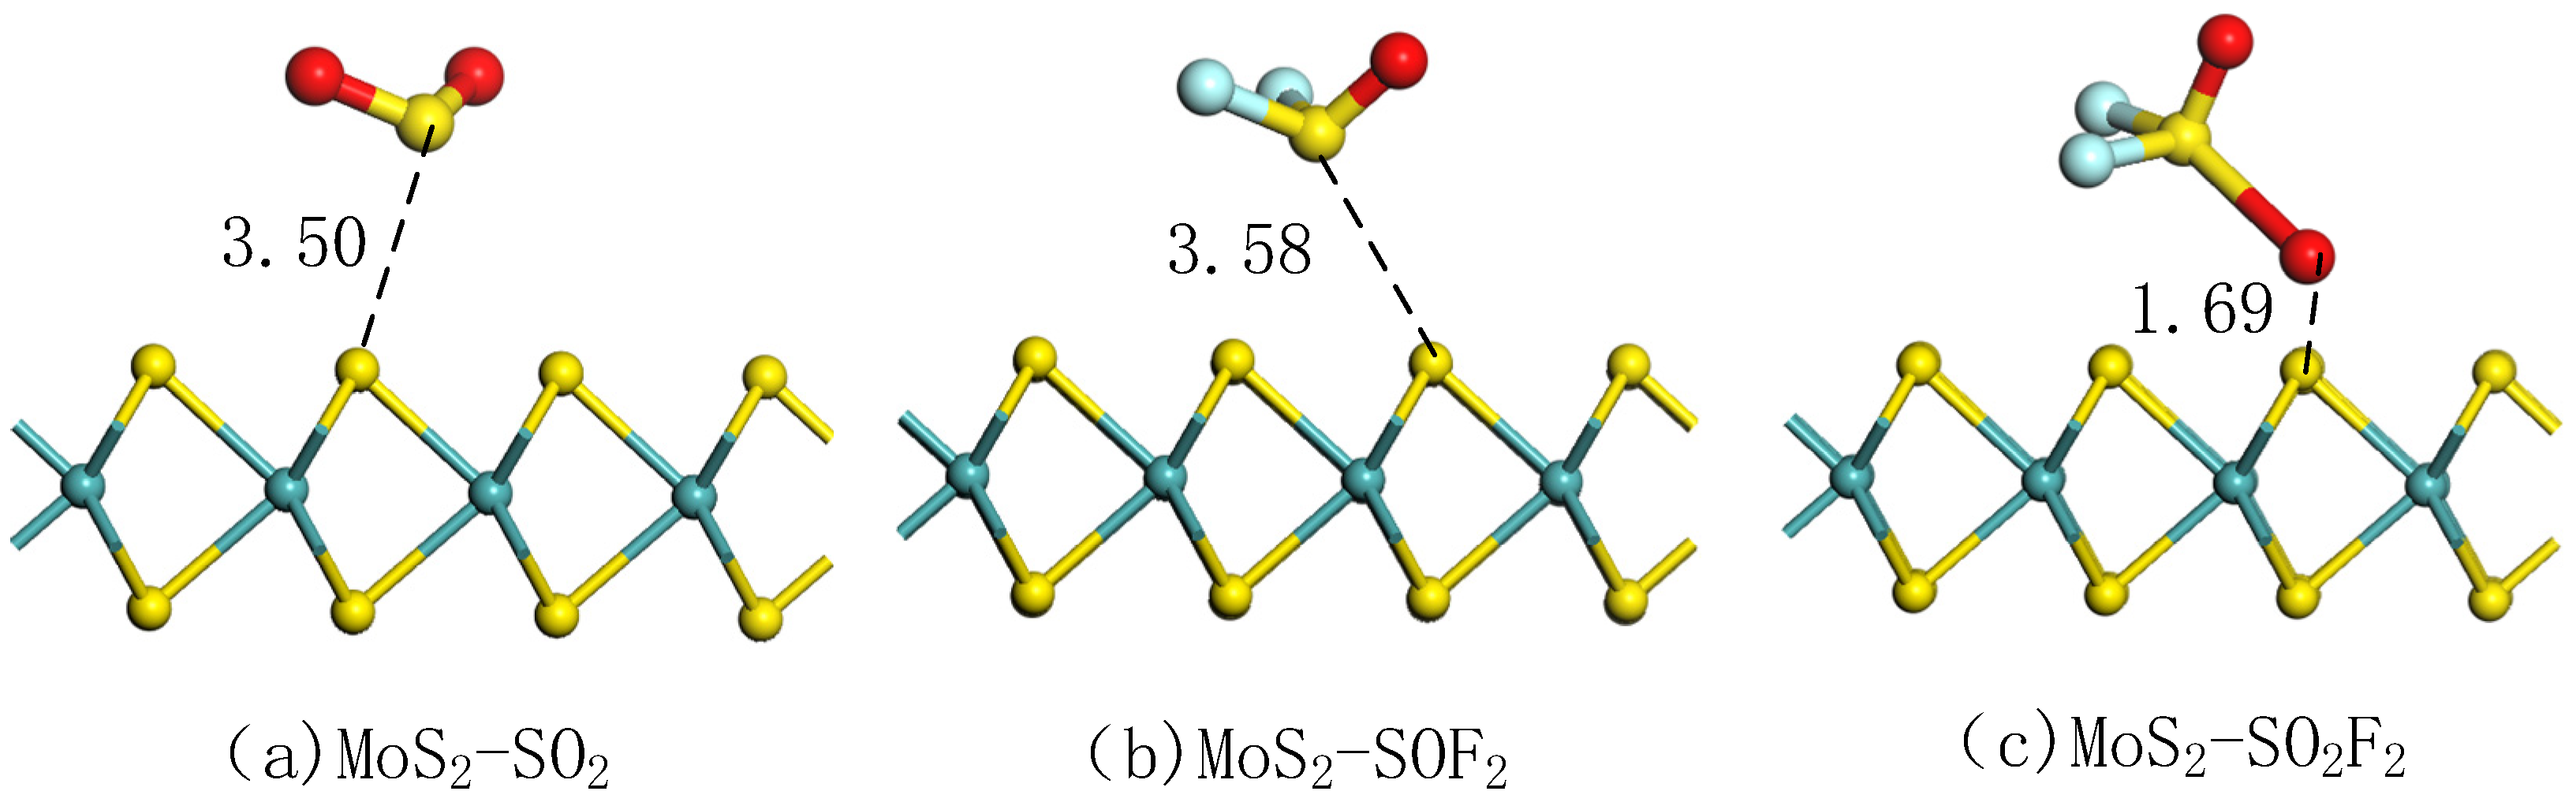
3.2.1. Adsorption Analysis of MoS2 Monolayer to Gas Molecules

As Figure 5 shows, the optimized pure MoS2 model was used to adsorb the three target gases. The adsorption parameters of three gas adsorption systems listed in Table 3, including adsorption distance (D), E a d , and Q t [44]. The adsorption distance between gas molecules and MoS2 was large in the adsorption model, which indicates that intrinsic MoS2 had weak adsorption capacity for the three gases. It also can see the adsorption of SO2, SOF2 by MoS2 tended to be close to S atom in SO2 and SOF2 molecules, while SO2F2 molecule was close to O atom. The S-F bond was slightly elongated in SO2F2 molecule. As seen in Table 3, the adsorption energies of the three target gases were all positive, indicating that the reaction was endothermic and could not be spontaneous. It proves that the intrinsic MoS2 had low adsorption effect on the target gases. The bond angles of SO2, SOF2, and SO2F2 were reduced to a certain extent after being adsorbed. The charge transfer values of SO2, SOF2, and SO2F2 were negative, and mean that electrons shifted from MoS2 surface to gas molecules during the adsorption process. However, the electrons were not active during the adsorption process due to the micro charge transfer in the three adsorption systems. In summary, the intrinsic MoS2 had a weak adsorption capacity for the target gases. The improved adsorption performance of MoS2 required doping of metal or non-metal atoms.
The band structures of the adsorption systems corresponding to the three gases were analyzed, as shown in Figure 6. The bandgap of the intrinsic MoS2 was 2.06 eV according to the previous calculation. It can be seen from Figure 6a, the bandgap decreased to 0.57 eV after adsorption of SO2 molecule, indicating that electrons more easily transited from the valence band to the conduction band, and the conductivity of system significantly improved after adsorption [45]. Figure 6b displays that the bandgap of the SOF2 molecule adsorption system reduced by 0.67 eV, illustrating that the conductivity of the system was raised. Figure 6c demonstrates that the bandgap of the SO2F2 molecule adsorption system diminished by 0.33 eV, the bandgap changed less than the other two gases, and the system’s conductivity did not change evidently. Overall, the bandgap of MoS2 decreased most obviously after SO2 molecule adsorption.

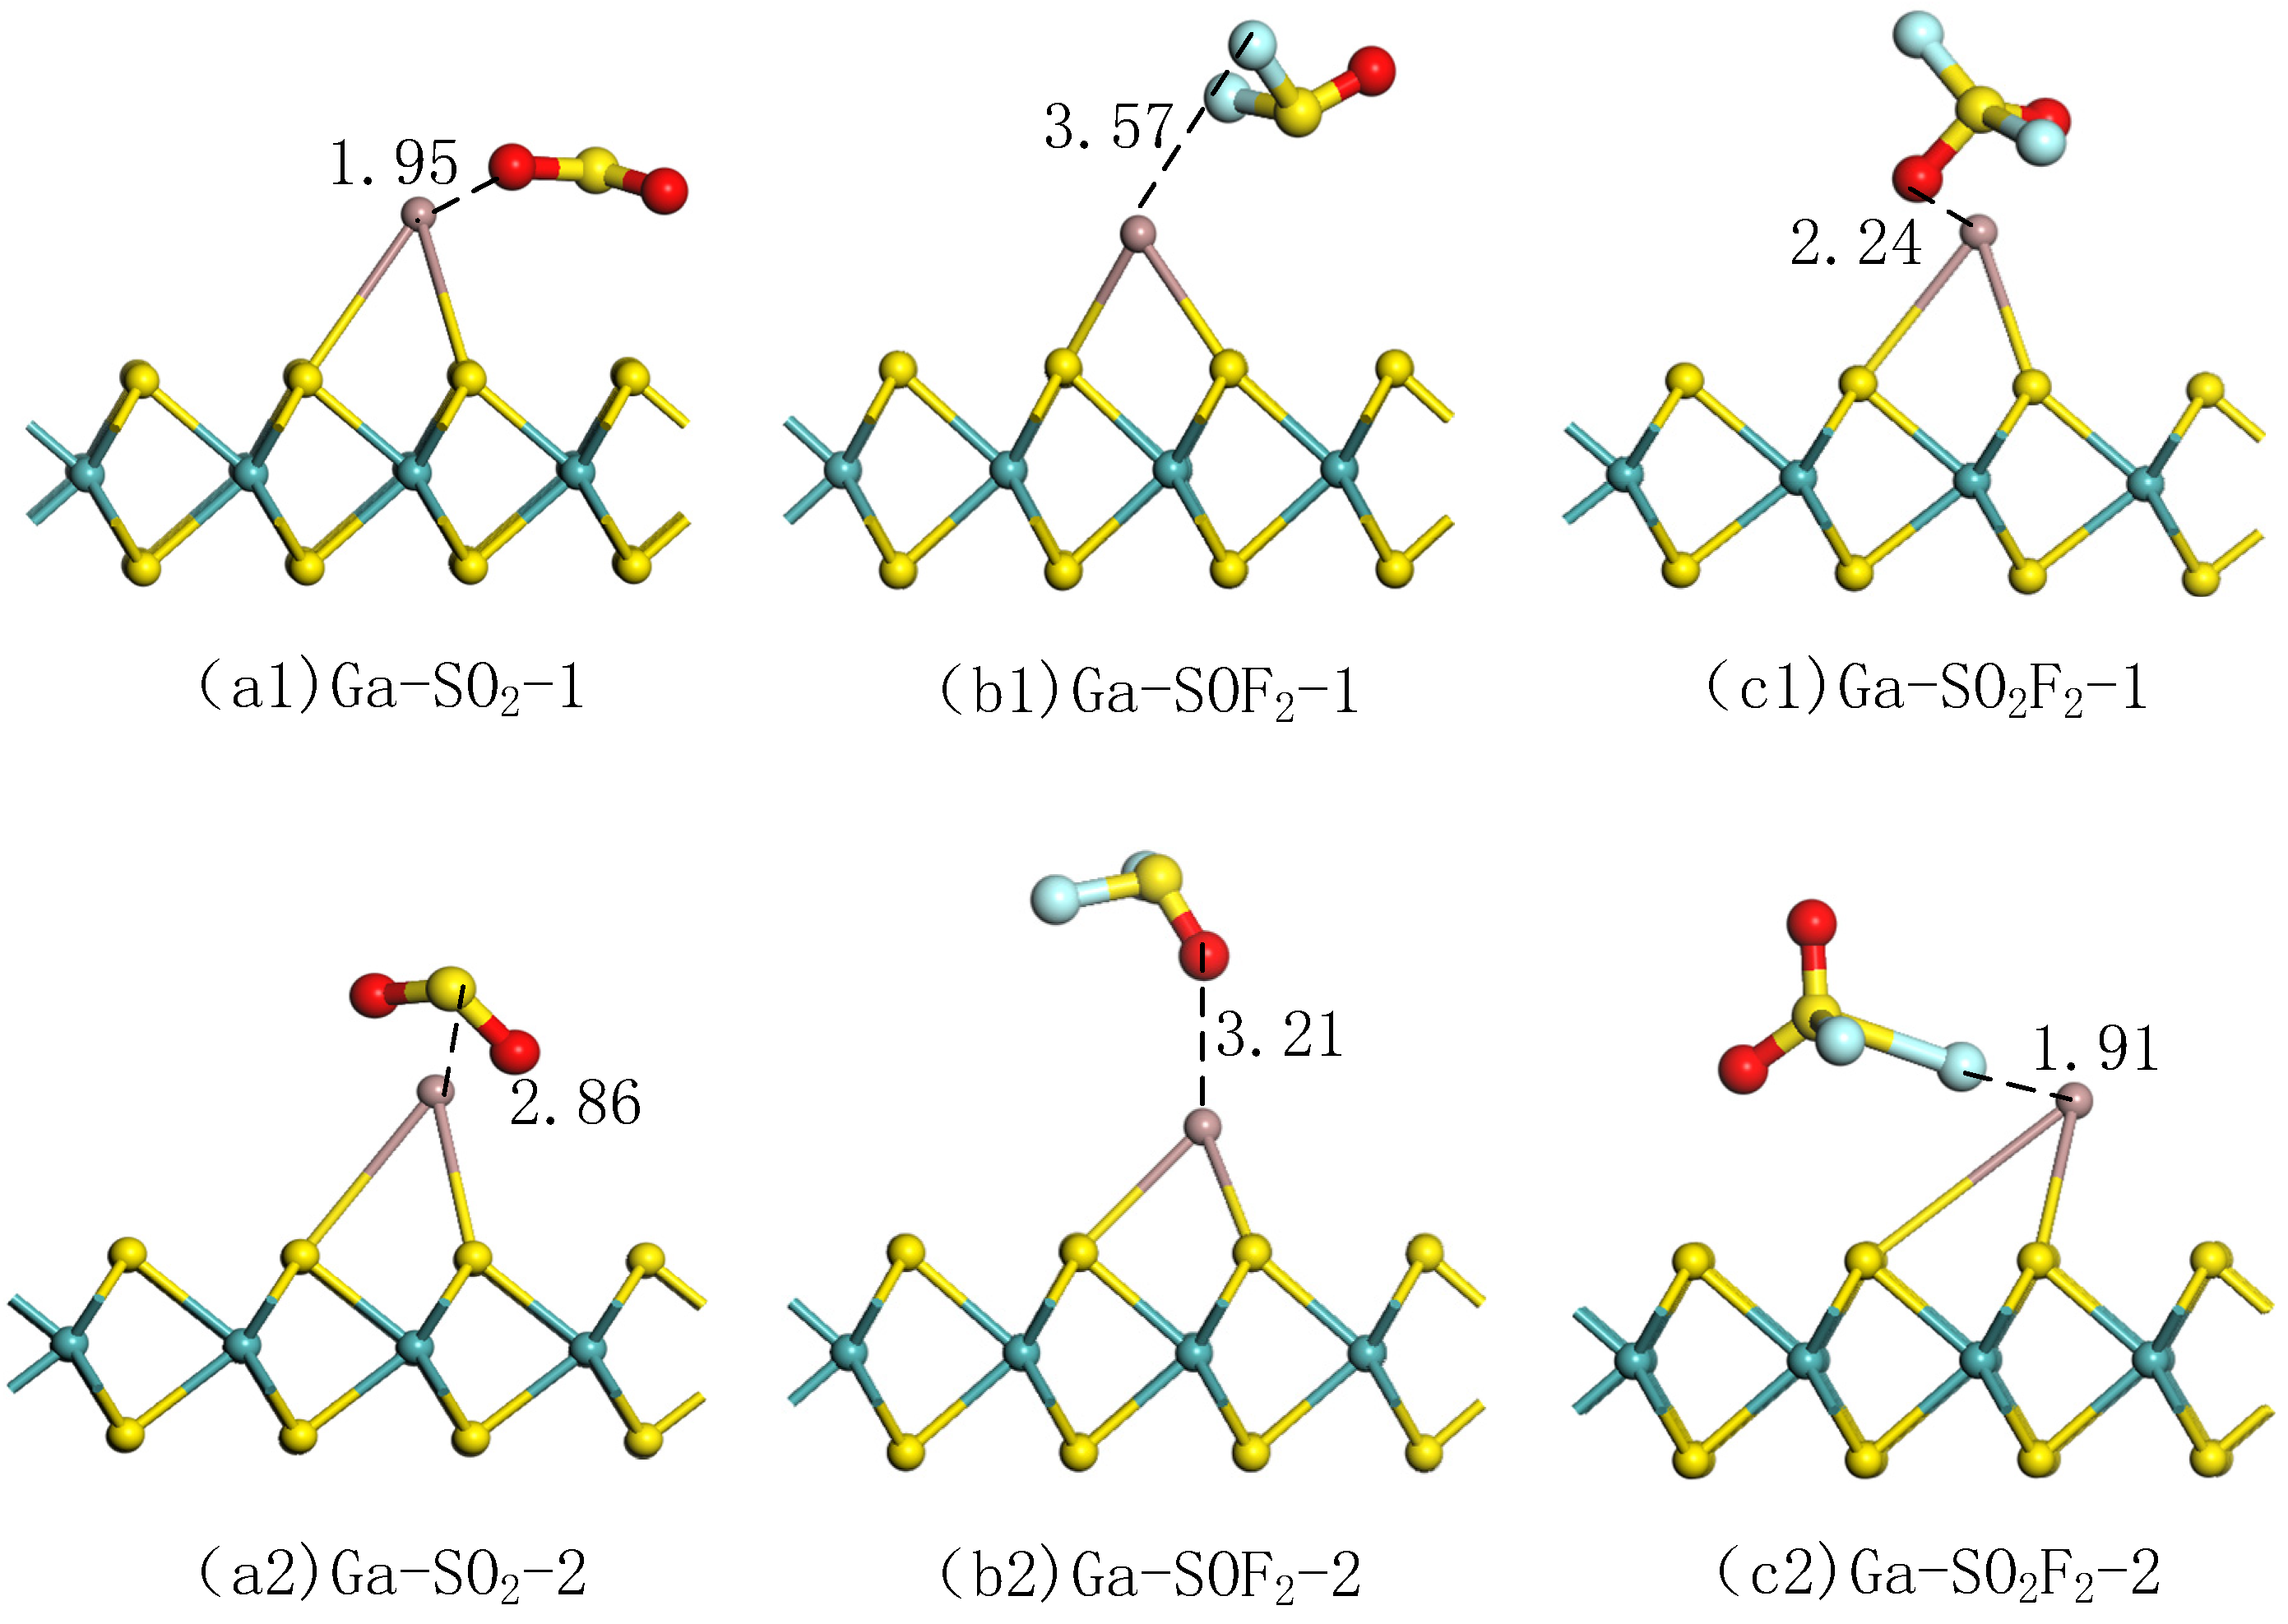
3.2.2. Selection of Adsorption Modes for Gas Molecules in Ga-MoS2 Monolayer

For the best adsorption effect, two ways for SO2, SOF2, and SO2F2 to approach the doping model were compared [46], as shown in Figure 7. The parameters of gas adsorption on Ga-MoS2 in different approaches are listed in Table 4.
As Figure 7(a1,a2) shows, two types of SO2 adsorption models were built: O atom or S atom near the Ga atom. It can be seen that in the adsorption system obtained after optimization by mode 2, approach mode had changed, while the approach mode 1 had not changed, basically. In the two modes, SO2 lost electrons and the Ga-MoS2 doping model gained electrons. After calculation, the numerical value of the E a d of the adsorption model constructed in mode 2 was more significant than that constructed in mode 1. At the same time, the absolute value of Q t of the former was larger than that of the latter, and both are negative. It shows that the adsorption process approached in mode 2 was more intense. It also displays that Ga-MoS2 was more inclined to mode 2 for the adsorption of SO2. Therefore, the adsorption structure obtained by mode 2 was selected as the best structure to facilitate follow-up analysis.
It could be obtained from the above analysis that the adsorption process in the way that S atoms approach the doping model was difficult to occur. This paper adopts two gas approach modes for the adsorption of SOF2. The one was mode 1 that approaches F atoms’ doped structure. The other was mode 2, which was approaching the doped structure with O atoms as Figure 7(b1,b2) shows. After optimization calculations, the two adsorption modes were basically unchanged, but the adsorption distance was relatively long. The doping model had a weaker adsorption effect on SOF2 for both the approach methods. Both of their adsorption energies were positive, and the amount of charge transfer was very small and close to zero. It proved the adsorption effect of Ga-MoS2 on SOF2 was not ideal. However, considering the completeness of the analysis and comparison, mode 2, which has lower adsorption energy, was selected in this paper for the subsequent calculation.
Similarly, for the adsorption of SO2F2, two adsorption methods were selected in this paper. One was to use O atoms to approach the doped structure in Figure 7(c1) and the other was to use F atoms to approach the doped model in Figure 7(c2). It can be seen that the two adsorption methods had not changed to a large extent after optimization calculation. In addition, both SO2F2 and Ga-MoS2 had a certain degree of deformation in mode 2. Among them, an S-F bond of the SO2F2 was elongated, and the bond between Ga and MoS2 was also elongated, which shows that the adsorption process was relatively strong. In comparison, mode 2 had larger adsorption energy and charge transfer amount than mode 1, which also proved that the adsorption process was stronger. In summary, the adsorption model obtained by mode 2 was better for Ga-MoS2 adsorption of SO2F2, so it was selected as the subsequent energy band and DOS analysis.
In order to show the varieties of structural parameters before and after adsorption, D, E a d , Q t and some structural parameters of mode 2 are listed in Table 5. Among all the adsorption models of Ga-MoS2, the E a d of SO2 and SO2F2 were both negative, indicating that Ga-MoS2 could adsorb the above two gases more stably. At the same time, the E a d of SOF2 was positive, which suggests that Ga-MoS2 had some difficulty in adsorption of SOF2.

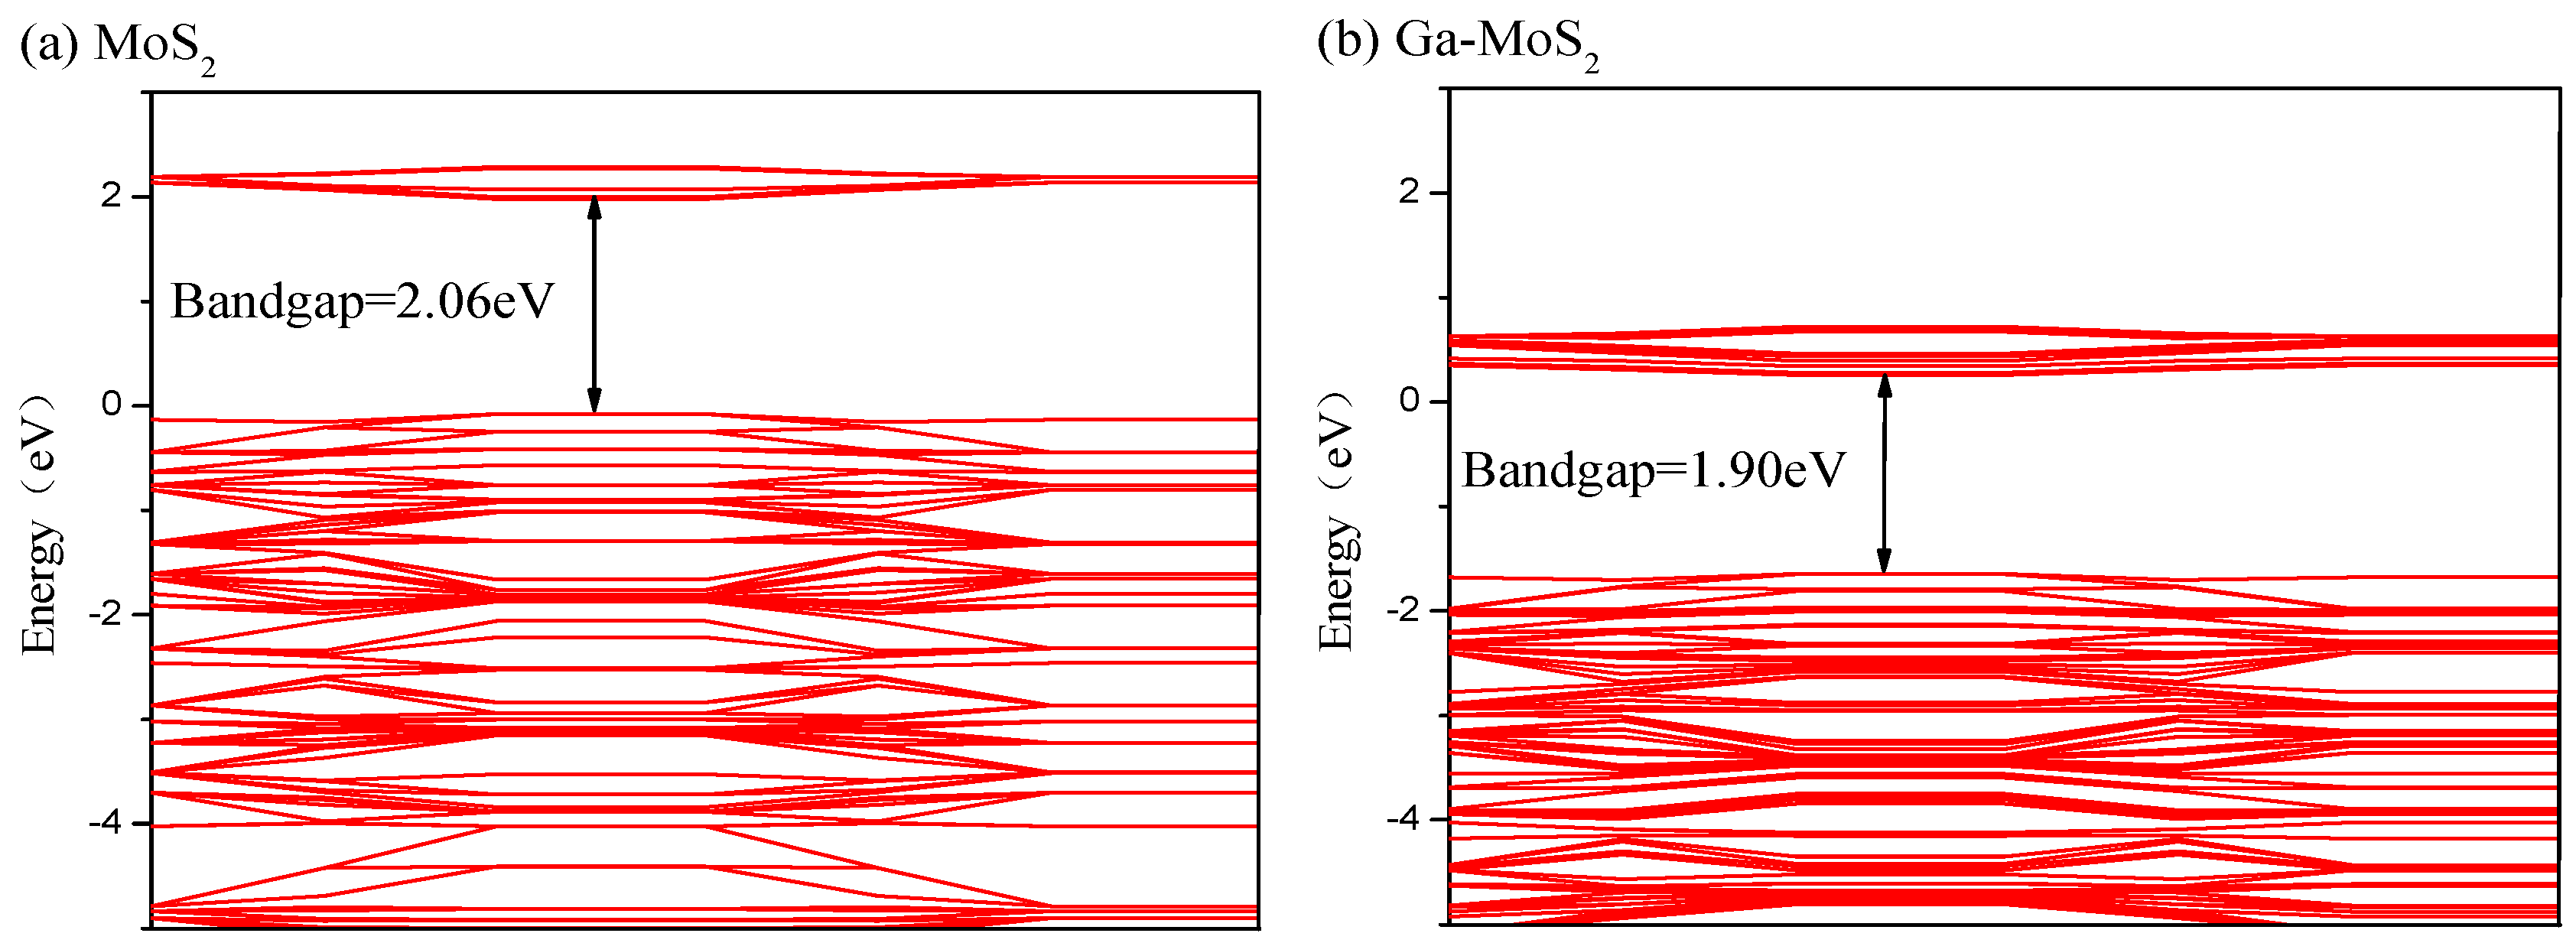
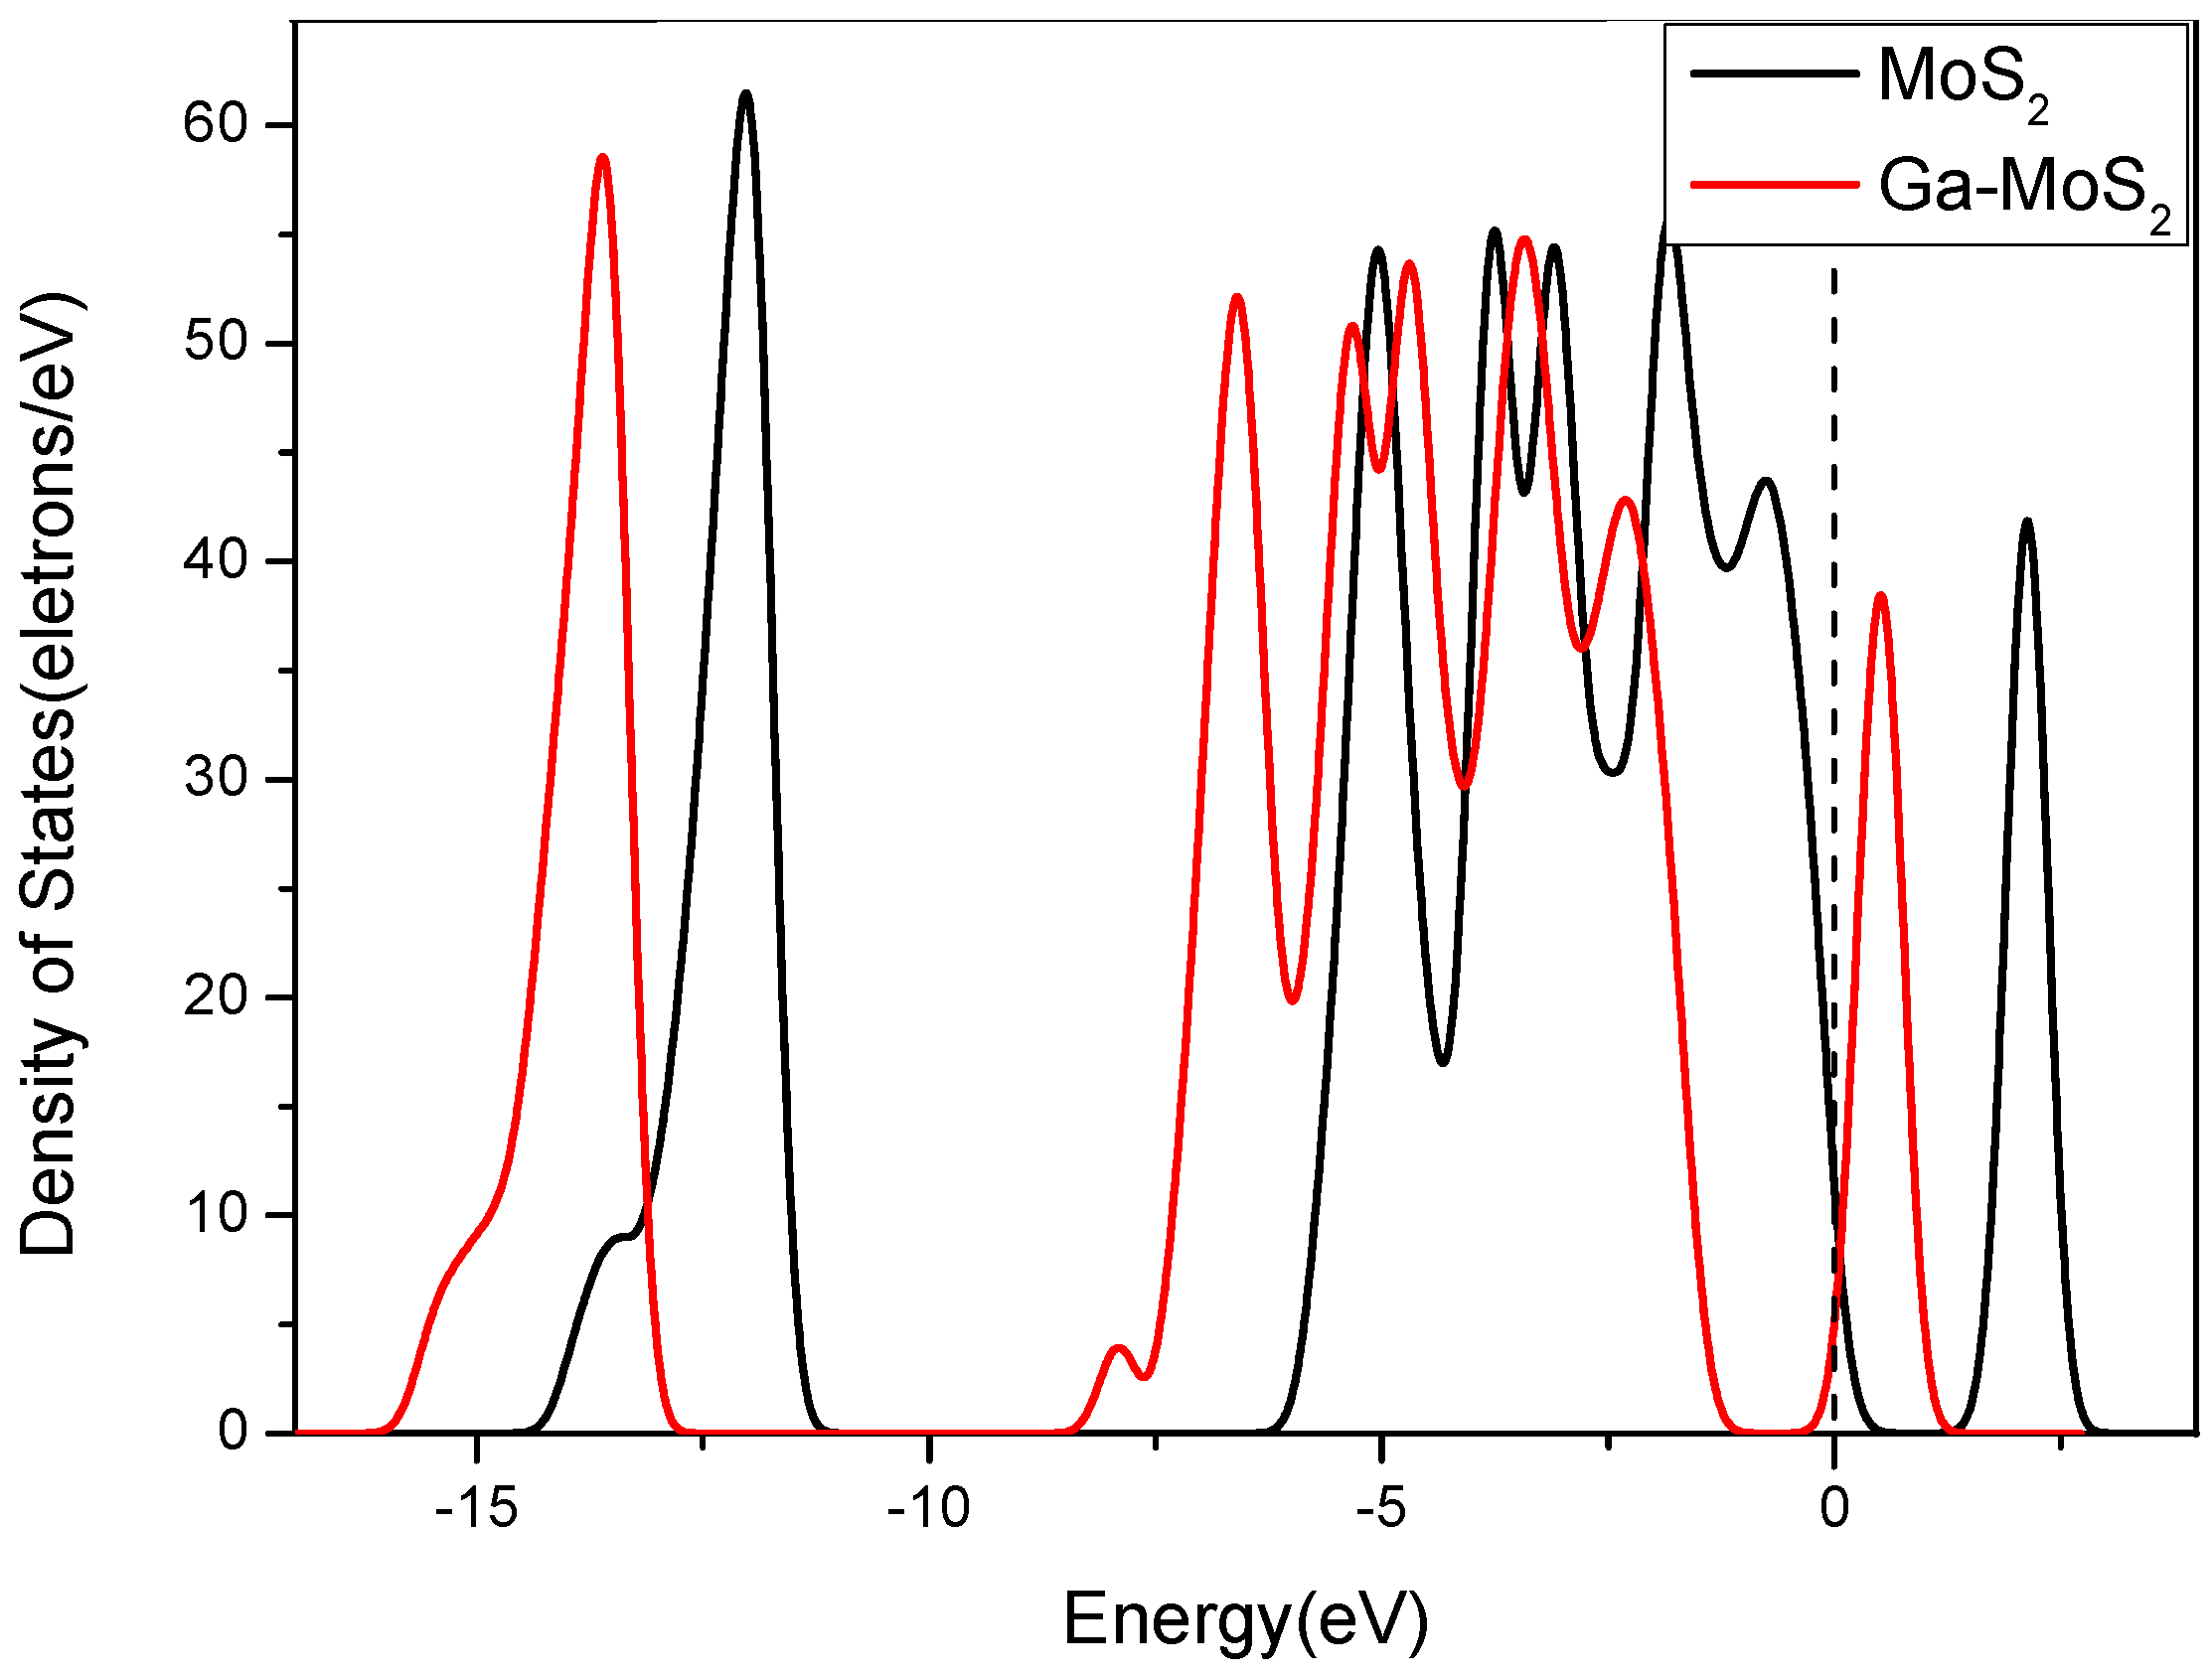
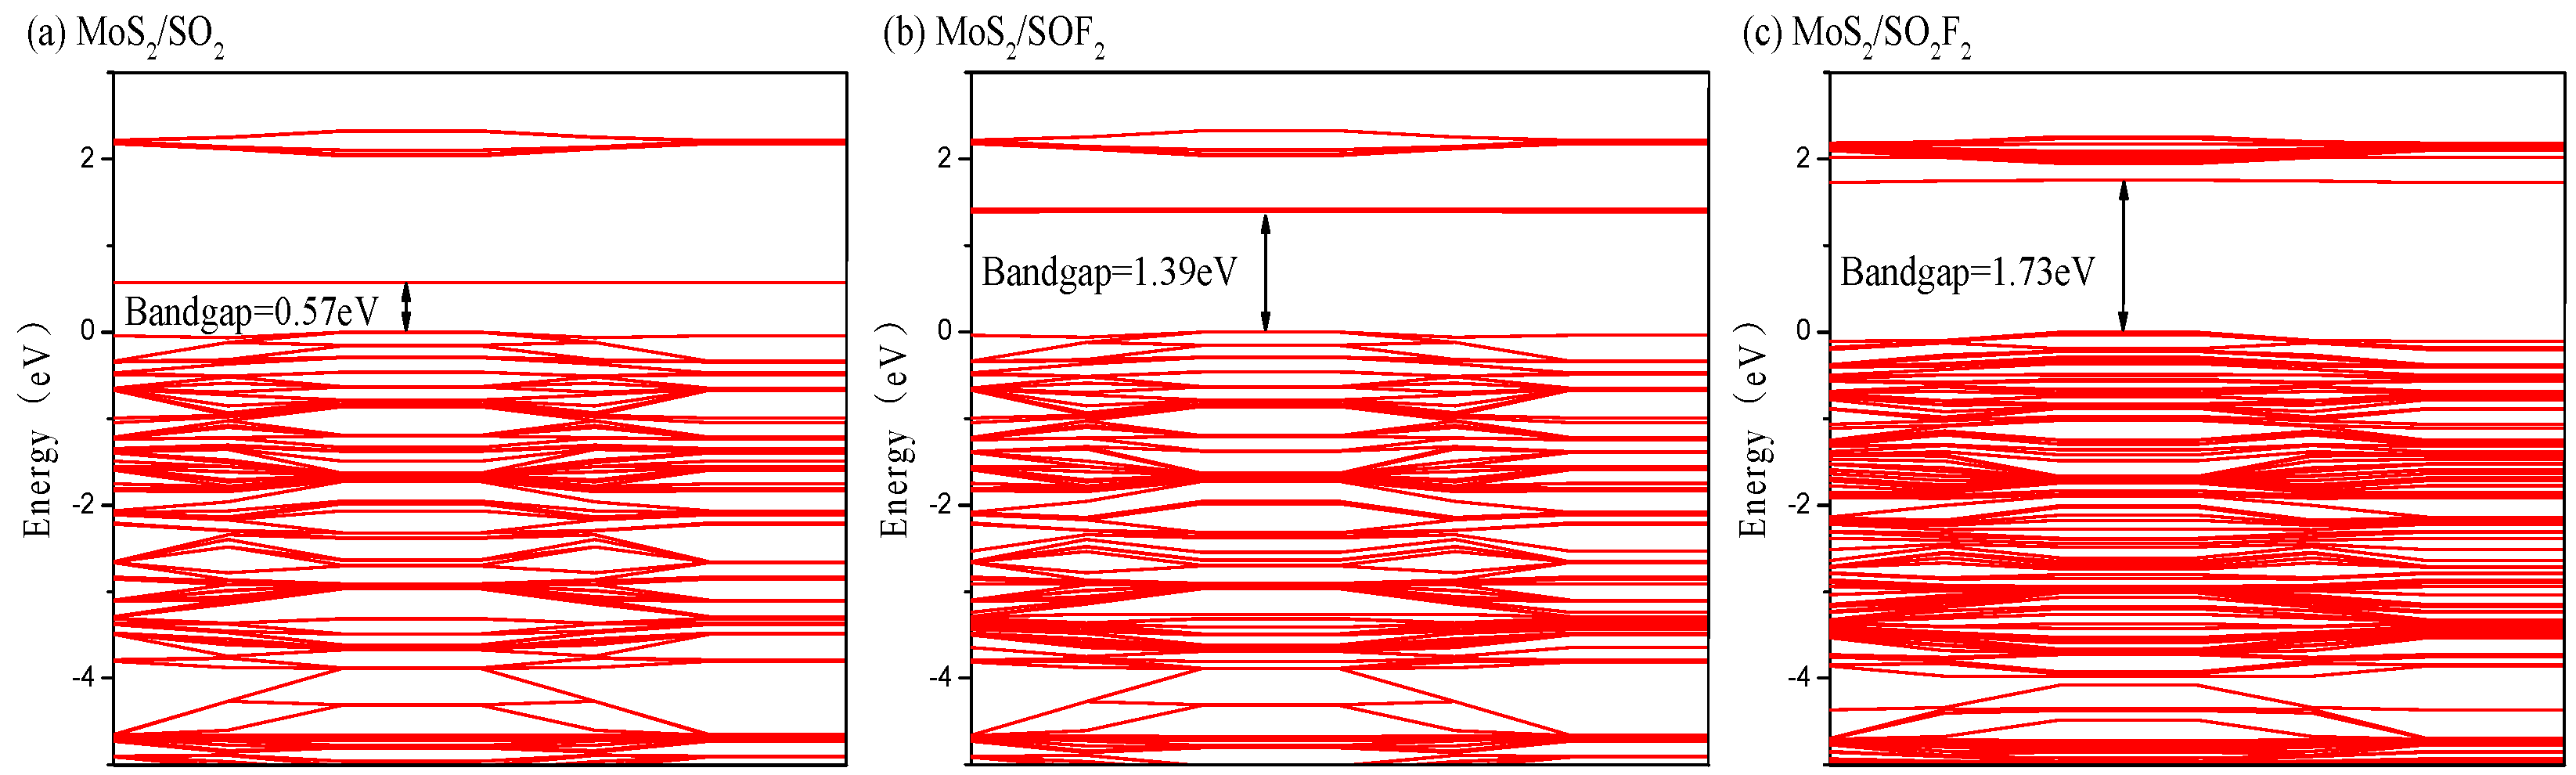
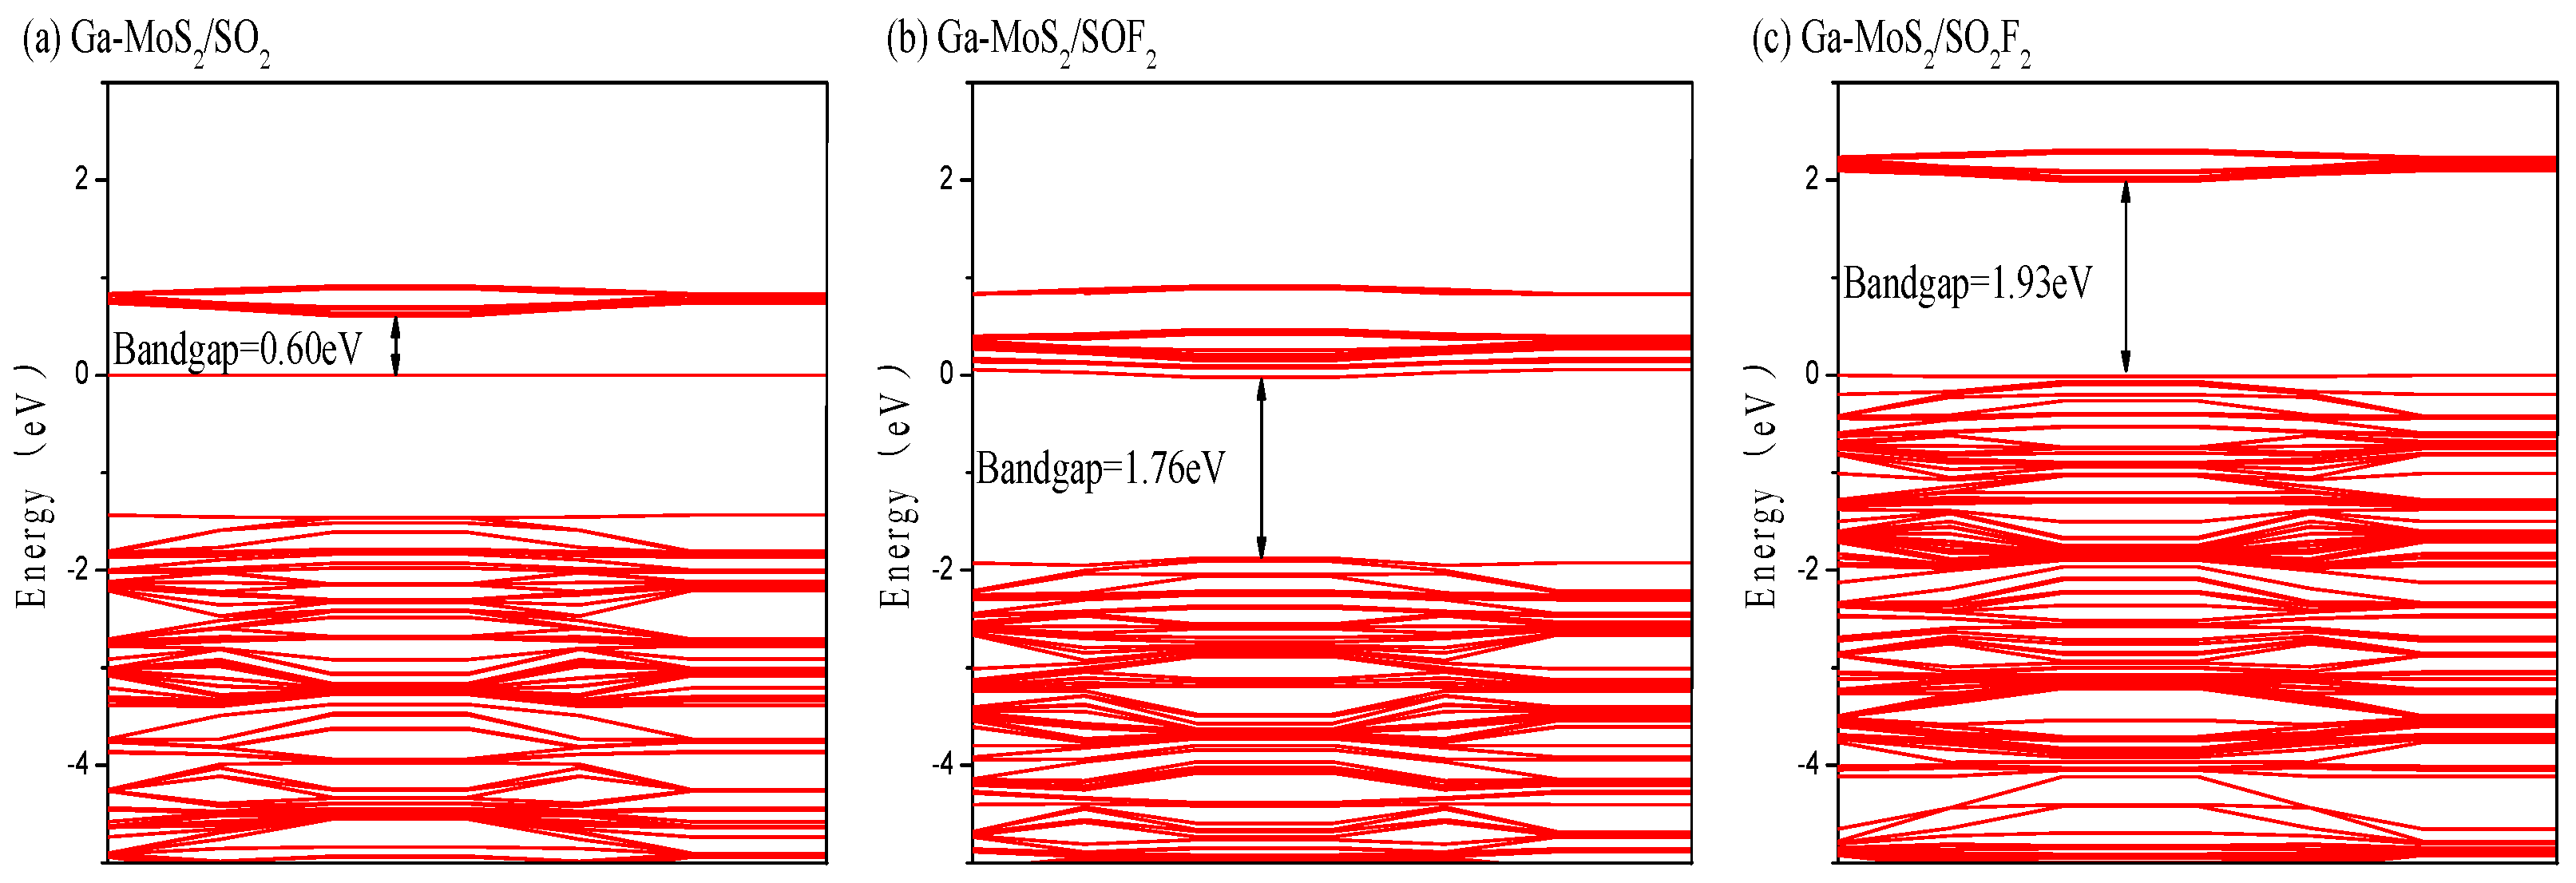
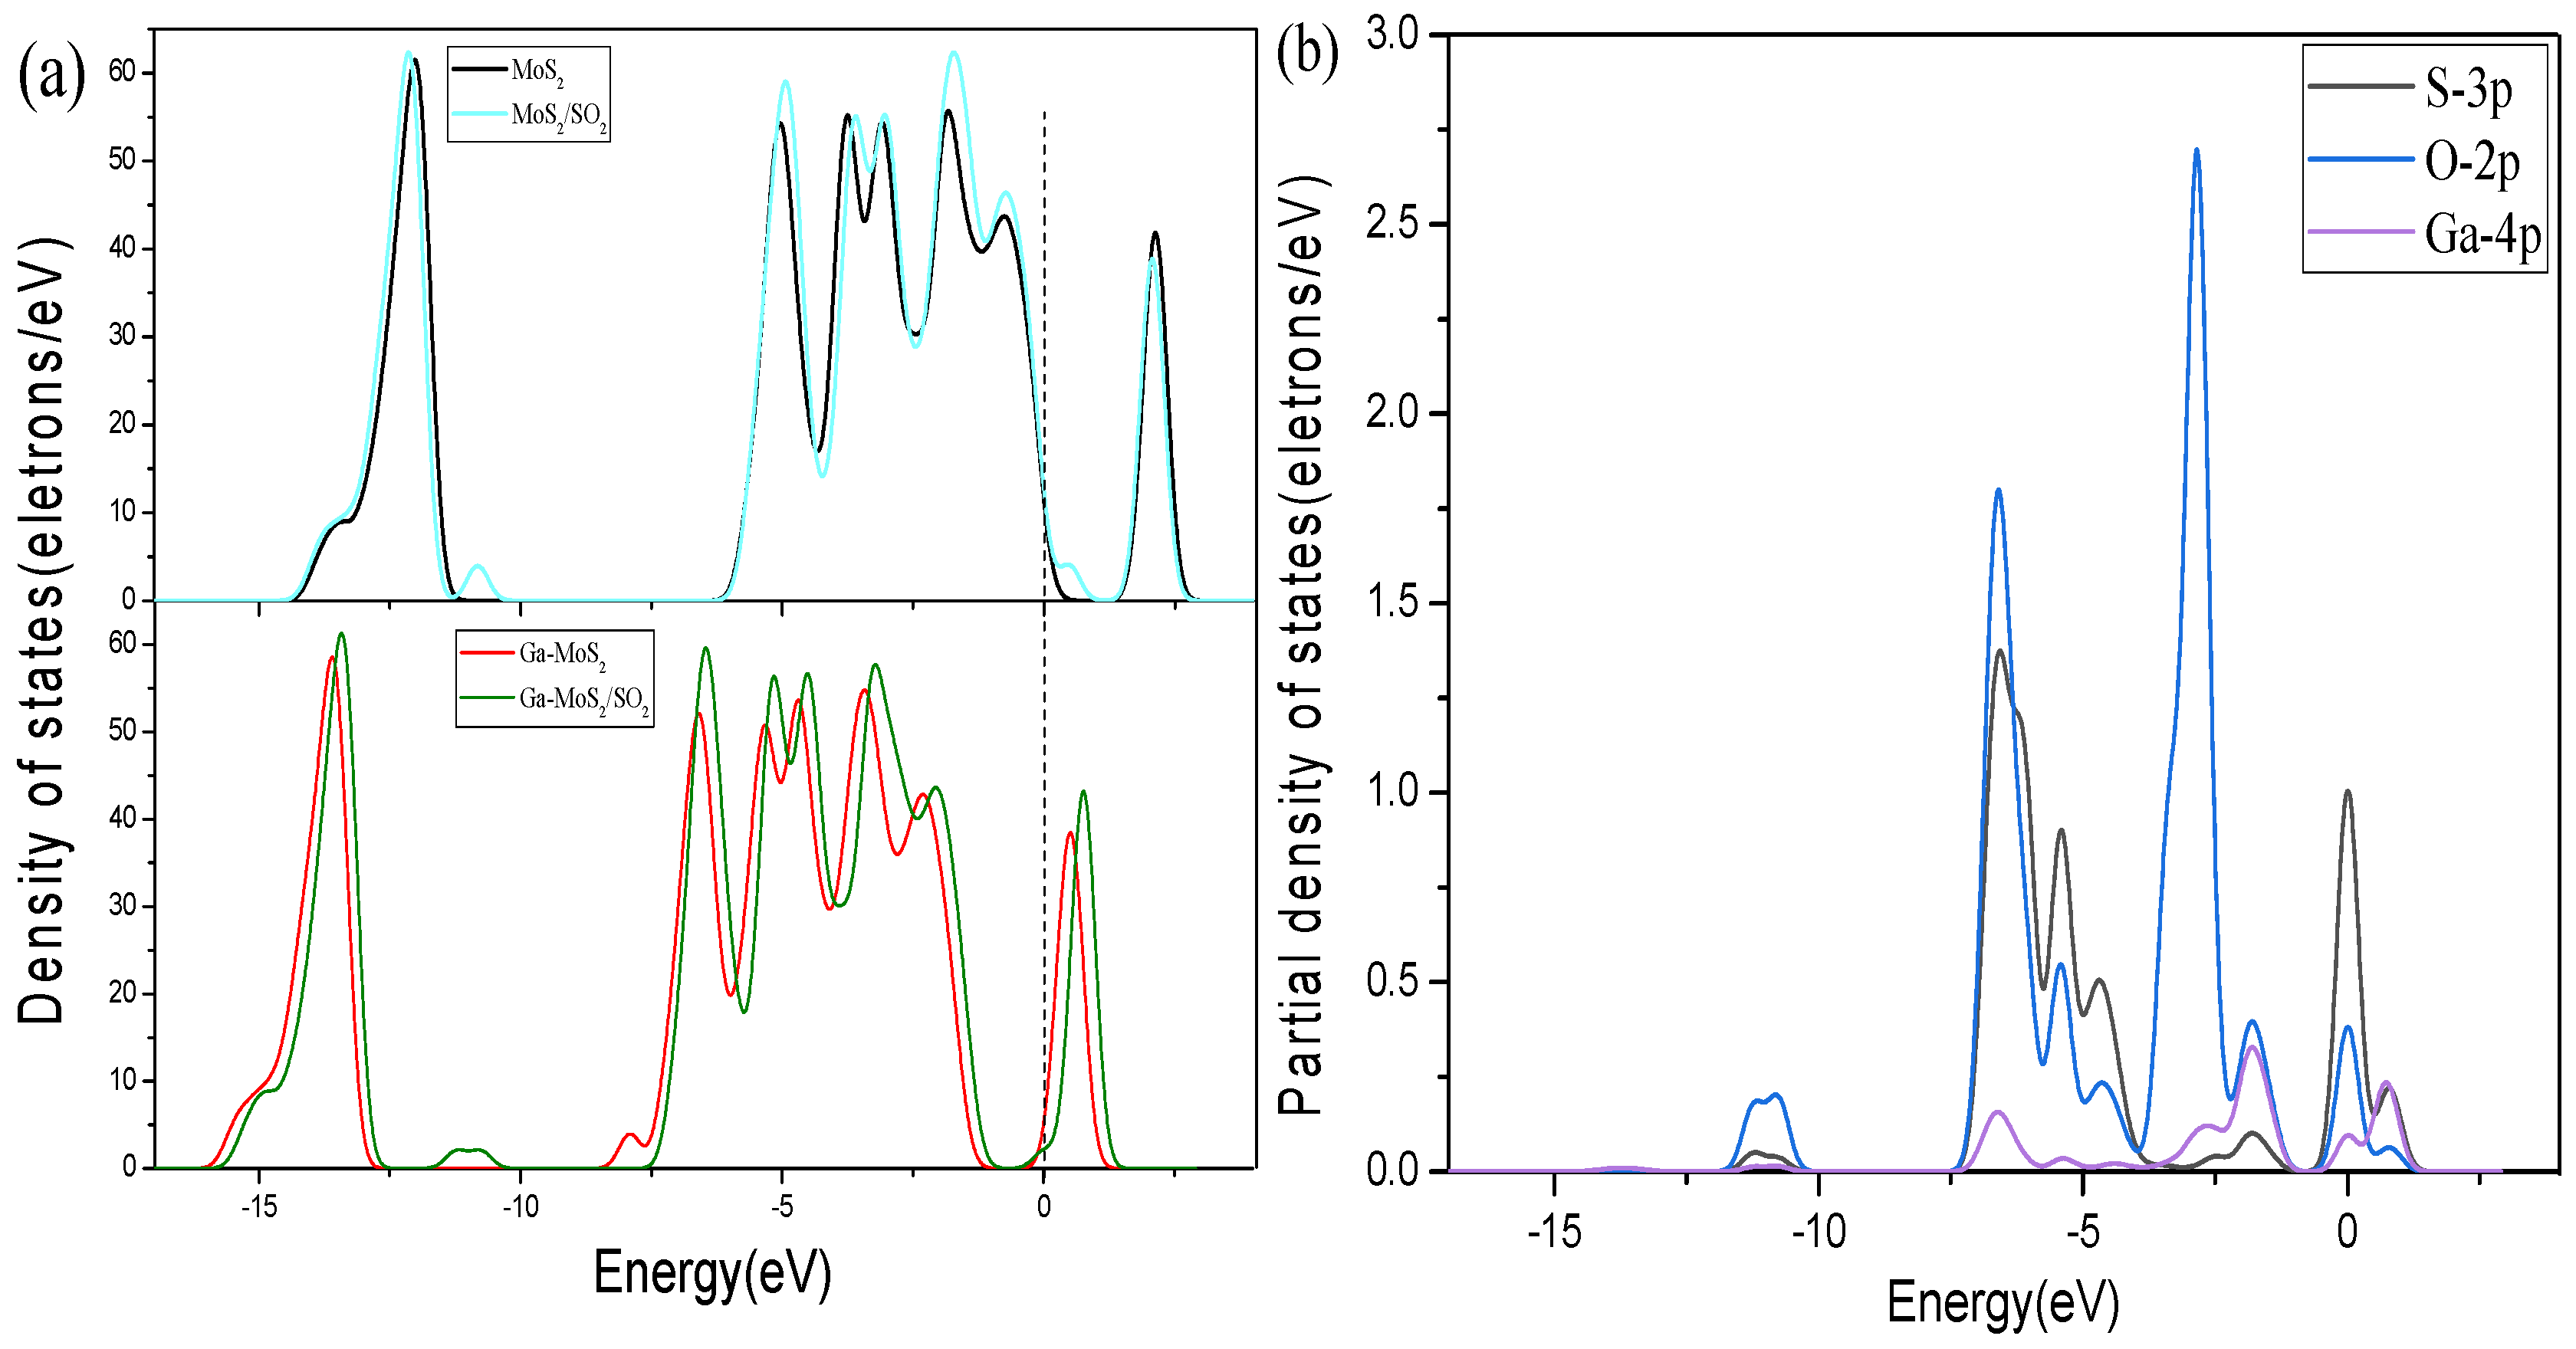
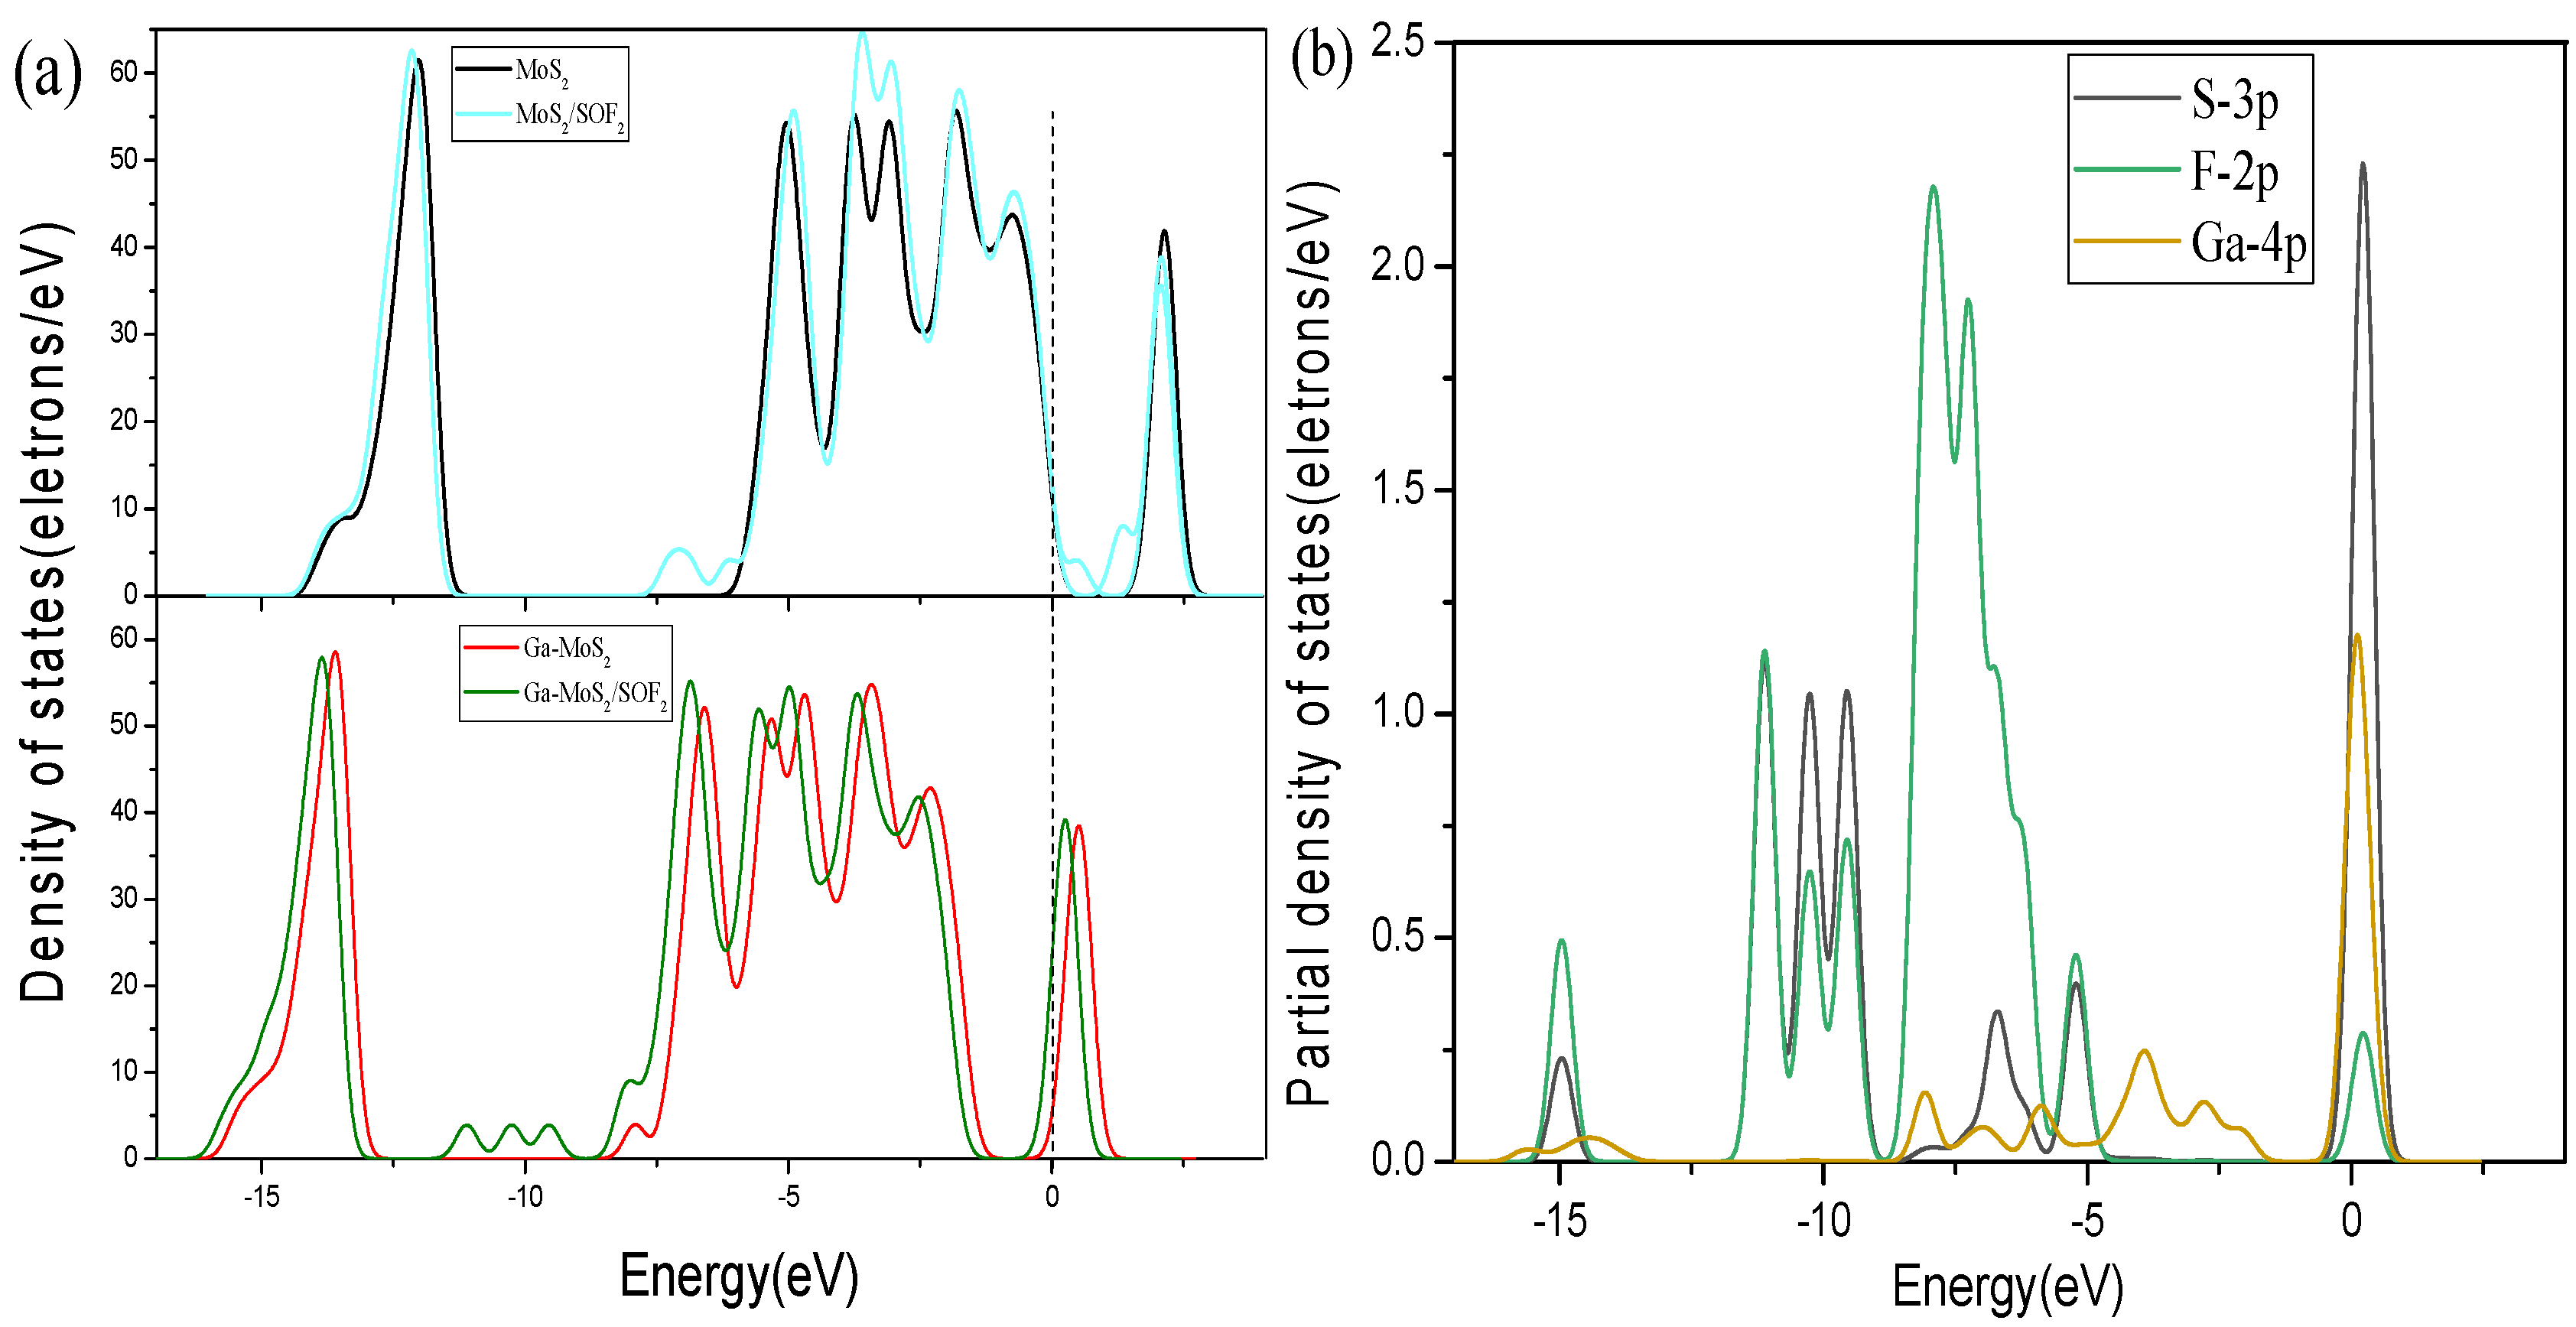
3.2.3. Energy Band and DOS Analysis

For the sake of further discussions about electronic characteristics of the model obtained by adsorption, the energy band structure and DOS of the three adsorption models were analyzed [47,48]. Figure 8 shows the band structure diagram of the adsorption system obtained by pure MoS2 and Ga-MoS2 adsorbing SO2, SOF2, and SO2F2.
It can be seen from the above description that the bandgap of Ga-MoS2 without adsorbed gas was 1.90 eV. Figure 8a displays the energy band structure diagram of the adsorption system after Ga-MoS2 adsorbed SO2. The energy bandgap of the system reduced to 0.60 eV, which shows that the adsorption of SO2 could make the electrical conductivity of the material promoted to a certain extent. From Figure 8b, it can be seen that after SOF2 adsorption, the bandgap of the adsorbed system dropped to 1.76 eV. This indicates that electrons could more likely transition from the valence band to the conduction band than the unabsorbed system. As a result, the conductivity of the material had been improved. Figure 8c displays that after the doped structure adsorbs SO2F2, the bandgap of the adsorption system becomes 1.93 eV, which is an increase of 0.03 eV compared to the bandgap of the system without gas adsorption. The energy minimum band distance increases slightly. The conductivity of the entire system decreases, but the decrease in the conductivity of the system was very limited due to the small bandgap increase. Thus, the adsorption of SO2F2 hardly influences the conductivity of Ga-MoS2 monolayer.
To sum up, the conductivity of the material could be improved to varying degrees by adsorbing SO2 and SOF2. At the same time, adsorption of SO2F2 reduced slightly the conductivity of the material.
Figure 9, Figure 10 and Figure 11 show the DOS of Ga-MoS2 for SO2, SOF2, and SO2F2 adsorption structures, divided into TDOS and partial density of states (PDOS).
Figure 9a represents the comparison of the TDOS of the system before and after the adsorption of SO2. As shown, the TDOS of Ga-MoS2 had eight peaks before adsorption of SO2. After the adsorption of SO2, the adsorption system added a new peak near −10 eV, which indicates that the electron orbit of the adsorption system had changed during the adsorption process. At the same time, the TDOS of the system after adsorption was slightly shifted to the right compared with that before the adsorption. After the adsorption of SO2, the peak value of TDOS near 1 eV had increased, and electrons gathered at the bottom of the conduction band. So, the conductivity of the material had been improved to a certain extent. According to the PDOS of Ga-MoS2 for SO2 adsorption displayed in Figure 9b, the DOS of the listed atoms were mainly distributed in the range of −7.5~0 eV. The hybridization primarily occurred between the 4p orbital of Ga and the 2p orbital of O, and the PDOS of −7.5~−5 eV and −2.5~2.5 eV regions with varying degrees of overlap. At the same time, the 3p orbital of S had the most DOS distribution at the Fermi level. It can be inferred that S had the greatest influence on the electrical conductivity of the entire material in this adsorption system.
Figure 10a displays the TDOS changes of the system before and after SOF2 adsorption. The TDOS of the Ga-MoS2 system after adsorption had three new peaks. Additionally, the TDOS after adsorption was slightly moved to the left compared to the system before adsorption. The TDOS at the Fermi level had the obvious increase, meaning that the electrical conductivity of the entire system had been improved after being gas adsorbed. The electrons were more likely to jump to the conduction band. The PDOS of the system could be obtained in Figure 10b. The S-3p, F-2p, and Ga-4p orbitals mainly distributed in the range of −12.5~−5 eV. The hybridization of the system was mostly between the 4p orbital of Ga and the 2p orbital of F. At the same time, it can be seen that in this adsorption system, the 3p orbital of S has the most DOS distribution at the Fermi level. It be concluded that, in this system, S had the strongest influence on the electrical conductivity of the material.
From Figure 11a, the TDOS of the entire system had a more obvious shift to the right after SO2F2 was adsorbed. Focusing on the Fermi level, it is found that the DOS at the Fermi level does not change much before and after adsorption, which indicates that the conductivity of the entire system changed slightly after adsorption of SO2F2. Figure 11b shows the PDOS of the adsorption system. The DOS of each atom was mainly distributed in the range of −7.5~0 eV. The 4s orbital of Ga and the 2p orbital of F overlap obviously, suggesting that the hybridization of the above-mentioned two orbitals was mainly during the adsorption process. At the same time, it can be seen that in this adsorption system, at the Fermi level, the 4s orbital state density distribution of Ga is the largest, which means that in this adsorption system, the electrical conductivity of the material is mainly affected by Ga atom.

4. Conclusions

In this work, theoretical calculations were carried out to study the adsorption properties of Ga-MoS2 for SO2, SOF2, and SO2F2. The positions of Ga doping were considered. The two ways of gas molecules to approach the doping model were compared. The adsorption parameters, energy bands, and DOS were calculated and analyzed. The main conclusions are as follows:
  • Ga dopant was most likely to be adsorbed onto the MoS2 monolayer through TMo site.
  • The intrinsic MoS2 had a weak adsorption capacity for the target gases.
  • SO2 molecule tends to approach the doped model with S atoms. SOF2 molecule prefers to approach the doped model with O atoms. SO2F2 molecule is likely to approach the doped model with F atoms.
  • The conductivity of the material could be improved to varying degrees by adsorbing SO2, SOF2, while adsorption of SO2F2 had little effect on the conductivity of the material. The E a d of SO2 and SO2F2 were both negative, indicating that Ga-MoS2 could adsorb the above two gases more stably. The E a d of SOF2 is positive, which proves that Ga-MoS2 had some difficulty in adsorption of SOF2. The Ga-MoS2 can be used as an excellent gas-sensing material for SO2 and SO2F2 molecules.

Author Contributions

Conceptualization, W.H. and H.M.; Data curation, W.H.; Investigation, W.H. and H.M.; Methodology, W.H. and Q.Z.; Project administration, W.Z. and Q.Z.; Resources, S.P.; Supervision, Q.Z.; Validation, H.M., R.P. and S.P.; Visualization, R.P.; Writing–original draft, W.H.; Writing—review and editing, W.H., H.M., R.P., W.Z. and Q.Z. All authors have read and agreed to the published version of the manuscript.

Funding

This research was funded by the National Natural Science Foundation of China (Nos. 52077177 and 51507144) and Fundamental Research Funds for the Central Universities (No. XDJK2019B021).

Informed Consent Statement

Not applicable.

Data Availability Statement

The data is available on the request from corresponding author.

Conflicts of Interest

The authors declare no conflict of interest.

References

  1. Zeng, F.P.; Li, H.T.; Zhang, M.X.; Li, C.; Yao, Q.; Tang, J. Establishment of Reax force field of SF6 gas over-thermal decomposition. J. Phys. D Appl. Phys. 2020, 26, 125540. [Google Scholar]
  2. Zhang, X.X.; Cui, Z.L.; Yi, L.; Li, Y.L.; Xiao, H.Y.; Chan, D.C. Theoretical study of the interaction of SF6 molecule on Ag (1 1 1) surfaces. Appl. Surf. Sci. 2018, 457, 745–751. [Google Scholar] [CrossRef]
  3. Liu, H.C.; Zhou, Q.; Zhang, Q.Y.; Hong, C.X.; Xu, L.N.; Jin, L.F.; Chen, W.G. Synthesis, Characterization and Enhanced Sensing Properties of a NiO/ZnO p-n Junctions Sensor for the SF6 Decomposition Byproducts SO2, SO2F2, and SOF2. Sensors 2017, 17, 913. [Google Scholar] [CrossRef] [Green Version]
  4. Wang, J.X.; Zhou, Q.; Zeng, W. Competitive adsorption of SF6 decompositions on Ni-doped ZnO (100) surface: Computational and experimental study. Appl. Surf. Sci. 2019, 479, 185–197. [Google Scholar] [CrossRef]
  5. Tang, J.; Zeng, F.; Pan, J.; Zhang, X.X.; Yao, Q.; He, J.; Hou, X. Correlation analysis between formation process of SF6 decomposed components and partial discharge qualities. IEEE Trans. Dielectr. Electr. Insul. 2013, 20, 864–875. [Google Scholar] [CrossRef]
  6. Dasgupta, U.; Chatterjee, S.; Pal, A.J. Thin-film formation of 2D MoS2 and its application as a hole-transport layer in planar perovskite solar cells. Sol. Energ. Mat. Sol. C 2017, 172, 353–360. [Google Scholar] [CrossRef]
  7. Zeng, F.P.; Li, H.T.; Zhang, M.X.; Lei, Z.C.; Li, C.; Tang, J. Isotope Tracing Experimental Study on the Effects of Trace H2O on the Over-Thermal Decomposition of SF6. J. Phys. D Appl. Phys. 2020, 53, 355501. [Google Scholar] [CrossRef]
  8. Abbasi, A.; Sardroodi, J.J. Adsorption of O3, SO2 and SO3 gas molecules on MoS2 monolayers: A computational investigation. Appl. Surf. Sci. 2019, 469, 781–791. [Google Scholar] [CrossRef]
  9. Zhang, X.X.; Ren, J.B.; Tang, J.; Sun, C.X. Kernel statistical uncorrelated optimum discriminant vectors algorithm for GIS PD recognition. IEEE Trans. Dielectr. Electr. Insul. 2009, 16, 206–213. [Google Scholar] [CrossRef]
  10. Chen, D.C.; Tang, J.; Zhang, X.X.; Li, Y.; Liu, H.J. Detecting decompositions of sulfur hexafluoride using MoS2 monolayer as gas sensor. IEEE Sens. J. 2019, 19, 39–46. [Google Scholar] [CrossRef]
  11. Zhang, D.Z.; Jiang, C.X.; Wu, J.F. Layer-by-layer assembled In2O3 nanocubes/flower-like MoS2 nanofilm for room temperature formaldehyde sensing. Sens. Actuators B Chem. 2018, 273, 176–184. [Google Scholar] [CrossRef]
  12. Fan, C.; Liu, G.Z.; Zhang, Y.H.; Wang, M.J. Synthesis and gas-responsive characteristics to methanol and isopropanol of bean-sprout-like MoS2. Mater. Lett. 2017, 209, 8–10. [Google Scholar] [CrossRef]
  13. Wu, S.Y.; Zeng, F.P.; Tang, J.; Yao, Q.; Miao, Y. Triangle Fault Diagnosis Method for SF6 Gas Insulated Equipment. IEEE Trans. Power Del. 2019, 34, 1470–1477. [Google Scholar] [CrossRef]
  14. Zhang, X.X.; Gui, Y.G.; Dong, X.C. Preparation and application of TiO2 nanotube array gas sensor for SF6-insulated equipment detection: A review. Nanoscale Res. Lett. 2016, 11, 302. [Google Scholar] [CrossRef] [Green Version]
  15. Cho, B.; Yoon, J.; Lim, S.K.; Kim, A.R.; Kim, D.H.; Park, S.G.; Kwon, J.D.; Lee, Y.J.; Lee, K.H.; Lee, B.H. Chemical sensing of 2D graphene/MoS2 heterostructure device. ACS Appl. Mater. Inter. 2015, 7, 16775–16780. [Google Scholar] [CrossRef]
  16. Zeng, F.P.; Lei, Z.C.; Yang, X.; Tang, J.; Yao, Q.; Miao, Y.L. Evaluating the DC Partial Discharge Based on SF6 Decomposition Characteristics. IEEE Trans. Power Del. 2019, 34, 1383–1392. [Google Scholar] [CrossRef]
  17. Wu, P.; Yin, N.Q.; Li, P.; Cheng, W.J.; Huang, M. The adsorption and diffusion behavior of noble metal adatoms (Pd, Pt, Cu, Ag and Au) on a MoS2 monolayer: A first-principles study. Phys. Chem. Chem. Phys. 2017, 19, 20713–20722. [Google Scholar] [CrossRef]
  18. Wang, J.X.; Zhou, Q.; Lu, Z.R.; Wei, Z.J.; Zeng, W. Gas sensing performances and mechanism at atomic level of Au-MoS2 microspheres. Appl. Surf. Sci. 2019, 490, 124–136. [Google Scholar] [CrossRef]
  19. Abbas, H.G.; Debela, T.T.; Hussain, S.; Hussain, I. Inorganic molecule (O2, NO) adsorption on nitrogen- and phosphorus-doped MoS2 monolayer using first principle calculations. RSC Adv. 2018, 8, 38656–38666. [Google Scholar] [CrossRef] [Green Version]
  20. Gao, X.; Zhou, Q.; Wang, J.X.; Xu, L.N.; Zeng, W. Adsorption of SO2 molecule on Ni-doped and Pd-doped graphene based on first-principle study. Appl. Surf. Sci. 2020, 517, 146180. [Google Scholar] [CrossRef]
  21. Li, T.; Gui, Y.; Zhao, W.; Tang, C.; Dong, X. Palladium modified MoS2 monolayer for adsorption and scavenging of SF6 decomposition products: A DFT study. Phys. E 2020, 123, 114178. [Google Scholar] [CrossRef]
  22. Azofra, L.M.; Sun, C.H.; Cavallo, L.; MacFarlane, D.R. Feasibility of N2 binding and reduction to ammonia on Fe-deposited MoS2 2D sheets: A DFT study. Chem. Eur. J. 2017, 23, 8275–8279. [Google Scholar] [CrossRef] [PubMed] [Green Version]
  23. Zhou, Q.; Zeng, W.; Chen, W.G.; Xu, L.N.; Kumar, R.; Umar, A. High sensitive and low-concentration sulfur dioxide (SO2) gas sensor application of heterostructure NiO-ZnO nanodisks. Sens. Act. B Chem. 2019, 298, 126870. [Google Scholar] [CrossRef]
  24. Wang, J.X.; Zhou, Q.; Wei, Z.J.; Xu, L.N.; Zeng, W. Experimental and theoretical studies of Zn-doped MoO3 hierarchical microflower with excellent sensing performances to carbon monoxide. Ceram. Inter. 2020, 46, 29222–29232. [Google Scholar] [CrossRef]
  25. Wang, M.; Wang, W.; Ji, M.; Cheng, X. Adsorption of phenol and hydrazine upon pristine and X-decorated (X=Sc, Ti, Cr and Mn) MoS2 monolayer. Appl. Surf. Sci. 2018, 439, 350–363. [Google Scholar] [CrossRef]
  26. Chen, D.C.; Zhang, X.X.; Tang, J.; Cui, H.; Li, Y. Noble metal (Pt or Au)-doped monolayer MoS2 as a promising adsorbent and gas-sensing material to SO2, SOF2 and SO2F2: A DFT study. Appl. Phys. A Mater. Sci. Process. 2018, 124, 194. [Google Scholar] [CrossRef]
  27. Gui, X.X.; Zhou, Q.; Peng, S.D.; Xu, L.N.; Zeng, W. Dissolved gas analysis in transformer oil using Sb-doped graphene: A DFT study. Appl. Surf. Sci. 2020, 533, 147509. [Google Scholar] [CrossRef]
  28. Wang, Y.; Li, D.; Lai, X.; Liu, B.; Chen, Y.; Wang, F.; Wang, R.; Zhang, L. Direct observation of the hysteretic Fermi level modulation in monolayer MoS2 field effect transistors. Curr. Appl. Physics. 2020, 20, 293–303. [Google Scholar] [CrossRef]
  29. Gui, Y.G.; Wang, Y.; Duan, S.K.; Tang, C.; Zhou, Q.; Xu, L.N.; Zhang, X.X. Ab Initio Study of SOF2 and SO2F2 Adsorption on Co-MoS2. ACS Omega 2019, 4, 2517–2522. [Google Scholar] [CrossRef] [Green Version]
  30. Zhou, Q.; Xu, L.N.; Umar, A.; Chen, W.G.; Kumar, R. Pt nanoparticles decorated SnO2 nanoneedles for efficient CO gas sensing applications. Sens. Act. B Chem. 2018, 256, 656–664. [Google Scholar] [CrossRef]
  31. Jiang, C.X.; Zhang, D.Z.; Yin, N.L.; Yao, Y.; Shaymurat, T.; Zhou, X.Y. Acetylene Gas-Sensing Properties of Layer-by-Layer Self-Assembled Ag-Decorated Tin Dioxide/Graphene Nanocomposite Film. Nanomaterials 2017, 7, 278. [Google Scholar] [CrossRef] [PubMed] [Green Version]
  32. Gao, X.; Zhou, Q.; Wang, J.X.; Xu, L.N.; Zeng, W. Enhanced ethanol sensing and mechanism of Cr-doped ZnO nanorods: Experimental and computational study. Ceram. Int. 2017, 43, 14873–14879. [Google Scholar]
  33. Zhou, Q.; Chen, W.G.; Xu, L.N.; Kumar, R.; Gui, Y.G.; Zhao, Z.Y.; Tang, C.; Zhu, S.P. Highly sensitive carbon monoxide (CO) gas sensors based on Ni and Zn doped SnO2 nanomaterials. Ceram. Int. 2018, 44, 4392–4399. [Google Scholar] [CrossRef]
  34. Cui, H.; Zhang, X.X.; Zhang, G.Z.; Tang, J. Pd-doped MoS2 monolayer: A promising candidate for DGA in transformer oil based on DFT method. Appl. Surf. Sci. 2019, 470, 1035–1042. [Google Scholar] [CrossRef]
  35. Gui, X.X.; Zhou, Q.; Peng, S.D.; Xu, L.N.; Zeng, W. Adsorption behavior of Rh-doped MoS2 monolayer towards SO2, SOF2, SO2F2 based on DFT study. Phys. E 2020, 122, 114224. [Google Scholar] [CrossRef]
  36. Wang, J.X.; Zhou, Q.; Lu, Z.R.; Wei, Z.J.; Zeng, W. Adsorption of H2O molecule on TM (Au, Ag) doped-MoS2 monolayer: A firstprinciples study. Phys. E 2019, 113, 72–78. [Google Scholar] [CrossRef]
  37. Zhang, Y.J.; Zeng, W.; Li, Y.Q. Hydrothermal synthesis and controlled growth of hierarchical 3D flowerlike MoS2 nanospheres assisted with CTAB and their NO2 gas sensing. Appl. Surf. Sci. 2018, 455, 276–282. [Google Scholar] [CrossRef]
  38. Cui, H.; Jia, P.F. Doping effect of small Rhn (n = 1–4) clusters on the geometric and electronic behaviors of MoS2 monolayer: A firstprinciples study. Appl. Surf. Sci. 2020, 526, 146659. [Google Scholar] [CrossRef]
  39. Zhou, Q.; Hong, C.X.; Yao, Y.; Hussain, S.; Xu, L.N.; Zhang, Q.Y.; Gui, Y.G.; Wang, M.S. Hierarchically MoS2 nanospheres assembled from nanosheets for superior CO gas-sensing properties. Mater. Res. Bull. 2018, 30, 132–139. [Google Scholar] [CrossRef]
  40. Zhang, Y.J.; Zeng, W.; Li, Y.Q. The hydrothermal synthesis of 3D hierarchical porous MoS2 microspheres assembled by nanosheets with excellent gas sensing properties. J. Alloys Compd. 2018, 307, 355–362. [Google Scholar] [CrossRef]
  41. Wei, Z.J.; Zhou, Q.; Zeng, W. Hierarchical WO3-NiO microflower for high sensitivity detection of SF6 decomposition byproduct H2S. Nanotechnology. 2020, 31, 215701. [Google Scholar] [CrossRef] [PubMed]
  42. Gui, Y.G.; Liu, D.K.; Li, X.D.; Tang, C.; Zhou, Q. DFT-based study on H2S and SOF2 adsorption on Si-MoS2 monolayer. Results Phys. 2019, 13, 102225. [Google Scholar] [CrossRef]
  43. Zhou, Q.; Chen, W.G.; Li, J.; Peng, S.D.; Lu, Z.R.; Yang, Z.; Xu, L.N. Highly sensitive hydrogen sulfide sensor based on titanium dioxide nanomaterials. J. Nanoelectron. Optoelectron. 2018, 2417, 1784–1788. [Google Scholar] [CrossRef]
  44. Zhao, B.; Li, C.Y.; Liu, L.L.; Zhou, B.; Zhang, Q.K.; Chen, Z.Q.; Tang, Z. Adsorption of gas molecules on Cu impurities embedded monolayer MoS2: A first-principles study. Appl. Surf. Sci. 2016, 158, 280–287. [Google Scholar] [CrossRef]
  45. Wang, J.X.; Zhou, Q.; Xu, L.N.; Gao, X.; Zeng, W. Gas sensing mechanism of dissolved gases in transformer oil on Ag-MoS2 monolayer. Phys. E 2019, 118, 113947. [Google Scholar] [CrossRef]
  46. Sahoo, M.P.K.; Wang, J.; Zhang, Y.J.; Shimada, T.; Kitamura, T. Modulation of gas adsorption and magnetic properties of monolayer-MoS2 by antisite defect and strain. J. Phys. Chem. C. 2016, 120, 14113–14121. [Google Scholar] [CrossRef]
  47. Qian, H.; Lu, W.H.; Wei, X.X.; Chen, W.; Deng, J. H2S and SO2 adsorption on Pt-MoS2 adsorbent for partial discharge elimination: A DFT study. Results Phys. 2019, 12, 107–112. [Google Scholar] [CrossRef]
  48. Park, J.; Mun, J.H.; Shin, J.S.; Kang, S.W. Highly sensitive two-dimensional MoS2 gas sensor decorated with Pt nanoparticles. R. Soc. Open Sci. 2018, 12, 181462. [Google Scholar] [CrossRef] [Green Version]
Figure 1. Structures of (a) SF6, (b) SO2, (c) SOF2, (d) SO2F2.
Nanomaterials 11 00314 g001
Figure 2. Structure of (a) pure MoS2, (b) TS site, (c) BS-S site, (d) TMo site, (e) TH site.
Nanomaterials 11 00314 g002
Figure 3. The energy band of (a) MoS2 (b) Ga-MoS2 system.
Nanomaterials 11 00314 g003
Figure 4. The density of states (DOS) curves comparison before and after doping. The dotted lines are Fermi level.
Nanomaterials 11 00314 g004
Figure 5. Adsorption structures of MoS2 for (a) SO2 (b) SOF2 (c) SO2F2.
Nanomaterials 11 00314 g005
Figure 6. The energy band of (a) MoS2/SO2 (b) MoS2/SOF2 (c) MoS2/SO2F2 adsorption system.
Nanomaterials 11 00314 g006
Figure 7. Structure of (a1,a2) SO2 adsorption mode, (b1,b2) SOF2 adsorption mode, (c1,c2) SO2F2 adsorption mode.
Nanomaterials 11 00314 g007
Figure 8. The energy band of (a) Ga-MoS2/SO2 (b) Ga-MoS2/SOF2 (c) Ga-MoS2/SO2F2adsorption system.
Nanomaterials 11 00314 g008
Figure 9. Comparative analysis of (a) DOS and (b) PDOS for SO2 system. The dotted lines are Fermi level.
Nanomaterials 11 00314 g009
Figure 10. Comparative analysis of (a) DOS and (b) PDOS for SOF2 system. The dotted lines are Fermi level.
Nanomaterials 11 00314 g010
Figure 11. Comparative analysis of (a) DOS and (b) PDOS for SO2F2 system. The dotted lines are Fermi level.
Nanomaterials 11 00314 g011
Table 1. Structural parameters of gas molecules.
Gas MoleculeBond Length (Å)Bond Angle (°)
SF6S-F1.64F-S-F90.3
SO2S-O1.48O-S-O119.94
SOF2S-F1.67O-S-F107.14
S-O1.46F-S-F93.039
SO2F2S-F1.61O-S-O126.73
S-O1.44O-S-F107.74
-F-S-F94.44
Table 2. Formation energy of the four Ga-doping models.
Doping SitesTSBS-STMoTH
E f o r m (eV)−1.70−1.74−1.75−1.60
Table 3. Parameters of adsorption of the target gases on MoS2 surface.
Gas MoleculesD (Å) E a d ( eV ) Q t ( e ) Structure
SO23.5022.34−0.04∠ O-S-O112.64
SOF23.5822.41−0.04∠ O-S-F
∠ F-S-F
104.10
95.73
SO2F21.6925.03−0.68∠ O-S-O
∠ O-S-F
∠ F-S-F
100.17
95.38
94.08
Table 4. Parameters of gas adsorption on Ga-MoS2 in different approaches.
ParametersSO2SOF2SO2F2
ApproachMode 1Mode 2Mode 1Mode 2Mode 1Mode 2
D (Å)Ga-O:1.95Ga-S:2.86Ga-F:3.57Ga-O:3.21Ga-O:2.24Ga-F:1.91
E a d (eV)−0.61−0.670.360.27−0.15−0.63
Q t (e)−0.40−0.42−0.010.01−0.59−0.60
Table 5. The parameters for the target gases on the Ga-MoS2 surface.
Gas MoleculeD (Å) E a d ( eV ) Q t ( e ) Gas StructuredGa-S (Å)∠ S-Ga-S (°)
SO22.30−0.67−0.42∠ O-S-O105.533.3252.80
SOF23.210.270.01∠ O-S-F106.762.6671.19
∠ F-S-F93.543
SO2F21.91−0.63−0.60∠ O-S-O121.602.9448.62
∠ O-S-F105.25
∠ F-S-F88.32
Publisher’s Note: MDPI stays neutral with regard to jurisdictional claims in published maps and institutional affiliations.

