
Improved Light Harvesting of Fiber-Shaped Dye-Sensitized Solar Cells by Using a Bacteriophage Doping Method

 , , , and
Abstract
:1. Introduction
2. Materials and Methods
2.1. Materials
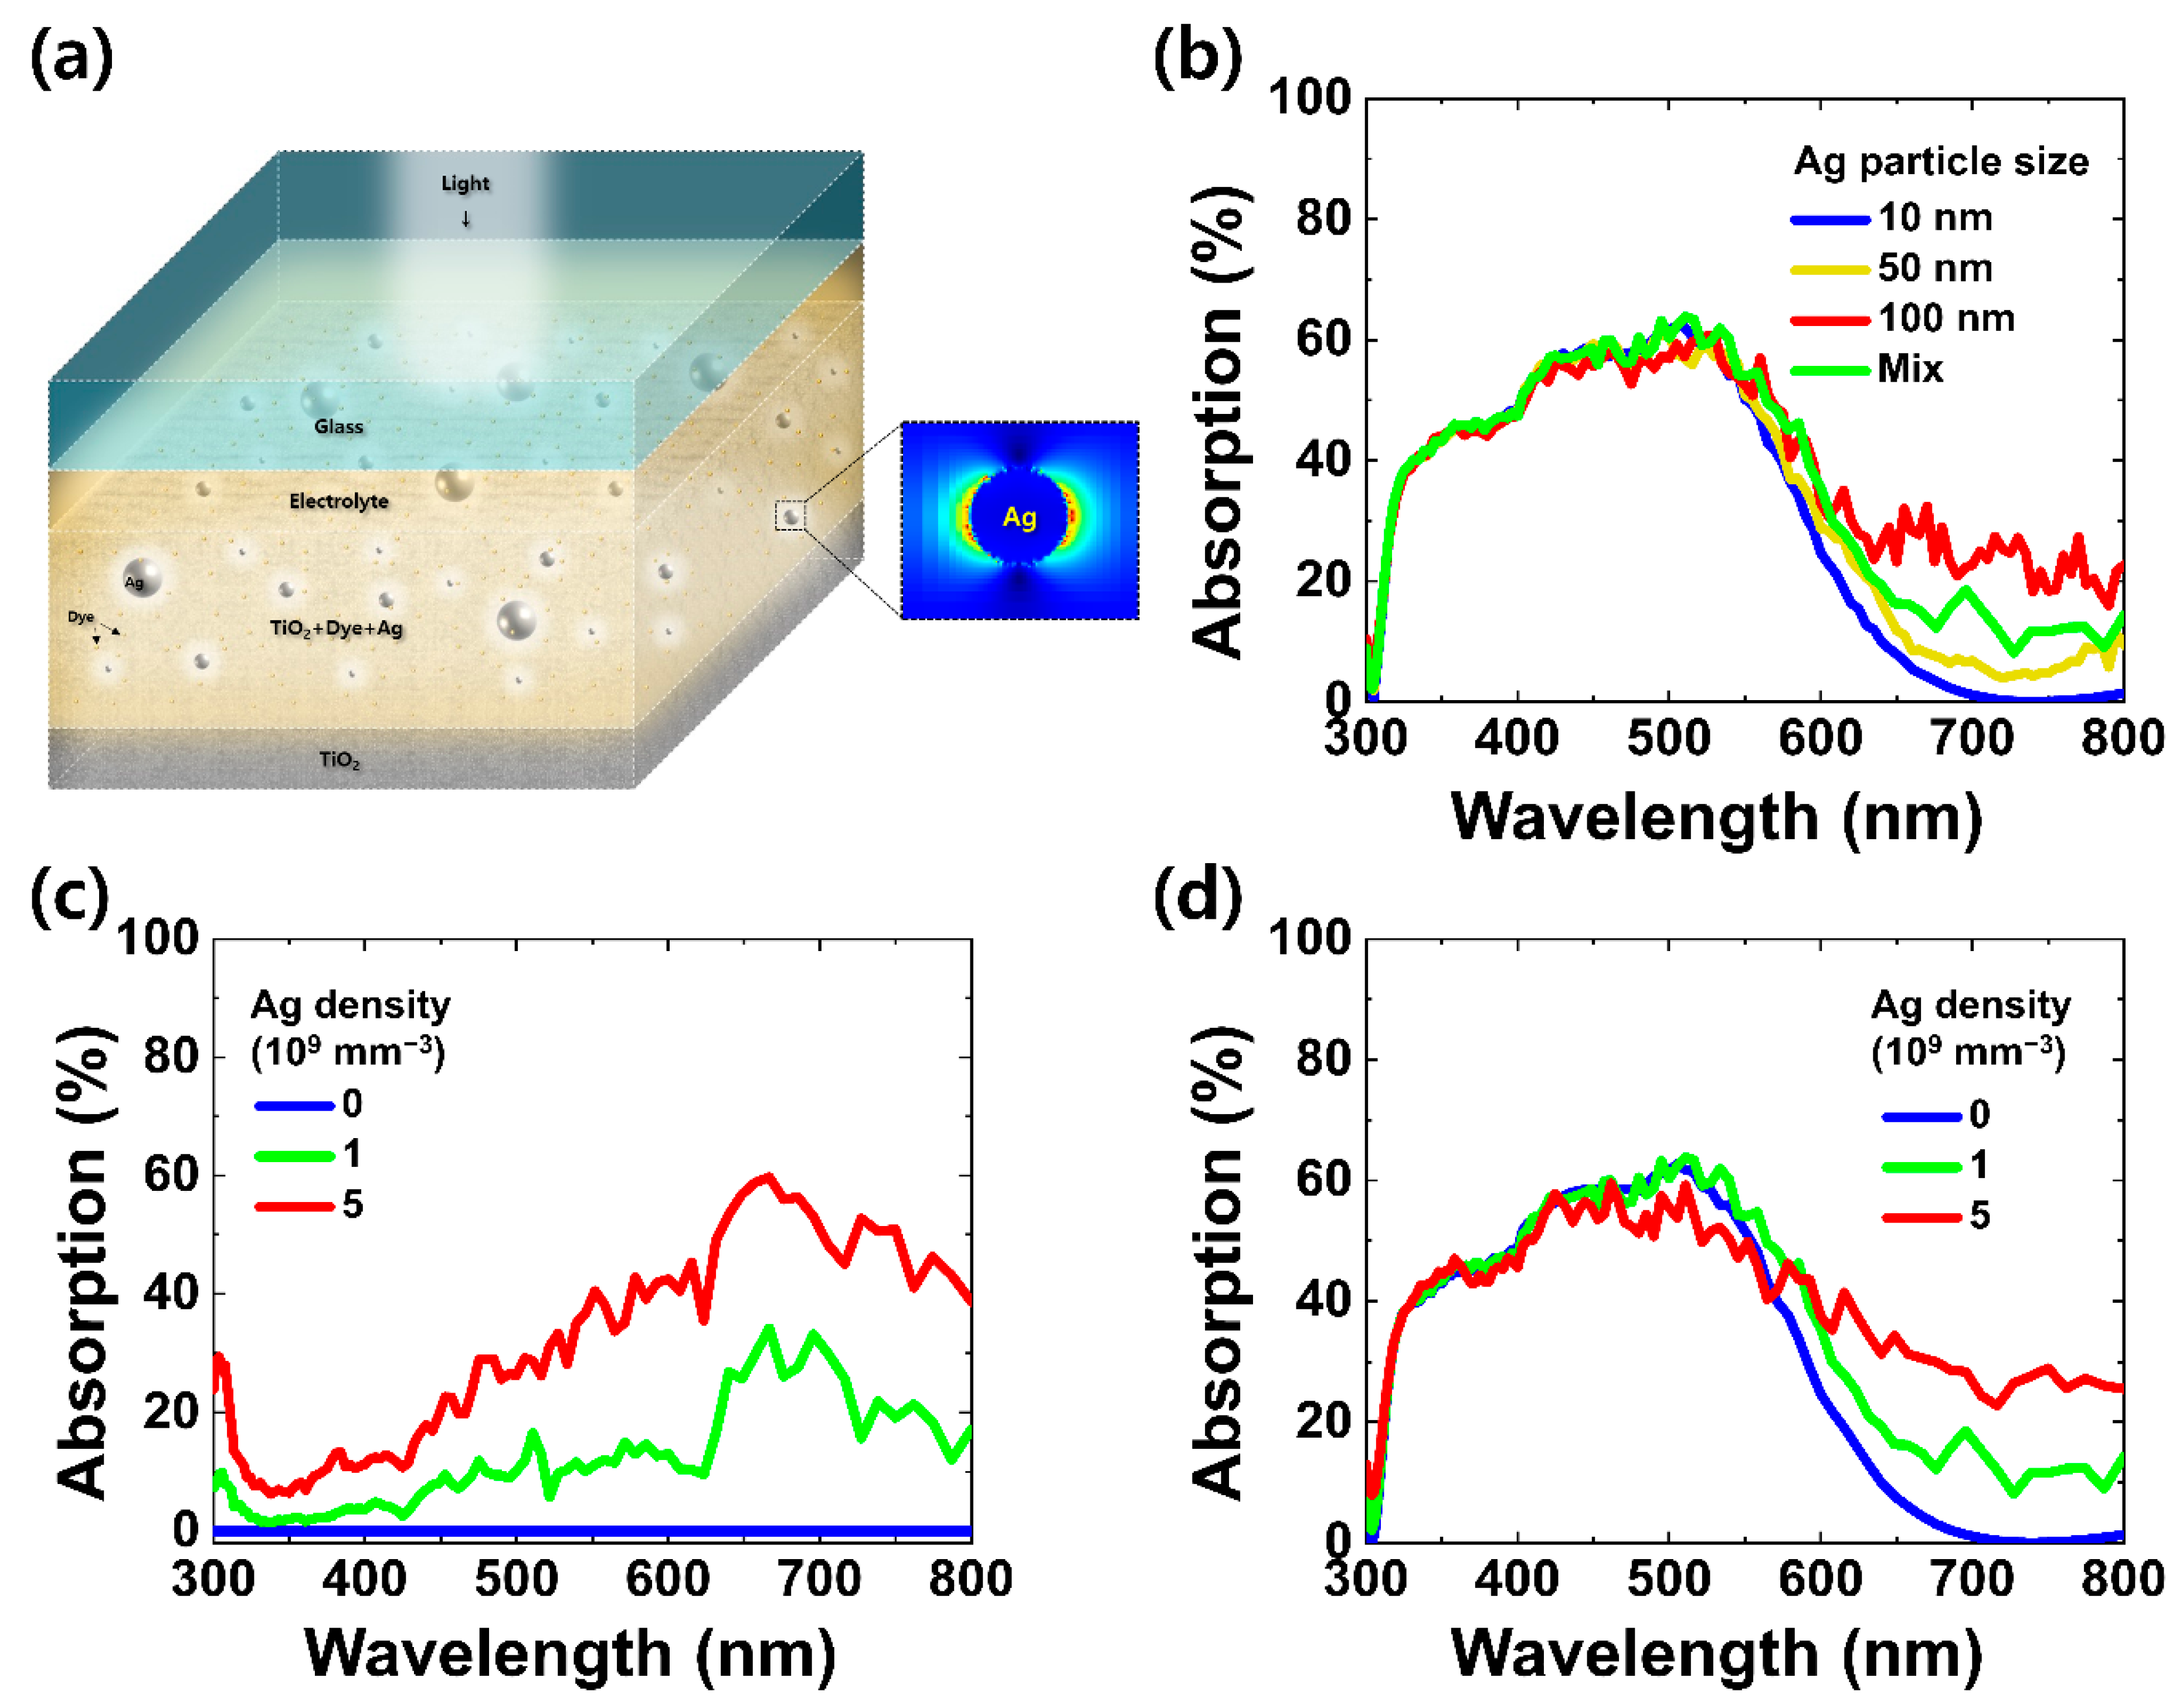
2.2. Optical Simulation of Ag-BP-DSSC
2.3. Fabrication of the FDSSC
2.4. Liquid Crystal (LC) Layering
2.5. Characterization
3. Results and Discussion
4. Conclusions
Supplementary Materials
Author Contributions
Funding
Data Availability Statement
Conflicts of Interest
References
- Sun, H.; Li, H.; You, X.; Yang, Z.; Deng, J.; Qiu, L.; Peng, H. Quasi-solid-state, coaxial, fiber-shaped dye-sensitized solar cells. J. Mater. Chem. A 2014, 2, 345–349. [Google Scholar] [CrossRef]
- Song, W.; Wang, H.; Liu, G.; Peng, M.; Zou, D. Improving the photovoltaic performance and flexibility of fiber-shaped dye-sensitized solar cells with atomic layer deposition. Nano Energy 2016, 19, 1–7. [Google Scholar] [CrossRef]
- Fu, X.; Sun, H.; Xie, S.; Zhang, J.; Pan, Z.; Liao, M.; Xu, L.; Li, Z.; Wang, B.; Sun, X.; et al. A fiber-shaped solar cell showing a record power conversion efficiency of 10%. J. Mater. Chem. A 2018, 6, 45–51. [Google Scholar] [CrossRef]
- Liu, G.; Wang, M.; Wang, H.; Ardhi, R.E.A.; Yu, H.; Zou, D.; Lee, J.K. Hierarchically structured photoanode with enhanced charge collection and light harvesting abilities for fiber-shaped dye-sensitized solar cells. Nano Energy 2018, 49, 95–102. [Google Scholar] [CrossRef]
- Zhang, J.; Wang, Z.; Li, X.; Yang, J.; Song, C.; Li, Y.; Cheng, J.; Guan, Q.; Wang, B. Flexible Platinum-Free Fiber-Shaped Dye Sensitized Solar Cell with 10.28% Efficiency. ACS Appl. Energy Mater. 2019, 2, 2870–2877. [Google Scholar] [CrossRef]
- Utomo, D.S.; Kim, J.H.; Lee, D.; Park, J.; Kang, Y.-C.; Kim, Y.H.; Choi, J.W.; Song, M. Fractional structured molybdenum oxide catalyst as counter electrodes of all-solid-state fiber dye-sensitized solar cells. J. Colloid Interface Sci. 2021, 584, 520–527. [Google Scholar] [CrossRef] [PubMed]
- Kim, J.H.; Utomo, D.S.; Lee, D.; Choi, J.W.; Song, M. Catalytic fower-shaped α-MoO3 lamellar structure for solid-state fiber-dye-sensitized solar cells. J. Power Sources 2021, 512, 230496. [Google Scholar] [CrossRef]
- Joshi, P.; Zhang, L.; Davoux, D.; Zhu, Z.; Galipeau, D.; Fong, H.; Qiao, Q. Composite of TiO2 nanofibers and nanoparticles for dye-sensitized solar cells with significantly improved efficiency. Energy Environ. Sci. 2010, 3, 1507–1510. [Google Scholar] [CrossRef]
- Elbohy, H.; Kim, M.R.; Dubey, A.; Reza, K.M.; Ma, D.; Zai, J.; Qian, X.; Qiao, Q. Incorporation of plasmonic Au nanostars into photoanodes for high efficiency dye-sensitized solar cells. J. Mater. Chem. A 2016, 4, 545–551. [Google Scholar] [CrossRef]
- Sharma, K.; Sharma, V.; Sharma, S.S. Dye-Sensitized Solar Cells: Fundamentals and Current Status. Nanoscale Res. Lett. 2018, 13, 381. [Google Scholar] [CrossRef]
- Gao, F.; Wang, W.; Shi, D.; Zhang, J.; Wang, M.; Jing, X.; Humphry-Baker, R.; Wang, P.; Zakeeruddin, S.M.; Grätzel, M. Enhance the Optical Absorptivity of Nanocrystalline TiO2 Film with High Molar Extinction Coefficient Ruthenium Sensitizers for High Performance Dye-Sensitized Solar Cells. J. Am. Chem. Soc. 2008, 130, 10720–10728. [Google Scholar] [CrossRef] [PubMed]
- Atwater, H.A.; Polman, A. Plasmonics for improved photovoltaic devices. Nat. Mater. 2010, 9, 205–213. [Google Scholar] [CrossRef]
- Barnes, W.L.; Dereux, A.; Ebbesen, T.W. Surface plasmon subwavelength optics. Nature 2003, 424, 824–830. [Google Scholar] [CrossRef]
- Schuller, J.A.; Barnard, E.S.; Cai, W.; Jun, Y.C.; White, J.S.; Brongersma, M.L. Plasmonics for extreme light concentration and manipulation. Nat. Mater. 2010, 9, 193–204. [Google Scholar] [CrossRef] [PubMed]
- Green, M.A.; Pillai, S. Harnessing plasmonics for solar cells. Nat. Photonics. 2012, 6, 130–132. [Google Scholar] [CrossRef]
- Butler, J.C.; Angelini, T.; Tang, J.X.; Wong, G.C.L. Ion Multivalence and Like-Charge Polyelectrolyte Attraction. Phys. Rev. Lett. 2003, 91, 028301. [Google Scholar] [CrossRef]
- Petrenko, V.A.; Smith, G.P. Phages from landscape libraries as substitute antibodies. Protein Eng. 2000, 13, 589–592. [Google Scholar] [CrossRef] [Green Version]
- Petrenko, V.A.; Vodyanoy, V.J. Phage display for detection of biological threat agents. J. Microbiol. Methods. 2003, 53, 253–262. [Google Scholar] [CrossRef]
- Royston, E.; Lee, S.-Y.; Culver, J.N.; Harris, M.T. Characterization of silica-coated tobacco mosaic virus. J. Colloid Interface Sci. 2006, 298, 706–712. [Google Scholar] [CrossRef]
- Bruckman, M.A.; Kaur, G.; Lee, L.A.; Xie, F.; Sepulveda, J.; Breitenkamp, R.; Zhang, X.; Joralemon, M.; Russell, T.P.; Emrick, T.; et al. Surface Modificaion of Tobacco Mosaic Virus with “Click” Chemistry. ChemBioChem. 2008, 9, 519–523. [Google Scholar] [CrossRef]
- Scibilia, S.; Lentini, G.; Fazio, E.; Franco, D.; Neri, F.; Mezzasalma, A.M.; Guglielmino, S.P.P. Self-assembly of silver nanoparticles and bacteriophage. Sens. Bio-Sens. Res. 2016, 7, 146–152. [Google Scholar] [CrossRef] [Green Version]
- Lentini, G.; Fazio, E.; Calabrese, F.; De Plano, L.M.; Puliafico, M.; Franco, D.; Nicolò, M.S.; Carnazza, S.; Trusso, S.; Allegra, A.; et al. Phage-AgNPs complex as SERS probe for U937 cell identification. Biosens. Bioelectron. 2015, 74, 398–405. [Google Scholar] [CrossRef] [PubMed]
- Brown, M.D.; Parkinson, P.; Torres, T.; Miura, H.; Herz, L.M.; Snaith, H.J. Surface Energy Relay Between Consensitized Molecules in Solid-State Dye-Sensitized Solar Cells. J. Phys. Chem. C 2011, 115, 23204–23208. [Google Scholar] [CrossRef]
- Choi, H.; Chen, W.T.; Kamat, P.V. Know Thy Nano Neighbor. Plasmonic versus Electron Charging Effects of Metal Nanoparticles in Dye-Sensitized Solar Cells. ACS Nano 2012, 6, 4418–4427. [Google Scholar] [CrossRef]
- Isah, K.U.; Jolayemi, B.J.; Ahmadu, U.; Kimpa, M.I.; Alu, N. Plasmonic effect of silver nanoparticles intercalated into mesoporous betalain-sensitized-TiO2 film electrodes on photovoltaic performance of dye-sensitized solar cells. Mater. Renew. Sustain. Energy. 2016, 5, 10. [Google Scholar] [CrossRef] [Green Version]
- Franco, D.; De Plano, L.M.; Rizzo, M.G.; Scibilia, S.; Lentini, G.; Fazio, E.; Neri, F.; Guglielmino, S.P.P.; Mezzasalma, A.M. Bio-hybrid gold nanoparticles as SERS probe for rapid bacteria cell identification. Spectroc. Acta Pt. A-Molec. Biomolec. Spectr. 2020, 224, 117394. [Google Scholar] [CrossRef] [PubMed]
- Kim, H.; Jo, J.; Lee, G.; Shin, M.; Lee, J.-C. Optical Modeling of Dye-Sensitized Solar Cells for Color Analysis. J. Nanosic. Nanotechnol. 2017, 17, 8425–8431. [Google Scholar] [CrossRef]
- Kim, J.H.; Koo, S.-J.; Cho, H.; Choi, J.W.; Ryu, S.Y.; Kang, J.-W.; Jin, S.-H.; Ahn, C.; Song, M. 6.16% Efficiency of Solid-State Fiber Dye-Sensitized Solar Cells Based on LiTFSI Electrolytes with Novel TEMPOL Derivatives. ACS Sustain. Chem. Eng. 2020, 8, 15065–15071. [Google Scholar] [CrossRef]
- Kim, J.H.; Hong, S.K.; Yoo, S.-J.; Woo, C.Y.; Choi, J.W.; Lee, D.; Kang, J.-W.; Lee, H.W.; Song, M. Pt-free, cost-effective and efficient counter electrode with carbon nanotube yarn for solid-state fiber dye-sensitized solar cells. Dyes Pigment. 2021, 185, 108855. [Google Scholar] [CrossRef]
- Lee, H.B.; Kim, W.-G.; Lee, M.; Lee, J.-M.; He, S.; Kumar, N.; Devaraj, V.; Choi, E.J.; Jeon, I.; Song, M.; et al. Gap Plasmon of Virus-Templated Biohybrid Nanostructures Uplifting the Performance of Organic Optoelectronic Devices. Adv. Optical Mater. 2020, 8, 1902080. [Google Scholar] [CrossRef]
- Zhang, Y.; Zhen, Y.-R.; Neumann, O.; Day, J.K.; Nordlander, P.; Halas, N.J. Coherent anti-Stokes Raman scattering with single-molecule sensitivity using a plasmonic Fano resonance. Nat. Commun. 2014, 5, 4424. [Google Scholar] [CrossRef]
- Yi, C.; Dongare, P.D.; Su, M.-N.; Wang, W.; Chakraborty, D.; Wen, F.; Chang, W.-S.; Sader, J.E.; Nordlander, P.; Halas, N.J.; et al. Vibrational coupling in plasmonic molecules. Proc. Natl. Acad. Sci. USA 2017, 114, 11621–11626. [Google Scholar] [CrossRef] [Green Version]
- Li, G.; Chang, W.-H.; Yang, Y. Low-bandgap conjugated polymers enabling solution-processable tandem solar cells. Nat. Rev. Mater. 2017, 2, 17043. [Google Scholar] [CrossRef]
- Jang, Y.H.; Jang, Y.J.; Kochuveedu, S.T.; Byun, M.; Lin, Z.; Kim, D.H. Plasmonic dye-sensitized solar cells incorporated with Au-TiO2 nanostructures with tailored configurations. Nanoscale 2014, 6, 1823–1832. [Google Scholar] [CrossRef]
- Topič, M.; Čampa, A.; Filipič, M.; Berginc, M.; Krašovec, U.O.; Smole, F. Optical and electrical modelling and characterization of dye-sensitized solar cells. Curr. Appl. Phys. 2010, 10, S425–S430. [Google Scholar]
- Liao, P.; Zhao, X.; Li, G.; Shen, Y.; Wang, M. A New Method for Fitting Current-Voltage Curves of Planar Heterojunction Perovskite Solar Cells. Nano-Micro Lett. 2018, 10, 5. [Google Scholar] [CrossRef] [PubMed] [Green Version]
- Peng, H.; Sun, X.; Weng, W.; Fang, X. Energy Harvesting Based on Polymer. In Polymer Materials for Energy and Electronic Applications, 1st ed.; Academic Press: Cambridge, MA, USA, 2017; pp. 151–196. [Google Scholar]
- Kim, J.H.; Yoo, S.-J.; Lee, D.; Choi, J.W.; Han, S.-C.; Ryu, T.I.; Lee, H.W.; Shin, M.; Song, M. Highly efficient and stable solid-state fiber dye-sensitized solar cells with Ag-decorated SiO2 nanoparticles. Nano Res. 2021, 14, 2728–2734. [Google Scholar] [CrossRef]
- Shukla, S.; Loc, N.H.; Boix, P.P.; Koh, T.M.; Prabhakar, R.R.; Mulmudi, H.K.; Zhang, J.; Chen, S.; Ng, C.F.; Huan, C.H.A.; et al. Iron Pyrite Thin Film Counter Electrodes for Dye-Sensitized Solar Cells: High Efficiency for Iodine and Cobalt Redox Electrolyte Cells. ACS Nano 2014, 8, 10597–10605. [Google Scholar] [CrossRef]


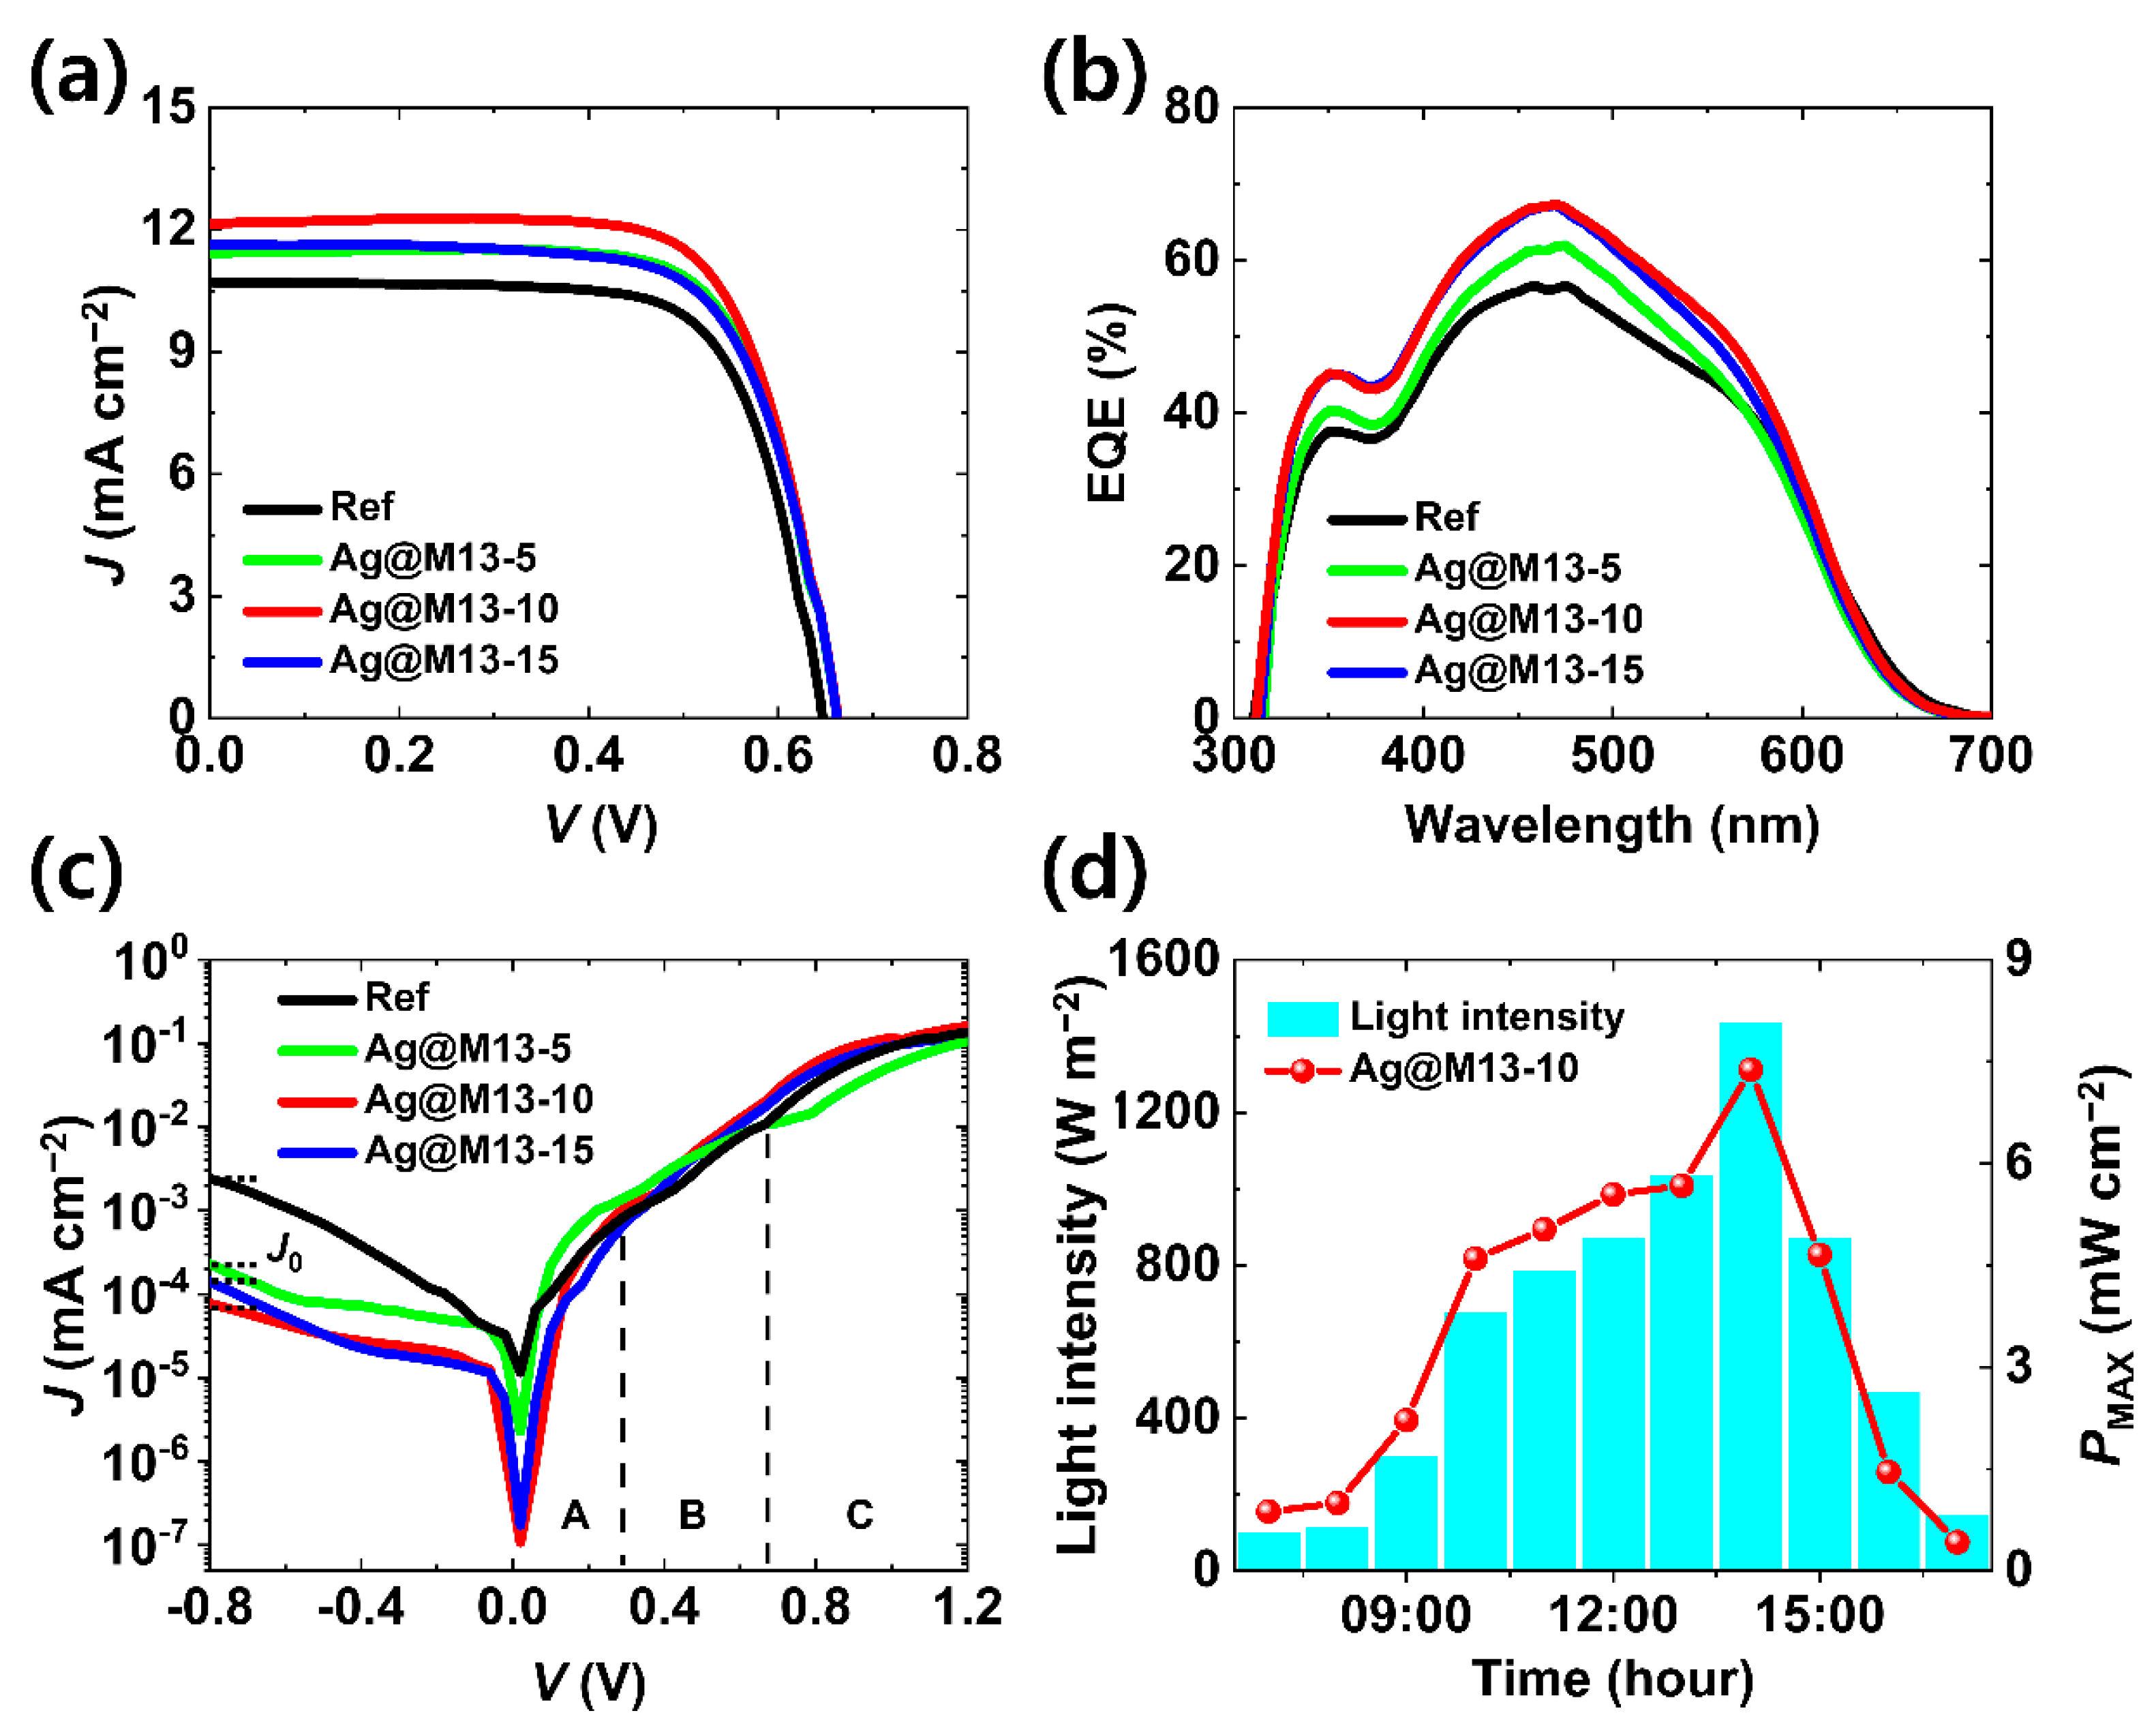
| VOC (V) | JSC (mA cm−2) | FF (%) | PCE (%) | Rs (Ω cm2) | Rsh (Ω cm2) | |
|---|---|---|---|---|---|---|
| Ref | 0.65 | 10.71 | 71.7 | 4.97 | 7.13 | 6.97 × 10⁴ |
| Ag@M13-5 | 0.66 | 11.44 | 71.8 | 5.47 | 5.36 | 8.90 × 10⁴ |
| Ag@M13-10 | 0.66 | 12.16 | 72.1 | 5.80 | 4.32 | 1.26 × 10⁵ |
| Ag@M13-15 | 0.66 | 11.61 | 69.9 | 5.39 | 5.29 | 9.43 × 10⁴ |
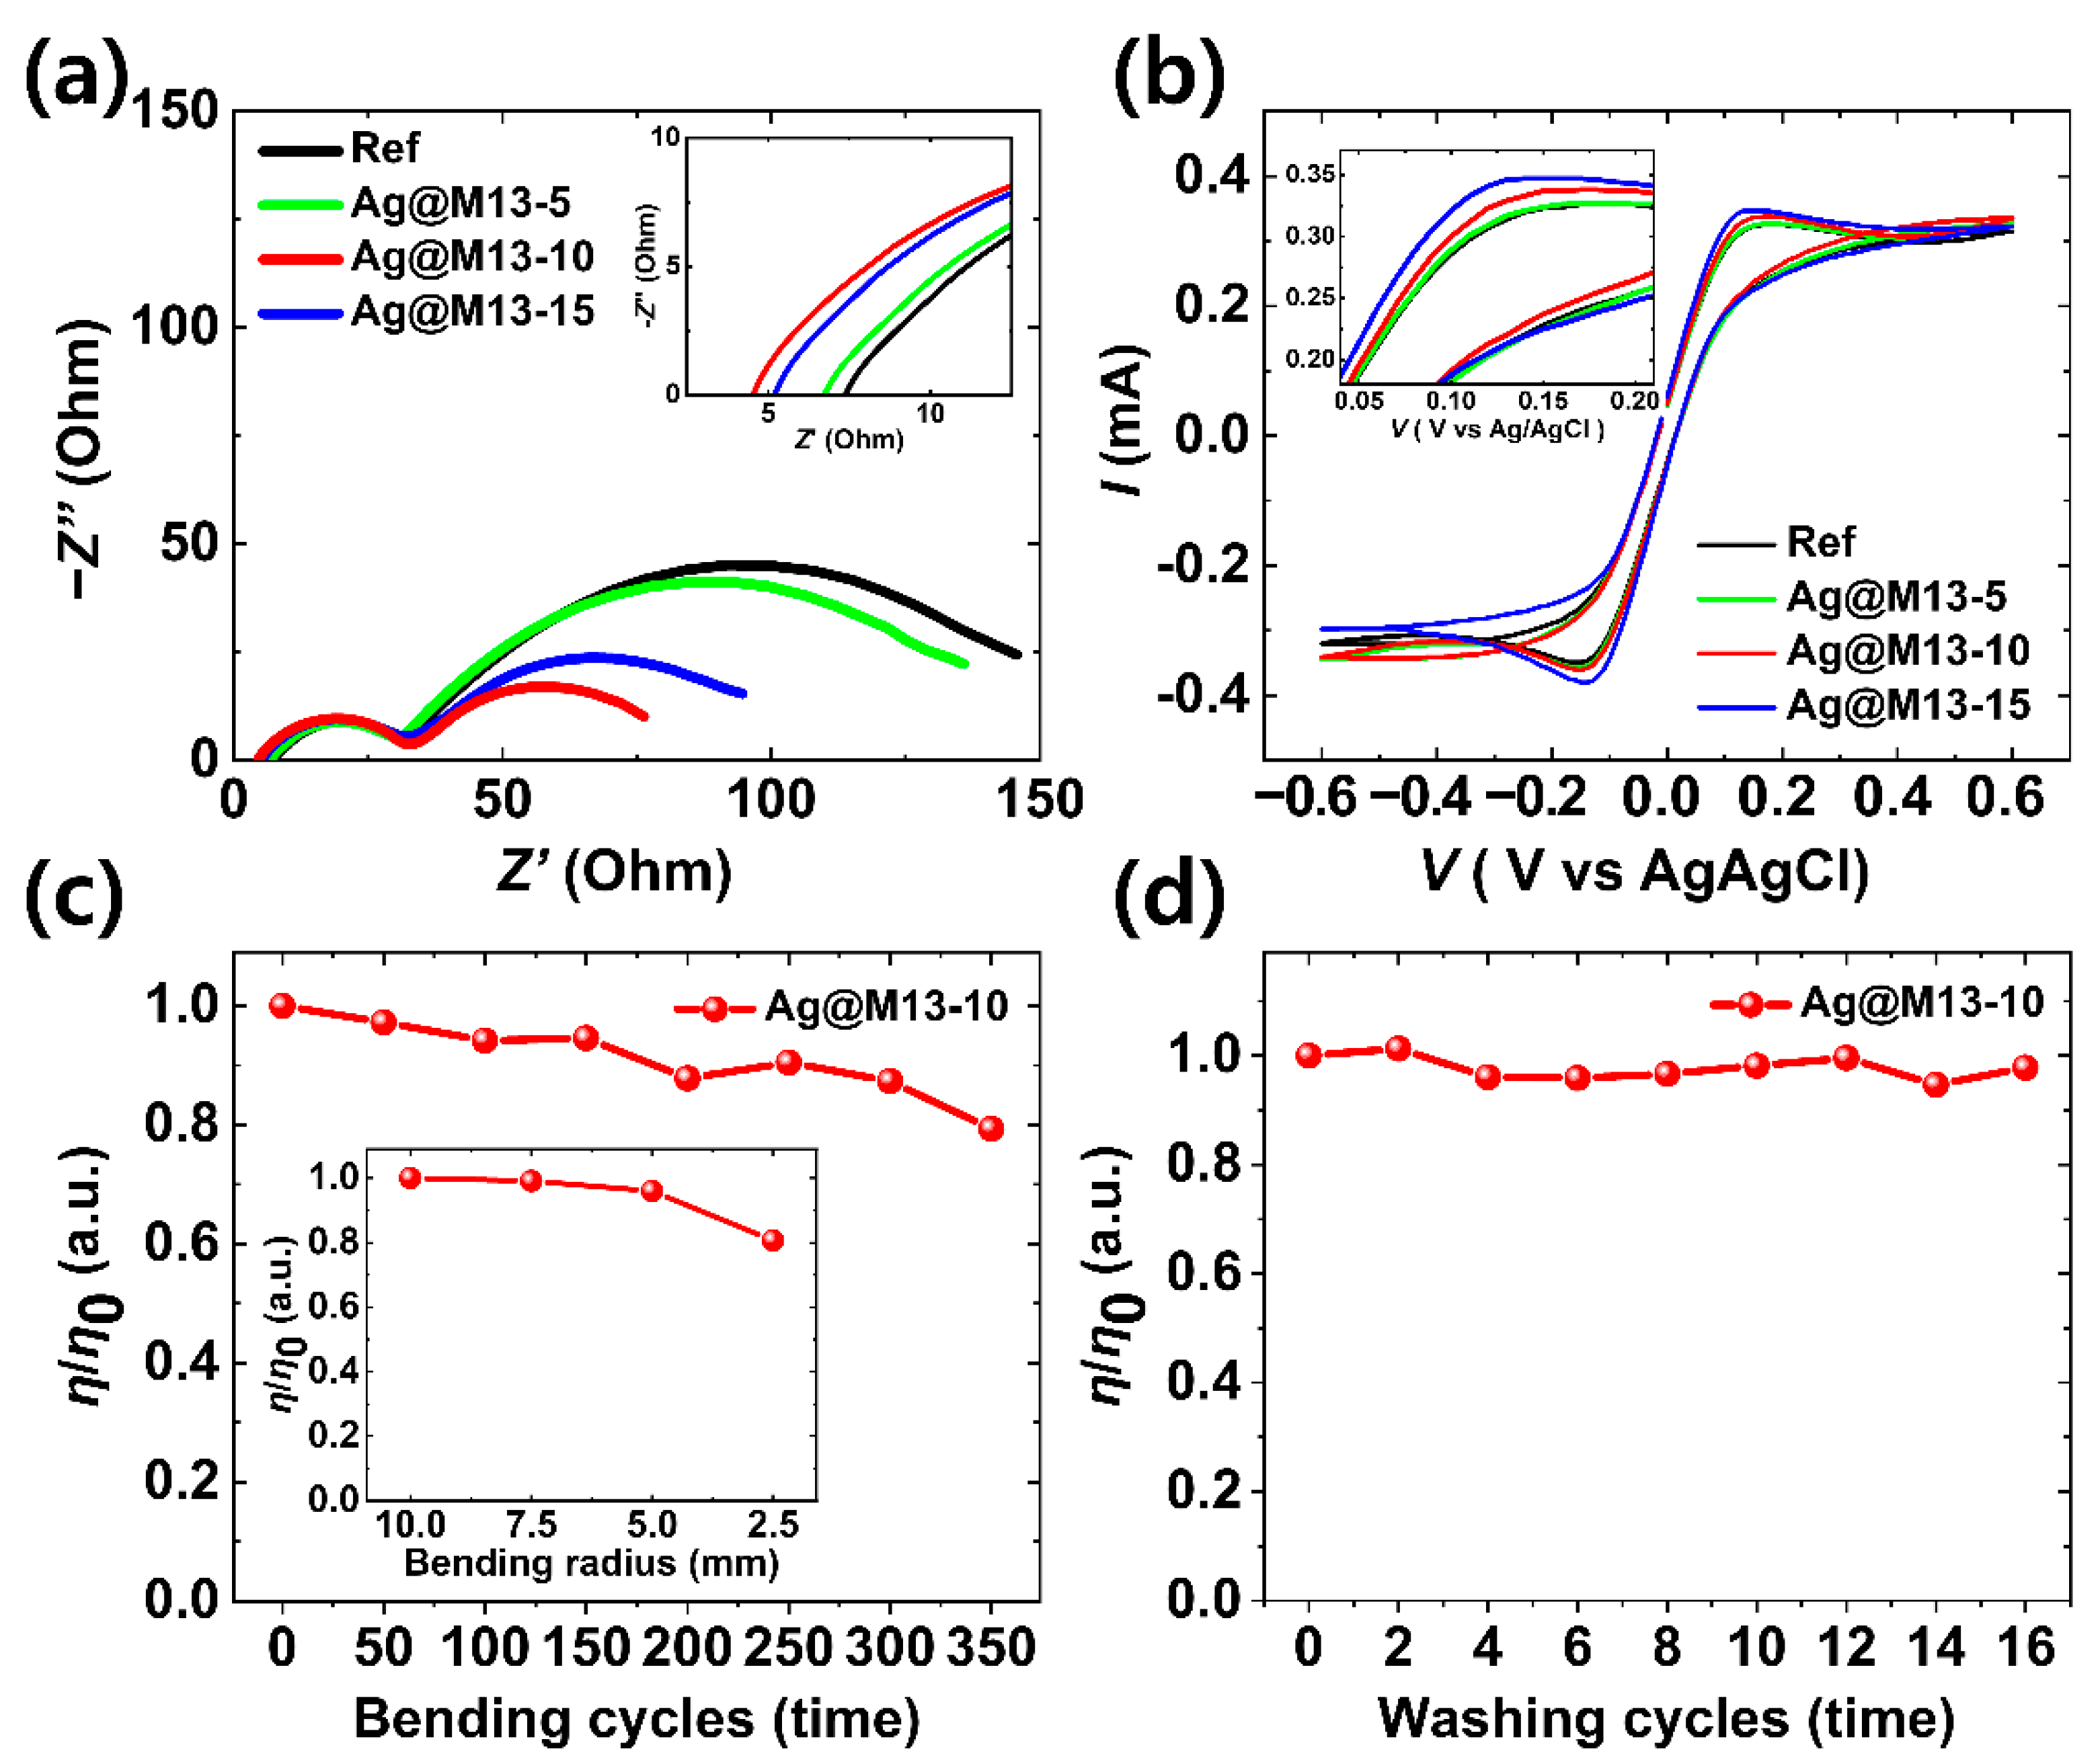
| Rs (Ω) | Rct1 (Ω) | CPEct1 (F) | Rct2 (Ω) | CPEct2 (F) | |
|---|---|---|---|---|---|
| Ref | 7.49 | 26.99 | 4.68 × 10⁻⁵ | 129.2 | 2.51 × 10⁻³ |
| Ag@M13-5 | 6.85 | 26.24 | 4.66 × 10⁻⁵ | 117.2 | 2.75 × 10⁻³ |
| Ag@M13-10 | 4.57 | 24.30 | 3.01 × 10⁻⁵ | 53.1 | 8.37 × 10⁻³ |
| Ag@M13-15 | 5.16 | 25.01 | 4.27 × 10⁻⁵ | 75.8 | 5.74 × 10⁻³ |
Publisher’s Note: MDPI stays neutral with regard to jurisdictional claims in published maps and institutional affiliations. |
© 2021 by the authors. Licensee MDPI, Basel, Switzerland. This article is an open access article distributed under the terms and conditions of the Creative Commons Attribution (CC BY) license (https://creativecommons.org/licenses/by/4.0/).
Share and Cite
Koo, S.-J.; Kim, J.H.; Kim, Y.-K.; Shin, M.; Choi, J.W.; Oh, J.-W.; Lee, H.W.; Song, M. Improved Light Harvesting of Fiber-Shaped Dye-Sensitized Solar Cells by Using a Bacteriophage Doping Method. Nanomaterials 2021, 11, 3421. https://doi.org/10.3390/nano11123421
Koo S-J, Kim JH, Kim Y-K, Shin M, Choi JW, Oh J-W, Lee HW, Song M. Improved Light Harvesting of Fiber-Shaped Dye-Sensitized Solar Cells by Using a Bacteriophage Doping Method. Nanomaterials. 2021; 11(12):3421. https://doi.org/10.3390/nano11123421
Chicago/Turabian StyleKoo, Sung-Jun, Jae Ho Kim, Yong-Ki Kim, Myunghun Shin, Jin Woo Choi, Jin-Woo Oh, Hyung Woo Lee, and Myungkwan Song. 2021. "Improved Light Harvesting of Fiber-Shaped Dye-Sensitized Solar Cells by Using a Bacteriophage Doping Method" Nanomaterials 11, no. 12: 3421. https://doi.org/10.3390/nano11123421
APA StyleKoo, S.-J., Kim, J. H., Kim, Y.-K., Shin, M., Choi, J. W., Oh, J.-W., Lee, H. W., & Song, M. (2021). Improved Light Harvesting of Fiber-Shaped Dye-Sensitized Solar Cells by Using a Bacteriophage Doping Method. Nanomaterials, 11(12), 3421. https://doi.org/10.3390/nano11123421