
Controllable Preparation of Cubic Zeolite A and Application of Langmuir Model in Carbon Dioxide Adsorption


Abstract
:1. Introduction
2. Materials and Methods
2.1. Materials
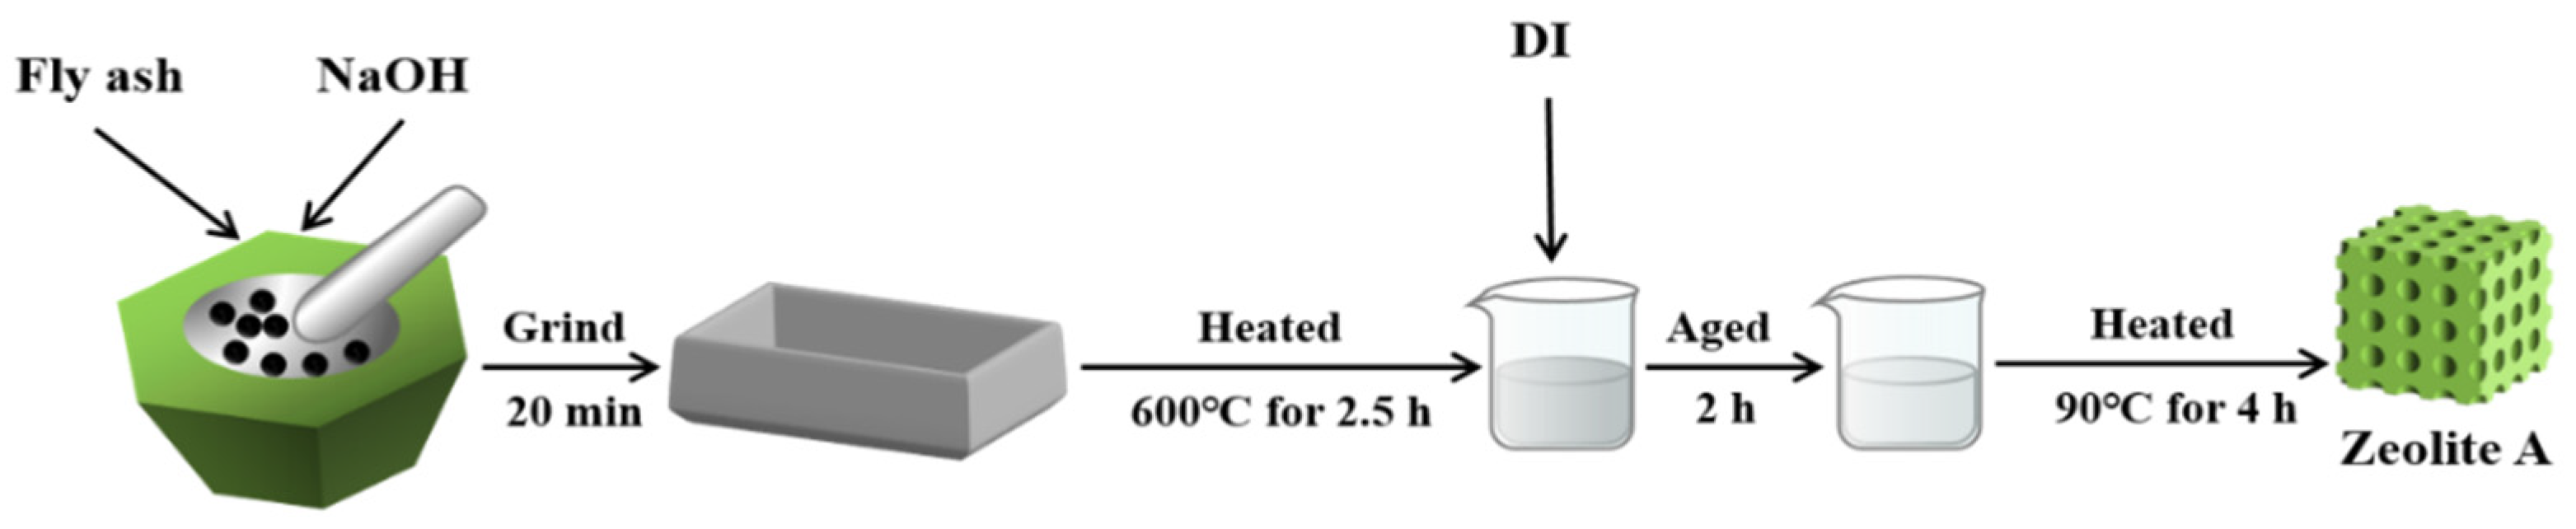
2.2. Synthesis of Zeolite A
2.3. Characterization
3. Results and Discussion
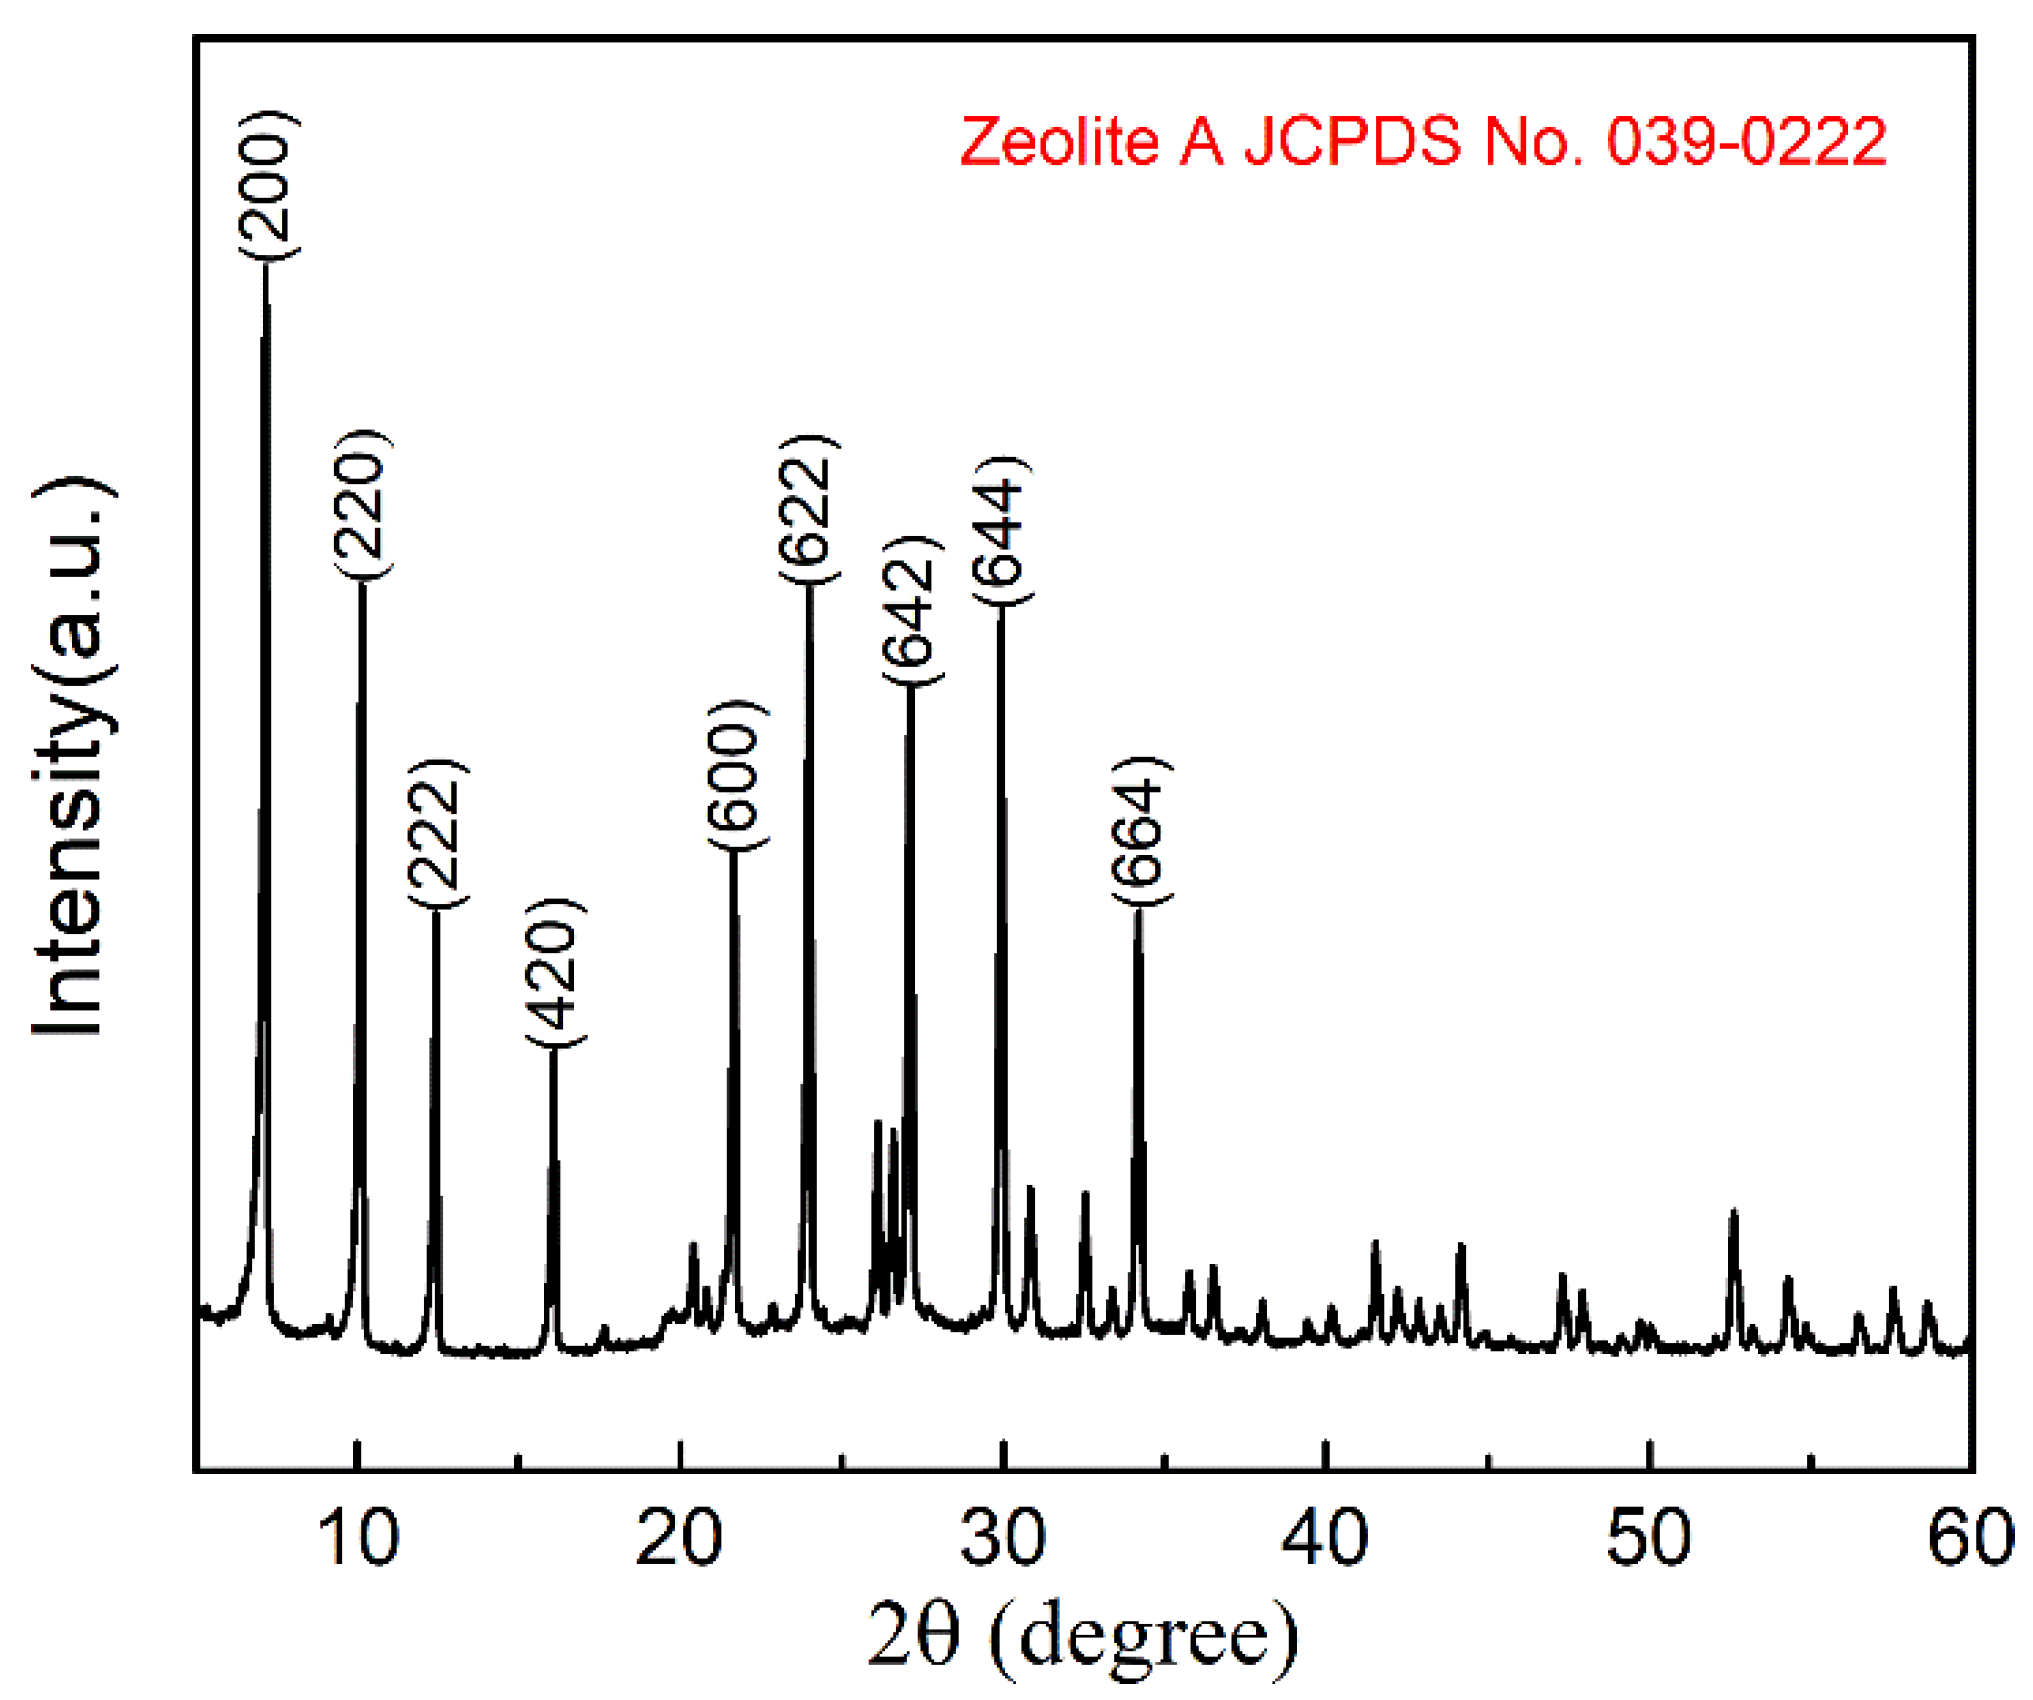
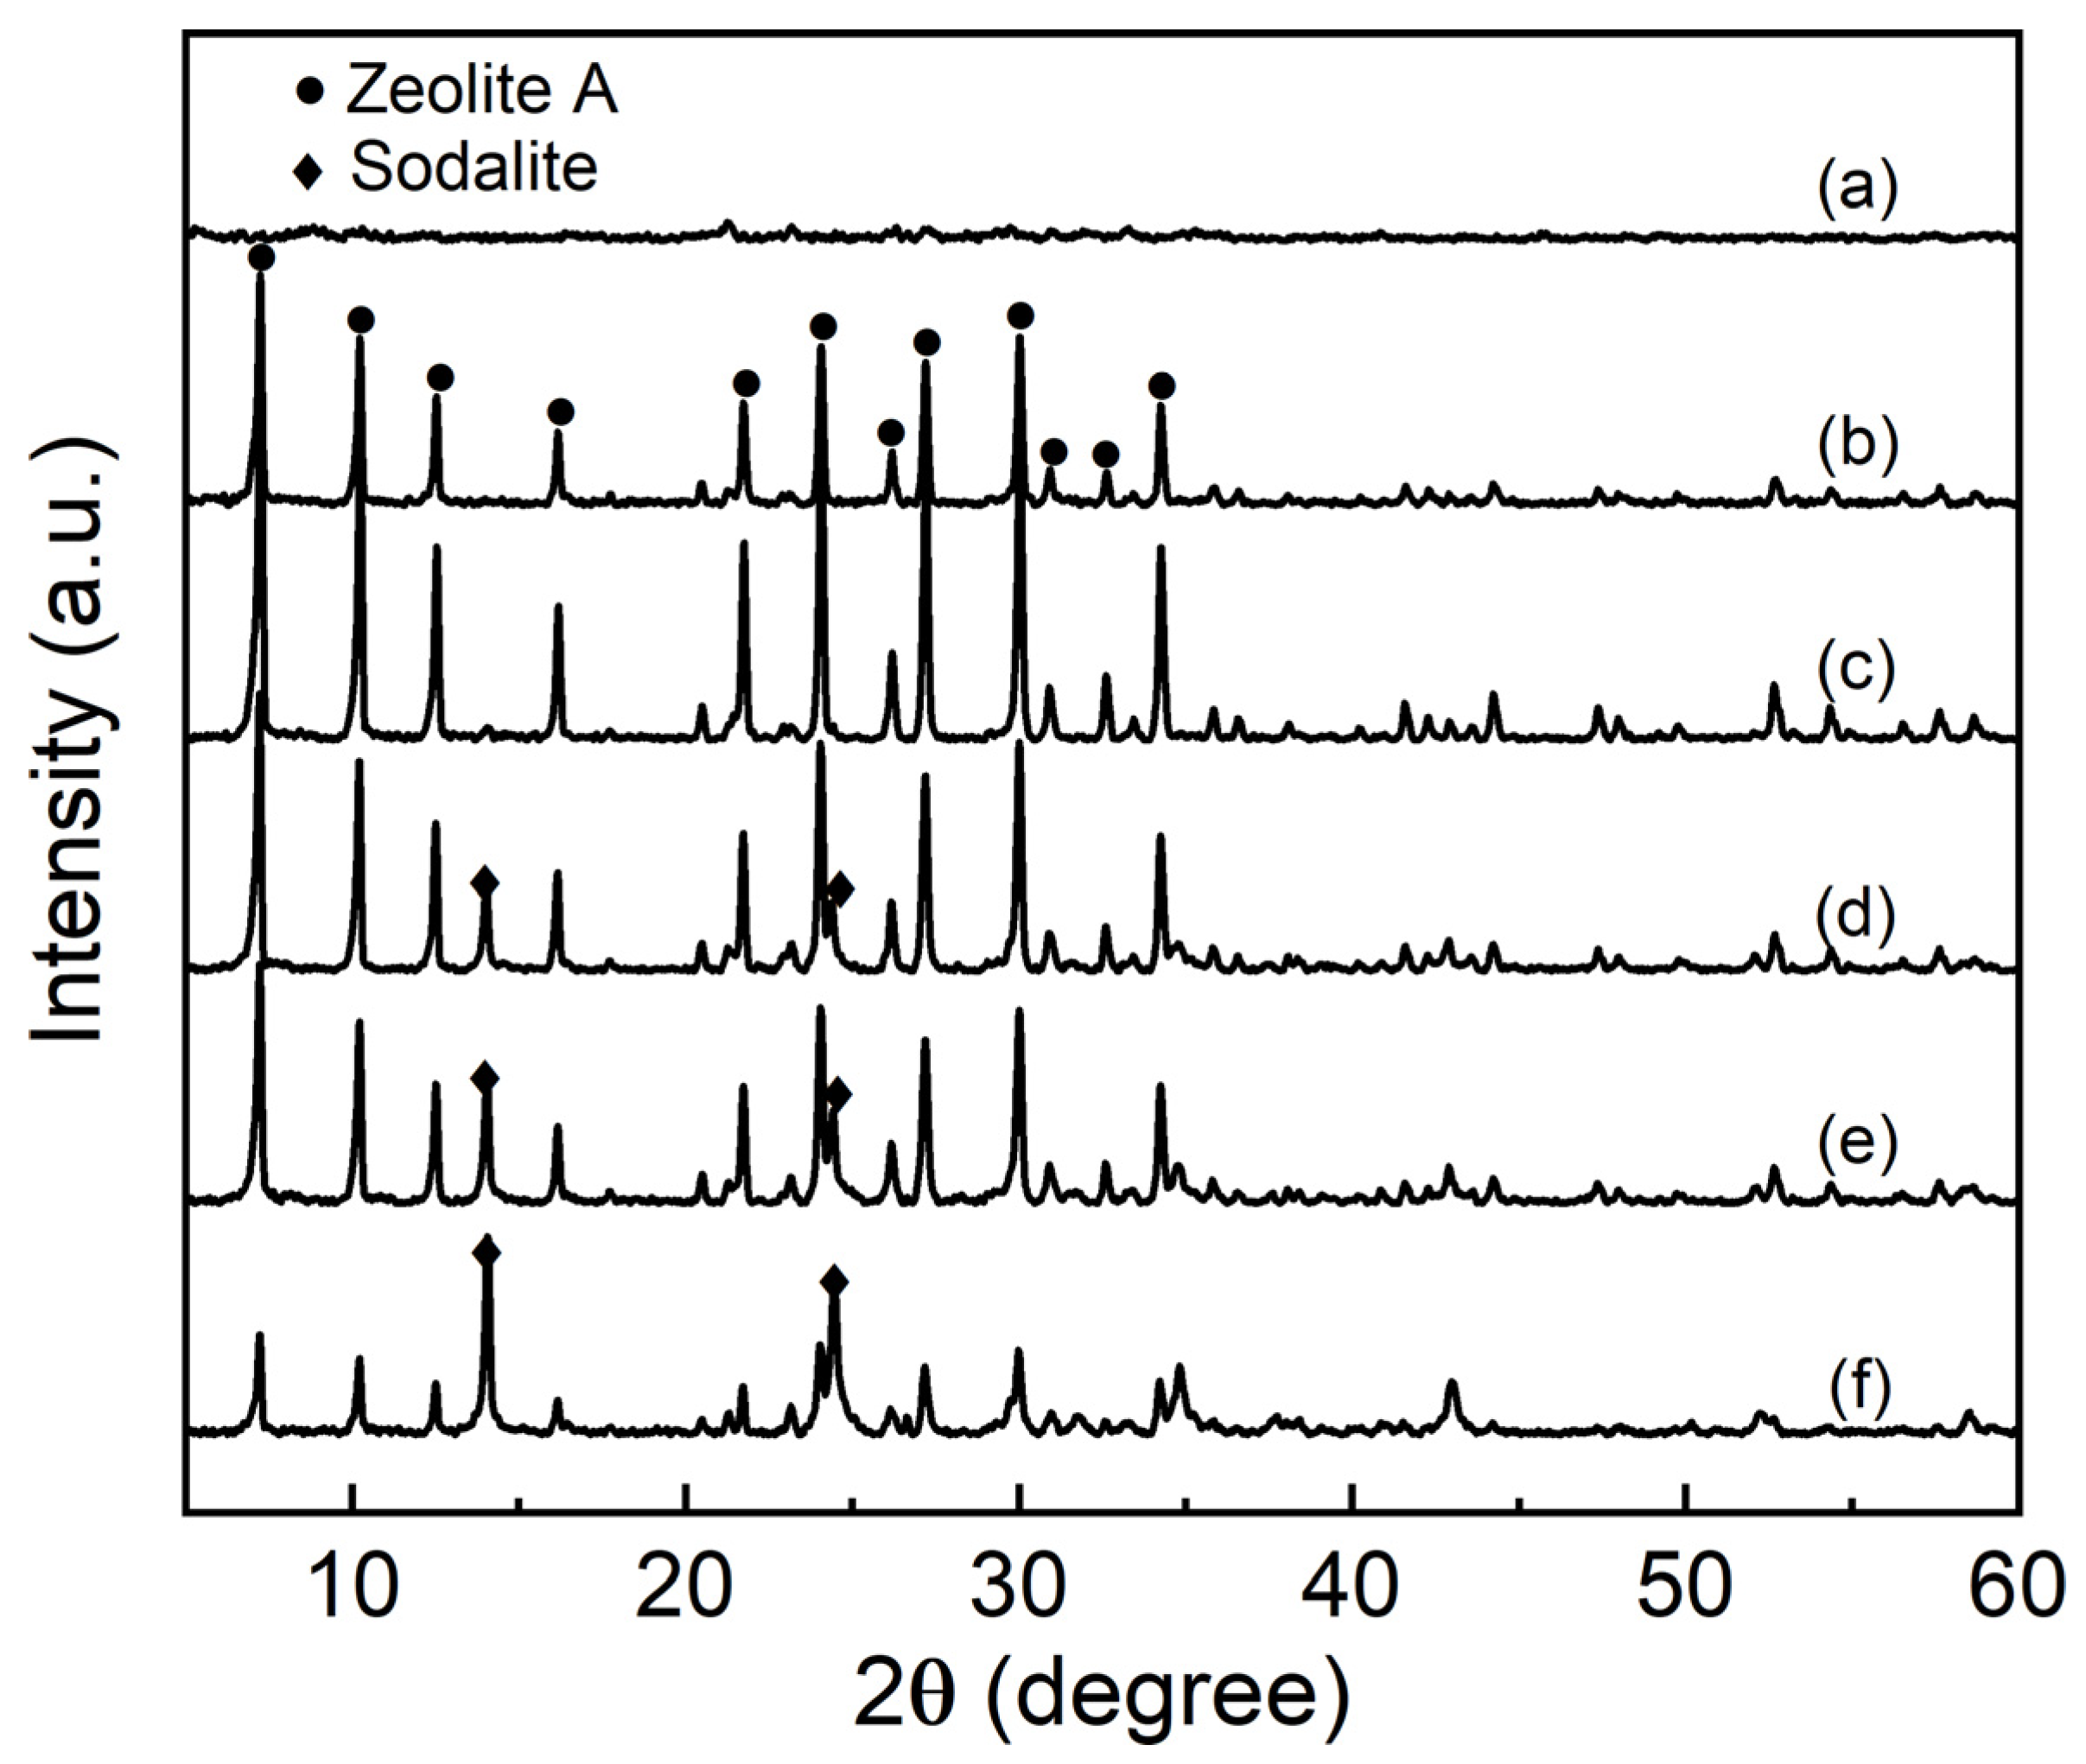
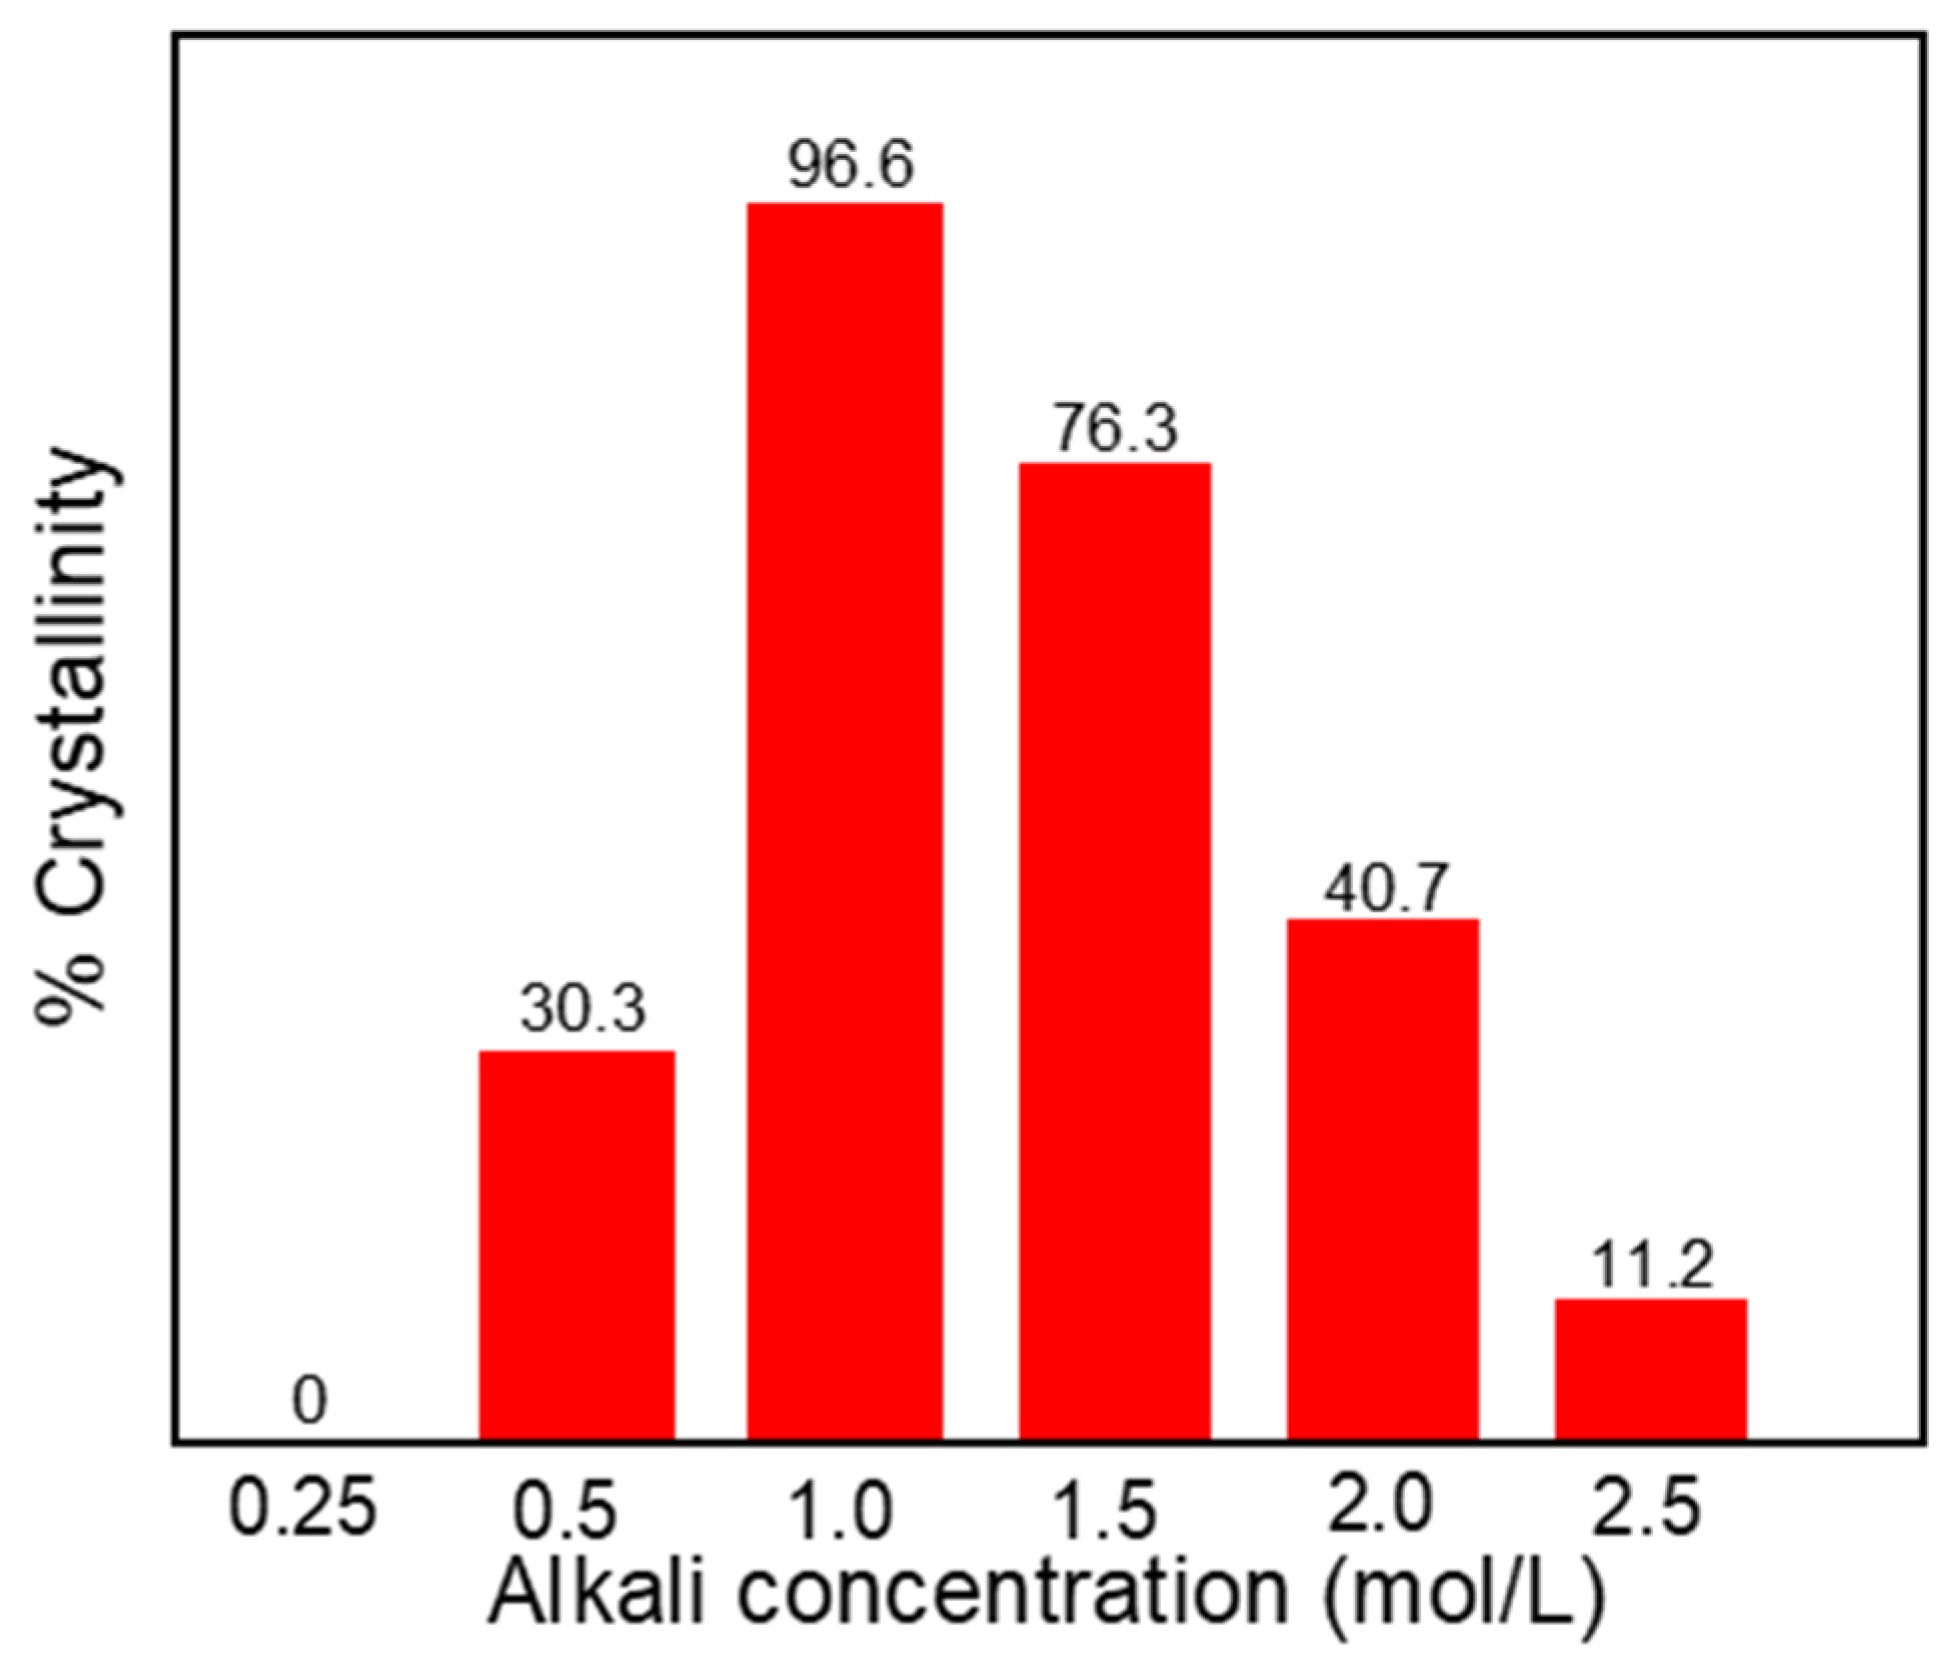
3.1. XRD Analysis
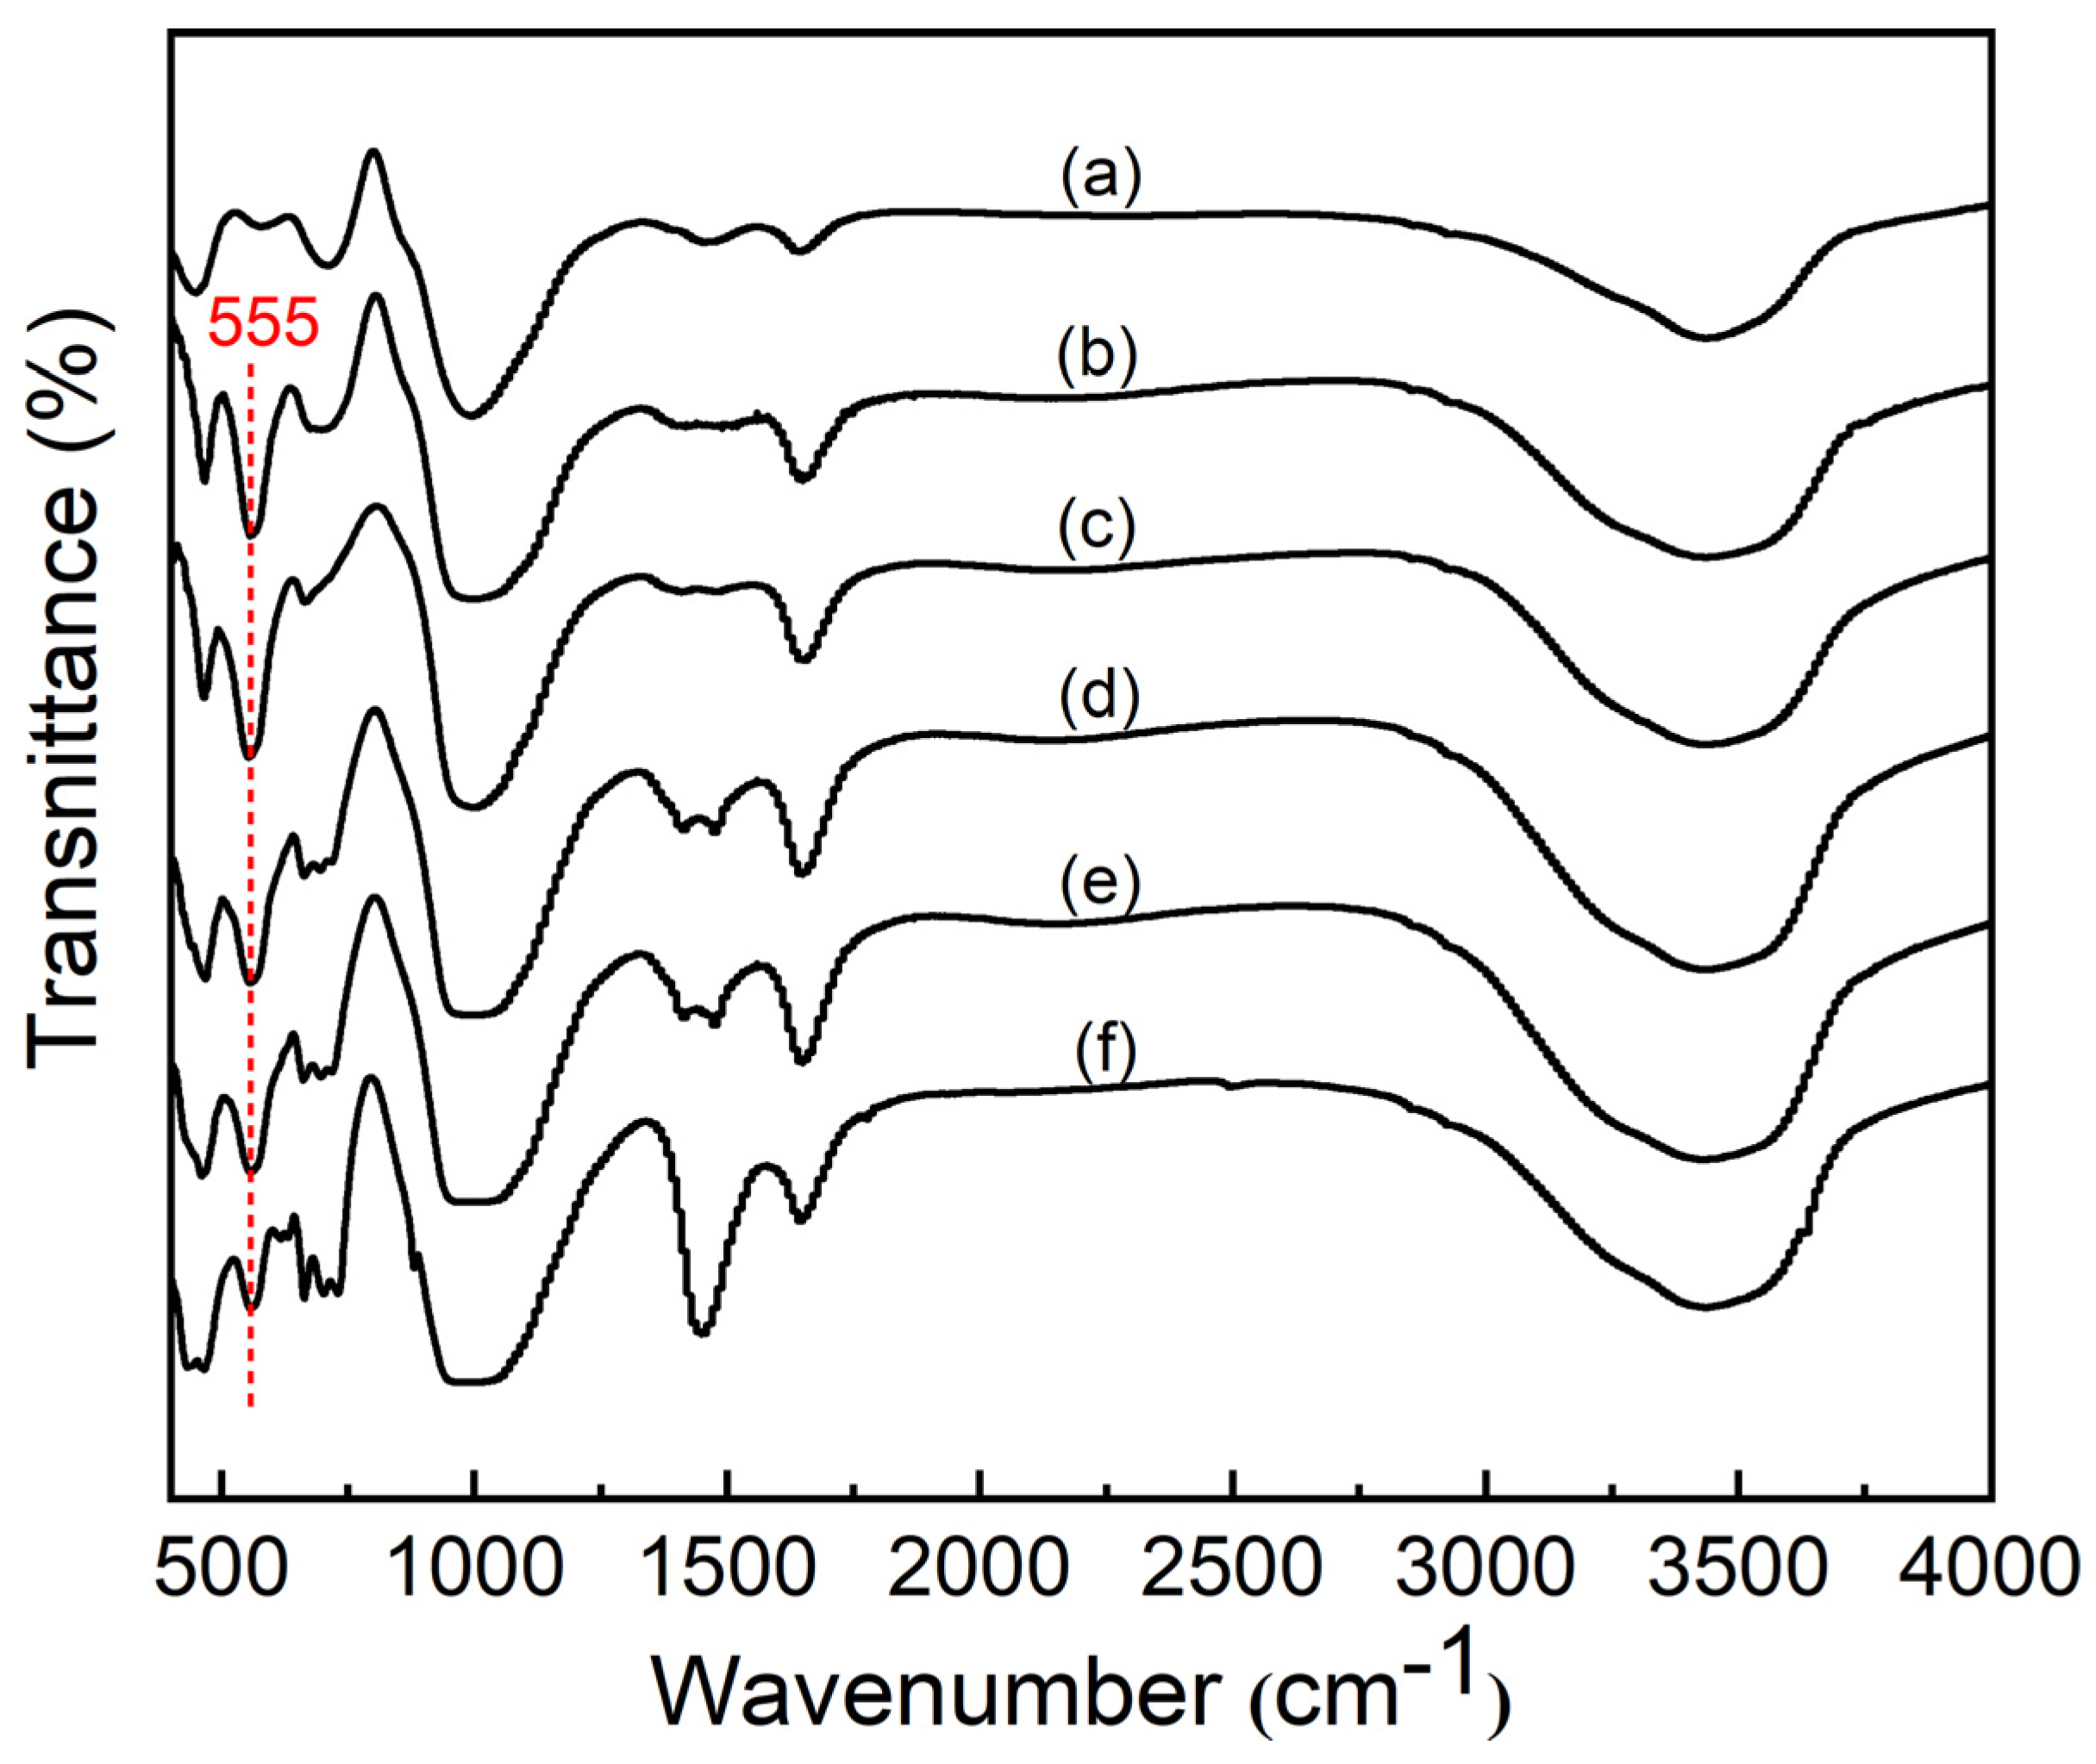
3.2. FTIR Analysis
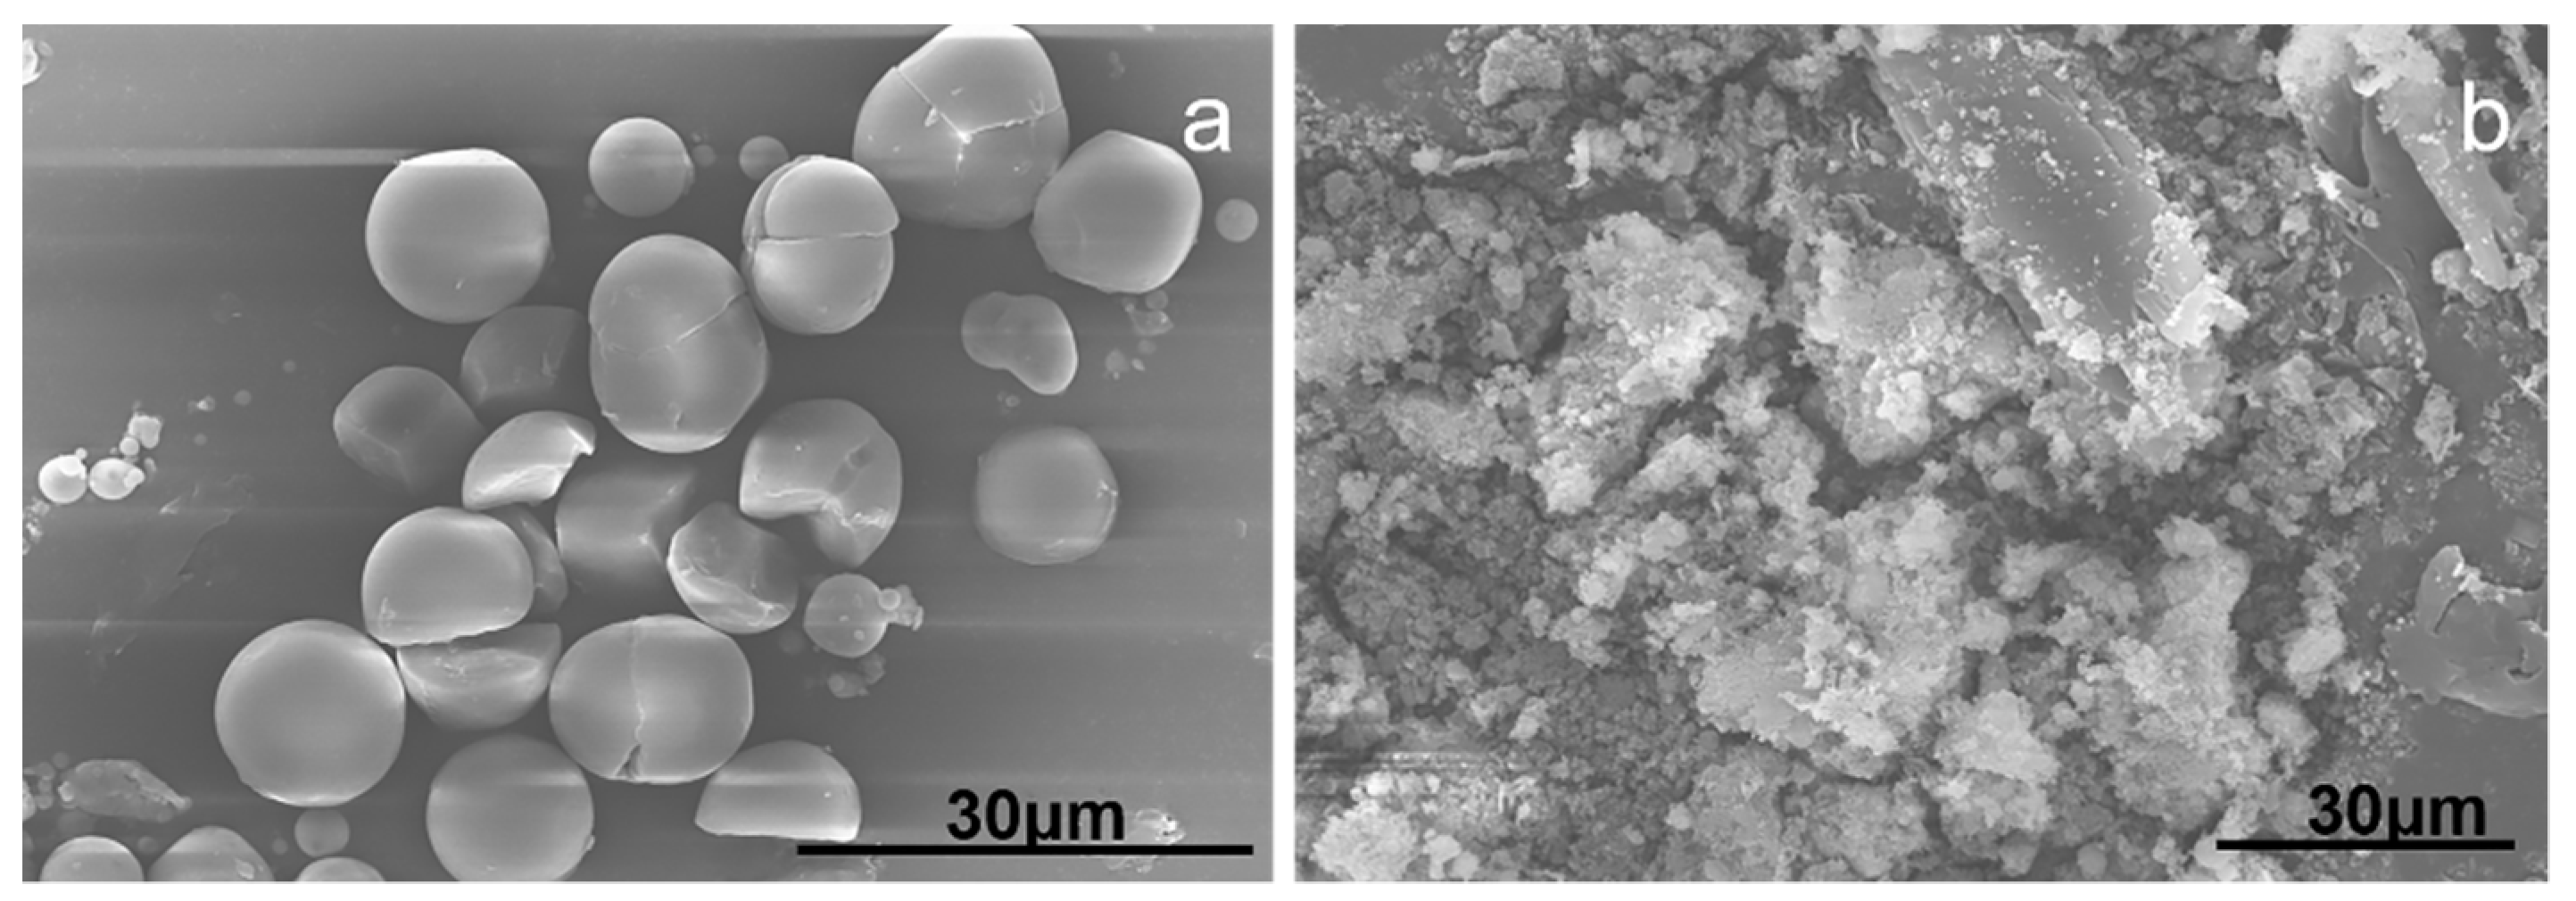
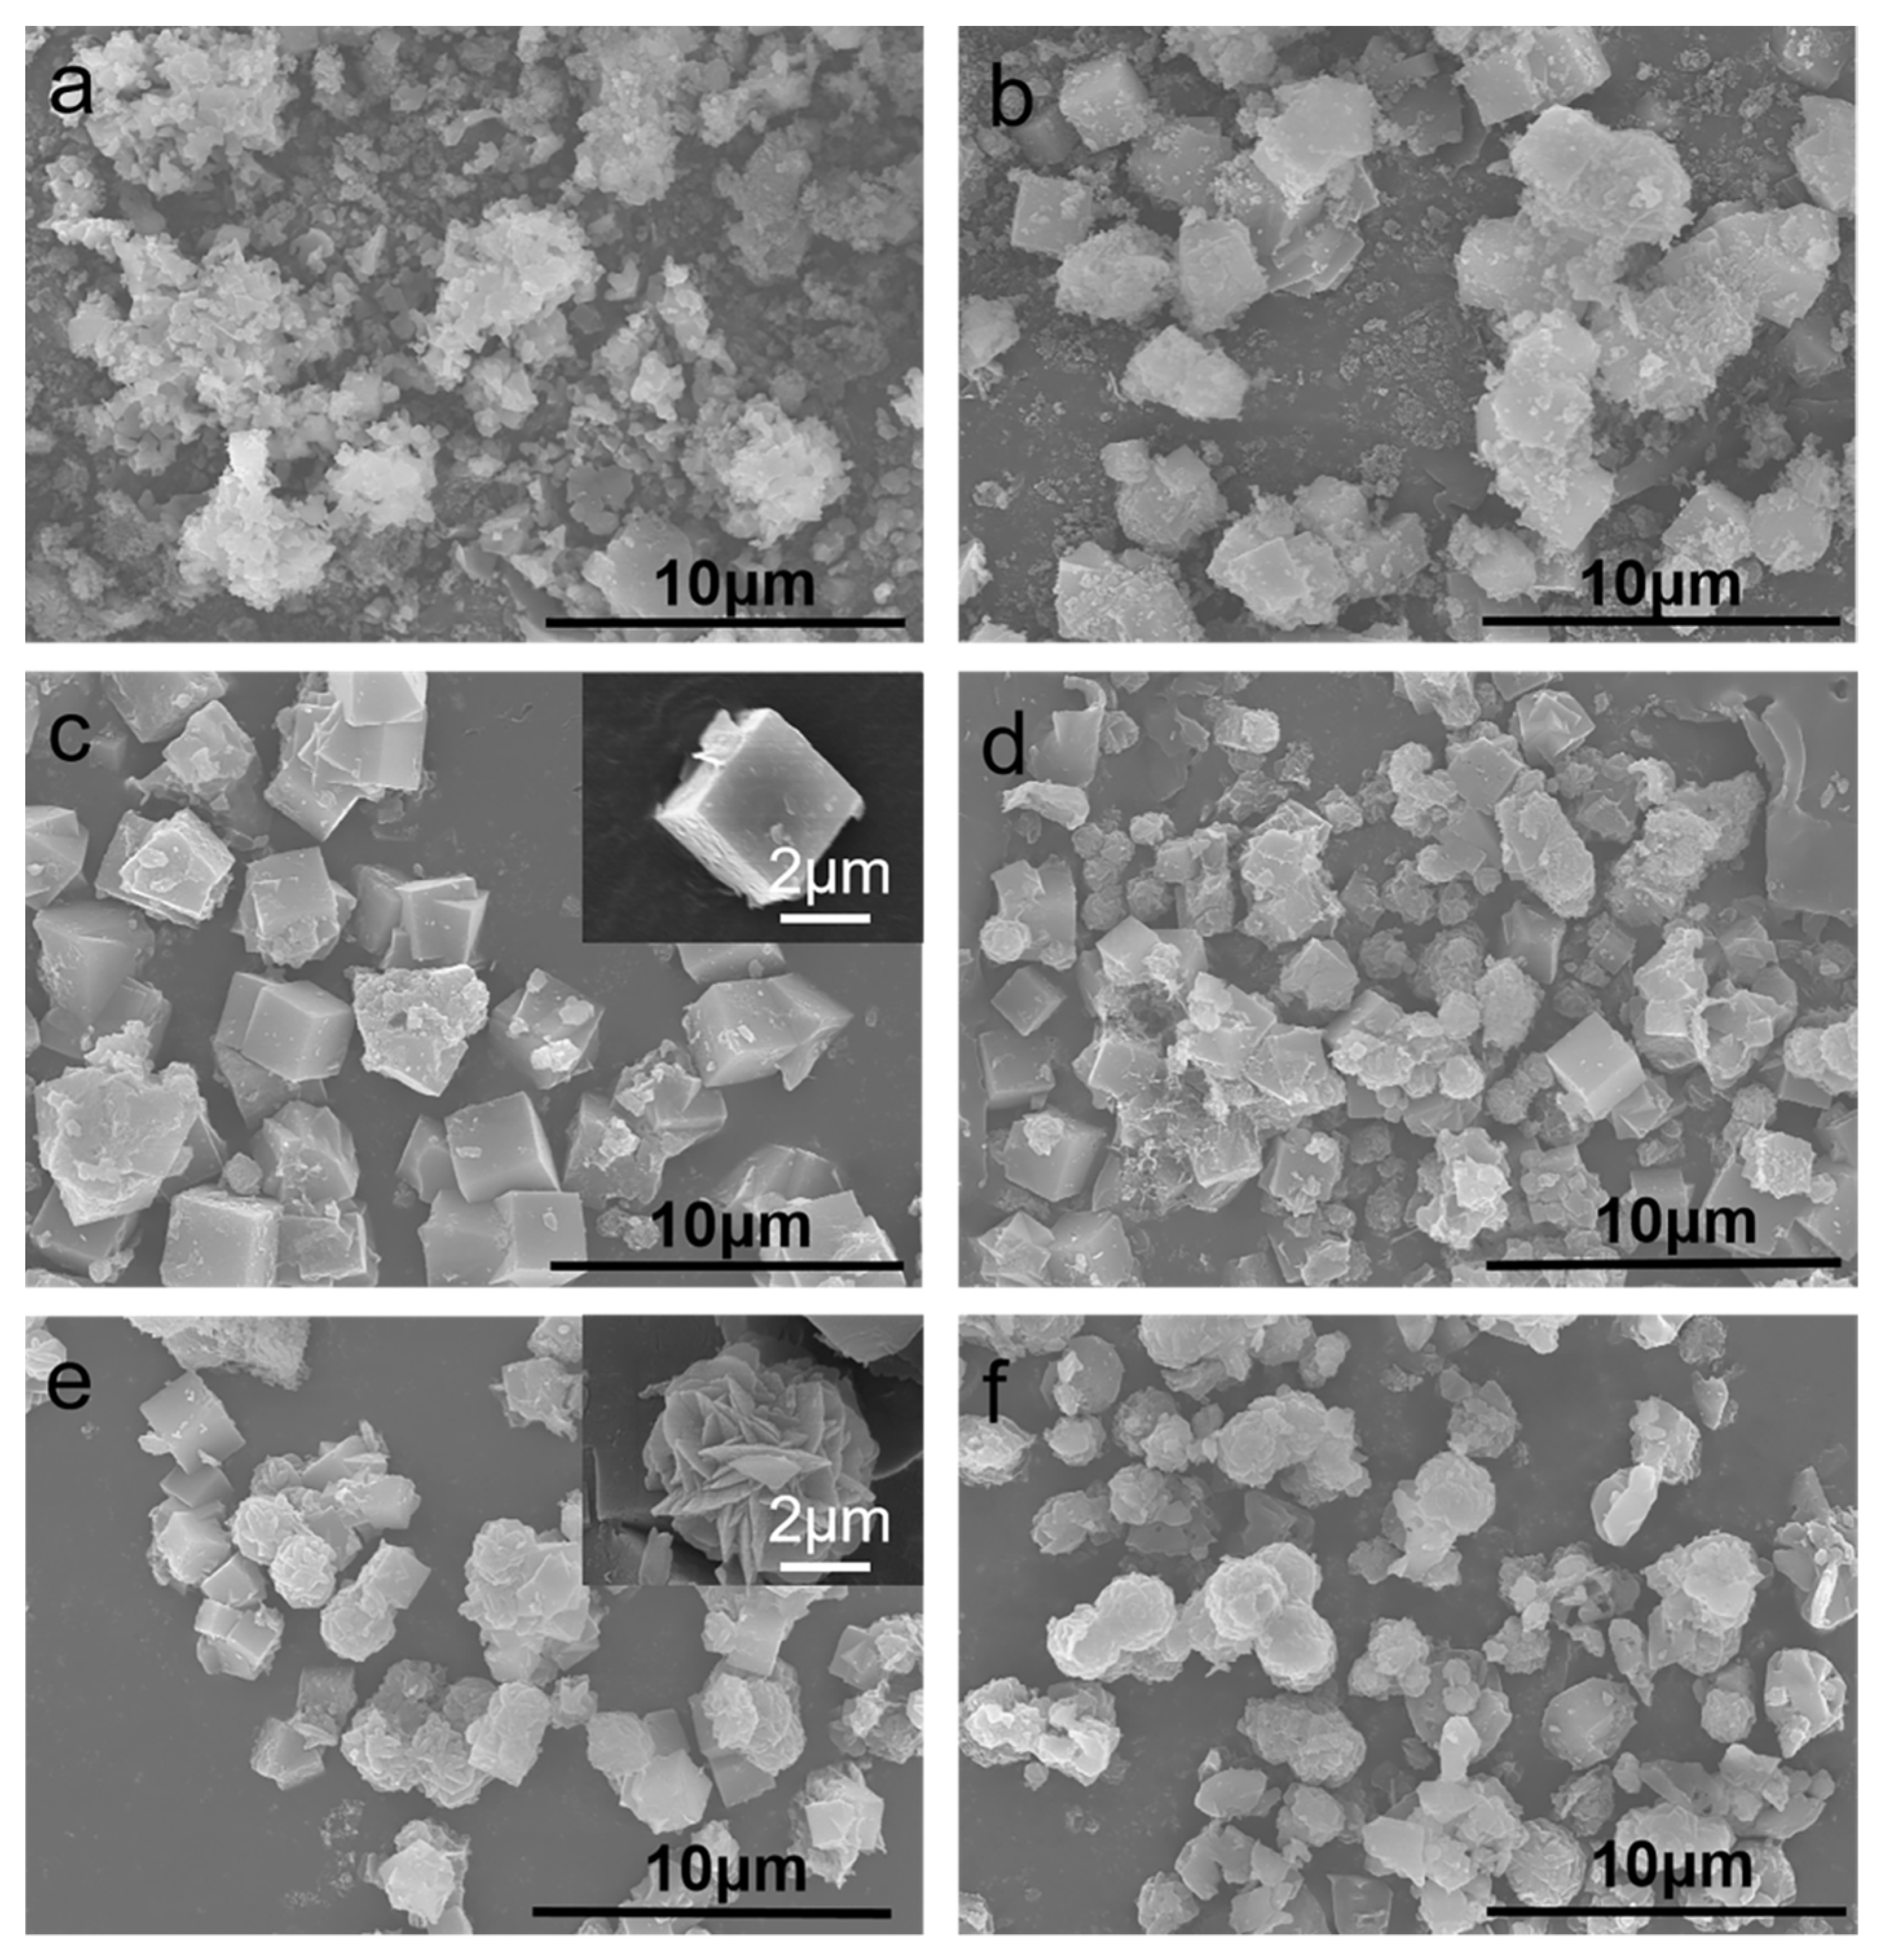
3.3. SEM Analysis
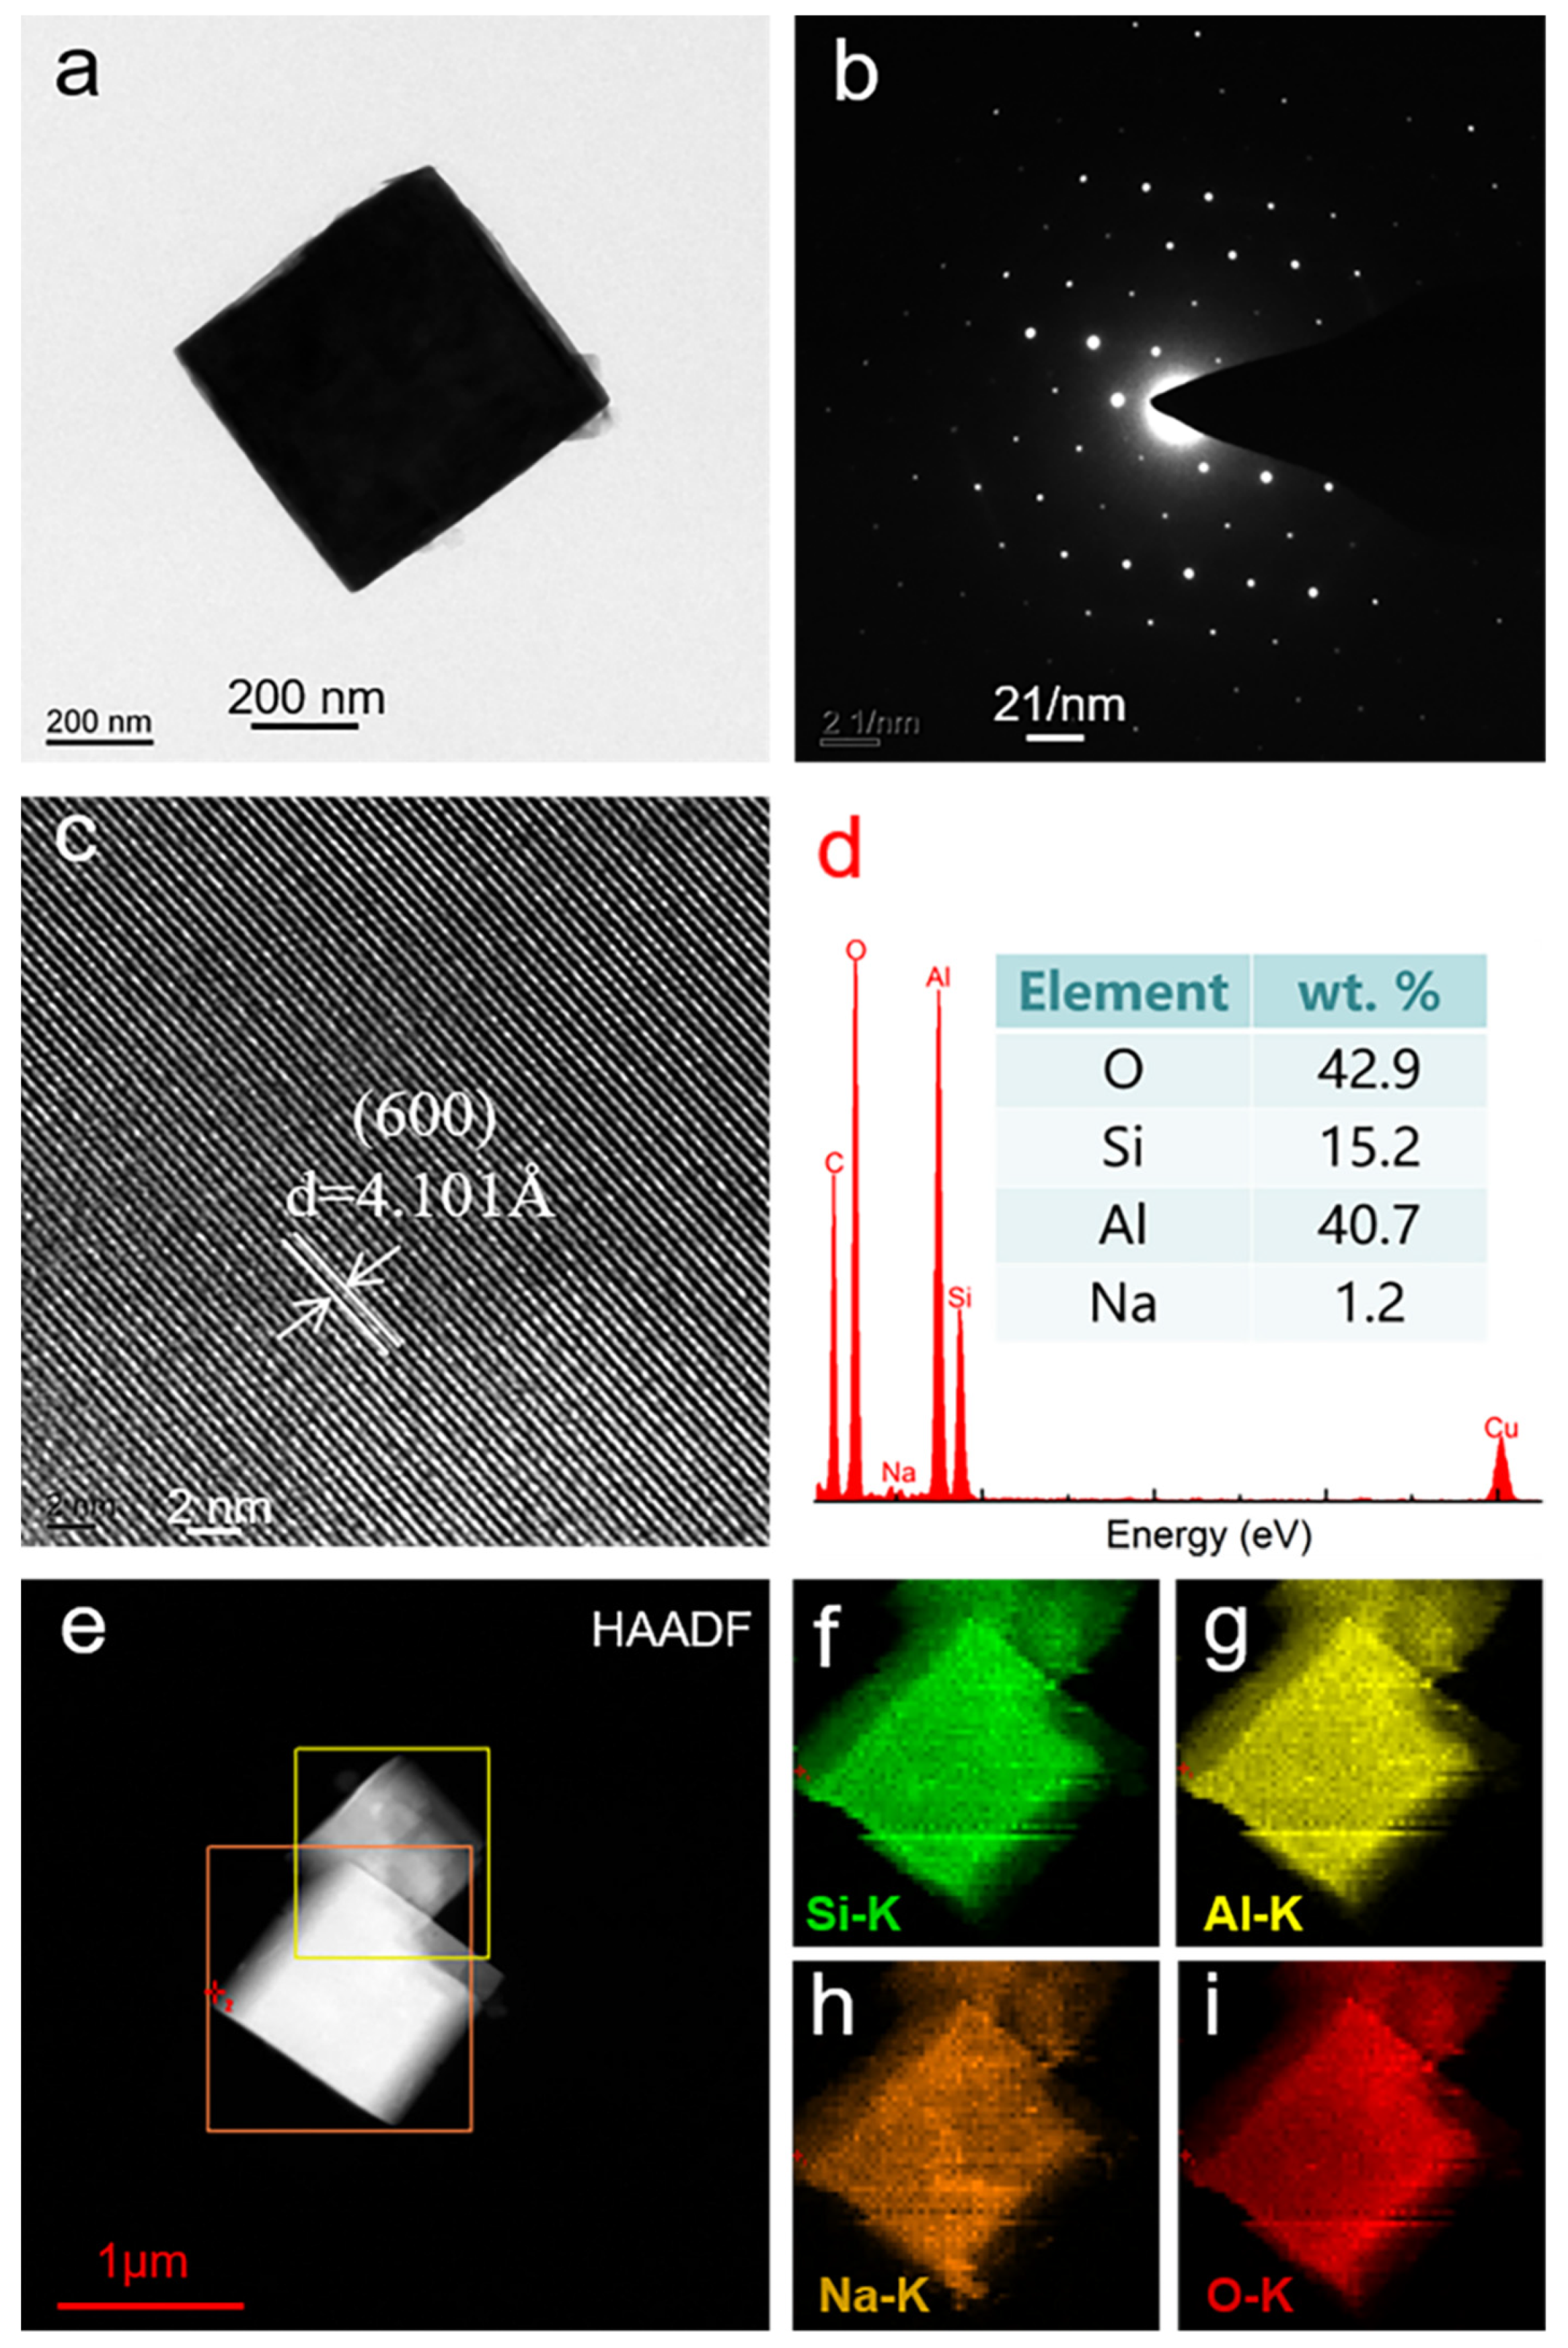
3.4. TEM Analysis
3.5. BET Analysis
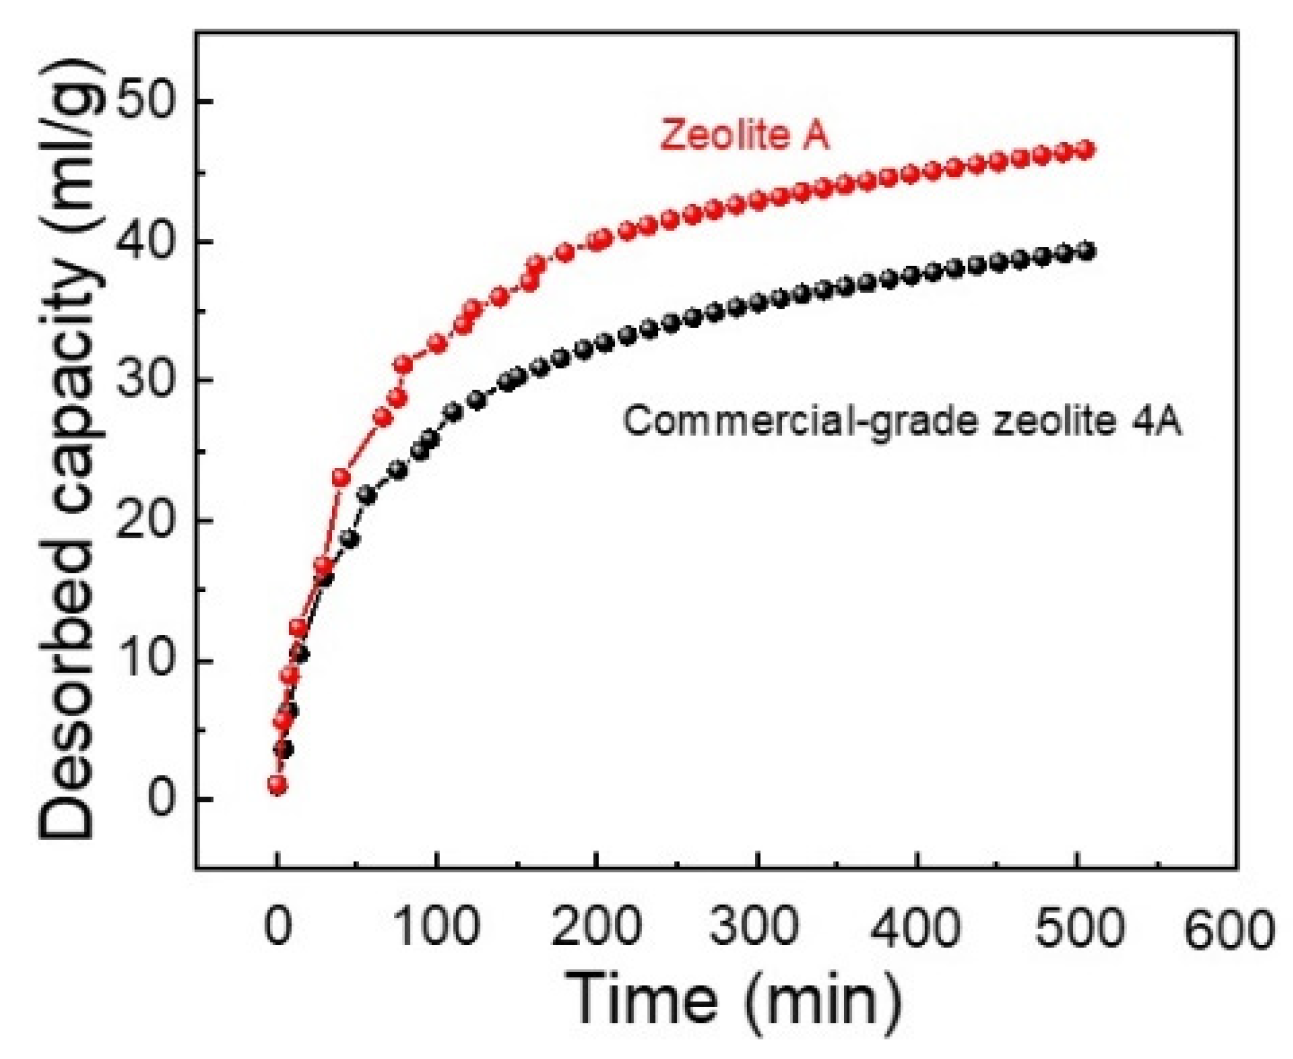
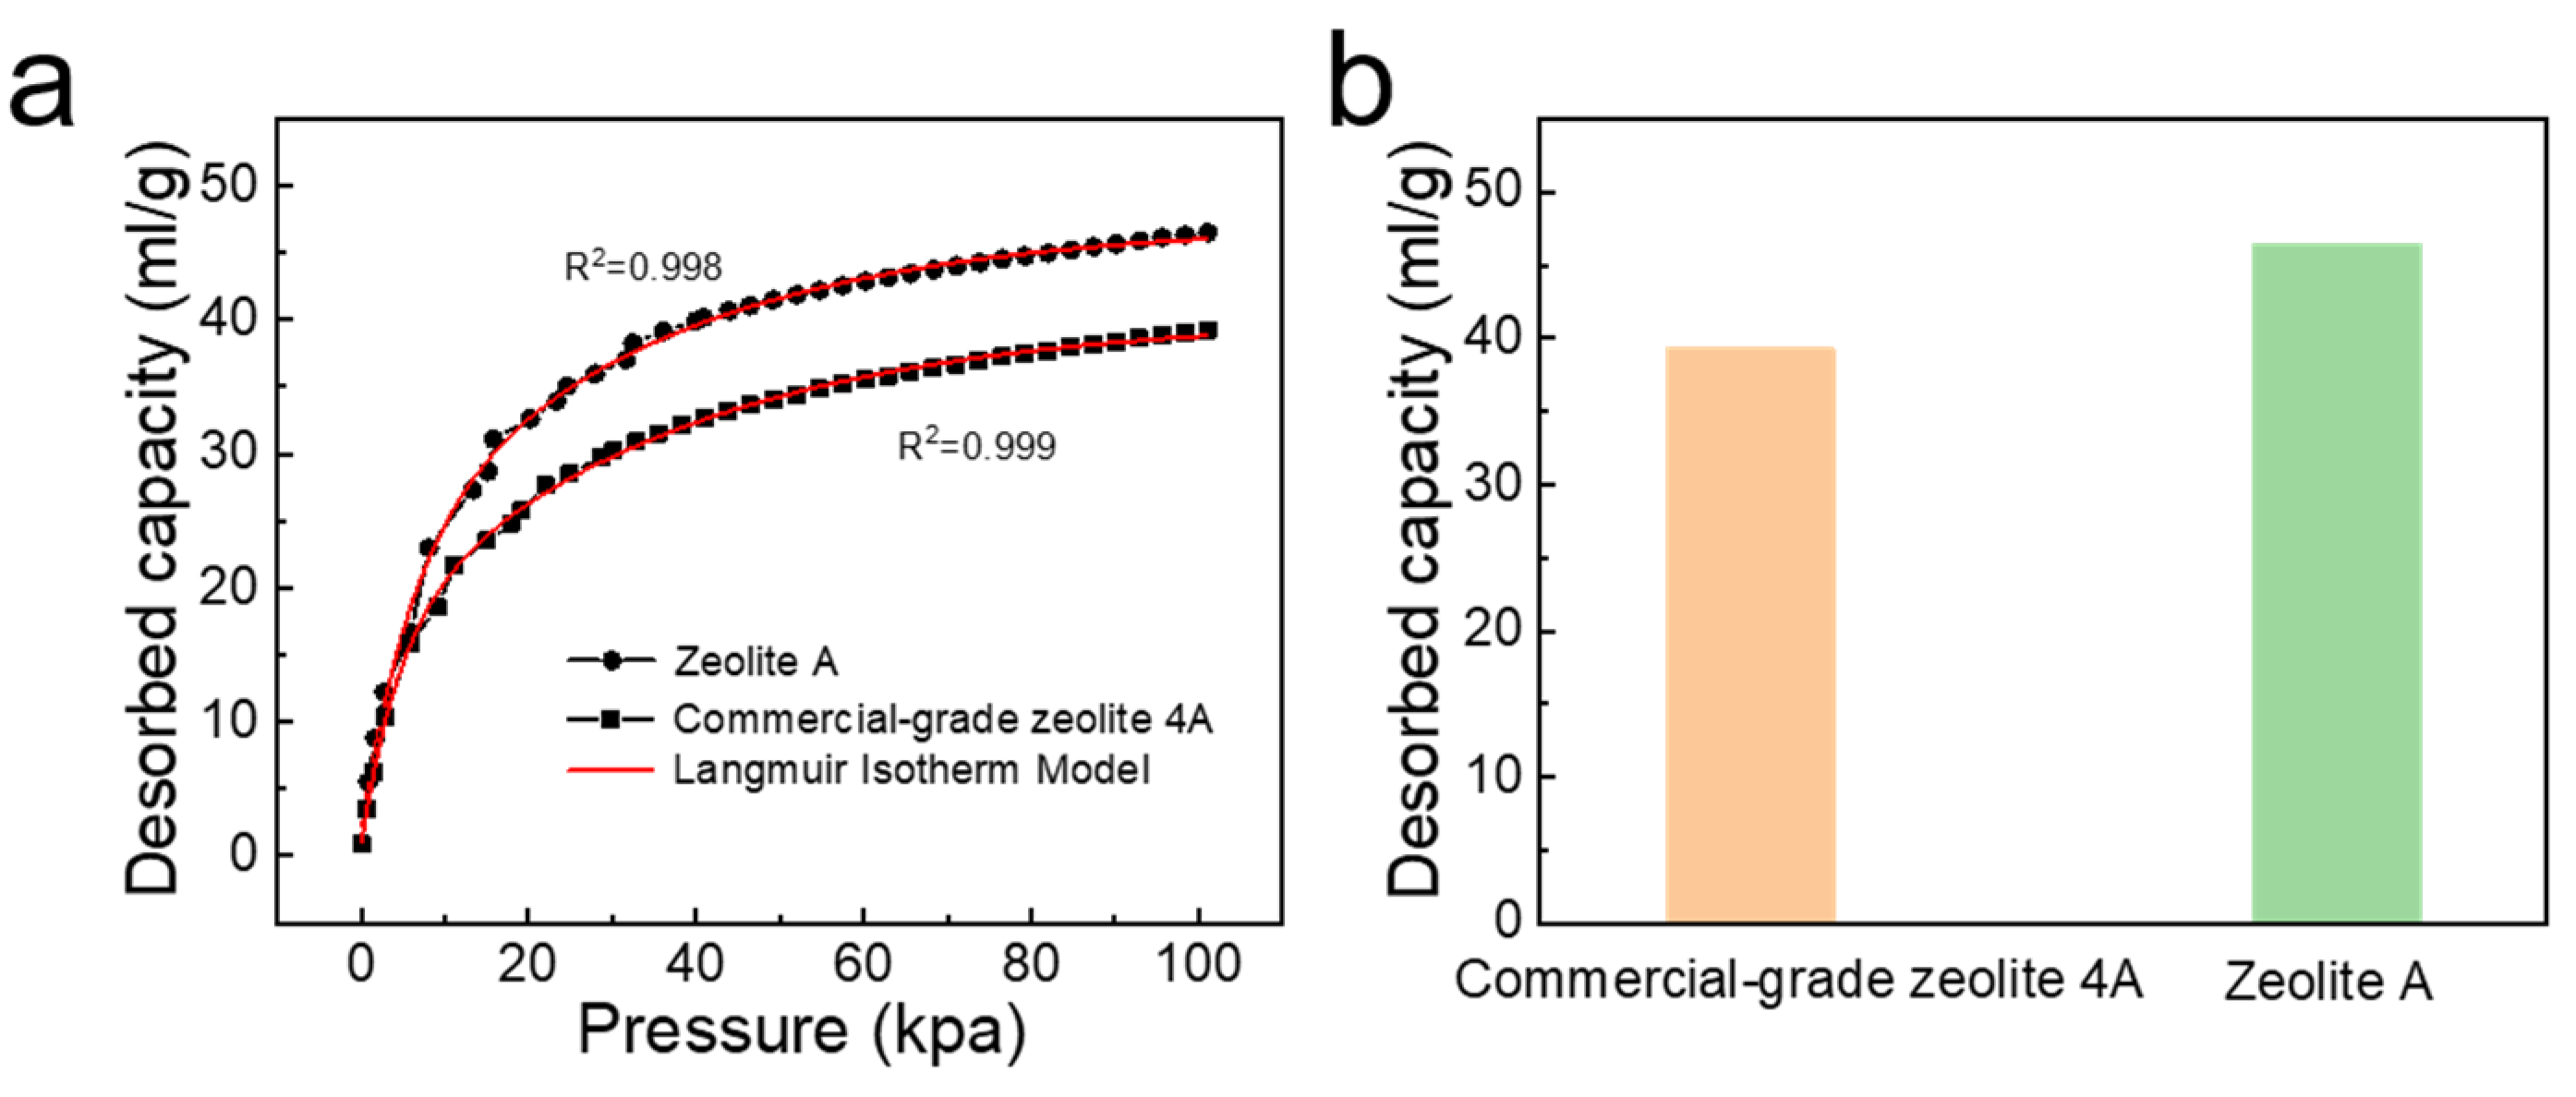
3.6. Carbon Dioxide Adsorption Analysis
4. Conclusions
Author Contributions
Funding
Informed Consent Statement
Data Availability Statement
Conflicts of Interest
Appendix A

References
- Ryunosuke, K. Application of coal ash to environmental improvement: Transformation into zeolite, potassium fertilizer, and FGD absorbent. Resour. Conserv. Recycl. 1999, 27, 333–346. [Google Scholar]
- Yan, W.; Feng, Y.L.; Yu, M.G.; Chao, Y.H. Comprehensive Utilization of Fly Ash. Adv. Mater. Res. 2012, 518, 701–704. [Google Scholar] [CrossRef]
- Gao, M.; Ma, Q.; Lin, Q.; Chang, J.; Ma, H. A novel approach to extract SiO 2 from fly ash and its considerable adsorption properties. Mater. Des. 2017, 116, 666–675. [Google Scholar] [CrossRef]
- Fan, F.; Liu, Z.; Xu, G.; Peng, H.; Cai, C. Mechanical and thermal properties of fly ash based geopolymers. Constr. Build. Mater. 2018, 160, 66–81. [Google Scholar] [CrossRef]
- Yao, Z.; Xia, M.; Sarker, P.; Chen, T. A review of the alumina recovery from coal fly ash, with a focus in China. Fuel 2014, 120, 74–85. [Google Scholar] [CrossRef] [Green Version]
- Yao, Z.; Ji, X.; Sarker, P.; Tang, J.; Ge, L.; Xia, M.; Xi, Y. A comprehensive review on the applications of coal fly ash. Earth Sci. Rev. 2015, 141, 105–121. [Google Scholar] [CrossRef] [Green Version]
- Prasad, B.; Mortimer, R.J.G. Treatment of Acid Mine Drainage Using Fly Ash Zeolite. Water Air Soil Pollut. 2010, 218, 667–679. [Google Scholar] [CrossRef]
- Sun, Q. Synthesis and Characterization of Zeolite and Magnetic Zeolite from Kaolin and Fly Ash. Ph.D. Thesis, China University of Geosciences for the Doctor Degree of Materials Science and Engineering, Wuhan, China, 2015. [Google Scholar]
- Iqbal, A.; Sattar, H.; Haider, R.; Munir, S. Synthesis and characterization of pure phase zeolite 4A from coal fly ash. J. Clean. Prod. 2019, 219, 258–267. [Google Scholar] [CrossRef]
- Yang, L.; Qian, X.; Yuan, P.; Bai, H.; Miki, T.; Men, F.; Li, H.; Nagasaka, T. Green synthesis of zeolite 4A using fly ash fused with synergism of NaOH and Na2CO3. J. Clean. Prod. 2019, 212, 250–260. [Google Scholar] [CrossRef]
- Wang, P.; Sun, Q.; Zhang, Y.; Cao, J. Synthesis of Zeolite 4A from Kaolin and Its Adsorption Equilibrium of Carbon Dioxide. Materials 2019, 12, 1536. [Google Scholar] [CrossRef] [PubMed] [Green Version]
- Bessa, R.D.A.; de Sousa Costa, L.; Oliveira, C.P.; Bohn, F.; do Nascimento, R.F.; Sasaki, J.M.; Loiola, A.R. Kaolin-based magnetic zeolites A and P as water softeners. Microporous Mesoporous Mater. 2017, 245, 64–72. [Google Scholar] [CrossRef]
- Wang, P.; Sun, Q.; Cao, J.; Xiong, R.-R.; Dai, X. Synthesis of KA molecular sieve by one-step hydrothermal method and its properties. J. Guizhou Univ. Nat. Sci. 2020, 37, 48–52. [Google Scholar]
- Liu, X.; Wang, R. Effective removal of hydrogen sulfide using 4A molecular sieve zeolite synthesized from attapulgite. J. Hazard. Mater. 2017, 326, 157–164. [Google Scholar] [CrossRef]
- Yao, G.; Lei, J.; Zhang, X.; Sun, Z.; Zheng, S.; Komarneni, S. Mechanism of zeolite X crystallization from diatomite. Mater. Res. Bull. 2018, 107, 132–138. [Google Scholar] [CrossRef]
- Xie, W.-M.; Zhou, F.-P.; Bi, X.-L.; Chen, D.-D.; Li, J.; Sun, S.-Y.; Liu, J.-Y.; Chen, X.-Q. Accelerated crystallization of magnetic 4A-zeolite synthesized from red mud for application in removal of mixed heavy metal ions. J. Hazard. Mater. 2018, 358, 441–449. [Google Scholar] [CrossRef]
- Holler, H.; Wirsching, U. Zeolite formation from fly ash. Fortschr. Mineral. 1985, 63, 21–43. [Google Scholar]
- Liu, Y.; Yan, C.; Zhao, J.; Zhang, Z.; Wang, H.; Zhou, S.; Wu, L. Synthesis of zeolite P1 from fly ash under solvent-free conditions for ammonium removal from water. J. Clean. Prod. 2018, 202, 11–22. [Google Scholar] [CrossRef]
- Wu, Y.-H.; Xue, K.; Ma, Q.-L.; Ma, T.; Ma, Y.-L.; Sun, Y.-G.; Ji, W.-X. Removal of hazardous crystal violet dye by low-cost P-type zeolite/carbon composite obtained from in situ conversion of coal gasification fine slag. Microporous Mesoporous Mater. 2021, 312, 110742. [Google Scholar] [CrossRef]
- Ariful, I.S.; Adisorn, A.; Amornvadee, V. Equilibrium and kinetic behaviour of CO2 adsorption onto zeolites, carbon molecular sieve and activated carbons. Energy Procedia 2017, 114, 2450–2459. [Google Scholar]
- Zavareh, S.; Farrokhzad, Z.; Farshad, D. Modification of zeolite 4A for use as an adsorbent for glyphosate and as an an-tibacterial agent for water. Ecotox Environ. Safe. 2018, 155, 1–8. [Google Scholar] [CrossRef]
- Su, S.; Ma, H.; Chuan, X. Hydrothermal synthesis of zeolite A from K-feldspar and its crystallization mechanism. Adv. Powder Technol. 2016, 27, 139–144. [Google Scholar] [CrossRef]
- Liu, Y.; Yang, X.; Yan, C.; Wang, H.; Zhou, S. Solvent-free synthesis of zeolite LTA monolith with hierarchically porous structure from me-takaolin. Mate Lett. 2019, 248, 28–31. [Google Scholar] [CrossRef]
- Cao, J.; Wang, P.; Shen, J.; Sun, Q. Core-shell Fe3O4@zeolite NaA as an Adsorbent for Cu2+. Materials 2020, 13, 5047. [Google Scholar] [CrossRef] [PubMed]
- Sun, Y.; Li, G.; Gong, Y.; Sun, Z.; Yao, H.; Zhou, X. Ag and TiO2 nanoparticles co-modified defective zeolite TS-1 for improved photocatalytic CO2 reduction. J. Hazard. Mater. 2021, 403, 124019. [Google Scholar] [CrossRef]
- Cao, J.; Sun, Q.; Wang, P.; Shen, J.; Dai, X. Synthesize and characterize of Fe3O4/zeolite 4A magnetic nanocomposite. J. Dispers. Sci. Technol. 2020, 1–9. [Google Scholar] [CrossRef]
- Cao, J.; Wang, P.; Sun, Q. Green Synthesis of Magnetic Zeolite LTA using NaOH Activated Fly Ash. Z Anorg. Allg. Chem. 2020, 646, 1666–1670. [Google Scholar] [CrossRef]
- Wang, J.; Wang, T.; Yan, B.; Wang, Q.; Zhang, Y.; Pan, W.-P. Removal of ionic mercury from gasoline using zeolite 13X impregnated with KI: Adsorption mechanisms and simulation. Chem. Eng. J. 2021, 409, 128170. [Google Scholar] [CrossRef]
- Ahmed, A.A.; Yamani, Z. Synthesis and characterization of SnO2-modified ZSM-5 zeolite for hydrogen gas sensing. Mater. Chem. Phys. 2021, 259, 124181. [Google Scholar] [CrossRef]
- Wongwiriyapan, W.; Inoue, S.; Honda, S.-I.; Katayama, M. Adsorption Kinetics of NO2 on Single-Walled Carbon Nanotube Thin-Film Sensor. Jpn. J. Appl. Phys. 2008, 47, 8145–8147. [Google Scholar] [CrossRef]
- Ranjan, R.; Murugesan, T.; Dash, A. Ultrasensitive and light-activated NO2 gas sensor based on networked MoS2/ZnO nano-hybrid with adsorption/desorption kinetics study. Appl. Surf. Sci. 2021, 536, 147933. [Google Scholar]
- Gholipour, F.; Mofarahi, M. Adsorption equilibrium of methane and carbon dioxide on zeolite 13X: Experimental and ther-modynamic modeling. J. Supercrit. Fluid 2016, 111, 47–54. [Google Scholar] [CrossRef]

Publisher’s Note: MDPI stays neutral with regard to jurisdictional claims in published maps and institutional affiliations. |
© 2021 by the authors. Licensee MDPI, Basel, Switzerland. This article is an open access article distributed under the terms and conditions of the Creative Commons Attribution (CC BY) license (https://creativecommons.org/licenses/by/4.0/).
Share and Cite
Wang, P.; Cao, J.; Zhang, Y.; Sun, Q. Controllable Preparation of Cubic Zeolite A and Application of Langmuir Model in Carbon Dioxide Adsorption. Nanomaterials 2021, 11, 3375. https://doi.org/10.3390/nano11123375
Wang P, Cao J, Zhang Y, Sun Q. Controllable Preparation of Cubic Zeolite A and Application of Langmuir Model in Carbon Dioxide Adsorption. Nanomaterials. 2021; 11(12):3375. https://doi.org/10.3390/nano11123375
Chicago/Turabian StyleWang, Peng, Jun Cao, Yujiao Zhang, and Qi Sun. 2021. "Controllable Preparation of Cubic Zeolite A and Application of Langmuir Model in Carbon Dioxide Adsorption" Nanomaterials 11, no. 12: 3375. https://doi.org/10.3390/nano11123375
APA StyleWang, P., Cao, J., Zhang, Y., & Sun, Q. (2021). Controllable Preparation of Cubic Zeolite A and Application of Langmuir Model in Carbon Dioxide Adsorption. Nanomaterials, 11(12), 3375. https://doi.org/10.3390/nano11123375