Keyhole Formation by Laser Drilling in Laser Powder Bed Fusion of Ti6Al4V Biomedical Alloy: Mesoscopic Computational Fluid Dynamics Simulation versus Mathematical Modelling Using Empirical Validation

 ,
,  ,
, 
 ,
, 

Abstract
:1. Introduction
2. Modelling
2.1. Analytical Modelling
2.2. Numerical Modelling
3. Materials and Methods
4. Results and Discussions
5. Conclusions
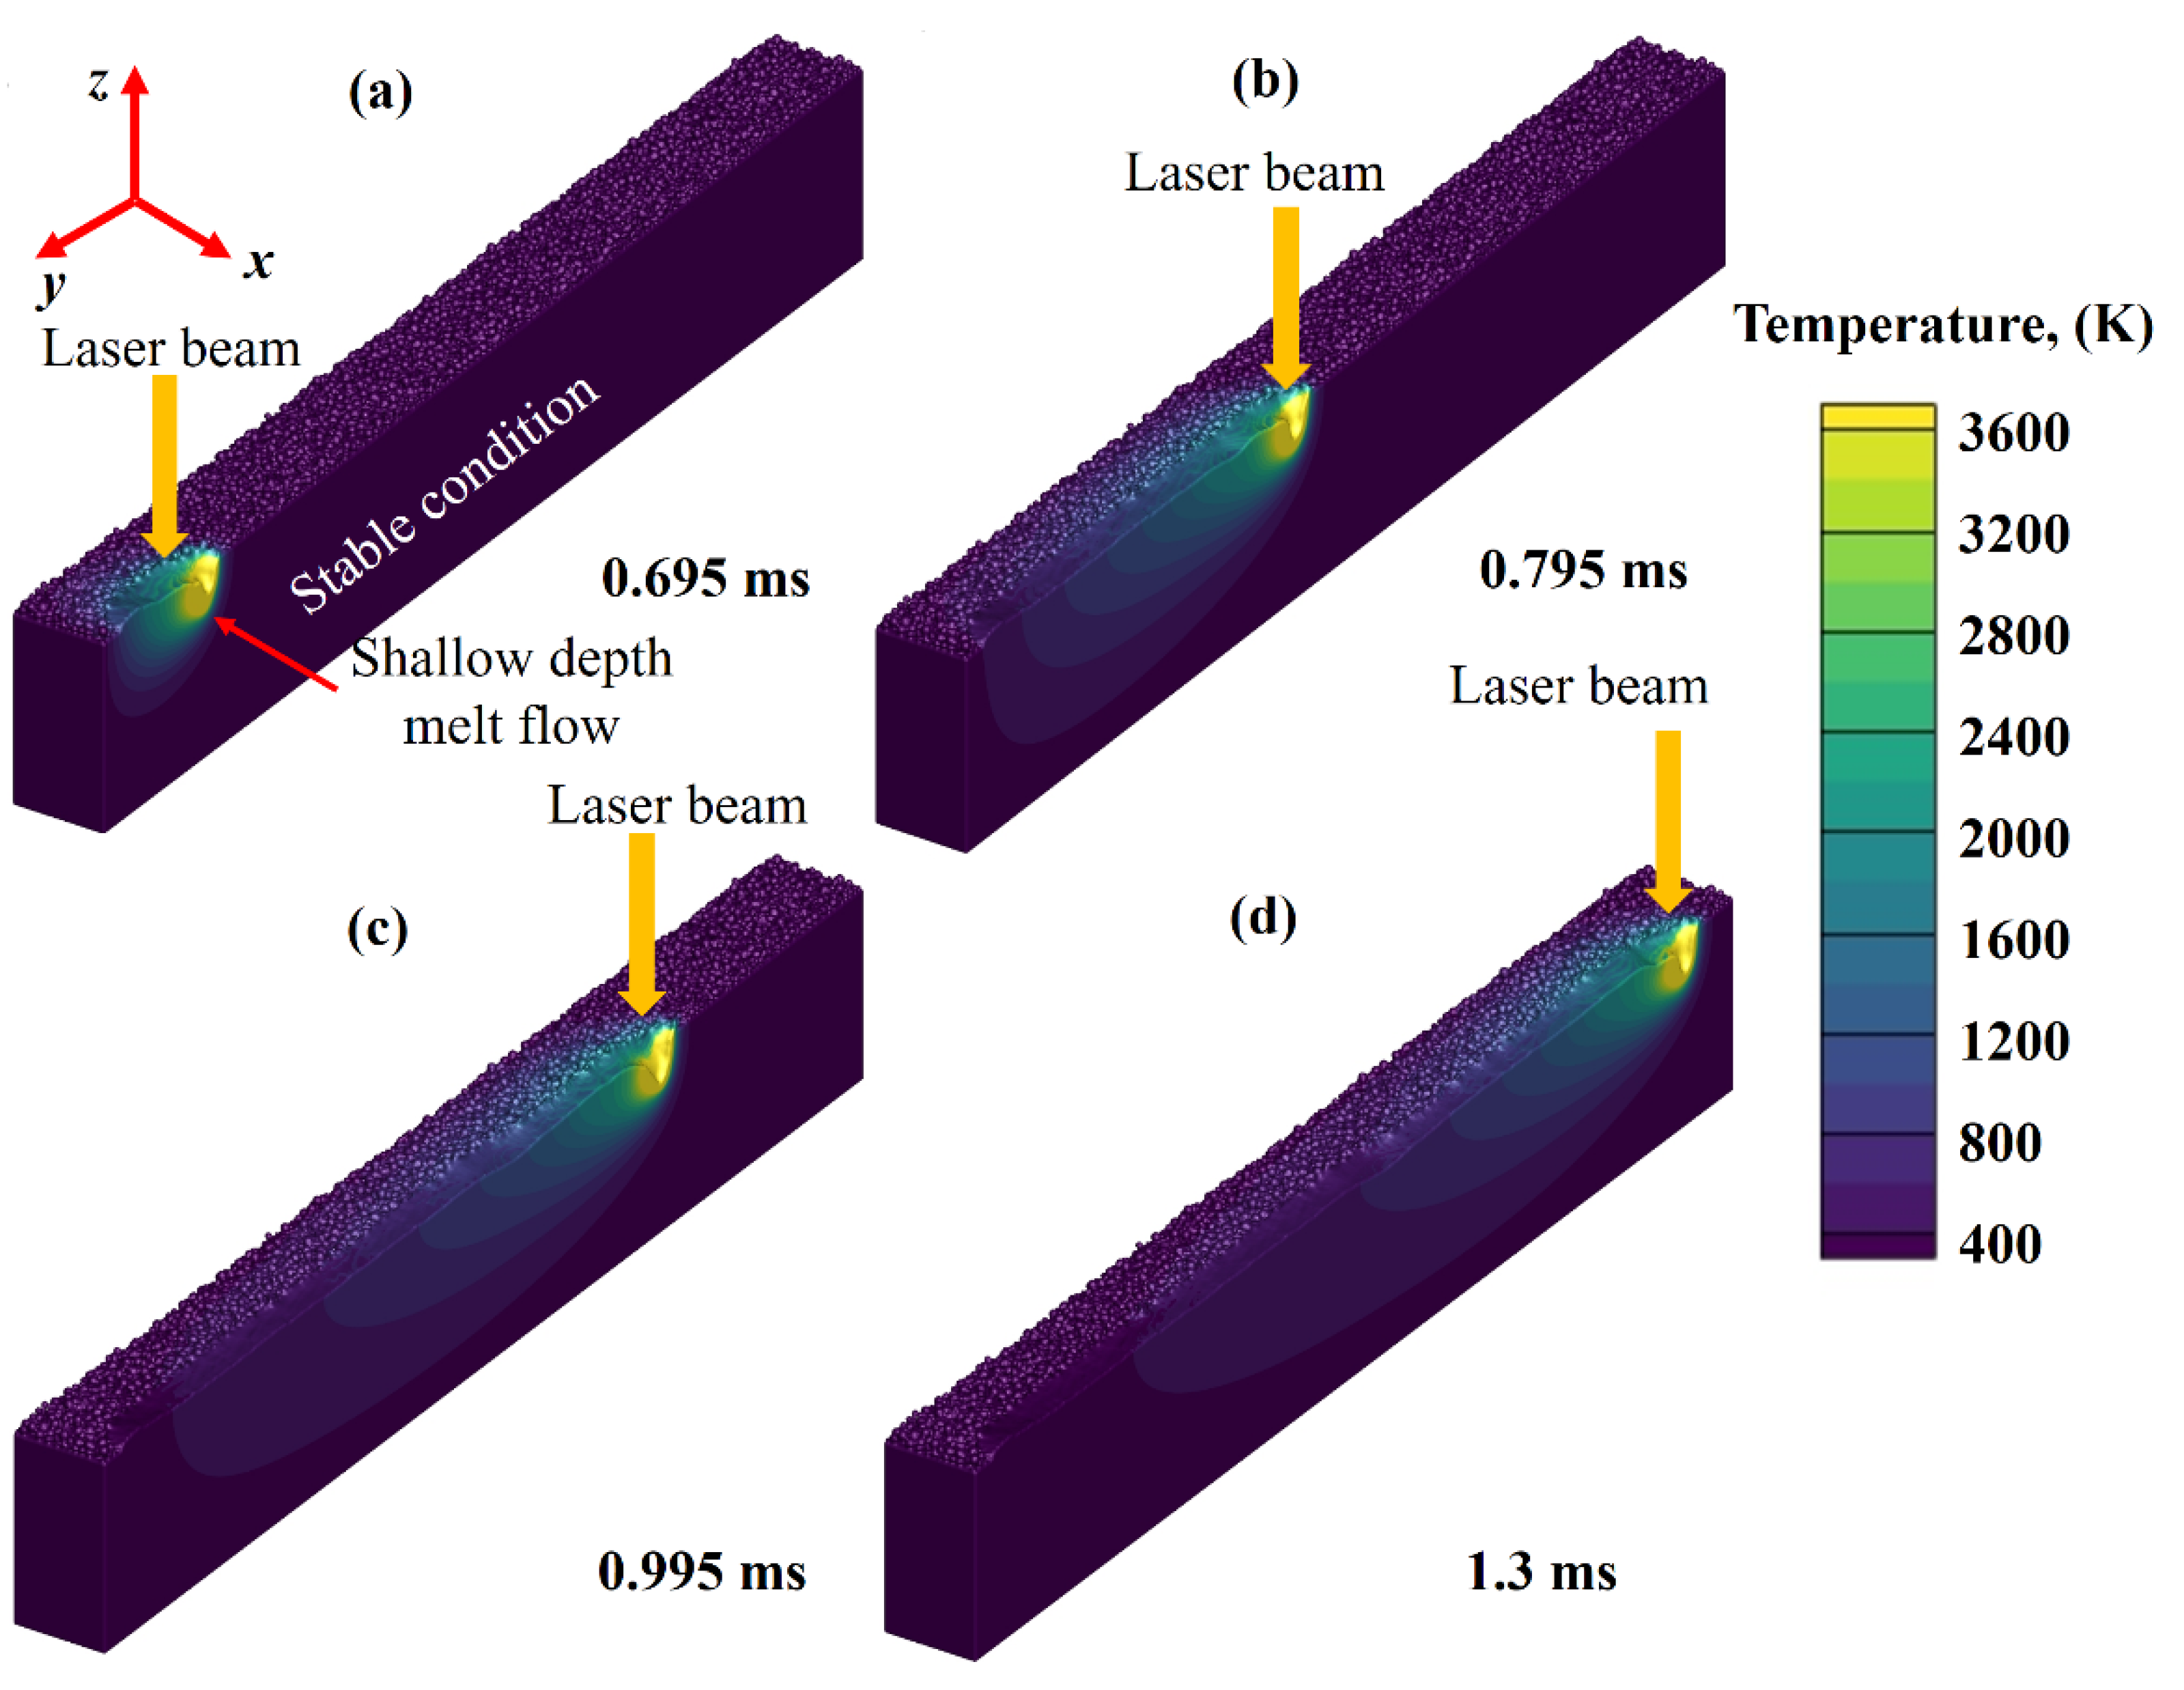
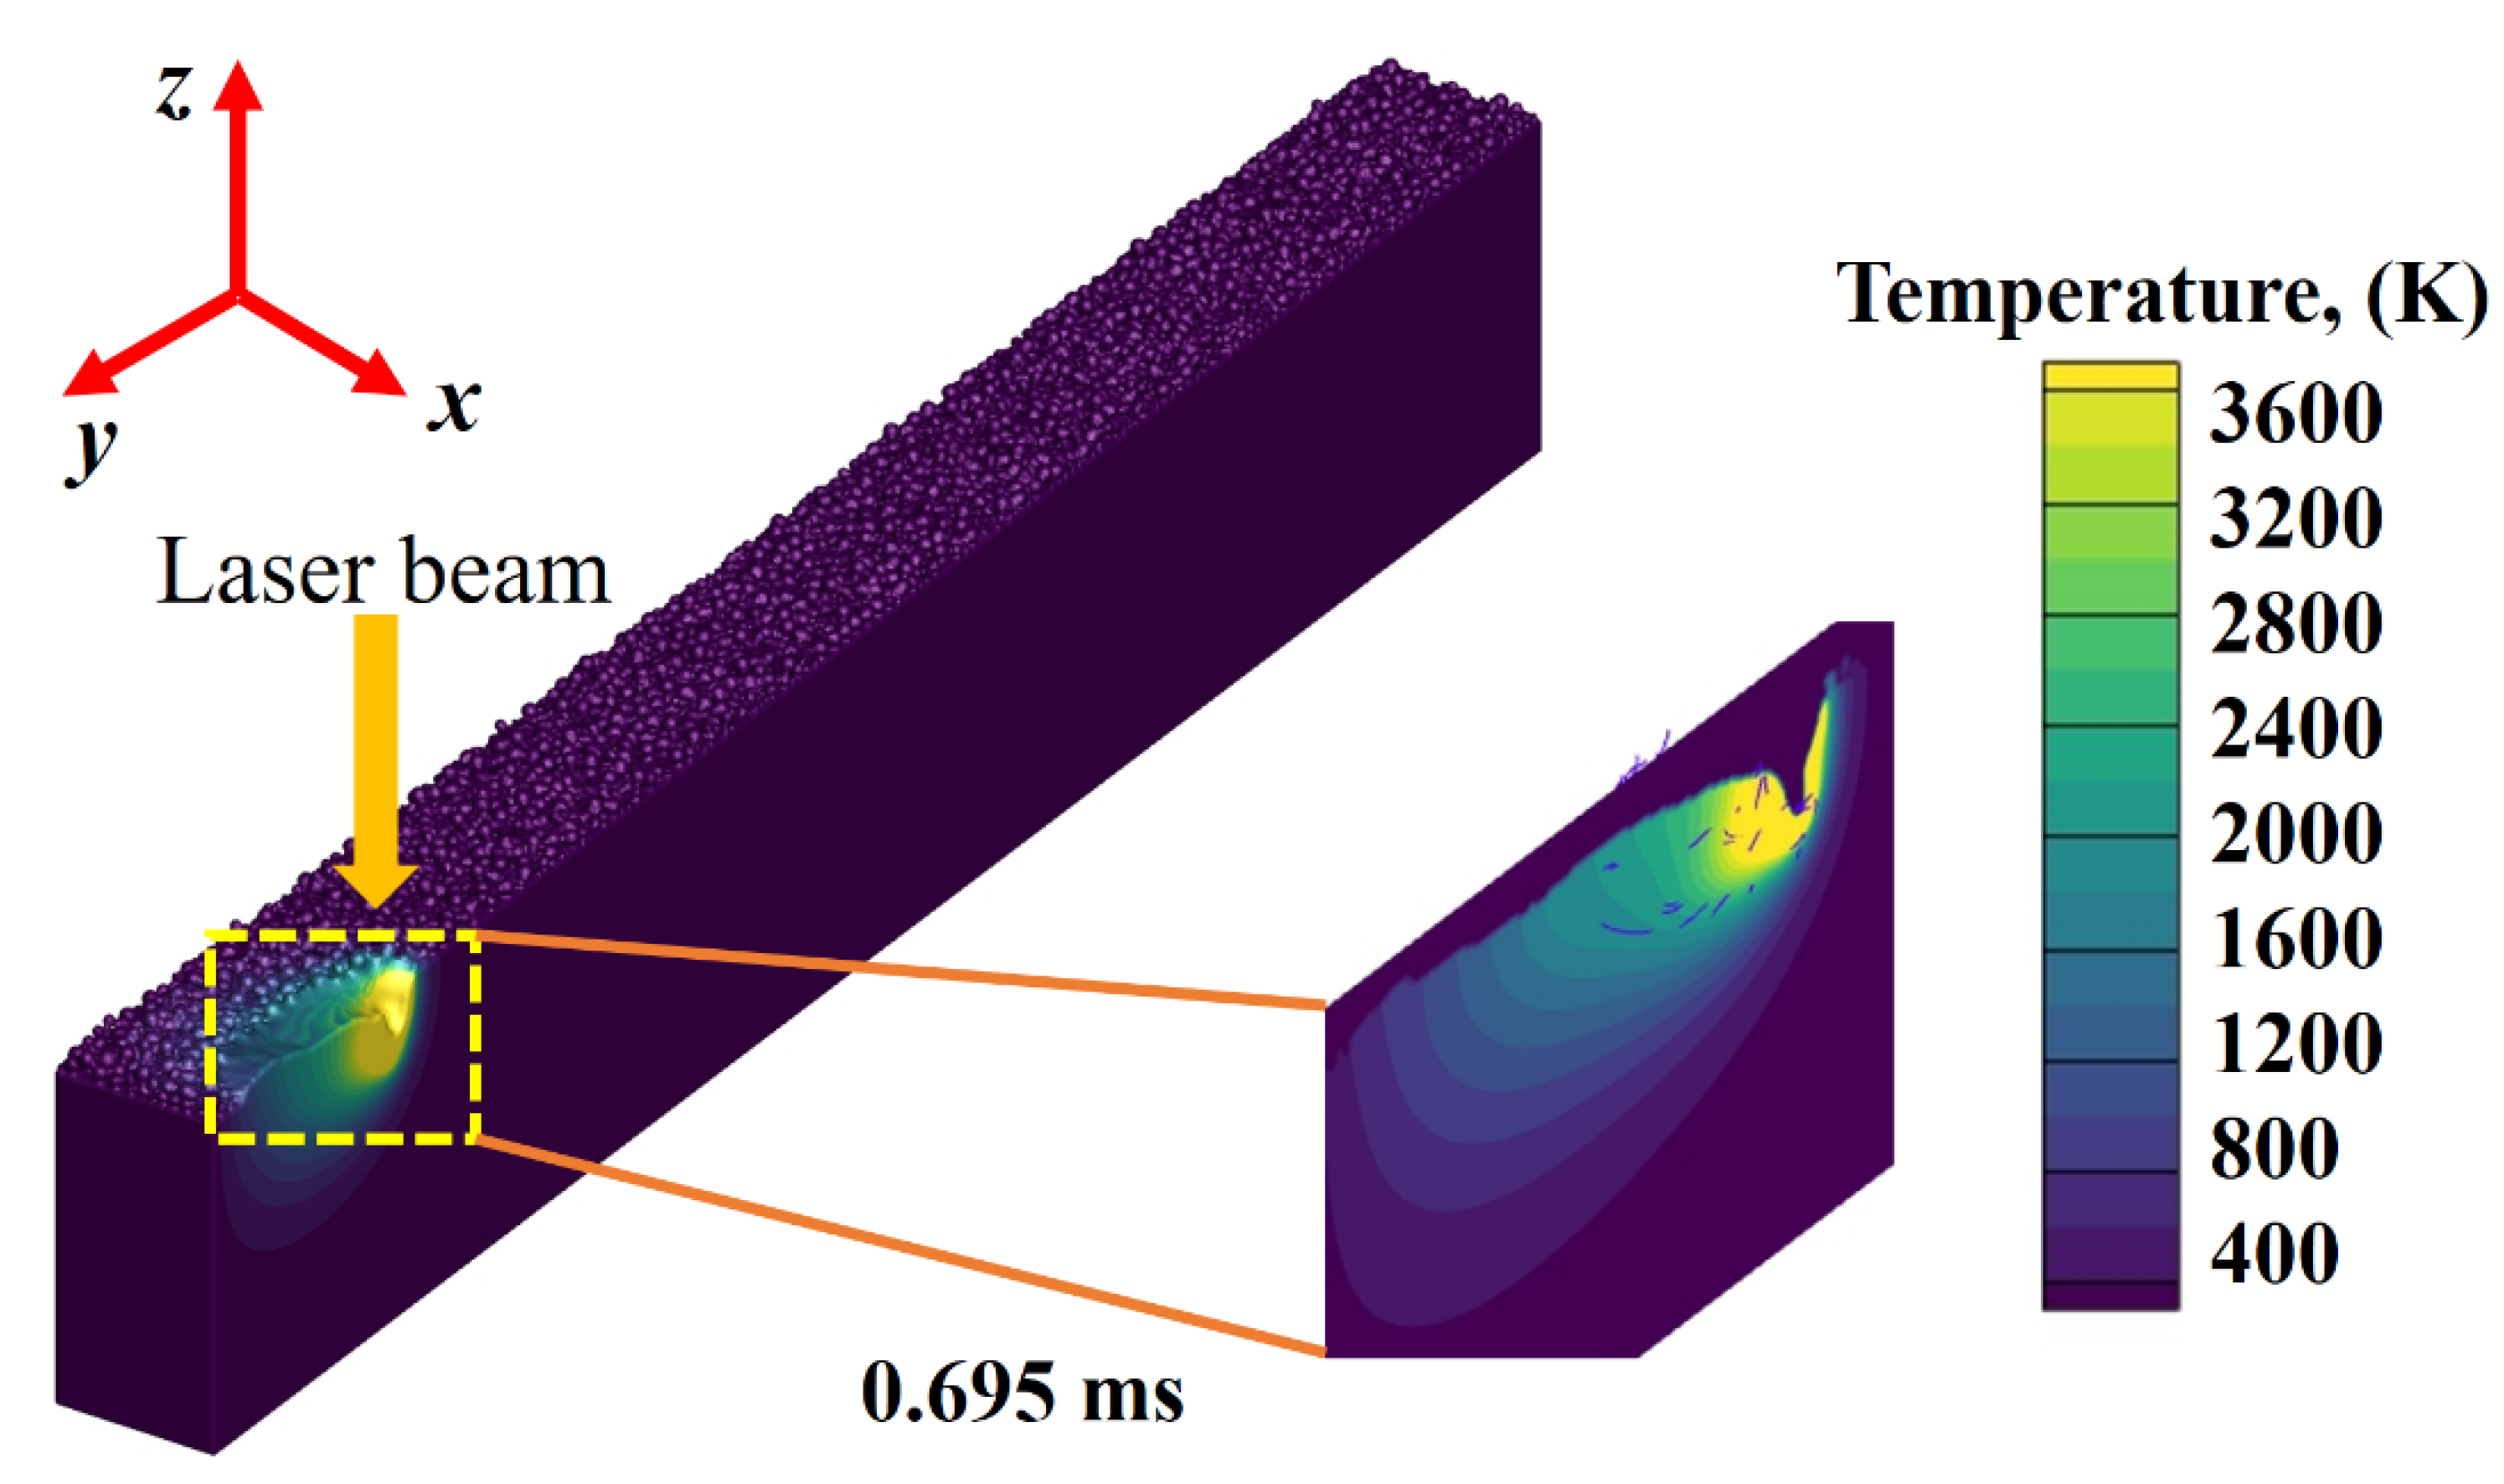
- The temperature below the laser irradiation point rises rapidly in LPBF, whereas the powder layer around it remains at a localized temperature. Due to air between the powder particles and the relatively low particle–particle contact areas, laser transverse heat waves have a slower speed because of the high thermal resistance.
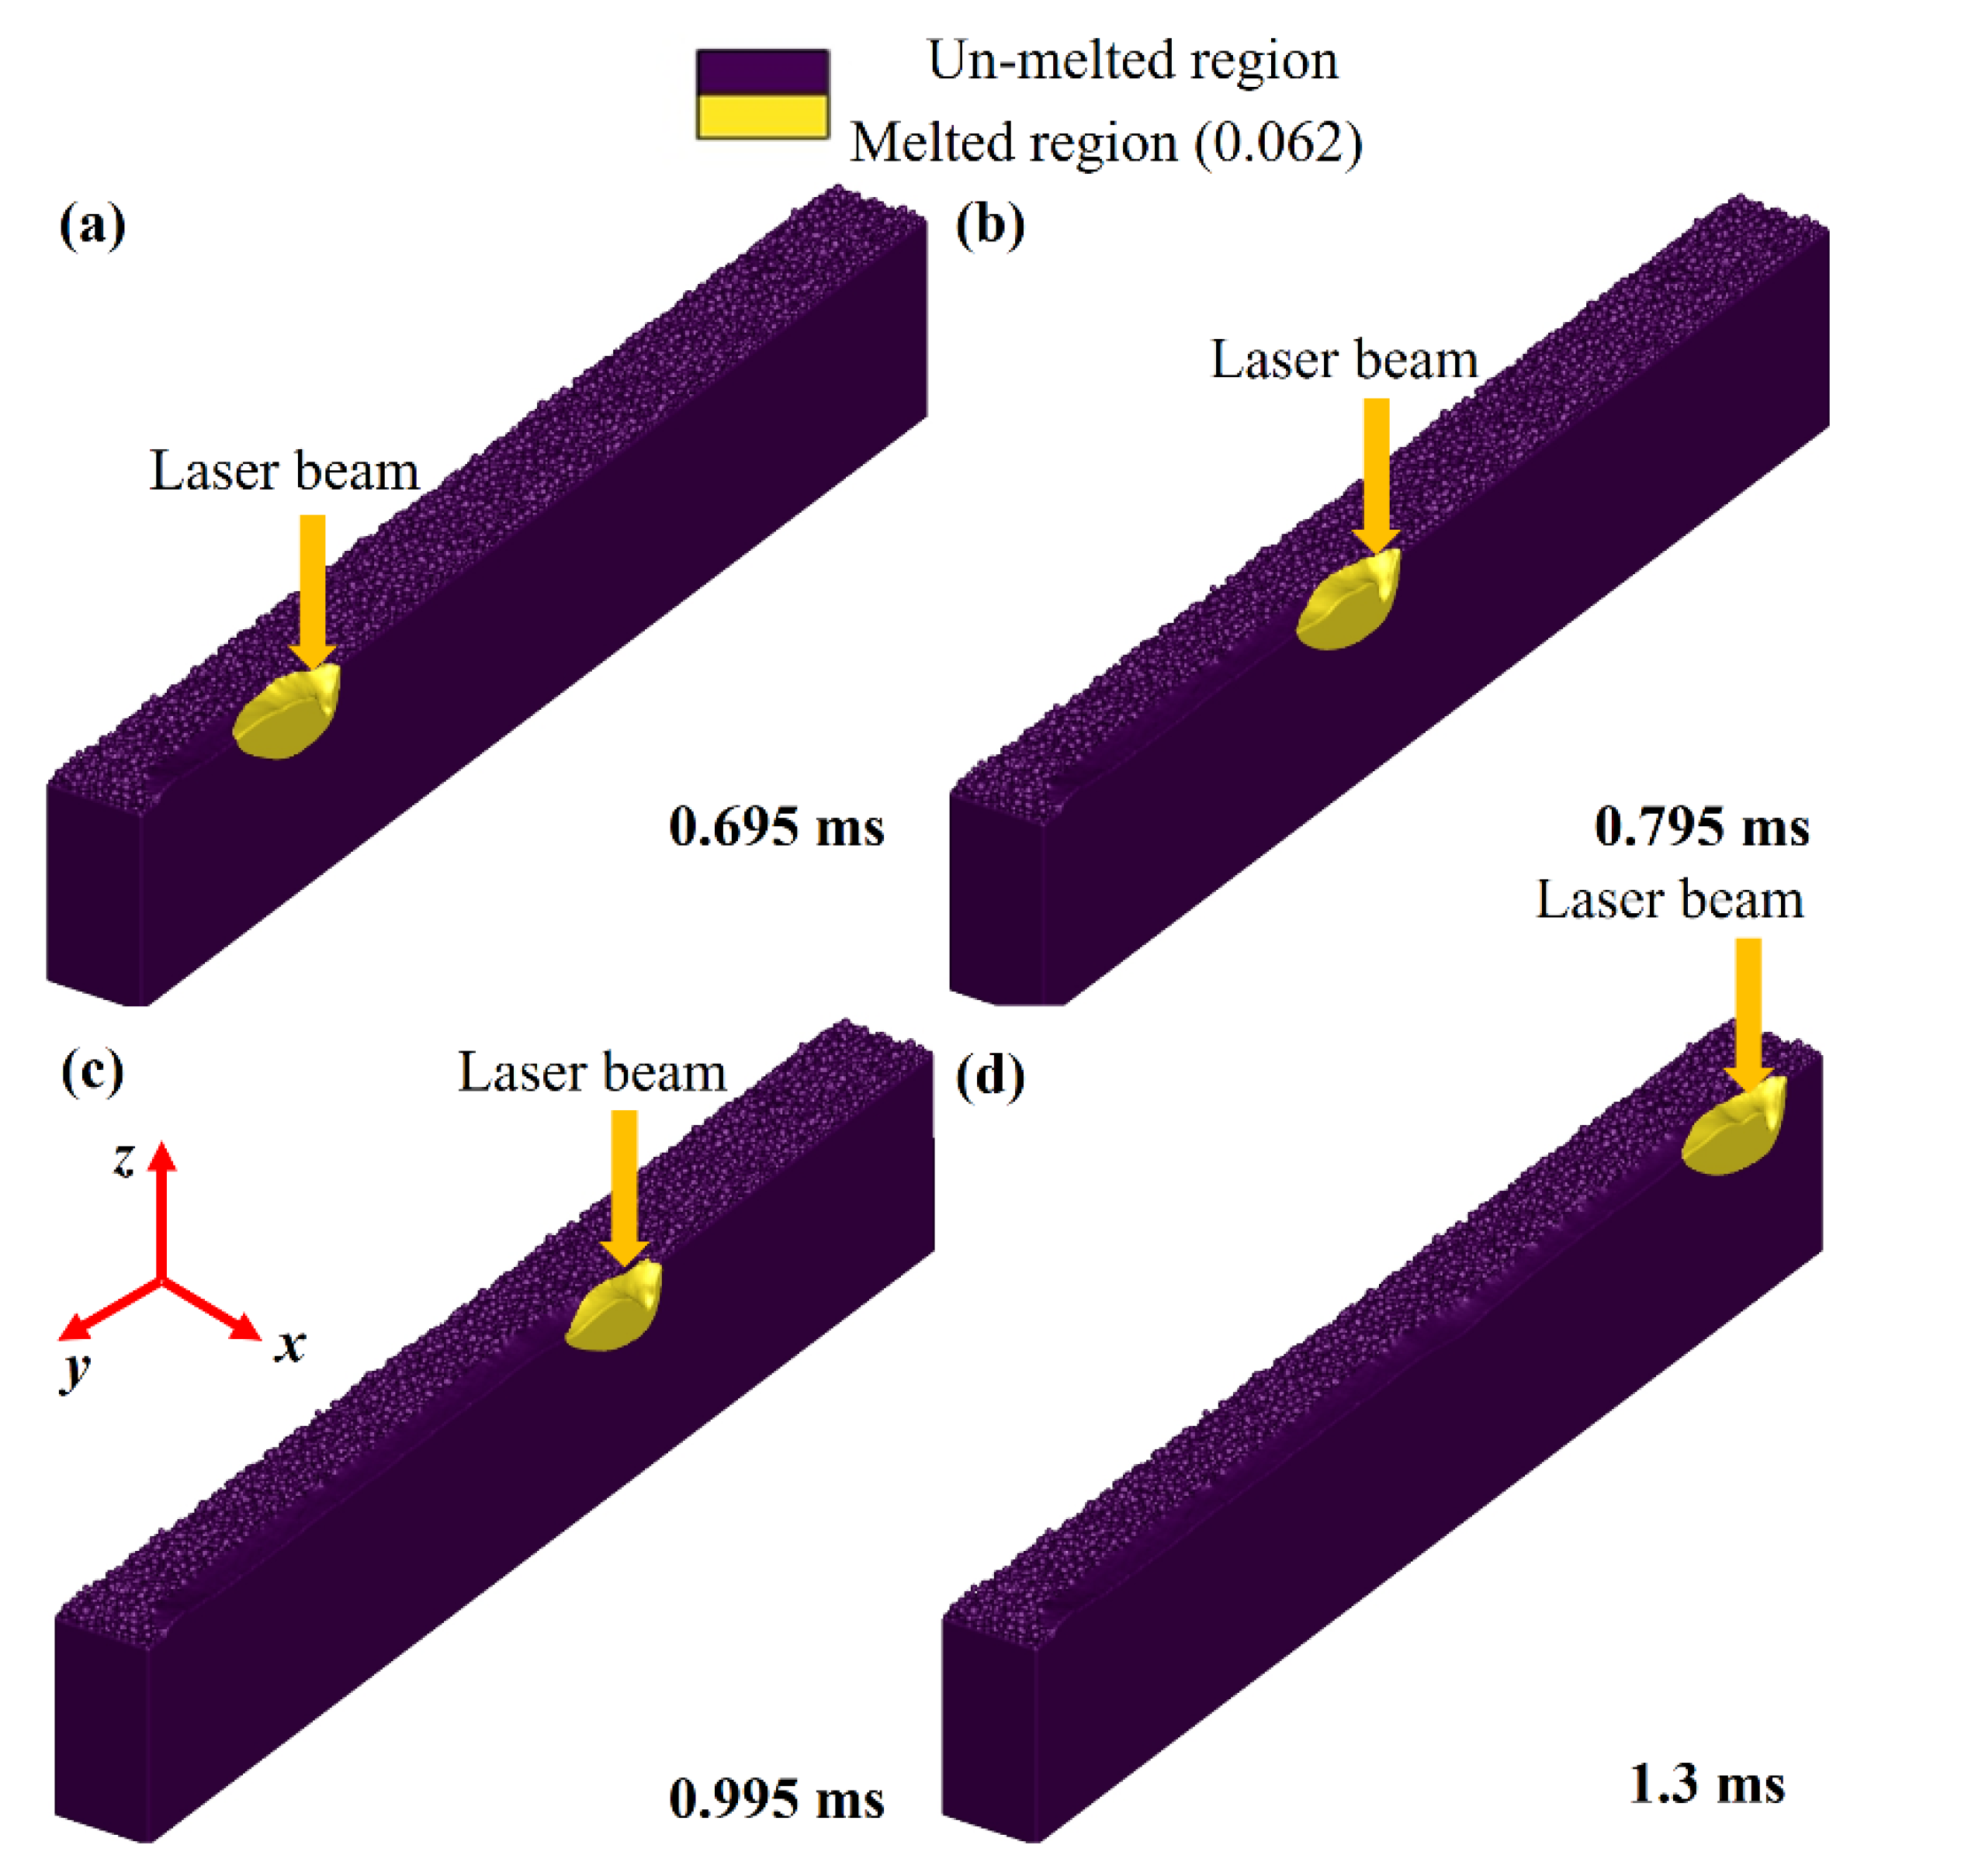
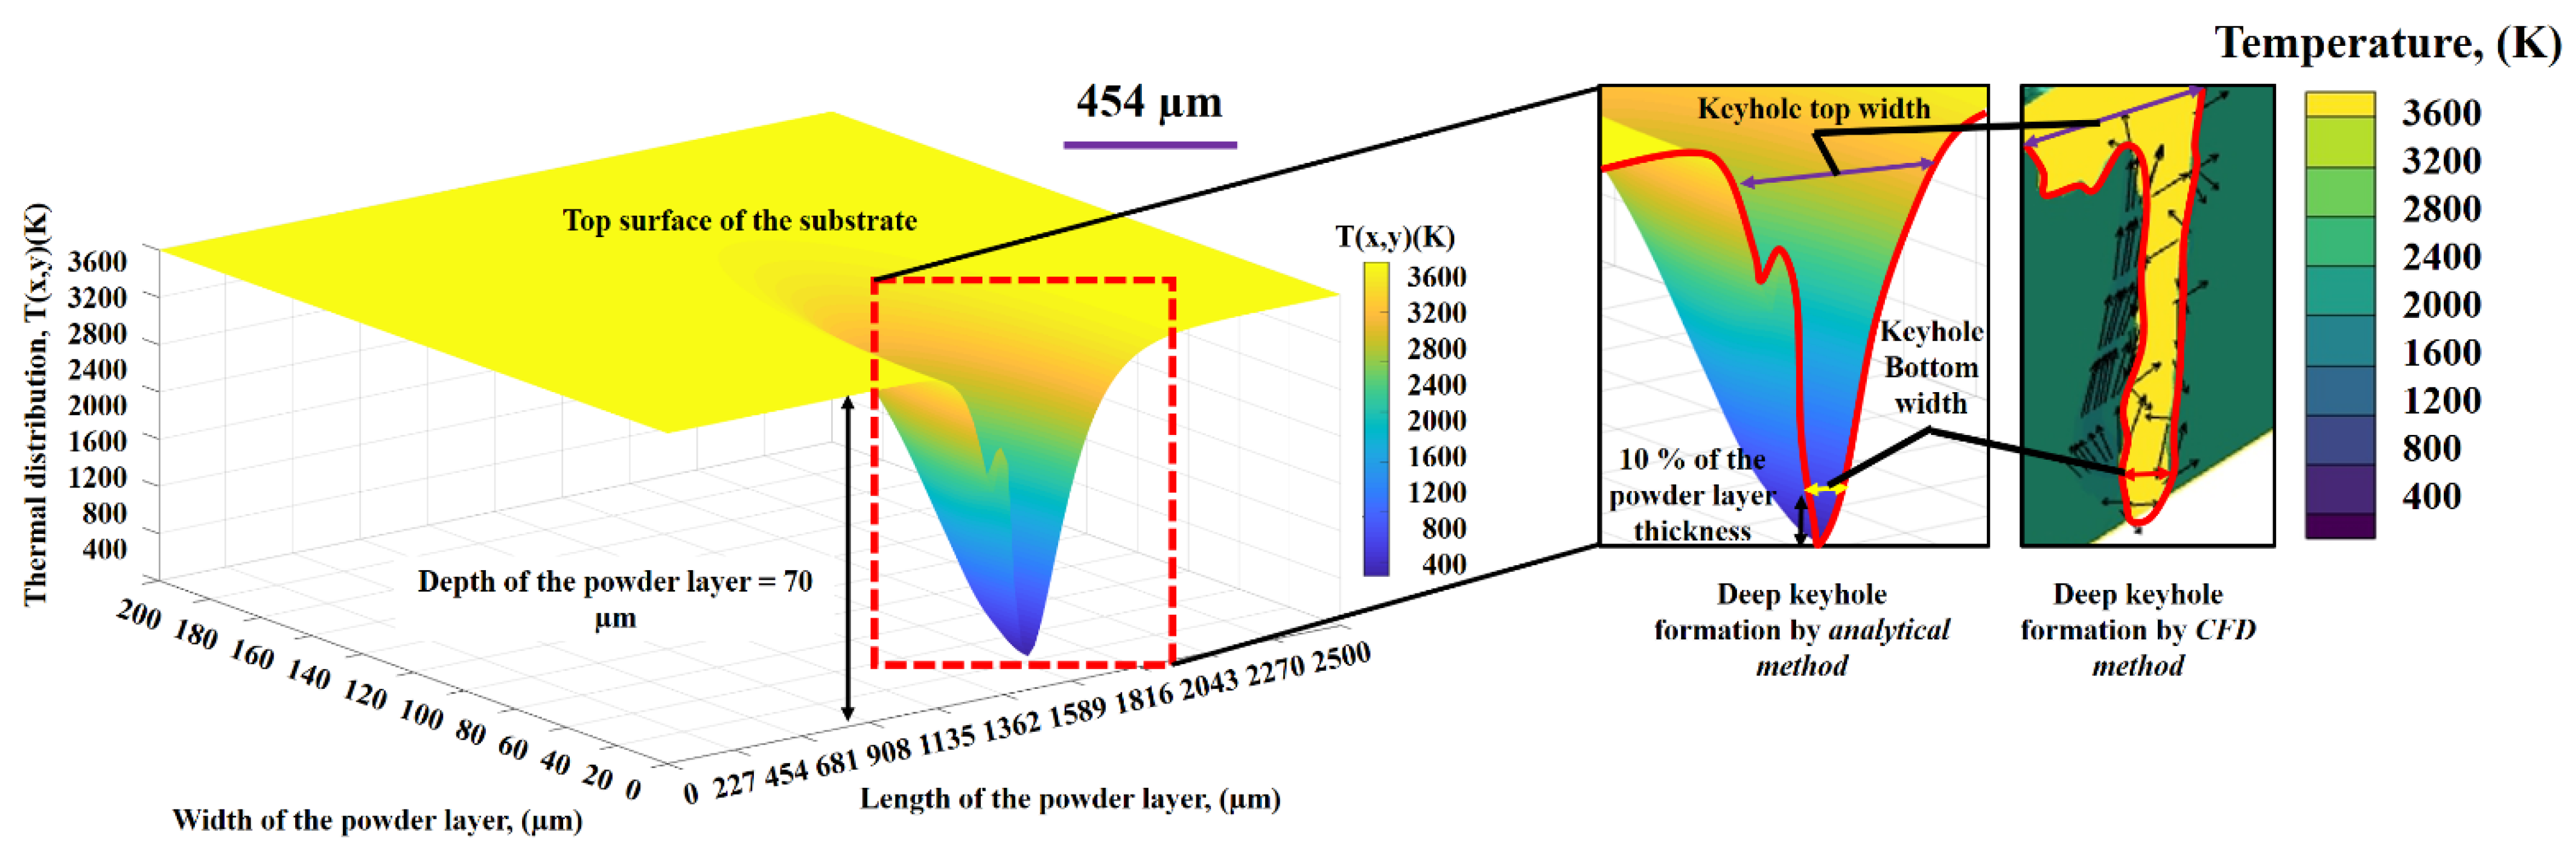
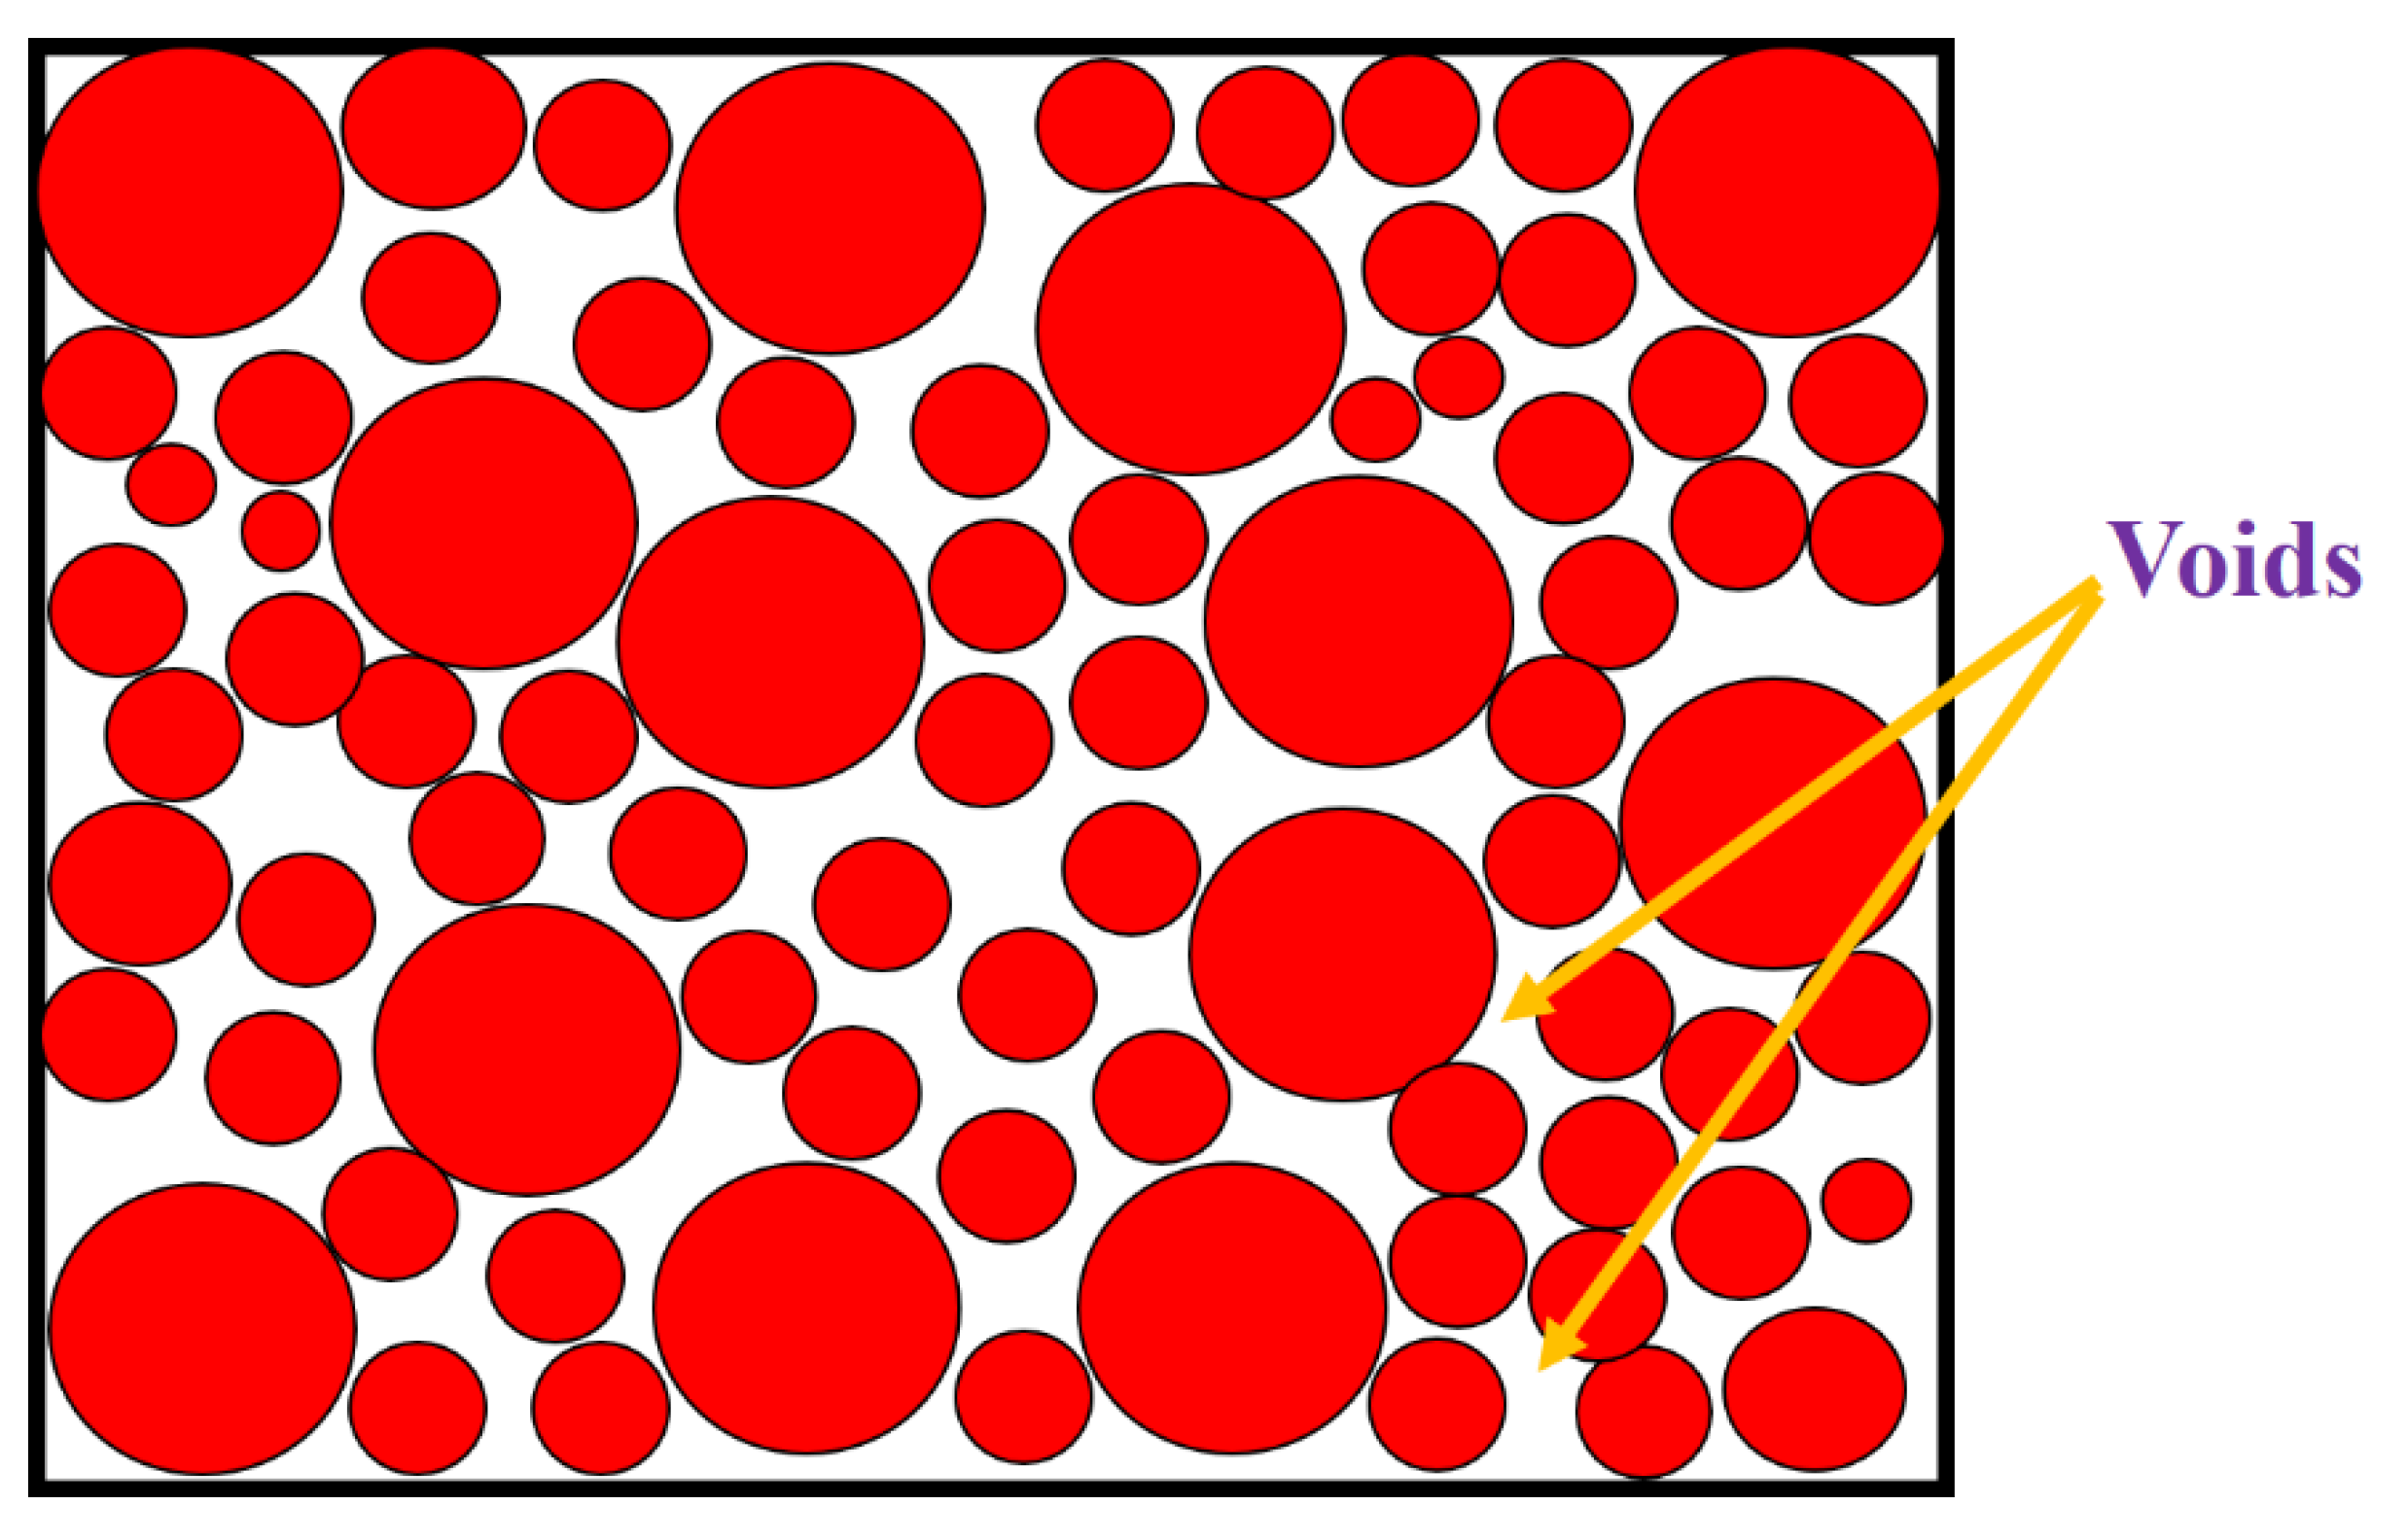
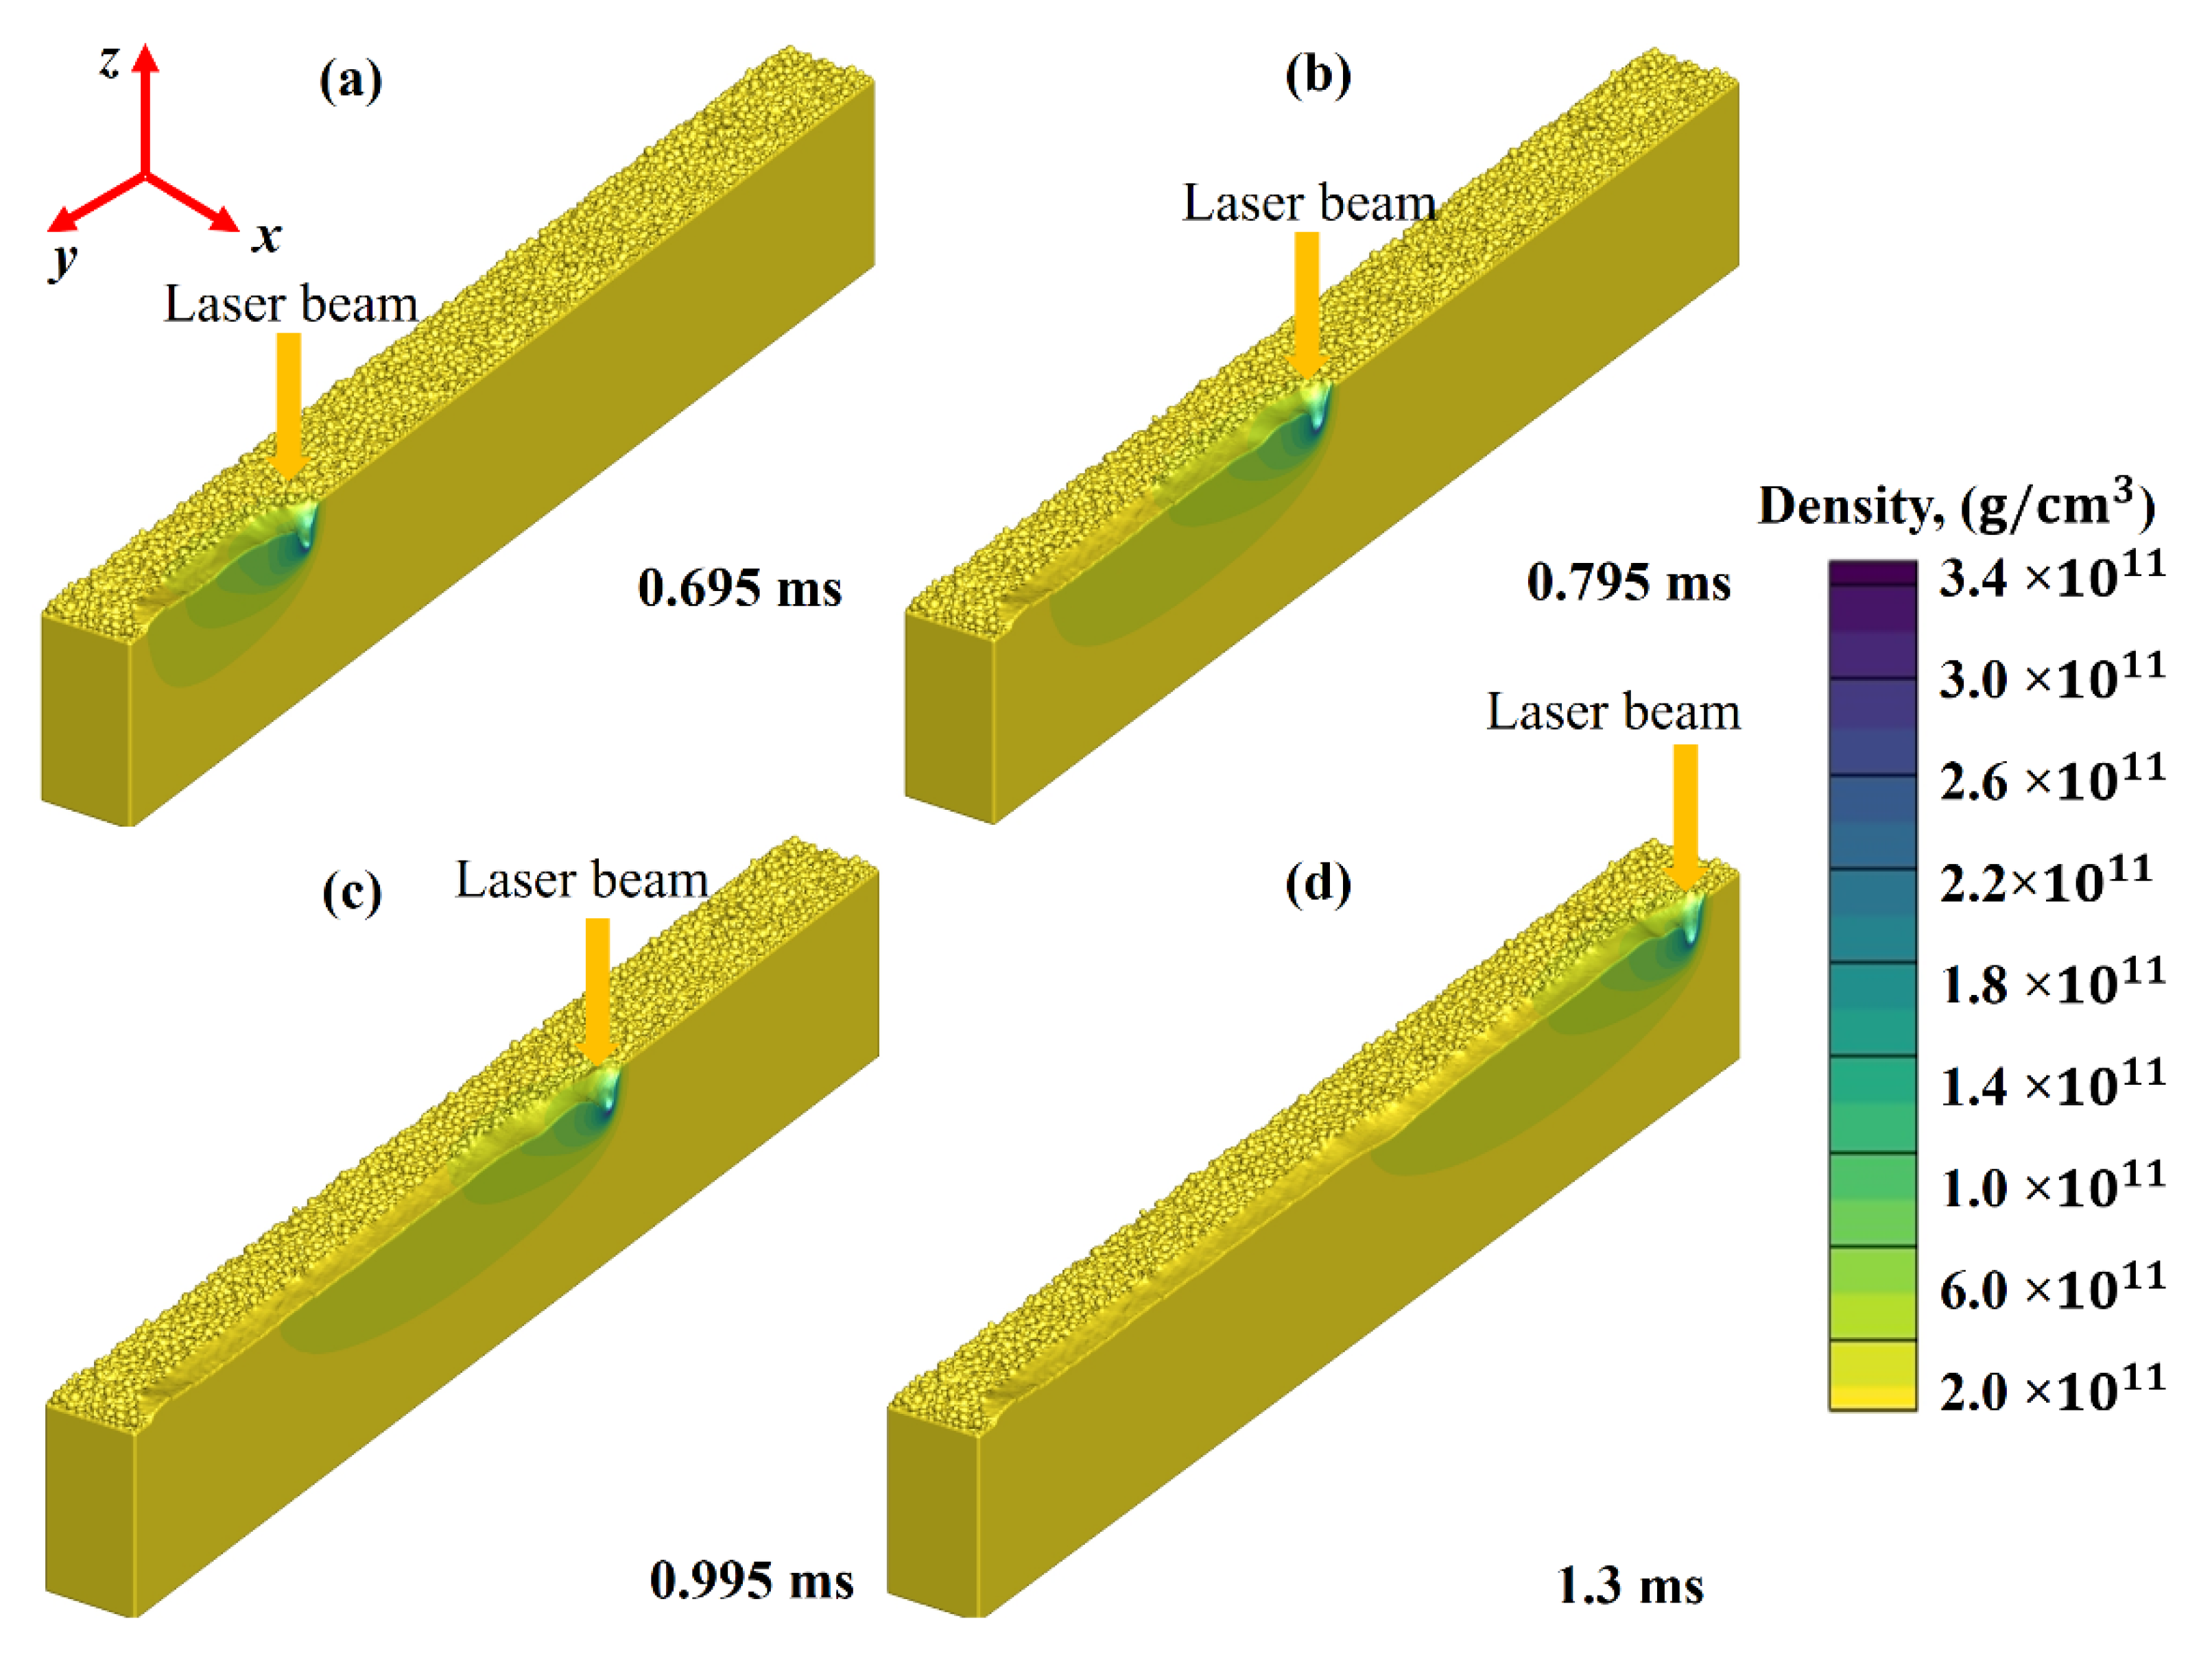
- Two types of laser keyholes can be generated during the LPBF process: shallow and deep keyholes. The mode type can be controlled and defined to an extent by the energy density. Increasing the energy density leads to an increase in the amount of energy delivered to a given region, and optical rays encounter numerous reflections due to voids available in the deposited powder layer. In return, this increases the laser beam absorption coefficient. As a result, the shallow keyhole converts into a deep keyhole.
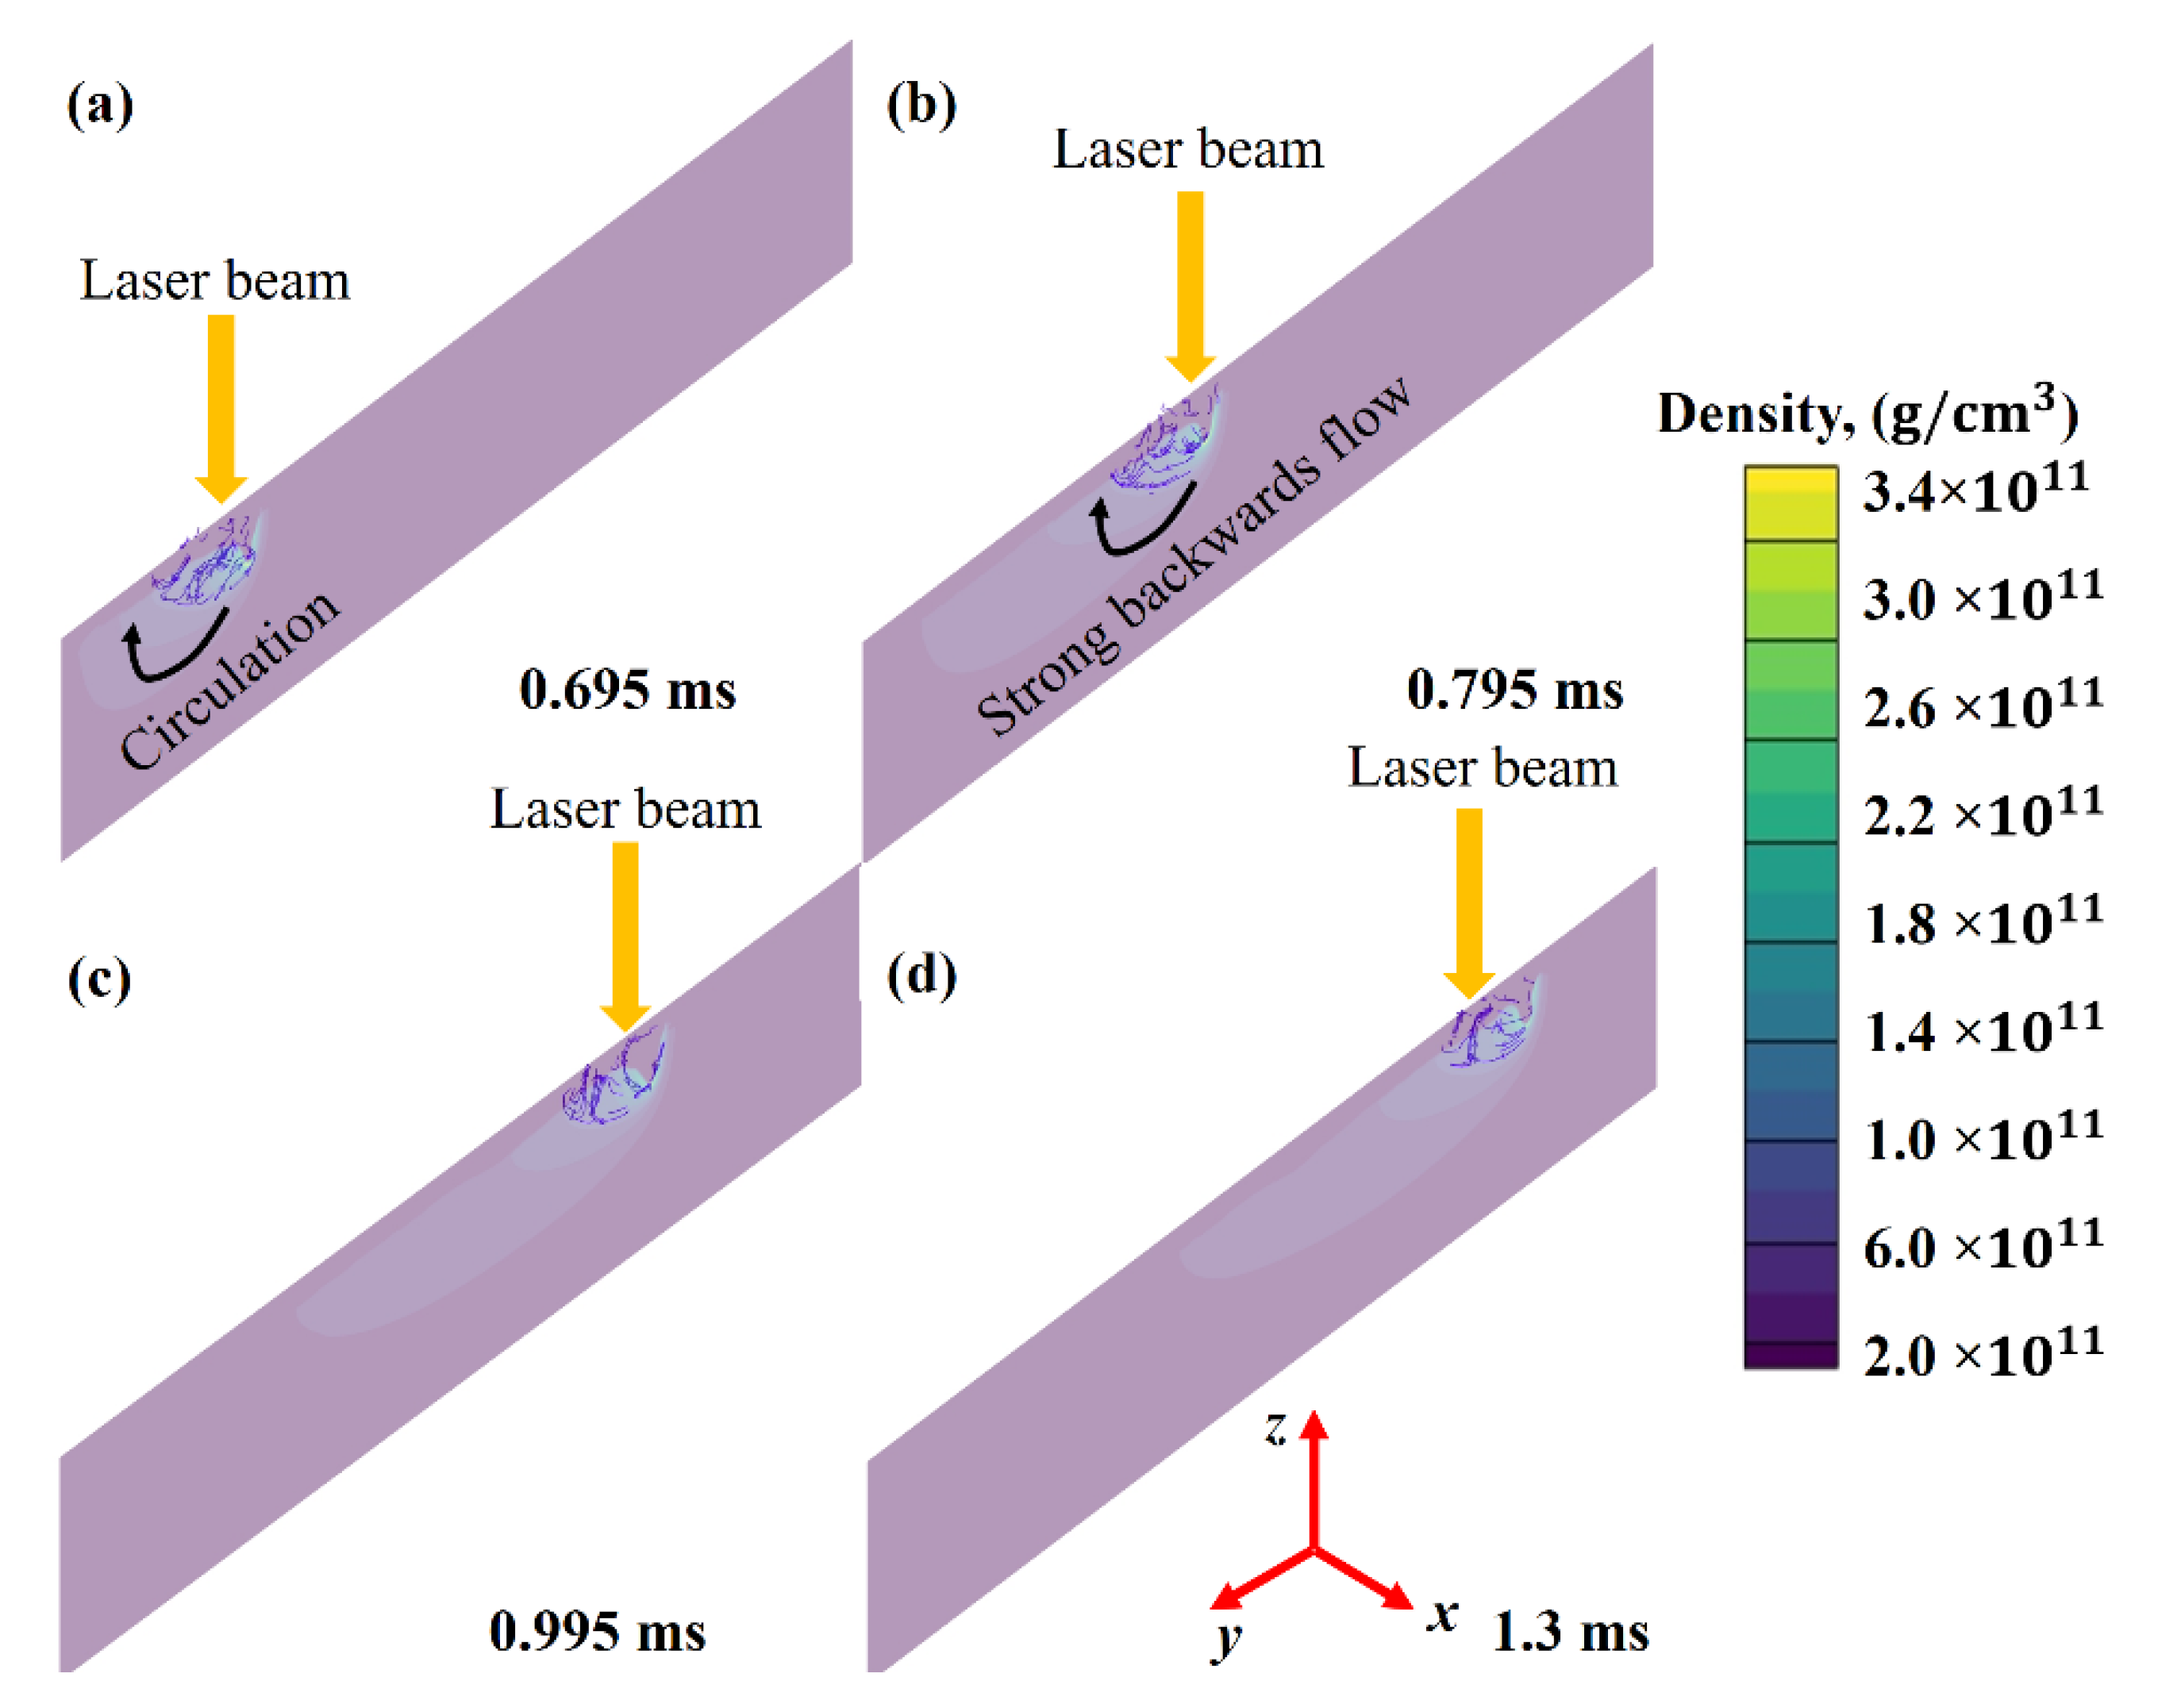
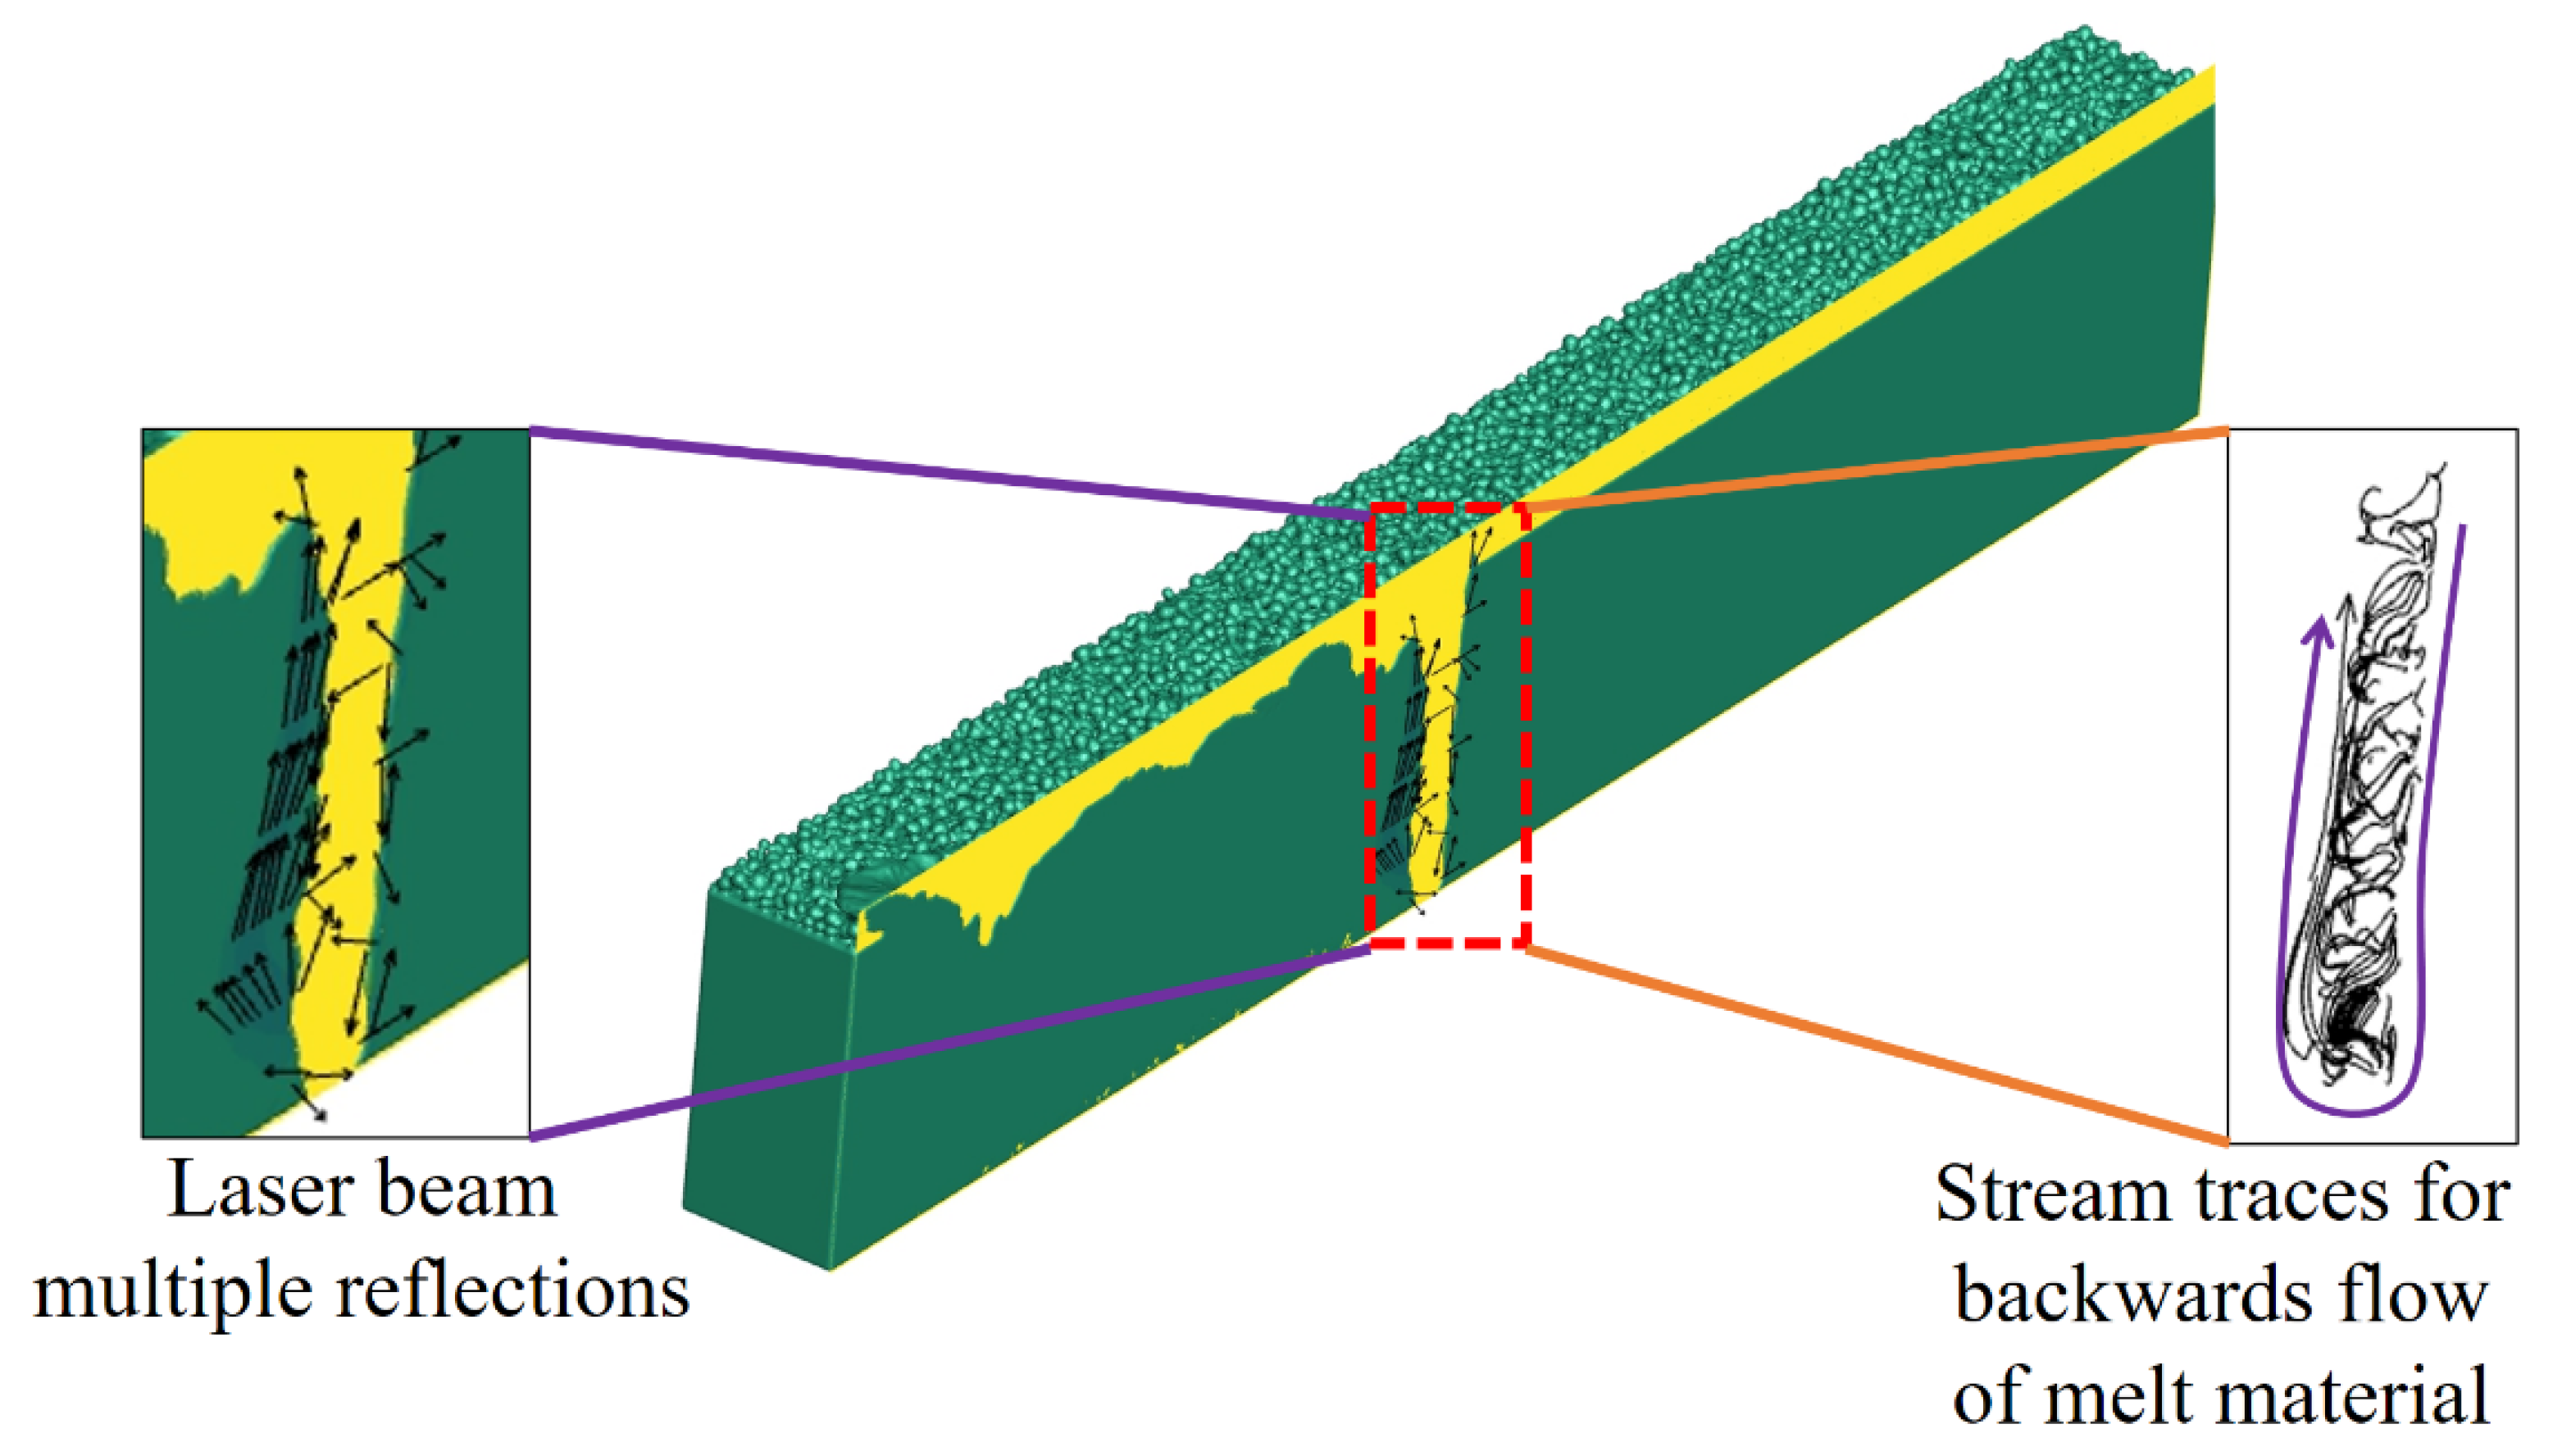
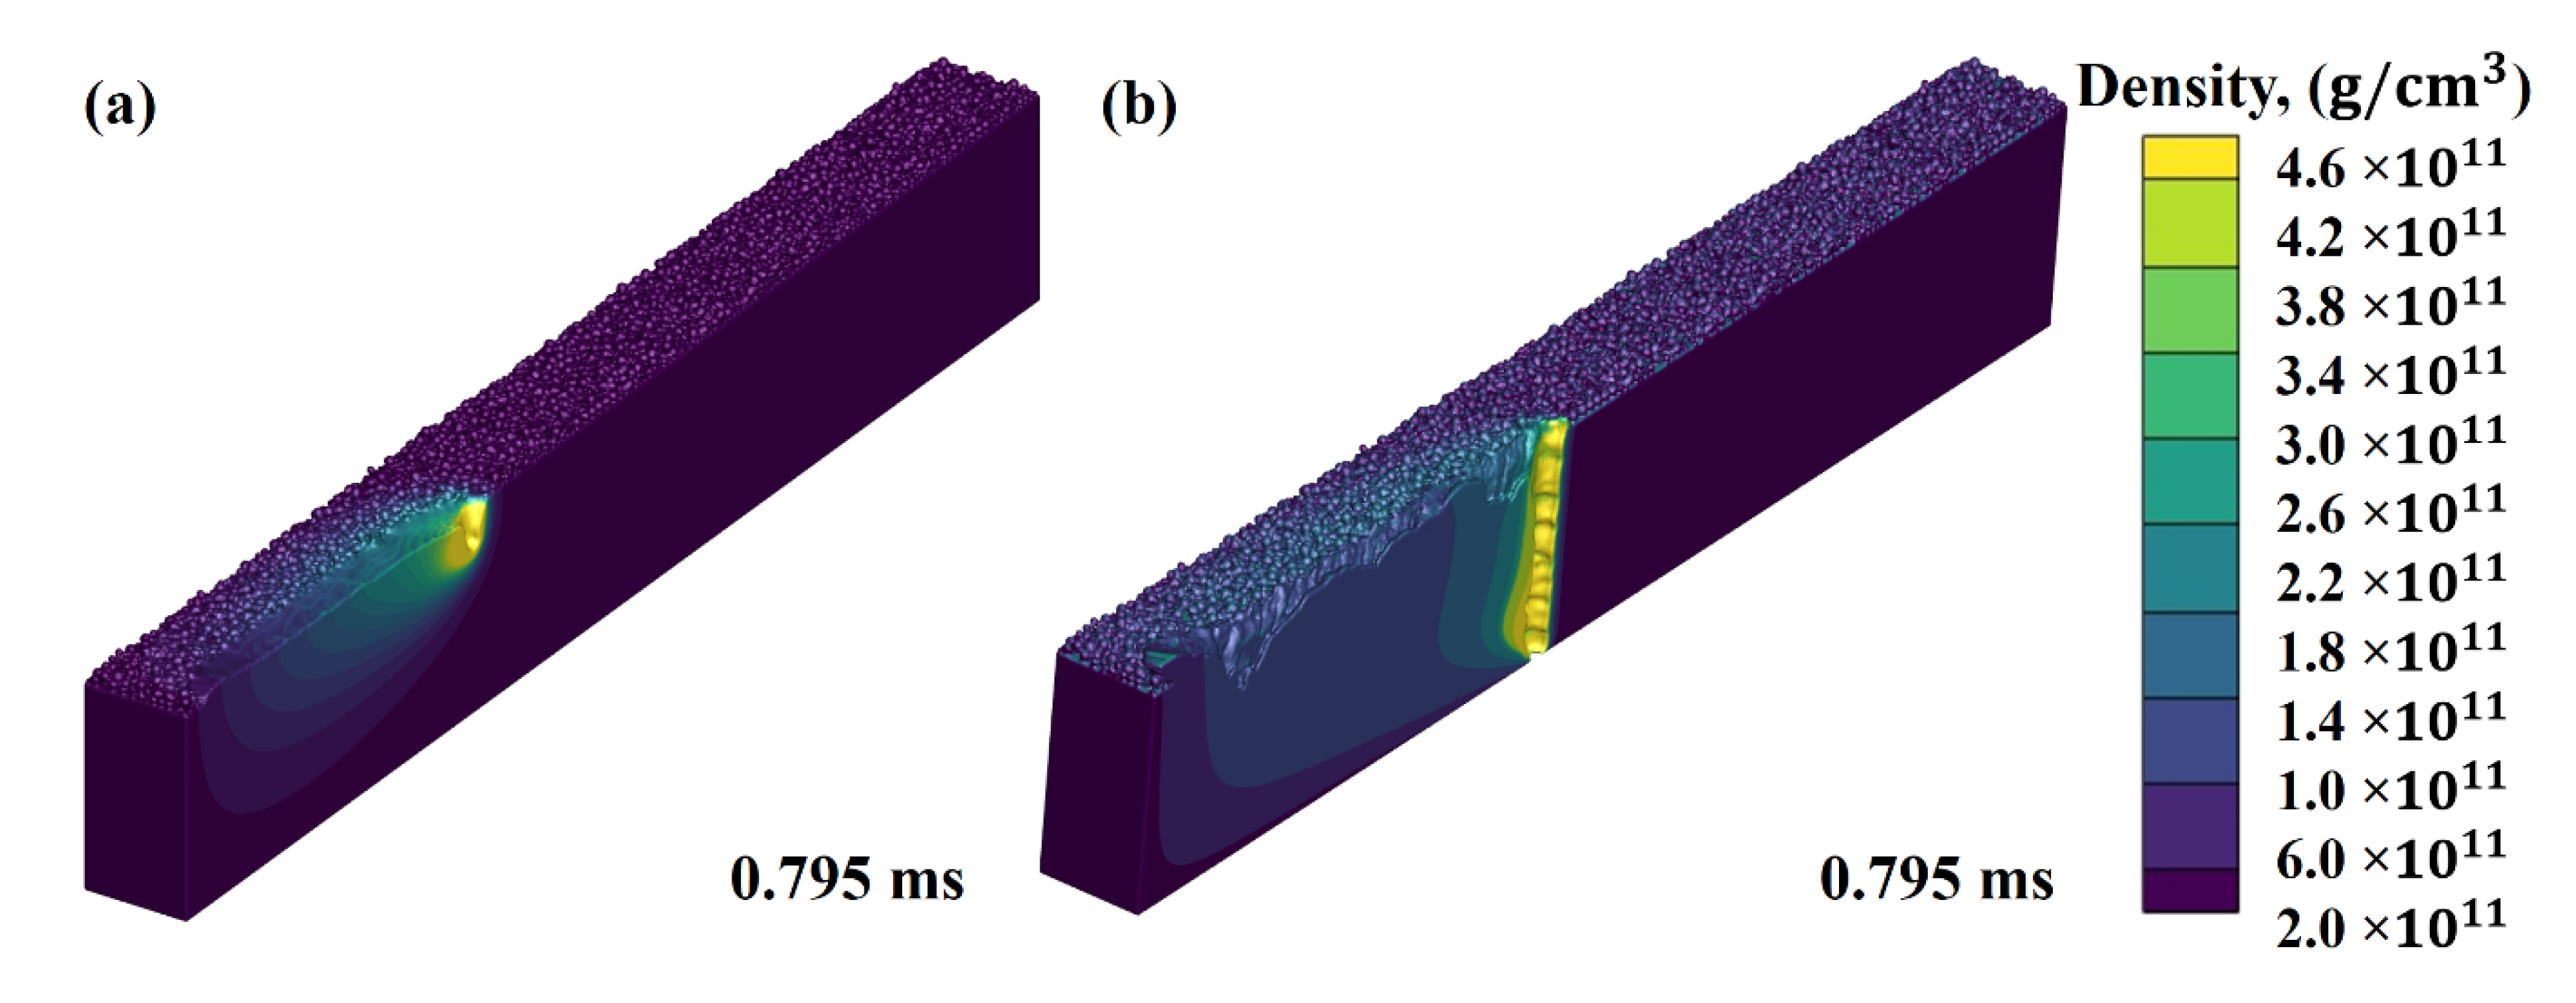
- The deep keyhole usually generates numerous laser beam reflections and stream traces. A deep keyhole experiences a larger energy density compared with a shallow keyhole, pushing the material towards vaporization. The porosity usually occurs if the solid front hits quickly before they escape from the melt pool. Due to an elevated temperature distribution in the deep keyhole, the probability of pores forming is much higher than in a shallow keyhole, as the liquid material is close to the vaporization zone. However, both shallow and deep keyholes exhibited a clockwise direction.
- Due to the specific heat and fusion latent heat, the results demonstrated that, as the temperature increases, the material density decreases rapidly, elevating the fluid volume. This, in return, reduces the surface tension (ST), and is also known as Benard–Marangoni convection or thermocapillary convection. The ST difference largely determines the size of the melt pool. When a liquid’s ST difference widens, a significant pull arises from the high ST end toward the low ST end.
Author Contributions
Funding
Institutional Review Board Statement
Informed Consent Statement
Data Availability Statement
Acknowledgments
Conflicts of Interest
References
- Kok, Y.; Tan, X.P.; Wang, P.; Nai, M.L.S.; Loh, N.H.; Liu, E.; Tor, S.B. Anisotropy and heterogeneity of microstructure and mechanical properties in metal additive manufacturing: A critical review. Mater. Des. 2018, 139, 565–586. [Google Scholar] [CrossRef]
- Ansari, P.; Salamci, M.U. On the selective laser melting based additive manufacturing of AlSi10Mg: The process parameter investigation through multiphysics simulation and experimental validation. J. Alloys Compd. 2022, 890, 161873. [Google Scholar] [CrossRef]
- Guo, N.; Leu, M.C. Additive manufacturing: Technology, applications and research needs. Front. Mech. Eng. 2013, 8, 215–243. [Google Scholar] [CrossRef]
- Mohsin Raza, M.; Lo, Y.L. Experimental investigation into microstructure, mechanical properties, and cracking mechanism of IN713LC processed by laser powder bed fusion. Mater. Sci. Eng. A 2021, 819, 141527. [Google Scholar] [CrossRef]
- Dezfoli, A.R.A.; Lo, Y.L.; Raza, M.M. Prediction of Epitaxial Grain Growth in Single-Track Laser Melting of IN718 Using Integrated Finite Element and Cellular Automaton Approach. Materials 2021, 14, 5202. [Google Scholar] [CrossRef]
- Tiwari, S.K.; Pande, S.; Agrawal, S.; Bobade, S.M. Selection of selective laser sintering materials for different applications. Rapid Prototyp. J. 2015, 21, 630–648. [Google Scholar] [CrossRef]
- Liu, F.H. Synthesis of bioceramic scaffolds for bone tissue engineering by rapid prototyping technique. J. Sol-Gel Sci. Technol. 2012, 64, 704–710. [Google Scholar] [CrossRef]
- Ur Rehman, A.; Sglavo, V.M. 3D printing of geopolymer-based concrete for building applications. Rapid Prototyp. J. 2020, 26, 1783–1788. [Google Scholar] [CrossRef]
- Ur Rehman, A.; Sglavo, V.M. 3D printing of Portland cement-containing bodies. Rapid Prototyp. J. 2021. ahead of print. [Google Scholar] [CrossRef]
- Popovich, A.; Sufiiarov, V. Metal Powder Additive Manufacturing. In New Trends in 3D Printing; InTech: Rijeka, Croatia, 2016. [Google Scholar]
- Jia, T.; Zhang, Y.; Chen, J.K.; He, Y.L. Dynamic simulation of granular packing of fine cohesive particles with different size distributions. Powder Technol. 2012, 218, 76–85. [Google Scholar] [CrossRef]
- Ansari, P.; Ur Rehman, A.; Pitir, F.; Veziroglu, S.; Mishra, Y.K.; Aktas, O.C.; Salamci, M.U. Selective Laser Melting of 316L Austenitic Stainless Steel: Detailed Process Understanding Using Multiphysics Simulation and Experimentation. Metals 2021, 11, 1076. [Google Scholar] [CrossRef]
- Ur Rehman, A.; Tingting, L.; Liao, W. 4D Printing; Printing Ceramics from Metals with Selective Oxidation. Patent No. W0/2019/052128, 21 March 2019. [Google Scholar]
- Ullah, A.; Wu, H.; Ur Rehman, A.; Zhu, Y.; Liu, T.; Zhang, K. Influence of laser parameters and Ti content on the surface morphology of L-PBF fabricated Titania. Rapid Prototyp. J. 2021, 27, 71–80. [Google Scholar] [CrossRef]
- Ur Rehman, A. Additive Manufacturing of Ceramic Materials and Combinations with New Laser Strategies. Master’s Thesis, Nanjing University of Science and Technology, Nanjing, China, 2017. [Google Scholar]
- Wong, K.V.; Hernandez, A. A Review of Additive Manufacturing. ISRN Mech. Eng. 2012, 2012, 1–10. [Google Scholar] [CrossRef] [Green Version]
- Körner, C. Additive manufacturing of metallic components by selective electron beam melting—A review. Int. Mater. Rev. 2016, 61, 361–377. [Google Scholar] [CrossRef] [Green Version]
- Fayazfar, H.; Salarian, M.; Rogalsky, A.; Sarker, D.; Russo, P.; Paserin, V.; Toyserkani, E. A critical review of powder-based additive manufacturing of ferrous alloys: Process parameters, microstructure and mechanical properties. Mater. Des. 2018, 144, 98–128. [Google Scholar] [CrossRef]
- Everton, S.K.; Hirsch, M.; Stavroulakis, P.I.; Leach, R.K.; Clare, A.T. Review of in-situ process monitoring and in-situ metrology for metal additive manufacturing. Mater. Des. 2016, 95, 431–445. [Google Scholar] [CrossRef]
- Sing, S.L.; An, J.; Yeong, W.Y.; Wiria, F.E. Laser and electron-beam powder-bed additive manufacturing of metallic implants: A review on processes, materials and designs. J. Orthop. Res. 2016, 34, 369–385. [Google Scholar] [CrossRef] [PubMed]
- Olakanmi, E.O.; Cochrane, R.F.; Dalgarno, K.W. A review on selective laser sintering/melting (SLS/SLM) of aluminium alloy powders: Processing, microstructure, and properties. Prog. Mater. Sci. 2015, 74, 401–477. [Google Scholar] [CrossRef]
- Mahmood, M.A.; Popescu, A.C.; Hapenciuc, C.L.; Ristoscu, C.; Visan, A.I.; Oane, M.; Mihailescu, I.N. Estimation of clad geometry and corresponding residual stress distribution in laser melting deposition: Analytical modeling and experimental correlations. Int. J. Adv. Manuf. Technol. 2020, 111, 77–91. [Google Scholar] [CrossRef]
- Mahmood, M.A.; Popescu, A.C.; Oane, M.; Ristoscu, C.; Chioibasu, D.; Mihai, S.; Mihailescu, I.N. Three-jet powder flow and laser–powder interaction in laser melting deposition: Modelling versus experimental correlations. Metals 2020, 10, 1113. [Google Scholar] [CrossRef]
- King, W.; Anderson, A.T.; Ferencz, R.M.; Hodge, N.E.; Kamath, C.; Khairallah, S.A. Overview of modelling and simulation of metal powder bed fusion process at Lawrence Livermore National Laboratory. Mater. Sci. Technol. 2015, 31, 957–968. [Google Scholar] [CrossRef]
- Gong, H.; Rafi, K.; Gu, H.; Starr, T.; Stucker, B. Analysis of defect generation in Ti-6Al-4V parts made using powder bed fusion additive manufacturing processes. Addit. Manuf. 2014, 1, 87–98. [Google Scholar] [CrossRef]
- Frazier, W.E. Metal additive manufacturing: A review. J. Mater. Eng. Perform. 2014, 23, 1917–1928. [Google Scholar] [CrossRef]
- Panwisawas, C.; Qiu, C.L.; Sovani, Y.; Brooks, J.W.; Attallah, M.M.; Basoalto, H.C. On the role of thermal fluid dynamics into the evolution of porosity during selective laser melting. Scr. Mater. 2015, 105, 14–17. [Google Scholar] [CrossRef]
- Yan, W.; Ge, W.; Qian, Y.; Lin, S.; Zhou, B.; Liu, W.K.; Lin, F.; Wagner, G.J. Multi-physics modeling of single/multiple-track defect mechanisms in electron beam selective melting. Acta Mater. 2017, 134, 324–333. [Google Scholar] [CrossRef]
- Qian, Y.; Yan, W.; Lin, F. Parametric study and surface morphology analysis of electron beam selective melting. Rapid Prototyp. J. 2018, 24, 1586–1598. [Google Scholar] [CrossRef]
- Panwisawas, C.; Perumal, B.; Ward, R.M.; Turner, N.; Turner, R.P.; Brooks, J.W.; Basoalto, H.C. Keyhole formation and thermal fluid flow-induced porosity during laser fusion welding in titanium alloys: Experimental and modelling. Acta Mater. 2017, 126, 251–263. [Google Scholar] [CrossRef] [Green Version]
- King, W.E.; Barth, H.D.; Castillo, V.M.; Gallegos, G.F.; Gibbs, J.W.; Hahn, D.E.; Kamath, C.; Rubenchik, A.M. Observation of keyhole-mode laser melting in laser powder-bed fusion additive manufacturing. J. Mater. Process. Technol. 2014, 214, 2915–2925. [Google Scholar] [CrossRef]
- Panwisawas, C.; Sovani, Y.; Turner, R.P.; Brooks, J.W.; Basoalto, H.C.; Choquet, I. Modelling of thermal fluid dynamics for fusion welding. J. Mater. Process. Technol. 2018, 252, 176–182. [Google Scholar] [CrossRef]
- Martin, A.A.; Calta, N.P.; Hammons, J.A.; Khairallah, S.A.; Nielsen, M.H.; Shuttlesworth, R.M.; Sinclair, N.; Matthews, M.J.; Jeffries, J.R.; Willey, T.M.; et al. Ultrafast dynamics of laser-metal interactions in additive manufacturing alloys captured by in situ X-ray imaging. Mater. Today Adv. 2019, 1, 100002. [Google Scholar] [CrossRef]
- Cunningham, R.; Zhao, C.; Parab, N.; Kantzos, C.; Pauza, J.; Fezzaa, K.; Sun, T.; Rollett, A.D. Keyhole threshold and morphology in laser melting revealed by ultrahigh-speed x-ray imaging. Science 2019, 363, 849–852. [Google Scholar] [CrossRef] [PubMed]
- Tang, C.; Tan, J.L.; Wong, C.H. A numerical investigation on the physical mechanisms of single track defects in selective laser melting. Int. J. Heat Mass Transf. 2018, 126, 957–968. [Google Scholar] [CrossRef]
- Mirkoohi, E.; Ning, J.; Bocchini, P.; Fergani, O.; Chiang, K.-N.; Liang, S. Thermal Modeling of Temperature Distribution in Metal Additive Manufacturing Considering Effects of Build Layers, Latent Heat, and Temperature-Sensitivity of Material Properties. J. Manuf. Mater. Process. 2018, 2, 63. [Google Scholar] [CrossRef] [Green Version]
- Oane, M.; Sporea, D. Temperature profiles modeling in IR optical components during high power laser irradiation. Infrared Phys. Technol. 2001, 42, 31–40. [Google Scholar] [CrossRef]
- Cleary, P.W.; Sawley, M.L. DEM modelling of industrial granular flows: 3D case studies and the effect of particle shape on hopper discharge. Appl. Math. Model. 2002, 26, 89–111. [Google Scholar] [CrossRef]
- Parteli, E.J.R.; Pöschel, T. Particle-based simulation of powder application in additive manufacturing. Powder Technol. 2016, 288, 96–102. [Google Scholar] [CrossRef]
- Cao, L. Numerical simulation of the impact of laying powder on selective laser melting single-pass formation. Int. J. Heat Mass Transf. 2019, 141, 1036–1048. [Google Scholar] [CrossRef]
- Tian, Y.; Yang, L.; Zhao, D.; Huang, Y.; Pan, J. Numerical analysis of powder bed generation and single track forming for selective laser melting of SS316L stainless steel. J. Manuf. Process. 2020, 58, 964–974. [Google Scholar] [CrossRef]
- Lee, Y.S.; Zhang, W. Modeling of heat transfer, fluid flow and solidification microstructure of nickel-base superalloy fabricated by laser powder bed fusion. Addit. Manuf. 2016, 12, 178–188. [Google Scholar] [CrossRef] [Green Version]
- Tang, M.; Pistorius, P.C.; Beuth, J.L. Prediction of lack-of-fusion porosity for powder bed fusion. Addit. Manuf. 2017, 14, 39–48. [Google Scholar] [CrossRef]
- Promoppatum, P.; Yao, S.C.; Pistorius, P.C.; Rollett, A.D. A Comprehensive Comparison of the Analytical and Numerical Prediction of the Thermal History and Solidification Microstructure of Inconel 718 Products Made by Laser Powder-Bed Fusion. Engineering 2017, 3, 685–694. [Google Scholar] [CrossRef]
- Rosenthal, D. Mathematical Theory of Heat Distribution During Welding and Cutting. Weld. J. 1941, 20, 220–234. [Google Scholar]
- Chen, Q.; Zhao, Y.Y.; Strayer, S.; Zhao, Y.Y.; Aoyagi, K.; Koizumi, Y.; Chiba, A.; Xiong, W.; To, A.C. Elucidating the Effect of Preheating Temperature on Melt Pool Morphology Variation in Inconel 718 Laser Powder Bed Fusion via Simulation and Experiment. Available online: https://www.sciencedirect.com/science/article/pii/S2214860420310149#bb8 (accessed on 30 April 2021).
- Ur Rehman, A.; Pitir, F.; Salamci, M.U. Laser Powder Bed Fusion (LPBF) of In718 and the Impact of Pre-Heating at 500 and 1000 °C: Operando Study. Materials 2021, 14, 6683. [Google Scholar] [CrossRef] [PubMed]
- Ur Rehman, A.; Pitir, F.; Salamci, M.U. Full-Field Mapping and Flow Quantification of Melt Pool Dynamics in Laser Powder Bed Fusion of SS316L. Materials 2021, 14, 6264. [Google Scholar] [CrossRef] [PubMed]
- Gong, H.; Gu, H.; Zeng, K.; Dilip, J.J.S.; Pal, D.; Stucker, B.; Christiansen, D.; Beuth, J.; Lewandowski, J.J. Melt Pool Characterization for Selective Laser Melting of Ti-6Al-4V Pre-alloyed Powder. In Proceedings of the International Solid Freeform Fabrication Symposium, Austin, TX, USA, 10–12 August 2014; 2014; pp. 256–267. [Google Scholar]
- Song, B.; Dong, S.; Liao, H.; Coddet, C. Process parameter selection for selective laser melting of Ti6Al4V based on temperature distribution simulation and experimental sintering. Int. J. Adv. Manuf. Technol. 2012, 61, 967–974. [Google Scholar] [CrossRef]
- Guo, Q.; Zhao, C.; Qu, M.; Xiong, L.; Hojjatzadeh, S.M.H.; Escano, L.I.; Parab, N.D.; Fezzaa, K.; Sun, T.; Chen, L. In-situ full-field mapping of melt flow dynamics in laser metal additive manufacturing. Addit. Manuf. 2020, 31, 100939. [Google Scholar] [CrossRef]
- Messler, J.R.W. Principles of Welding: Processes, Physics, Chemistry, and Metallurgy; John Wiley & Sons: New York, NY, USA, 2008; ISBN 9783527617494. [Google Scholar]
- Khairallah, S.A.; Anderson, A.T.; Rubenchik, A.M.; King, W.E. Laser powder-bed fusion additive manufacturing: Physics of complex melt flow and formation mechanisms of pores, spatter, and denudation zones. Acta Mater. 2016, 108, 36–45. [Google Scholar] [CrossRef] [Green Version]
- Ur Rehman, A.; Mahmood, M.A.; Pitir, F.; Salamci, M.U.; Popescu, A.C.; Mihailescu, I.N. Mesoscopic Computational Fluid Dynamics Modelling for the Laser-Melting Deposition of AISI 304 Stainless Steel Single Tracks with Experimental Correlation: A Novel Study. Metals 2021, 11, 1569. [Google Scholar] [CrossRef]
- Paul, A.; Debroy, T. Free surface flow and heat transfer in conduction mode laser welding. Metall. Trans. B 1988, 19, 851–858. [Google Scholar] [CrossRef]
- Aucott, L.; Dong, H.; Mirihanage, W.; Atwood, R.; Kidess, A.; Gao, S.; Wen, S.; Marsden, J.; Feng, S.; Tong, M.; et al. Revealing internal flow behaviour in arc welding and additive manufacturing of metals. Nat. Commun. 2018, 9, 5414. [Google Scholar] [CrossRef] [Green Version]
- Abderrazak, K.; Bannour, S.; Mhiri, H.; Lepalec, G.; Autric, M. Numerical and experimental study of molten pool formation during continuous laser welding of AZ91 magnesium alloy. Comput. Mater. Sci. 2009, 44, 858–866. [Google Scholar] [CrossRef]
- Bayat, M.; Thanki, A.; Mohanty, S.; Witvrouw, A.; Yang, S.; Thorborg, J.; Tiedje, N.S.; Hattel, J.H. Keyhole-induced porosities in Laser-based Powder Bed Fusion (L-PBF) of Ti6Al4V: High-fidelity modelling and experimental validation. Addit. Manuf. 2019, 30, 100835. [Google Scholar] [CrossRef]


| Parameters | Values (Units) |
|---|---|
| Solidus temperature | 1878 (K) |
| Liquidus temperature | 1928 (K) |
| Boiling temperature | 3533 (K) |
| Latent heat of fusion | 286 (kJ/Kg) |
| Latent heat of evaporation | 9830 (kJ/Kg) |
| Viscosity | 0.005 (Kg/ms |
| Surface tension | 1.68 (N/m) |
| Surface tension gradient | −0.00026 (N/mK) |
| Parameter | Value | Parameter | Value |
|---|---|---|---|
| Substrate length × width × depth | 2500 µm × 200 µm × 400 µm | Average size of cell for CFD simulations | 3.3 µm |
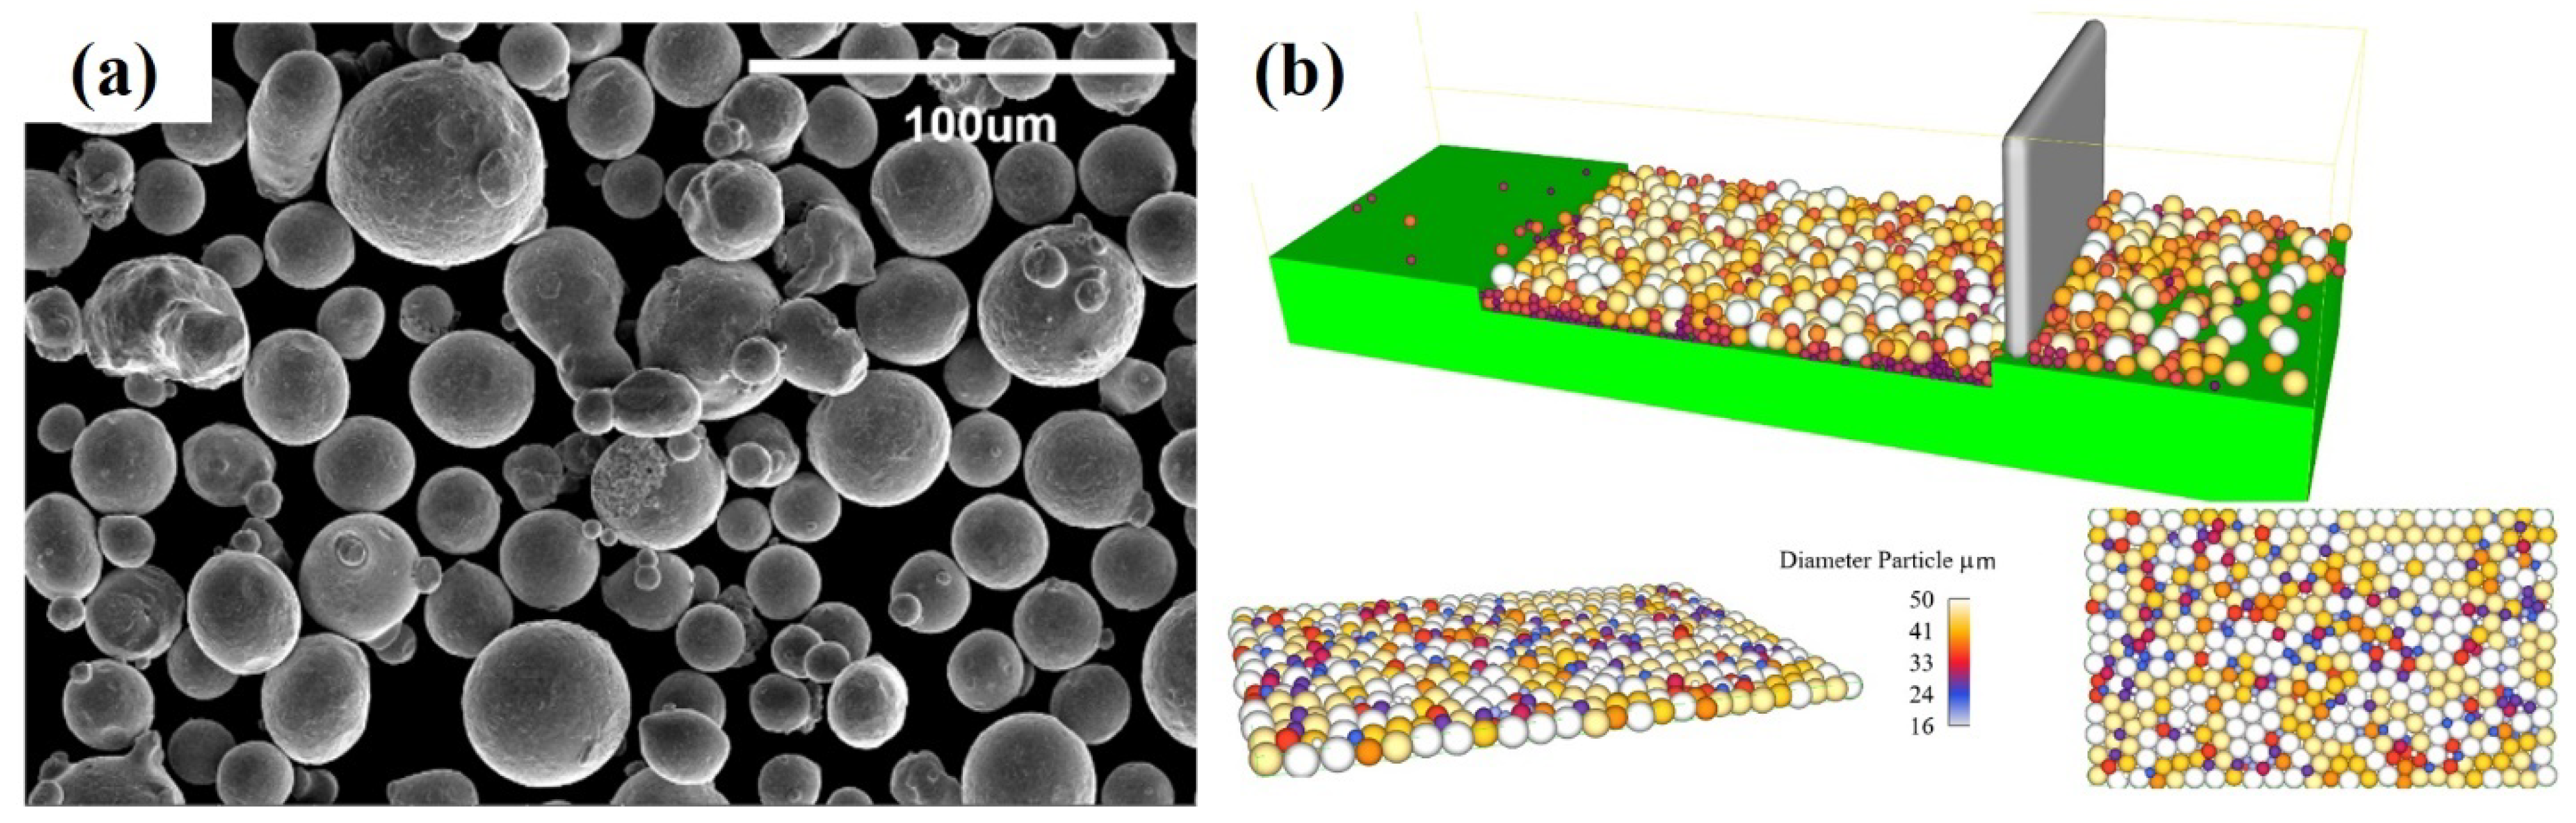
| Powder layer thickness | 70 µm | Ti6Al4V particle size distribution | D10 = 19 µm, D50 = 30 µm and D90 = 46 µm |
| Laser power | 195 W | Laser beam entire absorption coefficient | 0.25 |
| Laser scanning speed | 400 mm/s, 1000 mm/s | Number of cells generated for CFD simulation | 6,288,368 |
| Effective laser beam radius where the heat flux is 1/e2 of its maximum value | 25 µm |
Publisher’s Note: MDPI stays neutral with regard to jurisdictional claims in published maps and institutional affiliations. |
© 2021 by the authors. Licensee MDPI, Basel, Switzerland. This article is an open access article distributed under the terms and conditions of the Creative Commons Attribution (CC BY) license (https://creativecommons.org/licenses/by/4.0/).
Share and Cite
Ur Rehman, A.; Mahmood, M.A.; Pitir, F.; Salamci, M.U.; Popescu, A.C.; Mihailescu, I.N. Keyhole Formation by Laser Drilling in Laser Powder Bed Fusion of Ti6Al4V Biomedical Alloy: Mesoscopic Computational Fluid Dynamics Simulation versus Mathematical Modelling Using Empirical Validation. Nanomaterials 2021, 11, 3284. https://doi.org/10.3390/nano11123284
Ur Rehman A, Mahmood MA, Pitir F, Salamci MU, Popescu AC, Mihailescu IN. Keyhole Formation by Laser Drilling in Laser Powder Bed Fusion of Ti6Al4V Biomedical Alloy: Mesoscopic Computational Fluid Dynamics Simulation versus Mathematical Modelling Using Empirical Validation. Nanomaterials. 2021; 11(12):3284. https://doi.org/10.3390/nano11123284
Chicago/Turabian StyleUr Rehman, Asif, Muhammad Arif Mahmood, Fatih Pitir, Metin Uymaz Salamci, Andrei C. Popescu, and Ion N. Mihailescu. 2021. "Keyhole Formation by Laser Drilling in Laser Powder Bed Fusion of Ti6Al4V Biomedical Alloy: Mesoscopic Computational Fluid Dynamics Simulation versus Mathematical Modelling Using Empirical Validation" Nanomaterials 11, no. 12: 3284. https://doi.org/10.3390/nano11123284
APA StyleUr Rehman, A., Mahmood, M. A., Pitir, F., Salamci, M. U., Popescu, A. C., & Mihailescu, I. N. (2021). Keyhole Formation by Laser Drilling in Laser Powder Bed Fusion of Ti6Al4V Biomedical Alloy: Mesoscopic Computational Fluid Dynamics Simulation versus Mathematical Modelling Using Empirical Validation. Nanomaterials, 11(12), 3284. https://doi.org/10.3390/nano11123284