
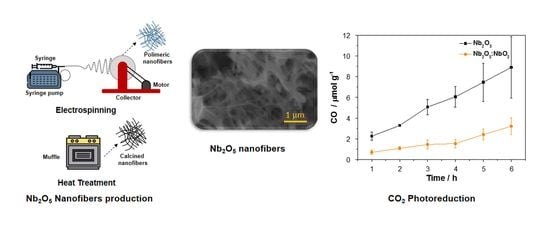
Preparation and Application of Nb2O5 Nanofibers in CO2 Photoconversion

 ,
,  , , and
Abstract
1. Introduction
2. Materials and Methods
2.1. Synthesis of NbO Fibers
2.2. Characterization
2.3. Immobilization of NbO Ceramic Fibers
2.4. Evaluation of CO Gaseous Photoconversion
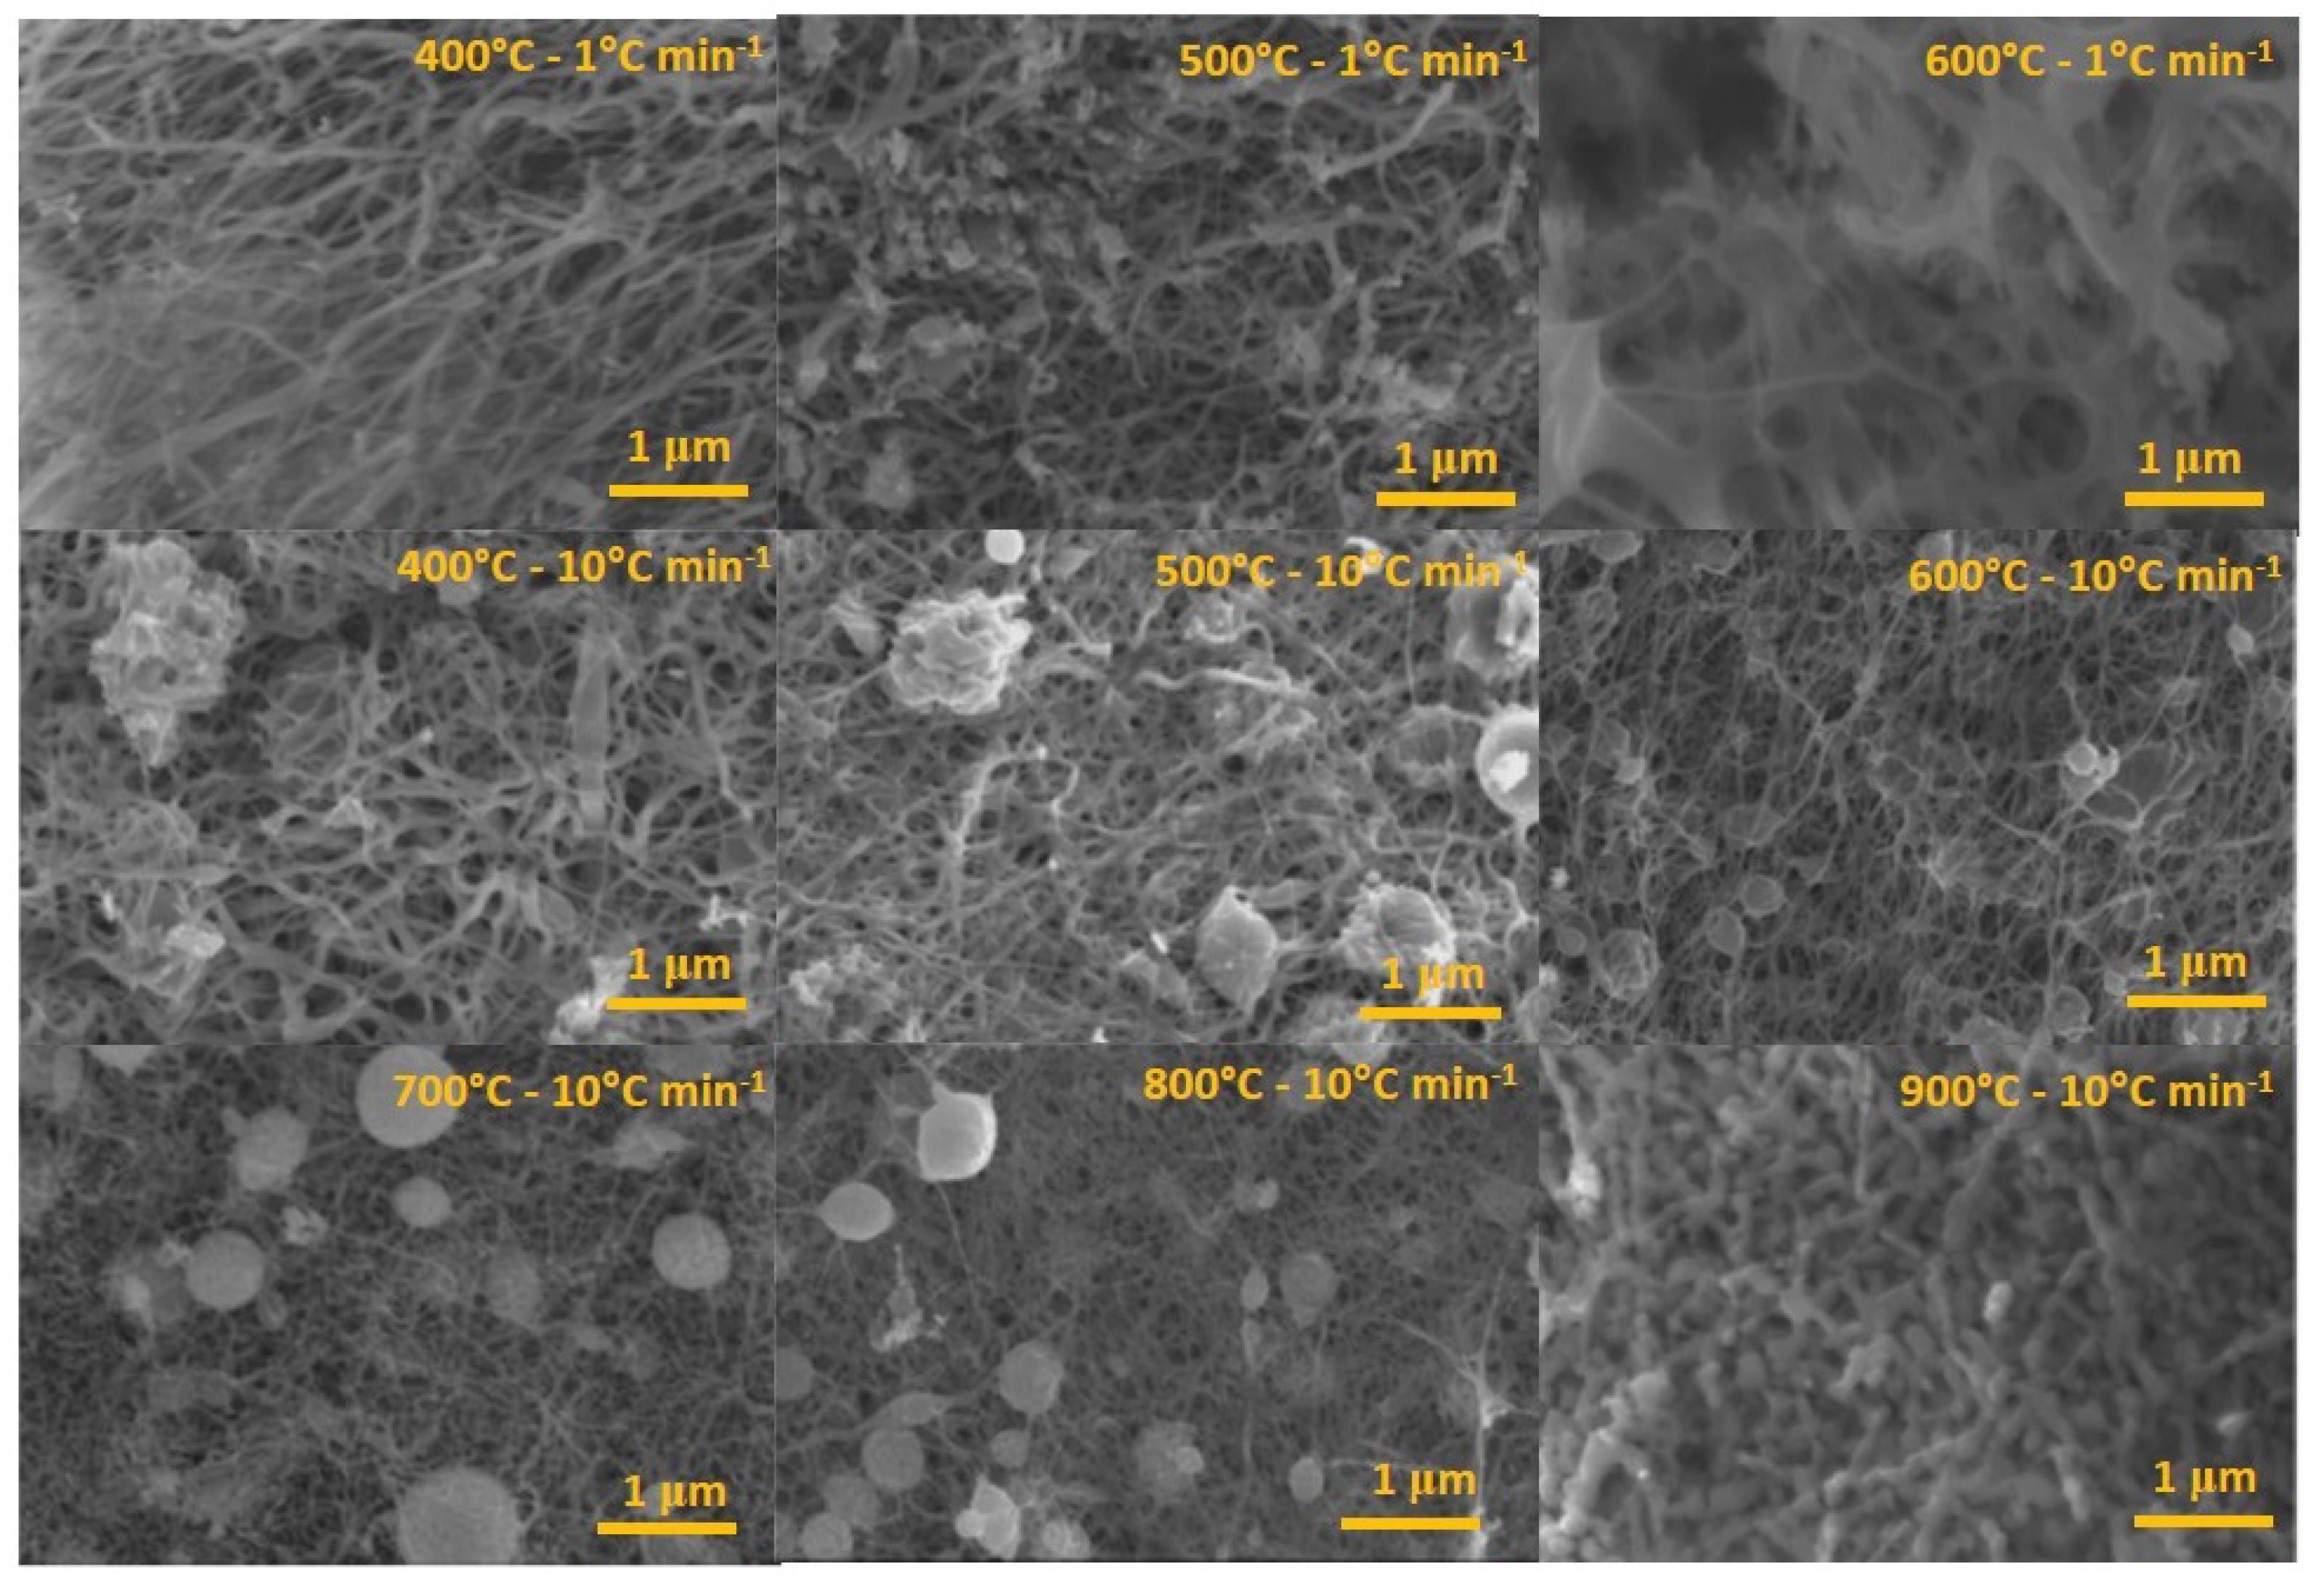
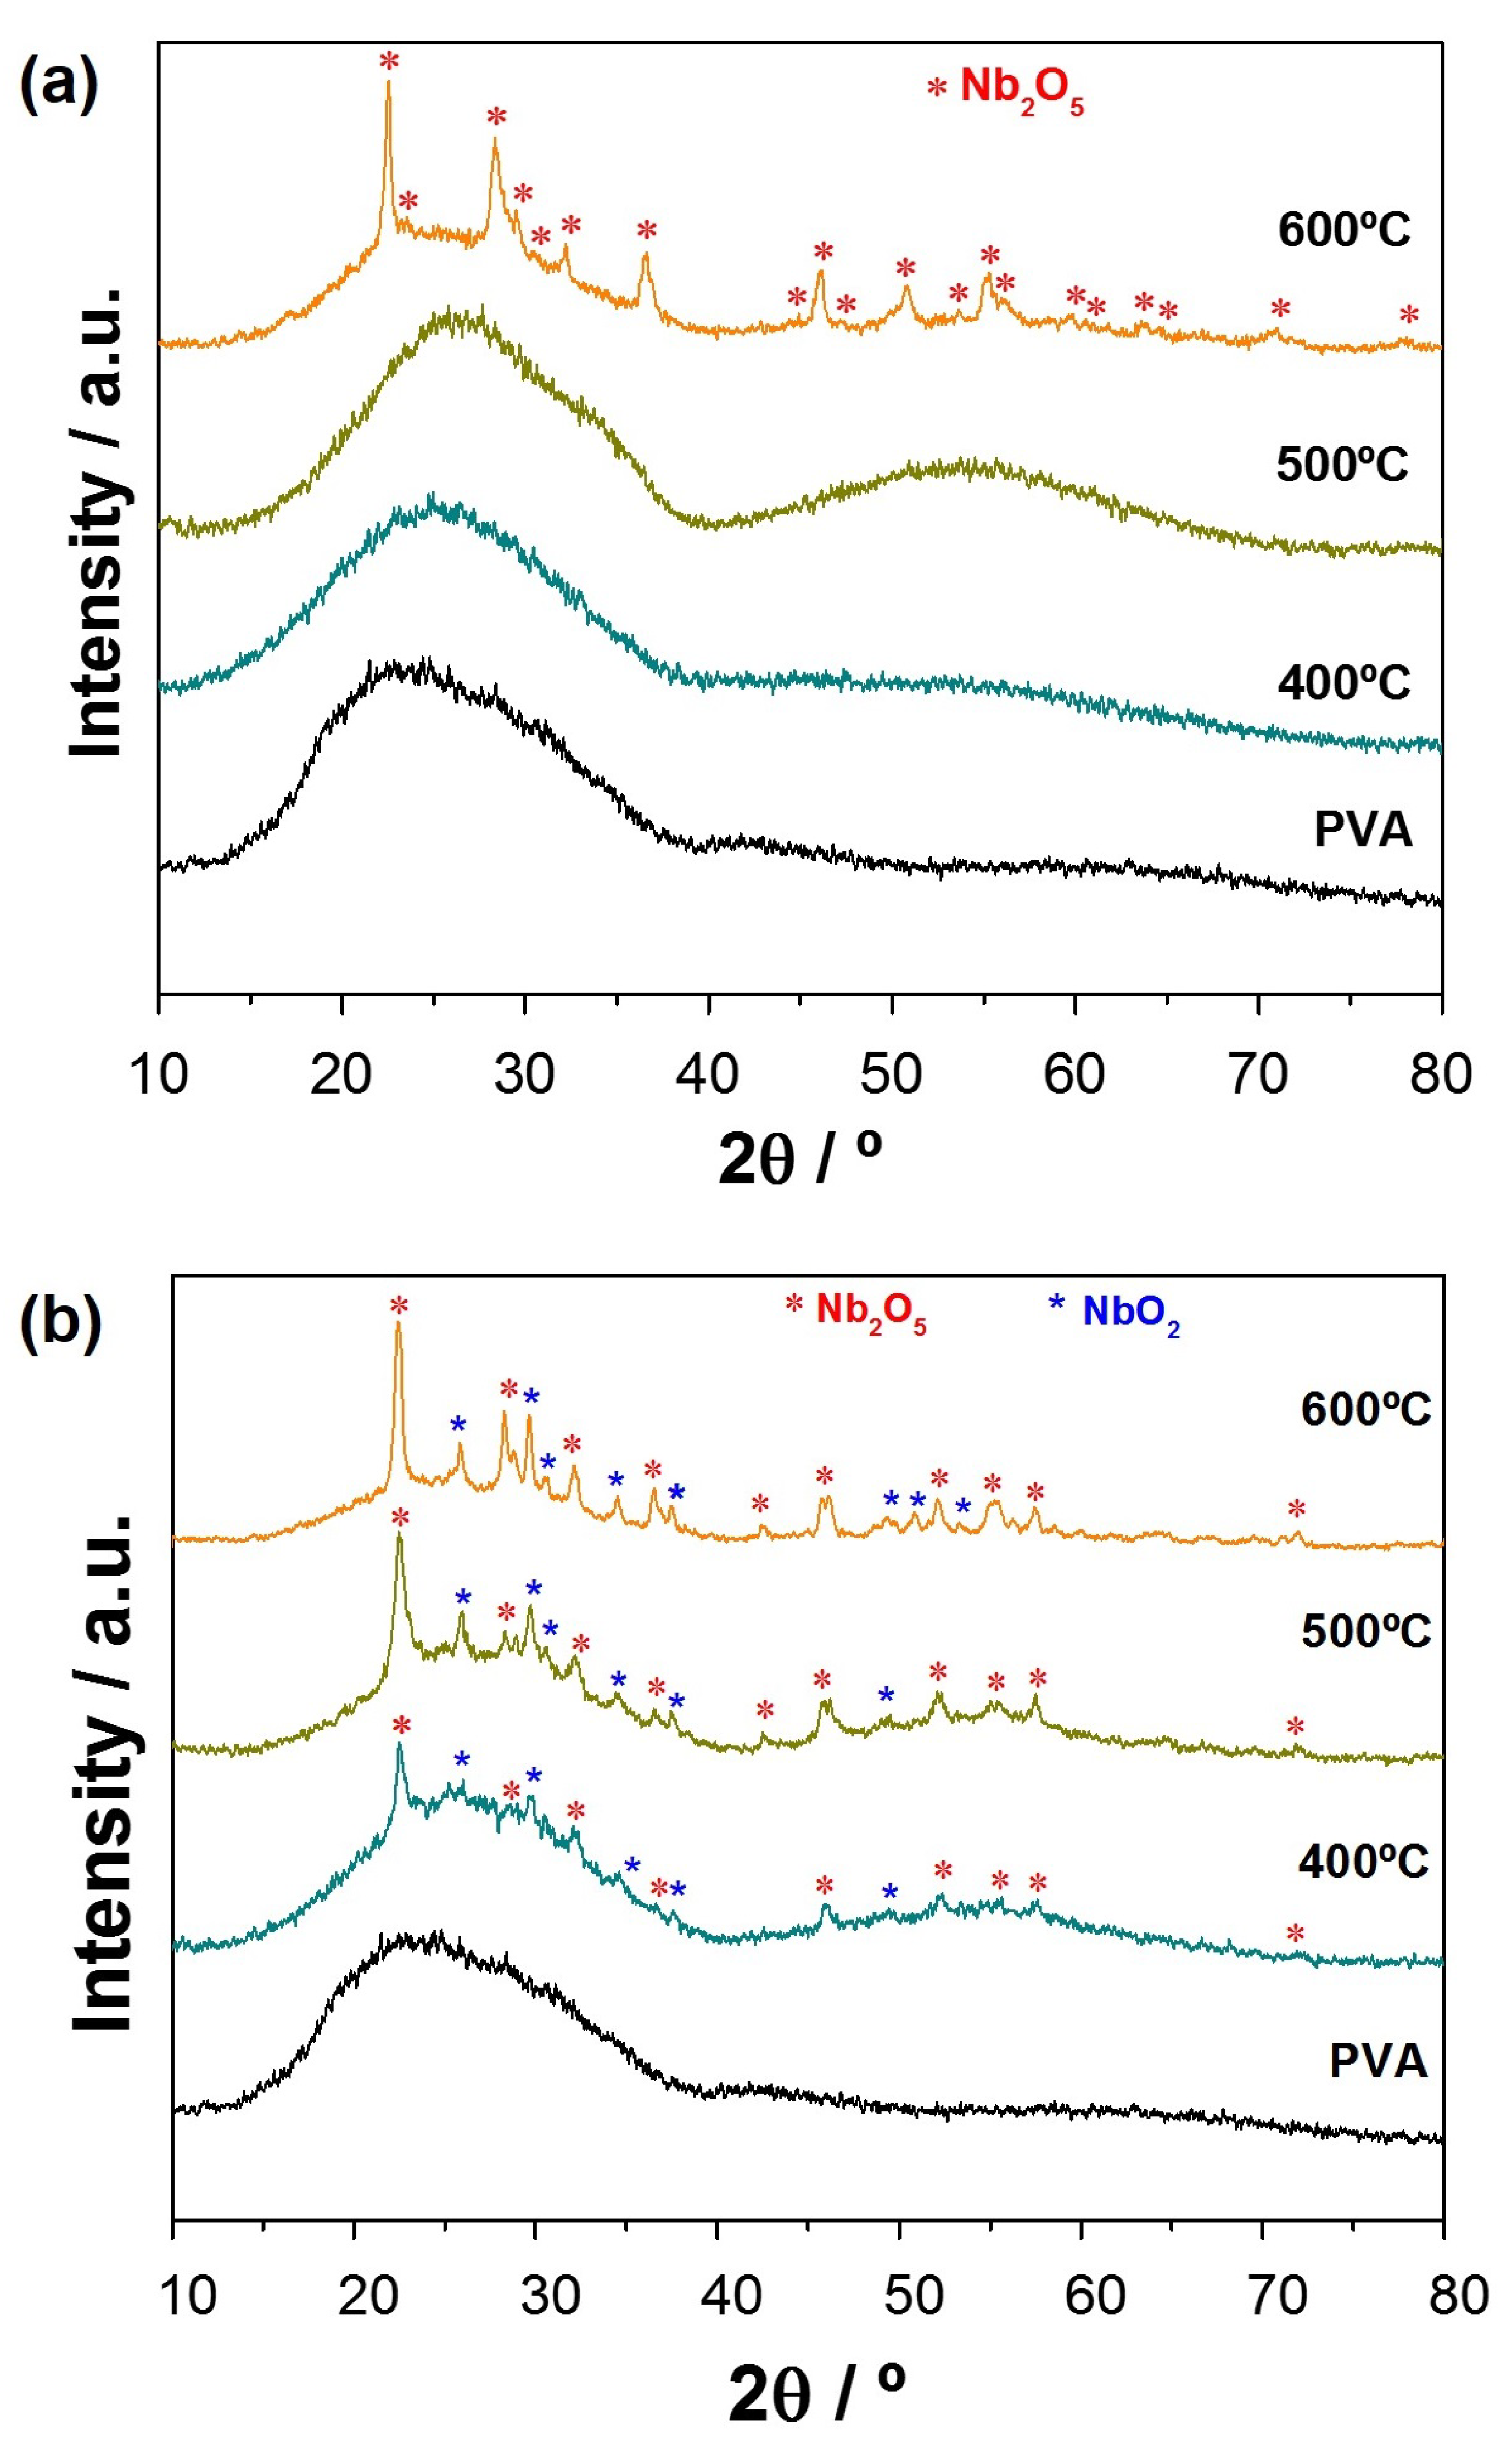
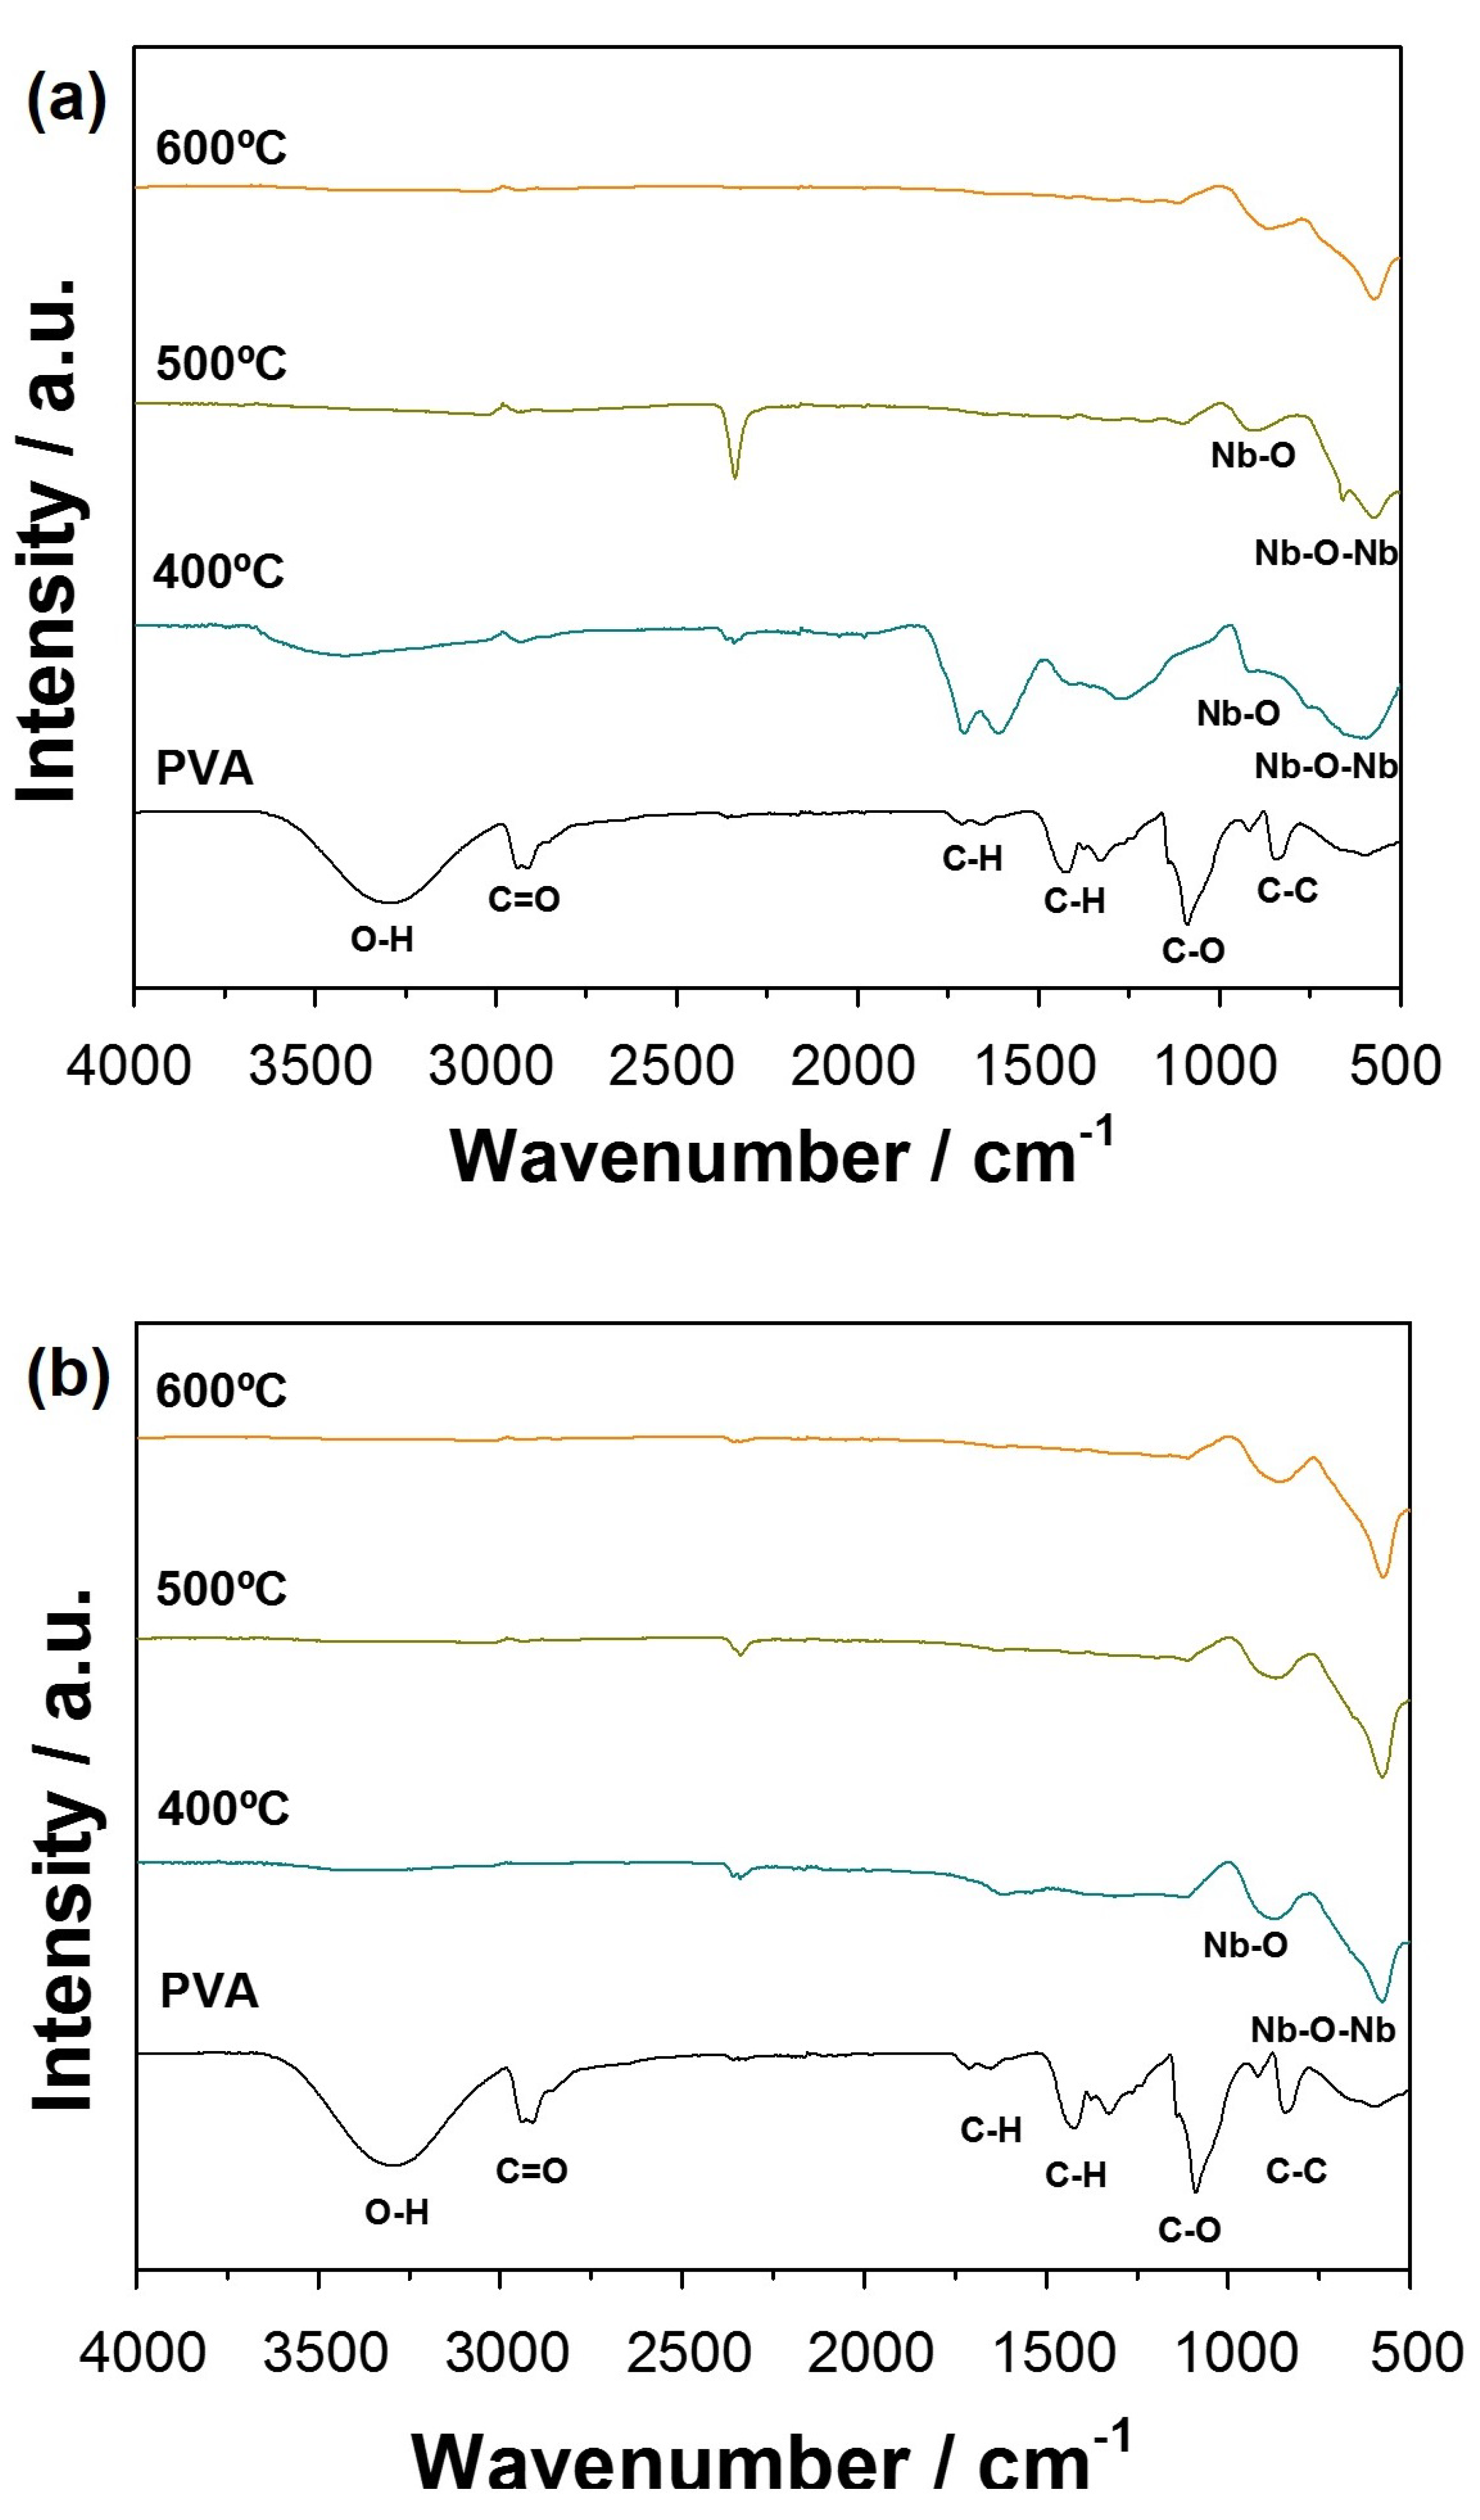
3. Results
3.1. Optimization of the NbO Ceramic Fibers
3.2. Photocatalytic Conversion of CO
4. Conclusions
Supplementary Materials
Author Contributions
Funding
Institutional Review Board Statement
Informed Consent Statement
Data Availability Statement
Conflicts of Interest
References
- Malafatti, J.O.D.; Moreira, A.J.; Sciena, C.R.; Silva, T.E.M.; Freschic, G.P.G.; Pereira, E.C.; Paris, E.C. Prozac® removal promoted by HAP:Nb2O5 nanoparticles system: By products, mechanism, and cytotoxicity assessment. J. Environ. Chem. Eng. 2020, 9. [Google Scholar] [CrossRef]
- Paris, E.C.; Malafatti, J.O.D.; Sciena, C.R.; Junior, L.F.N.; Zenatti, A.; Escote, M.T.; Moreira, A.J.; Freschi, G.P.G. Nb2O5 nanoparticles decorated with magnetic ferrites for wastewater photocatalytic remediation. Environ. Sci. Pollut. Res. 2020, 28, 23731–23741. [Google Scholar] [CrossRef] [PubMed]
- Izadpanah Ostad, M.; Niknam Shahrak, M.; Galli, F. Photocatalytic carbon dioxide reduction to methanol catalyzed by ZnO, Pt, Au, and Cu nanoparticles decorated zeolitic imidazolate framework-8. J. CO2 Util. 2021, 43, 101373. [Google Scholar] [CrossRef]
- Budzianowski, W.M.; Postawa, K. Renewable energy from biogas with reduced carbon dioxide footprint: Implications of applying different plant configurations and operating pressures. Renew. Sustain. Energy Rev. 2017, 68, 852–868. [Google Scholar] [CrossRef]
- Kočí, K.; Obalová, L.; Lacný, Z. Photocatalytic reduction of CO2 over TiO2 based catalysts. Chem. Pap. 2008, 62, 1–9. [Google Scholar] [CrossRef]
- Oliveira, J.A.; Nogueira, A.E.; Gonçalves, M.C.P.; Paris, E.C.; Ribeiro, C.; Poirier, G.Y.; Giraldi, T.R. Photoactivity of N-doped ZnO nanoparticles in oxidative and reductive reactions. Appl. Surf. Sci. 2018, 433, 879–886. [Google Scholar] [CrossRef]
- Wang, H.; Zhang, L.; Wang, K.; Sun, X.; Wang, W. Enhanced photocatalytic CO2 reduction to methane over WO3·0.33H2O via Mo doping. Appl. Catal. B Environ. 2019, 243, 771–779. [Google Scholar] [CrossRef]
- Zeng, Z.; Yan, Y.; Chen, J.; Zan, P.; Tian, Q.; Chen, P. Boosting the Photocatalytic Ability of Cu2O Nanowires for CO2 Conversion by MXene Quantum Dots. Adv. Funct. Mater. 2019, 29, 1–9. [Google Scholar] [CrossRef]
- Ye, L.; Deng, Y.; Wang, L.; Xie, H.; Su, F. Bismuth-Based Photocatalysts for Solar Photocatalytic Carbon Dioxide Conversion. ChemSusChem 2019, 12, 3671–3701. [Google Scholar] [CrossRef] [PubMed]
- Lopes, O.F.; Paris, E.C.; Ribeiro, C. Synthesis of Nb2O5 nanoparticles through the oxidant peroxide method applied to organic pollutant photodegradation: A mechanistic study. Appl. Catal. B Environ. 2014, 144, 800–808. [Google Scholar] [CrossRef]
- Nogueira, A.E.; Silva, G.T.S.T.; Oliveira, J.A.; Lopes, O.F.; Torres, J.A.; Carmo, M.; Ribeiro, C. CuO Decoration Controls Nb2O5 Photocatalyst Selectivity in CO2 Reduction. ACS Appl. Energy Mater. 2020, 3, 8. [Google Scholar] [CrossRef]
- da Silva, G.T.S.T.; Nogueira, A.E.; Oliveira, J.A.; Torres, J.A.; Lopes, O.F.; Ribeiro, C. Acidic surface niobium pentoxide is catalytic active for CO2 photoreduction. Appl. Catal. B Environ. 2019, 242, 349–357. [Google Scholar] [CrossRef]
- Deng, H.; Xu, F.; Cheng, B.; Yu, J.; Ho, W. Photocatalytic CO2 reduction of C/ZnO nanofibers enhanced by an Ni-NiS cocatalyst. Nanoscale 2020, 12, 7206–7213. [Google Scholar] [CrossRef] [PubMed]
- Xu, F.; Zhang, J.; Zhu, B.; Yu, J.; Xu, J. CuInS2 sensitized TiO2 hybrid nanofibers for improved photocatalytic CO2 reduction. Appl. Catal. B Environ. 2018, 230, 194–202. [Google Scholar] [CrossRef]
- Kang, S.; Im, T.; Koh, M.; Lee, C.S. Facile fabrication of electrospun black titania nanofibers decorated with graphitic carbon nitride for the application of photocatalytic CO2 reduction. J. CO2 Util. 2020, 41, 101230. [Google Scholar] [CrossRef]
- Li, F.; Ruan, S.; Yin, Y.; Zhang, N.; Zhang, H.; Li, C.; Chen, Y. Facile synthesis of MnWO4/WO3 electrospun nanofibers as high performance visible-light driven photocatalysts. Mater. Lett. 2018, 229, 98–102. [Google Scholar] [CrossRef]
- Szilágyi, I.M.; Santala, E.; Heikkilä, M.; Pore, V.; Kemell, M.; Nikitin, T.; Teucher, G.; Firkala, T.; Khriachtchev, L.; Räsänen, M.; et al. Photocatalytic properties of WO3/TiO2 core/shell nanofibers prepared by electrospinning and atomic layer deposition. Chem. Vap. Depos. 2013, 19, 149–155. [Google Scholar] [CrossRef]
- Qi, S.; Zuo, R.; Liu, Y.; Wang, Y. Synthesis and photocatalytic activity of electrospun niobium oxide nanofibers. Mater. Res. Bull. 2013, 48, 1213–1217. [Google Scholar] [CrossRef]
- de Jesus, E.T.; Moreira, A.J.; Sá, M.C.; Freschi, G.P.G.; Joya, M.R.; Li, M.S.; Paris, E.C. Potential of Nb2O5 nanofibers in photocatalytic degradation of organic pollutants. Environ. Sci. Pollut. Res. 2021. [Google Scholar] [CrossRef] [PubMed]
- Dai, Q.; Yuan, B.; Guo, M.; Zhang, K.; Chen, X.; Song, Z.; Nguyen, T.T.; Wang, X.; Lin, S.; Fan, J.; et al. A novel nano-fibriform C- modified niobium pentoxide by using cellulose templates with highly visible-light photocatalytic performance. Ceram. Int. 2020, 46, 13210–13218. [Google Scholar] [CrossRef]
- Li, G.; Zhang, X.; Lu, H.; Yan, C.; Chen, K.; Lu, H.; Gao, J.; Yang, Z.; Zhu, G.; Wang, C.; et al. Ethanol sensing properties and reduced sensor resistance using porous Nb2O5-TiO2 n-n junction nanofibers. Sens. Actuators B Chem. 2019, 283, 602–612. [Google Scholar] [CrossRef]
- Du, Y.; Zhang, S.; Wang, J.; Wu, J.; Dai, H. Nb2O5 nanowires in-situ grown on carbon fiber: A high-efficiency material for the photocatalytic reduction of Cr(VI). J. Environ. Sci. 2018, 66, 358–367. [Google Scholar] [CrossRef]
- Kumari, N.; Gaurav, K.; Samdarshi, S.K.; Bhattacharyya, A.S.; Paul, S.; Rajbongshi, B.M.; Mohanty, K. Dependence of photoactivity of niobium pentoxide (Nb2O5) on crystalline phase and electrokinetic potential of the hydrocolloid. Sol. Energy Mater. Sol. Cells 2020, 208, 110408. [Google Scholar] [CrossRef]
- Nakane, K.; Morinaga, M.; Ogata, N. Formation of niobium oxide and carbide nanofibers from poly(vinyl alcohol)/niobium oxide composite nanofibers. J. Mater. Sci. 2013, 48, 7774–7779. [Google Scholar] [CrossRef][Green Version]
- Reguieg, F.; Ricci, L.; Bouyacoub, N.; Belbachir, M.; Bertoldo, M. Thermal characterization by DSC and TGA analyses of PVA hydrogels with organic and sodium MMT. Polym. Bull. 2020, 77, 929–948. [Google Scholar] [CrossRef]
- Niazi, M.B.K.; Jahan, Z.; Ahmed, A.; Uzair, B.; Mukhtar, A.; Gregersen, Ø.W. Mechanical and thermal properties of carboxymethyl fibers (CMF)/PVA based nanocomposite membranes. J. Ind. Eng. Chem. 2020, 90, 122–131. [Google Scholar] [CrossRef]
- Ferreira, E.d.P.; Bessa, L.P.; Cardoso, V.L.; Reis, M.H.M. Influence of sintering temperature on the morphology of ceramic hollow fibers prepared from niobium pentoxide. Int. J. Appl. Ceram. Technol. 2019, 16, 781–790. [Google Scholar] [CrossRef]
- Nakhowong, R. Fabrication and characterization of MnTiO3 nanofibers by sol-gel assisted electrospinning. Mater. Lett. 2015, 161, 468–470. [Google Scholar] [CrossRef]
- Wan, M.; Zhu, H.; Zhang, S.G.; Jin, H.N.; Wen, Y.K.; Wang, L.N.; Zhang, M.; Du, M.L. Building block nanoparticles engineering induces multi-element perovskite hollow nanofibers structure evolution to trigger enhanced oxygen evolution. Electrochim. Acta 2018, 279, 301–310. [Google Scholar] [CrossRef]
- Kato, K.; Tamura, S.Y. Die kristallstruktur von T-Nb2O5. Acta Crystallogr. Sect. B Struct. Crystallogr. Cryst. Chem. 1975, 31, 673–677. [Google Scholar] [CrossRef]
- Laves, F.; Petter, W.; Wulf, H. Die Kristallstruktur von ζ-Nb2O5. Naturwissenschaften 1954, 51, 633–634. [Google Scholar] [CrossRef]
- Bolzan, A.A.; Fong, C.; Kennedy, B.J.; Howard, C.J. A powder neutron diffraction study of semiconducting and metallic niobium dioxide. J. Sol. Stat. Chem. 1994, 113, 9–14. [Google Scholar] [CrossRef]
- Katoch, A.; Sun, G.J.; Choi, S.W.; Byun, J.H.; Kim, S.S. Competitive influence of grain size and crystallinity on gas sensing performances of ZnO nanofibers. Sens. Actuators B Chem. 2013, 185, 411–416. [Google Scholar] [CrossRef]
- Aziz, S.B.; Brza, M.A.; Hamsan, M.H.; Kadir, M.F.Z.; Muzakir, S.K.; Abdulwahid, R.T. Effect of ohmic-drop on electrochemical performance of EDLC fabricated from PVA:dextran:NH4I based polymer blend electrolytes. J. Mater. Res. Technol. 2020, 9, 3734–3745. [Google Scholar] [CrossRef]
- Hass Caetano Lacerda, E.; Monteiro, F.C.; Kloss, J.R.; Fujiwara, S.T. Bentonite clay modified with Nb2O5: An efficient and reused photocatalyst for the degradation of reactive textile dye. J. Photochem. Photobiol. A Chem. 2020, 388, 112084. [Google Scholar] [CrossRef]
- Rad, L.R.; Momeni, A.; Ghazani, B.F.; Irani, M.; Mahmoudi, M.; Noghreh, B. Removal of Ni2+ and Cd2+ ions from aqueous solutions using electrospun PVA/zeolite nanofibrous adsorbent. Chem. Eng. J. 2014, 256, 119–127. [Google Scholar] [CrossRef]
- Sin, J.C.; Chin, Y.H.; Lam, S.M. Wo3/nb2o5 nanoparticles-decorated hierarchical porous zno microspheres for enhanced photocatalytic degradation of palm oil mill effluent and simultaneous production of biogas. Key Eng. Mater. 2019, 821, 379–385. [Google Scholar] [CrossRef]
- Peng, Y.; Lin, C.; Tang, M.; Yang, L.; Yang, Y.; Liu, J.; Huang, Z.; Li, Z. Niobium pentoxide ultra-thin nanosheets: A photocatalytic degradation and recyclable surface-enhanced Raman scattering substrate. Appl. Surf. Sci. 2020, 509, 145376. [Google Scholar] [CrossRef]
- Inoue, T.; Fujishima, A.; Konishi, S.; Honda, K. Photoelectrocatalytic reduction of carbon dioxide in aqueous suspensions of semiconductor powders [3]. Nature 1979, 277, 637–638. [Google Scholar] [CrossRef]
- Raza, A.; Shen, H.; Haidry, A.A.; Sun, L.; Liu, R.; Cui, S. Studies of Z-scheme WO3-TiO2/Cu2ZnSnS4 ternary nanocomposite with enhanced CO2 photoreduction under visible light irradiation. J. CO2 Util. 2020, 37, 260–271. [Google Scholar] [CrossRef]
- Jia, J.; Wang, H.; Lu, Z.; O’Brien, P.G.; Ghoussoub, M.; Duchesne, P.; Zheng, Z.; Li, P.; Qiao, Q.; Wang, L.; et al. Photothermal Catalyst Engineering: Hydrogenation of Gaseous CO2 with High Activity and Tailored Selectivity. Adv. Sci. 2017, 4, 1700252. [Google Scholar] [CrossRef]
- Wang, S.; Han, X.; Zhang, Y.; Tian, N.; Ma, T.; Huang, H. Inside-and-Out Semiconductor Engineering for CO2 Photoreduction: From Recent Advances to New Trends. Small Struct. 2021, 2, 2000061. [Google Scholar] [CrossRef]
- Mokrushin, A.S.; Simonenko, T.L.; Simonenko, N.P.; Gorobtsov, P.Y.; Kadyrov, N.C.; Simonenko, E.P.; Sevastyanov, V.G.; Kuznetsov, N.T. Chemoresistive Gas-Sensing Properties of Highly Dispersed Nb2O5 Obtained by Programmable Precipitation. J. Alloys Compd. 2021, 868, 159090. [Google Scholar] [CrossRef]
- Oliveira, J.A.; Torres, J.A.; Gonçalves, R.V.; Ribeiro, C.; Nogueira, F.G.E.; Ruotolo, L.A.M. Photocatalytic CO2 reduction over Nb2O5/basic bismuth nitrate nanocomposites. Mater. Res. Bull. 2021, 133, 2020. [Google Scholar] [CrossRef]


Publisher’s Note: MDPI stays neutral with regard to jurisdictional claims in published maps and institutional affiliations. |
© 2021 by the authors. Licensee MDPI, Basel, Switzerland. This article is an open access article distributed under the terms and conditions of the Creative Commons Attribution (CC BY) license (https://creativecommons.org/licenses/by/4.0/).
Share and Cite
Prado, A.C.F.; Malafatti, J.O.D.; Oliveira, J.A.; Ribeiro, C.; Joya, M.R.; Luz, A.P.; Paris, E.C. Preparation and Application of Nb2O5 Nanofibers in CO2 Photoconversion. Nanomaterials 2021, 11, 3268. https://doi.org/10.3390/nano11123268
Prado ACF, Malafatti JOD, Oliveira JA, Ribeiro C, Joya MR, Luz AP, Paris EC. Preparation and Application of Nb2O5 Nanofibers in CO2 Photoconversion. Nanomaterials. 2021; 11(12):3268. https://doi.org/10.3390/nano11123268
Chicago/Turabian StylePrado, A. C. F., J. O. D. Malafatti, J. A. Oliveira, C. Ribeiro, M. R. Joya, A. P. Luz, and E. C. Paris. 2021. "Preparation and Application of Nb2O5 Nanofibers in CO2 Photoconversion" Nanomaterials 11, no. 12: 3268. https://doi.org/10.3390/nano11123268
APA StylePrado, A. C. F., Malafatti, J. O. D., Oliveira, J. A., Ribeiro, C., Joya, M. R., Luz, A. P., & Paris, E. C. (2021). Preparation and Application of Nb2O5 Nanofibers in CO2 Photoconversion. Nanomaterials, 11(12), 3268. https://doi.org/10.3390/nano11123268