
The High Coercivity Field in Chemically Bonded WSe2/MoSe2 Powder

Abstract
:1. Introduction
2. Experimental Methods
3. Results and Discussion
4. Conclusions
Author Contributions
Funding
Institutional Review Board Statement
Informed Consent Statement
Data Availability Statement
Conflicts of Interest
References
- Sethulakshmi, N.; Mishra, A.; Ajayan, P.M.; Kawazoe, Y.; Roy, A.K.; Singh, A.K.; Tiwary, C.S. Magnetism in two-dimensional materials beyond graphene. Mater. Today 2019, 27, 107–122. [Google Scholar] [CrossRef]
- Hernando, A.; Crespo, P.; Garcia, M.A. Origin of Orbital Ferromagnetism and Giant Magnetic Anisotropy at the Nanoscale. Phys. Rev. Lett. 2006, 96, 057206. [Google Scholar] [CrossRef] [Green Version]
- Garcia, M.A.; Merino, J.M.; Fernandez Pinel, E.; Quesada, A.; de la Venta, J.; Ruiz Gonzalez, M.L.; Castro, G.R.; Crespo, P.; Llopis, J.; Gonzalez-Calbet, J.M. Magnetic Properties of ZnO Nanoparticles. Nano. Lett. 2007, 7, 1489–1494. [Google Scholar] [CrossRef] [PubMed] [Green Version]
- Radisavljevic, B.; Radenovic, A.; Brivio, J.; Giacometti, V.; Kis, A. Single-layer MoS2 transistors. Nat. Nanotechnol. 2011, 6, 147–150. [Google Scholar] [CrossRef]
- Ahmed, S.; Ding, X.; Murmu, P.P.; Bao, N.N.; Liu, R.; Kennedy, J.; Ding, J.; Yia, J.B. Magnetic properties of Co doped WSe2 by implantation. J. Alloys Compd. 2018, 731, 25. [Google Scholar] [CrossRef]
- Li, H.; Lu, G.; Wang, Y.; Yin, Z.; Cong, C.; He, Q.; Wang, L.; Ding, F.; Yu, T.; Zhang, H. Mechanical Exfoliation and Characterization of Single- and Few-Layer Nanosheets of WSe2, TaS2, and TaSe2. Small 2013, 9, 1974. [Google Scholar] [CrossRef] [PubMed]
- Tao, L.; Meng, F.; Zhao, S.; Song, Y.; Yu, J.; Wang, X.; Liu, Z.; Wang, Y.; Li, B.; Wang, Y.; et al. Experimental and theoretical evidence for the ferromagnetic edge in WSe2 nanosheets. Nanoscale 2017, 9, 4898–4906. [Google Scholar] [CrossRef] [PubMed]
- Matte, H.S.S.R.; Maitra, U.; Kumar, P.; Govinda Rao, B.; Pramoda, K.; Rao, C.N.R. Synthesis, Characterization, and Properties of Few-layer Metal Dichalcogenides and their Nanocomposites with Noble Metal Particles, Polyaniline, and Reduced Graphene Oxide. Z. Anorg. Allg. Chem. 2012, 638, 2617–2624. [Google Scholar] [CrossRef]
- Huo, N.; Li, Y.; Kang, J.; Li, R.; Xia, Q.; Li, J. Edge-states ferromagnetism of WS2 nanosheets. Appl. Phys. Lett. 2014, 104, 202406. [Google Scholar] [CrossRef]
- Yang, Z.; Gao, D.; Zhang, J.; Xu, Q.; Shi, S.; Tao, K.; Xue, D. Realization of high Curie temperature ferromagnetism in atomically thin MoS2 and WS2 nanosheets with uniform and flower-like morphology. Nanoscale 2015, 7, 650–658. [Google Scholar] [CrossRef]
- Mao, X.; Xu, Y.; Xue, Q.; Wang, W.; Gao, D. Ferromagnetism in exfoliated tungsten disulfide nanosheets. Nanoscale Res. Lett. 2013, 8, 430. [Google Scholar] [CrossRef] [PubMed] [Green Version]
- Ding, X.; Liu, T.; Ahmed, S.; Bao, N.; Ding, J.; Yi, J.B. Enhanced ferromagnetism in WS2 via defect engineering. J. Alloys Compd. 2019, 772, 740–744. [Google Scholar] [CrossRef]
- Joseph, A.; Kumar Tadi, K.; Anju, K.S.; Aneesh, P.M. Structural, optical, magnetic and electrochemical properties of hydrothermally synthesized WS2 nanoflakes. J. Mater. Res. 2021, 36, 884–895. [Google Scholar] [CrossRef]
- Xia, B.; Gao, D.; Liu, P.; Liu, Y.; Shia, S.; Taoa, K. Zigzag-edge related ferromagnetism in MoSe2 nanoflakes. Phys. Chem. Chem. Phys. 2015, 17, 32505–32510. [Google Scholar] [CrossRef] [Green Version]
- Xing, X.; Wang, X.; Wu, C.; Lu, Y.; Yan, M. Room temperature ferromagnetism and its origin for amorphous MoSe2 nanoflowers. Appl. Phys. Lett. 2018, 112, 122407. [Google Scholar] [CrossRef]
- Cai, L.; He, J.; Liu, Q.; Yao, T.; Chen, L.; Yan, W.; Hu, F.; Jiang, Y.; Zhao, Y.; Hu, T.; et al. Vacancy-Induced Ferromagnetism of MoS2 Nanosheets. J. Am. Chem. Soc. 2015, 137, 2622–2627. [Google Scholar] [CrossRef]
- Sanikop, R.; Sudakar, C. Tailoring Magnetically Active Defect Sites in MoS2 Nanosheets for Spintronics Applications. ACS Appl. Nano Mater. 2020, 3, 576–587. [Google Scholar] [CrossRef]
- Mathew, S.; Gopinadhan, K.; Chan, T.K.; Yu, X.J.; Zhan, D.; Cao, L.; Rusydi, A.; Breese, M.B.H.; Dhar, S.; Shen, Z.X.; et al. Magnetism in MoS2 induced by proton irradiation. Appl. Phys. Lett. 2012, 101, 102103. [Google Scholar] [CrossRef] [Green Version]
- Ren, H.; Zhang, L.; Xiang, G. Web buckle-mediated room-temperature ferromagnetism in strained MoS2 thin films. Appl. Phys. Lett. 2020, 116, 012401. [Google Scholar] [CrossRef]
- Ahmed, S.; Viboon, P.; Ding, X.; Bao, N.N.; Du, Y.H.; Herng, T.S.; Ding, J.; Yi, J.B. Annealing effect on the ferromagnetism of MoS2 nanoparticles. J. Alloys Compd. 2018, 746, 399–404. [Google Scholar] [CrossRef]
- Tongay, S.; Varnoosfaderani, S.S.; Appleton, B.R.; Wu, J.; Hebard, A.F. Magnetic properties of MoS2: Existence of ferromagnetism. Appl. Phys. Lett. 2012, 101, 123105. [Google Scholar] [CrossRef]
- Zhou, Q.; Su, S.; Cheng, P.; Hu, X.; Zeng, M.; Gao, X.; Zhang, Z.; Liu, J.M. Robust ferromagnetism in zigzag-edge rich MoS2 pyramids. Nanoscale 2018, 10, 11578–11584. [Google Scholar] [CrossRef]
- Hu, W.; Tan, H.; Duan, H.; Li, G.; Li, N.; Ji, Q.; Lu, Y.; Wang, Y.; Sun, Z.; Hu, F.; et al. Synergetic Effect of Substitutional Dopants and Sulfur Vacancy in Modulating the Ferromagnetism of MoS2 Nanosheets. ACS Appl. Mater. Interfaces 2019, 11, 31155–31161. [Google Scholar] [CrossRef]
- Han, S.W.; Park, Y.; Hwang, Y.H.; Jekal, S.; Kang, M.; Lee, W.G.; Yang, W.; Lee, G.-D.; Hong, S.C. Electron beam-formed ferromagnetic defects on MoS2 surface along 1T phase transition. Sci. Rep. 2016, 6, 38730. [Google Scholar] [CrossRef] [PubMed] [Green Version]
- Zhang, R.; Li, Y.; Qi, J.; Gao, D. Ferromagnetism in ultrathin MoS2 nanosheets: From amorphous to crystalline. Nanoscale Res. Lett. 2014, 9, 586. [Google Scholar] [CrossRef] [Green Version]
- Qi, R.; Wang, S.; Wang, M.; Liu, W.; Yan, Z.; Bi, X.; Huang, Q. Towards well-defined MoS2 nanoribbons on a large scale. Chem. Commun. 2017, 53, 9757–9760. [Google Scholar] [CrossRef]
- Kubart, T.; Polcar, T.; Kopecký, L.; Novak, R.; Novakova, D. Temperature dependence of tribological properties of and MoSe2 coatings. Surf. Coat. Technol. 2005, 193, 230–233. [Google Scholar] [CrossRef]
- Dominguez-Meister, S.; Cristina Rojas, T.; Brizuela, M.; Carlos Sanchez-Lopez, J. Solid lubricant behavior of MoS2 and WSe2-based nanocomposite coatings. Sci. Technol. Adv. Mater. 2017, 18, 122–133. [Google Scholar] [CrossRef] [Green Version]
- Habib, M.; Muhammad, Z.; Khan, R.; Wu, C.; Rehman, Z.; Zhou, Y.; Liu, H.; Song, L. Ferromagnetism in CVT Grown Tungsten Diselenide Single Crystals with Nickel Doping. Nanotechnology 2018, 29, 115701. [Google Scholar] [CrossRef]
- Martinez, L.M.; Delgado, J.A.; Saiz, C.L.; Cosio, A.; Wu, Y.; Villagran, D.; Gandha, K.; Karthik, C.; Nlebedim, I.C.; Singamaneni, S.R. Magnetic and electrocatalytic properties of transition metal doped MoS2 nanocrystals. J. Appl. Phys. 2018, 124, 153903. [Google Scholar] [CrossRef] [Green Version]
- Wang, J.; Sun, F.; Yang, S.; Li, Y.; Zhao, C.; Xu, M.; Zhang, Y.; Zeng, H. Robust ferromagnetism in Mn-doped MoS2 nanostructures. Appl. Phys. Lett. 2016, 109, 092401. [Google Scholar] [CrossRef]
- Ahmed, S.; Ding, X.; Bao, N.; Bian, P.; Zheng, R.; Wang, Y.; Murmu, P.; Kennedy, J.; Liu, R.; Fan, H.; et al. Inducing High Coercivity in MoS2 Nanosheets by Transition Element Doping. Chem. Mater. 2017, 29, 9066–9074. [Google Scholar] [CrossRef]
- Zhang, Q.; Ren, Z.; Wu, N.; Wang, W.; Gao, Y.; Zhang, Q.; Shi, J.; Zhuang, L.; Sun, X.; Fu, L. Nitrogen-doping induces tunable magnetism in ReS2. NPJ 2D Mater. Appl. 2018, 2, 22. [Google Scholar] [CrossRef] [Green Version]
- Li, B.; Xing, T.; Zhong, M.; Huang, L.; Lei, N.; Zhang, J.; Li, J.; Wei, Z. A two-dimensional Fe-doped SnS2 magnetic semiconductor. Nat. Commun. 2017, 8, 1985. [Google Scholar] [CrossRef] [PubMed]
- Ahmed, S.; Ding, X.; Murmu, P.P.; Bao, N.; Liu, R.; Kennedy, J.; Wang, L.; Ding, J.; Wu, T.; Vinu, A.; et al. High Coercivity and Magnetization in WSe2 by Codoping Co and Nb. Small 2019, 16, 1903173. [Google Scholar] [CrossRef]
- Xia, B.; An, L.; Gao, D.; Shi, S.; Xib, P.; Xue, D. Hierarchical ultrathin Mo(SxSe1-x)2 nanosheets with tunable ferromagnetism and efficient hydrogen evolution reaction activity: Towards defect site effect. CrystEngComm 2015, 17, 6240–6425. [Google Scholar] [CrossRef]
- Lin, B.-C.; Ye, X.G.; Wang, N.; Zhang, C.X.; Deng, H.X.; Fang, J.Z.; Cui, H.N.; Wang, S.; Liu, J.; Wei, Z.; et al. Spontaneous ferromagnetism and magnetoresistance hysteresis in Ge1-xSnx alloys. Sci. Bull. 2021, 66, 1375. [Google Scholar] [CrossRef]
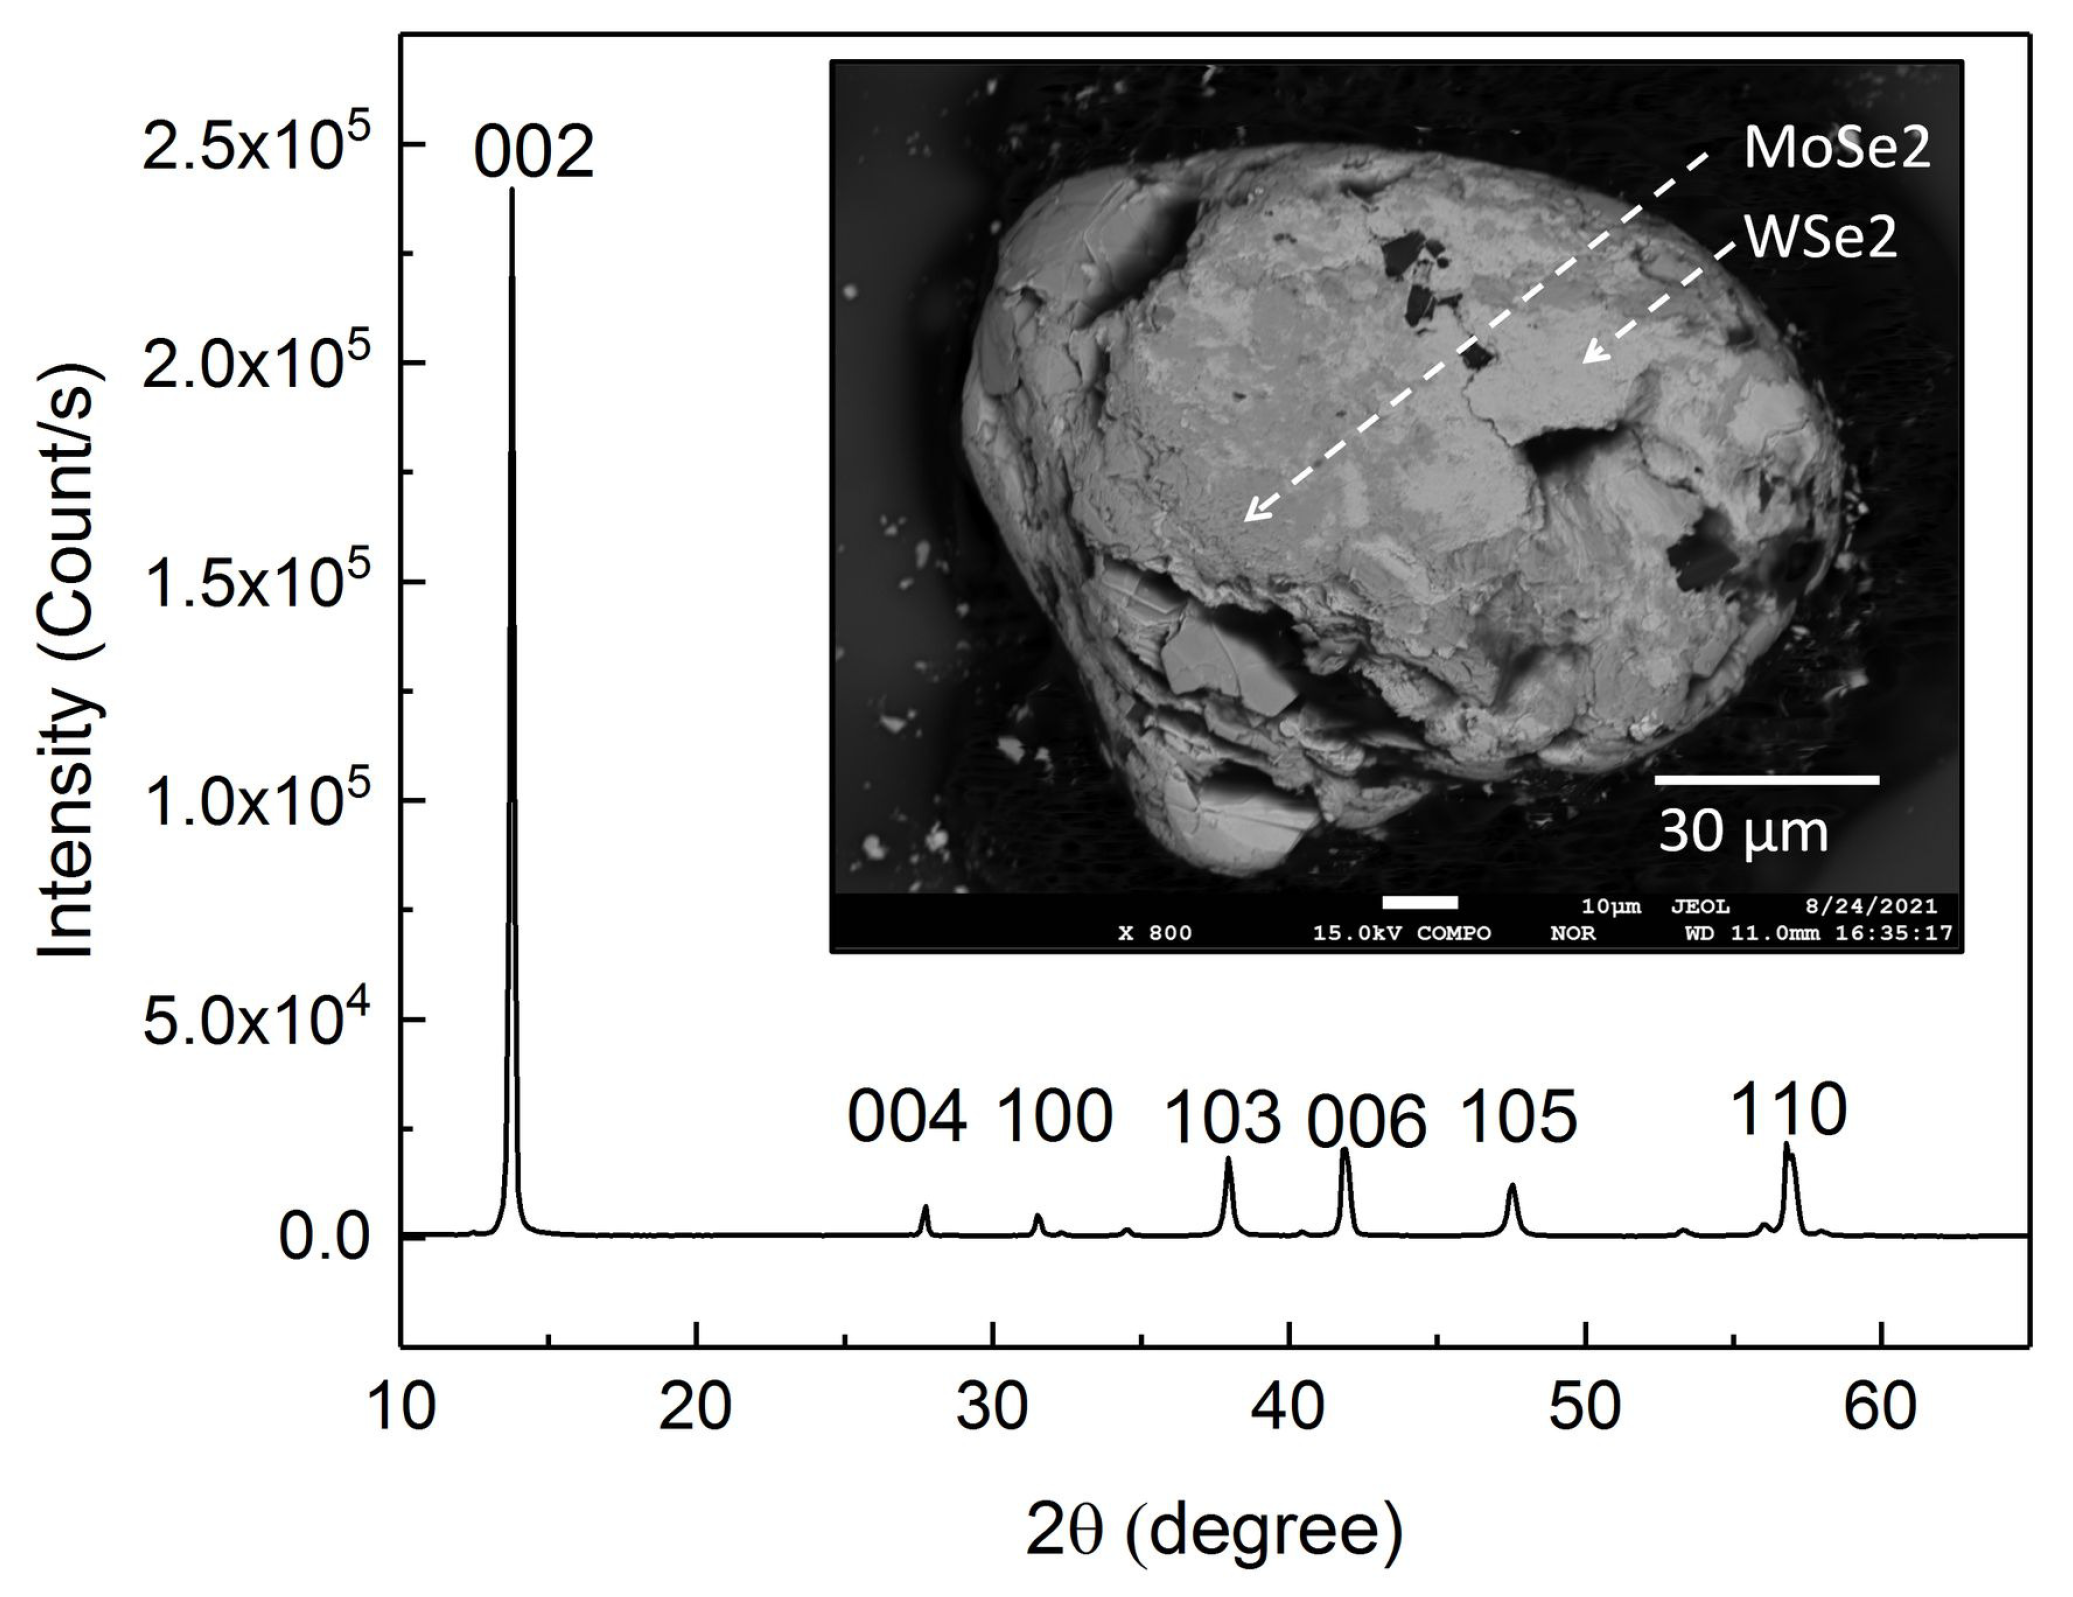
- JCPDS cards No. 87-2419 for MoSe2, and JCPDS cards No. 87-2418 for WSe2.
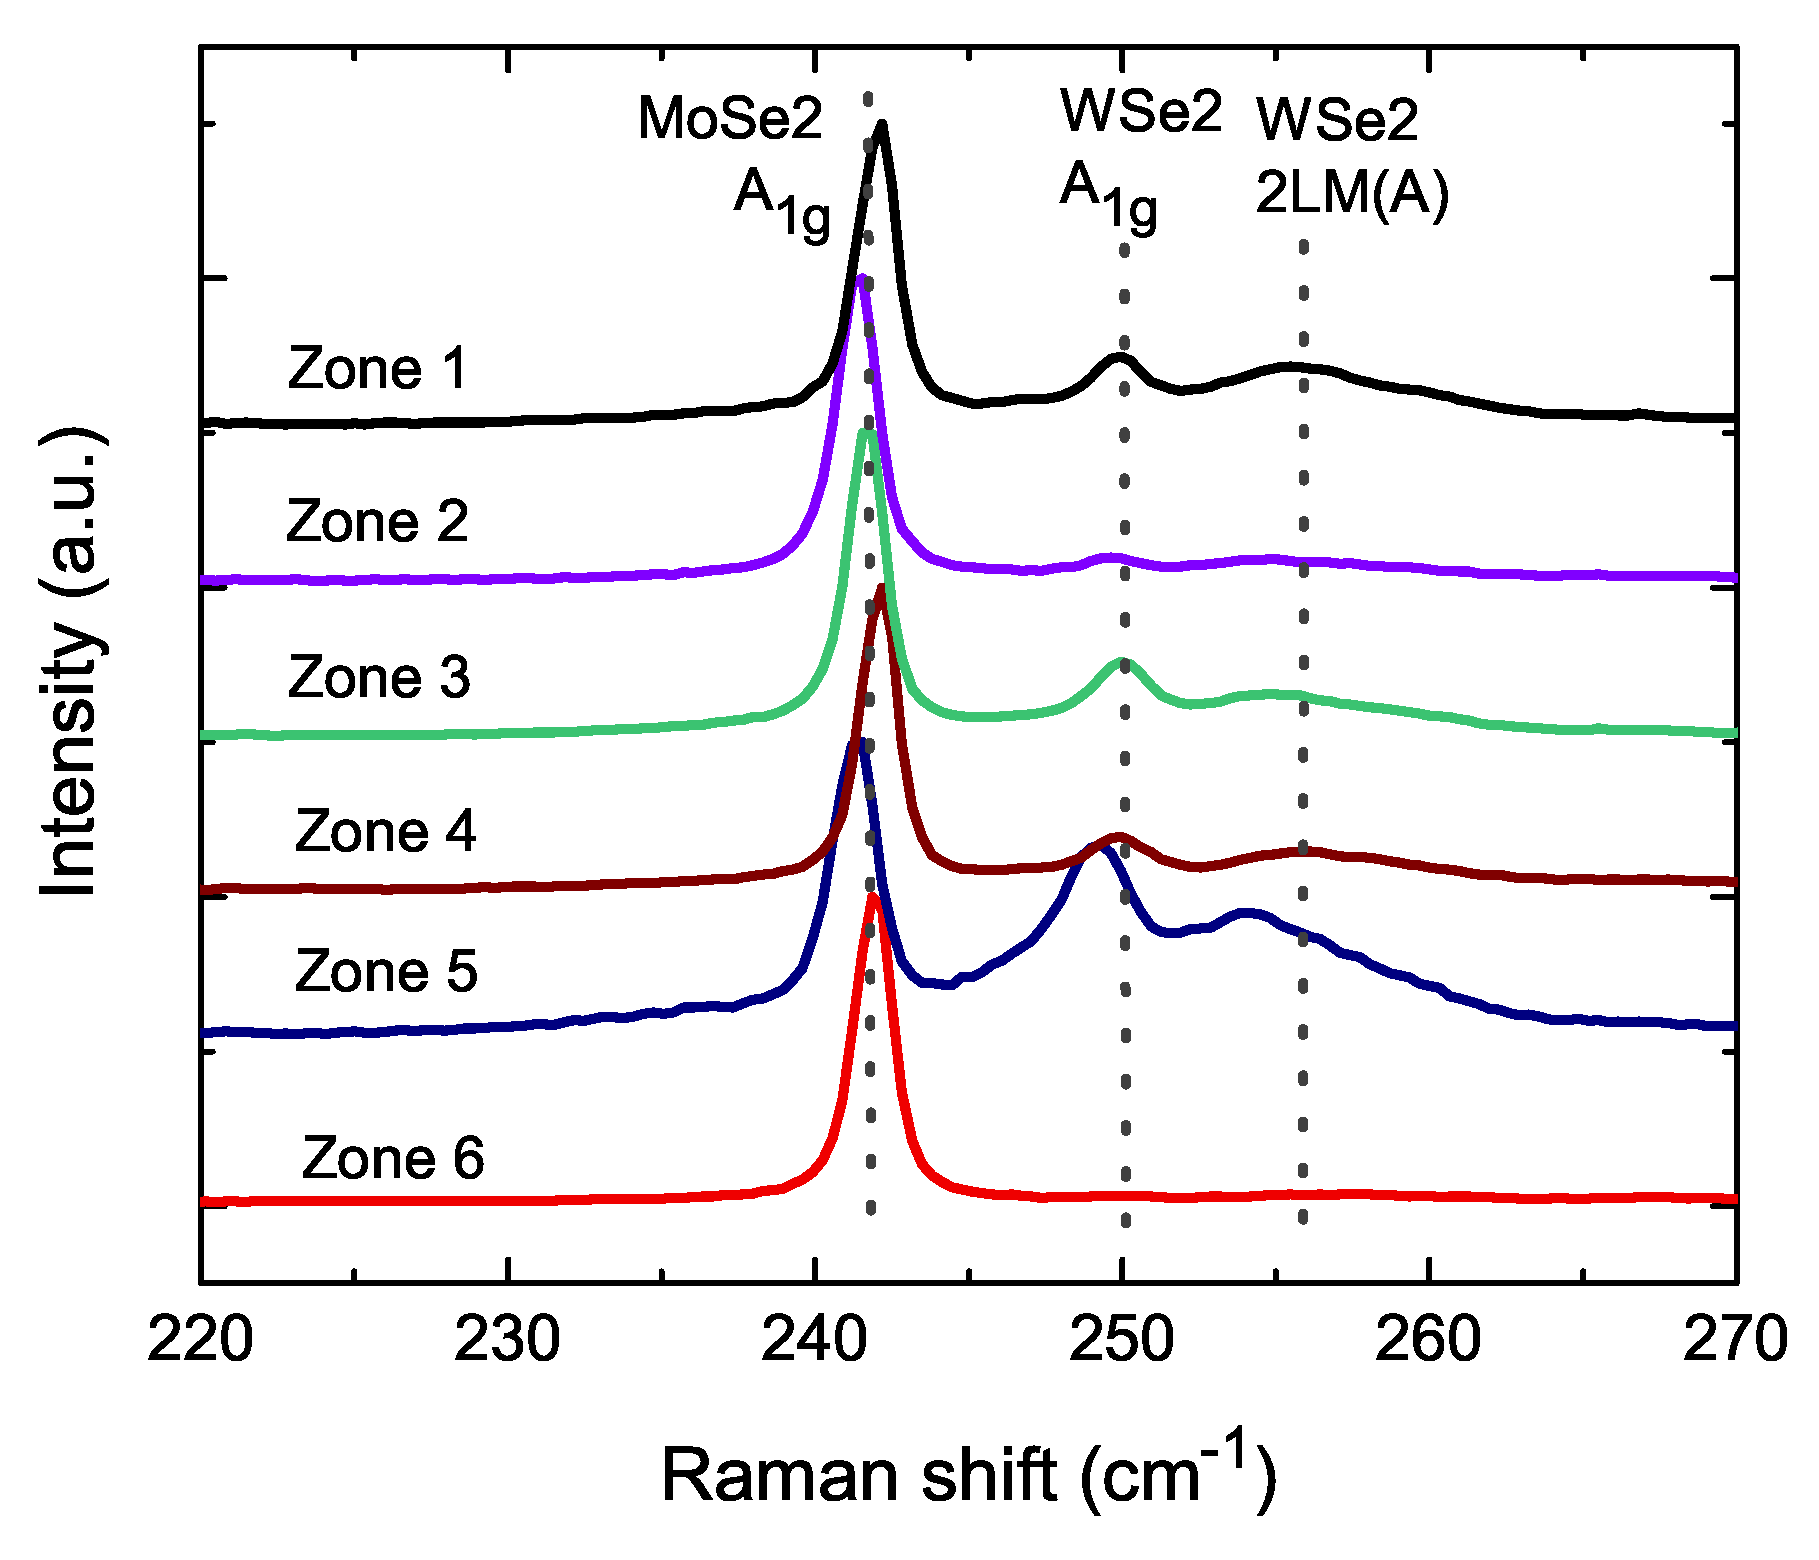
- Sun, Y.; Fujisawa, K.; Lin, Z.; Lei, Y.; Mondschein, J.S.; Terrones, M.; Schaak, R.E. Low-Temperature Solution Synthesis of Transition Metal Dichalcogenide Alloys with Tunable Optical Properties. J. Am. Chem. Soc. 2017, 139, 11096–11105. [Google Scholar] [CrossRef]

| Material | Coercivity | Saturation Magnetization | Temperature | Treatment | Reference |
|---|---|---|---|---|---|
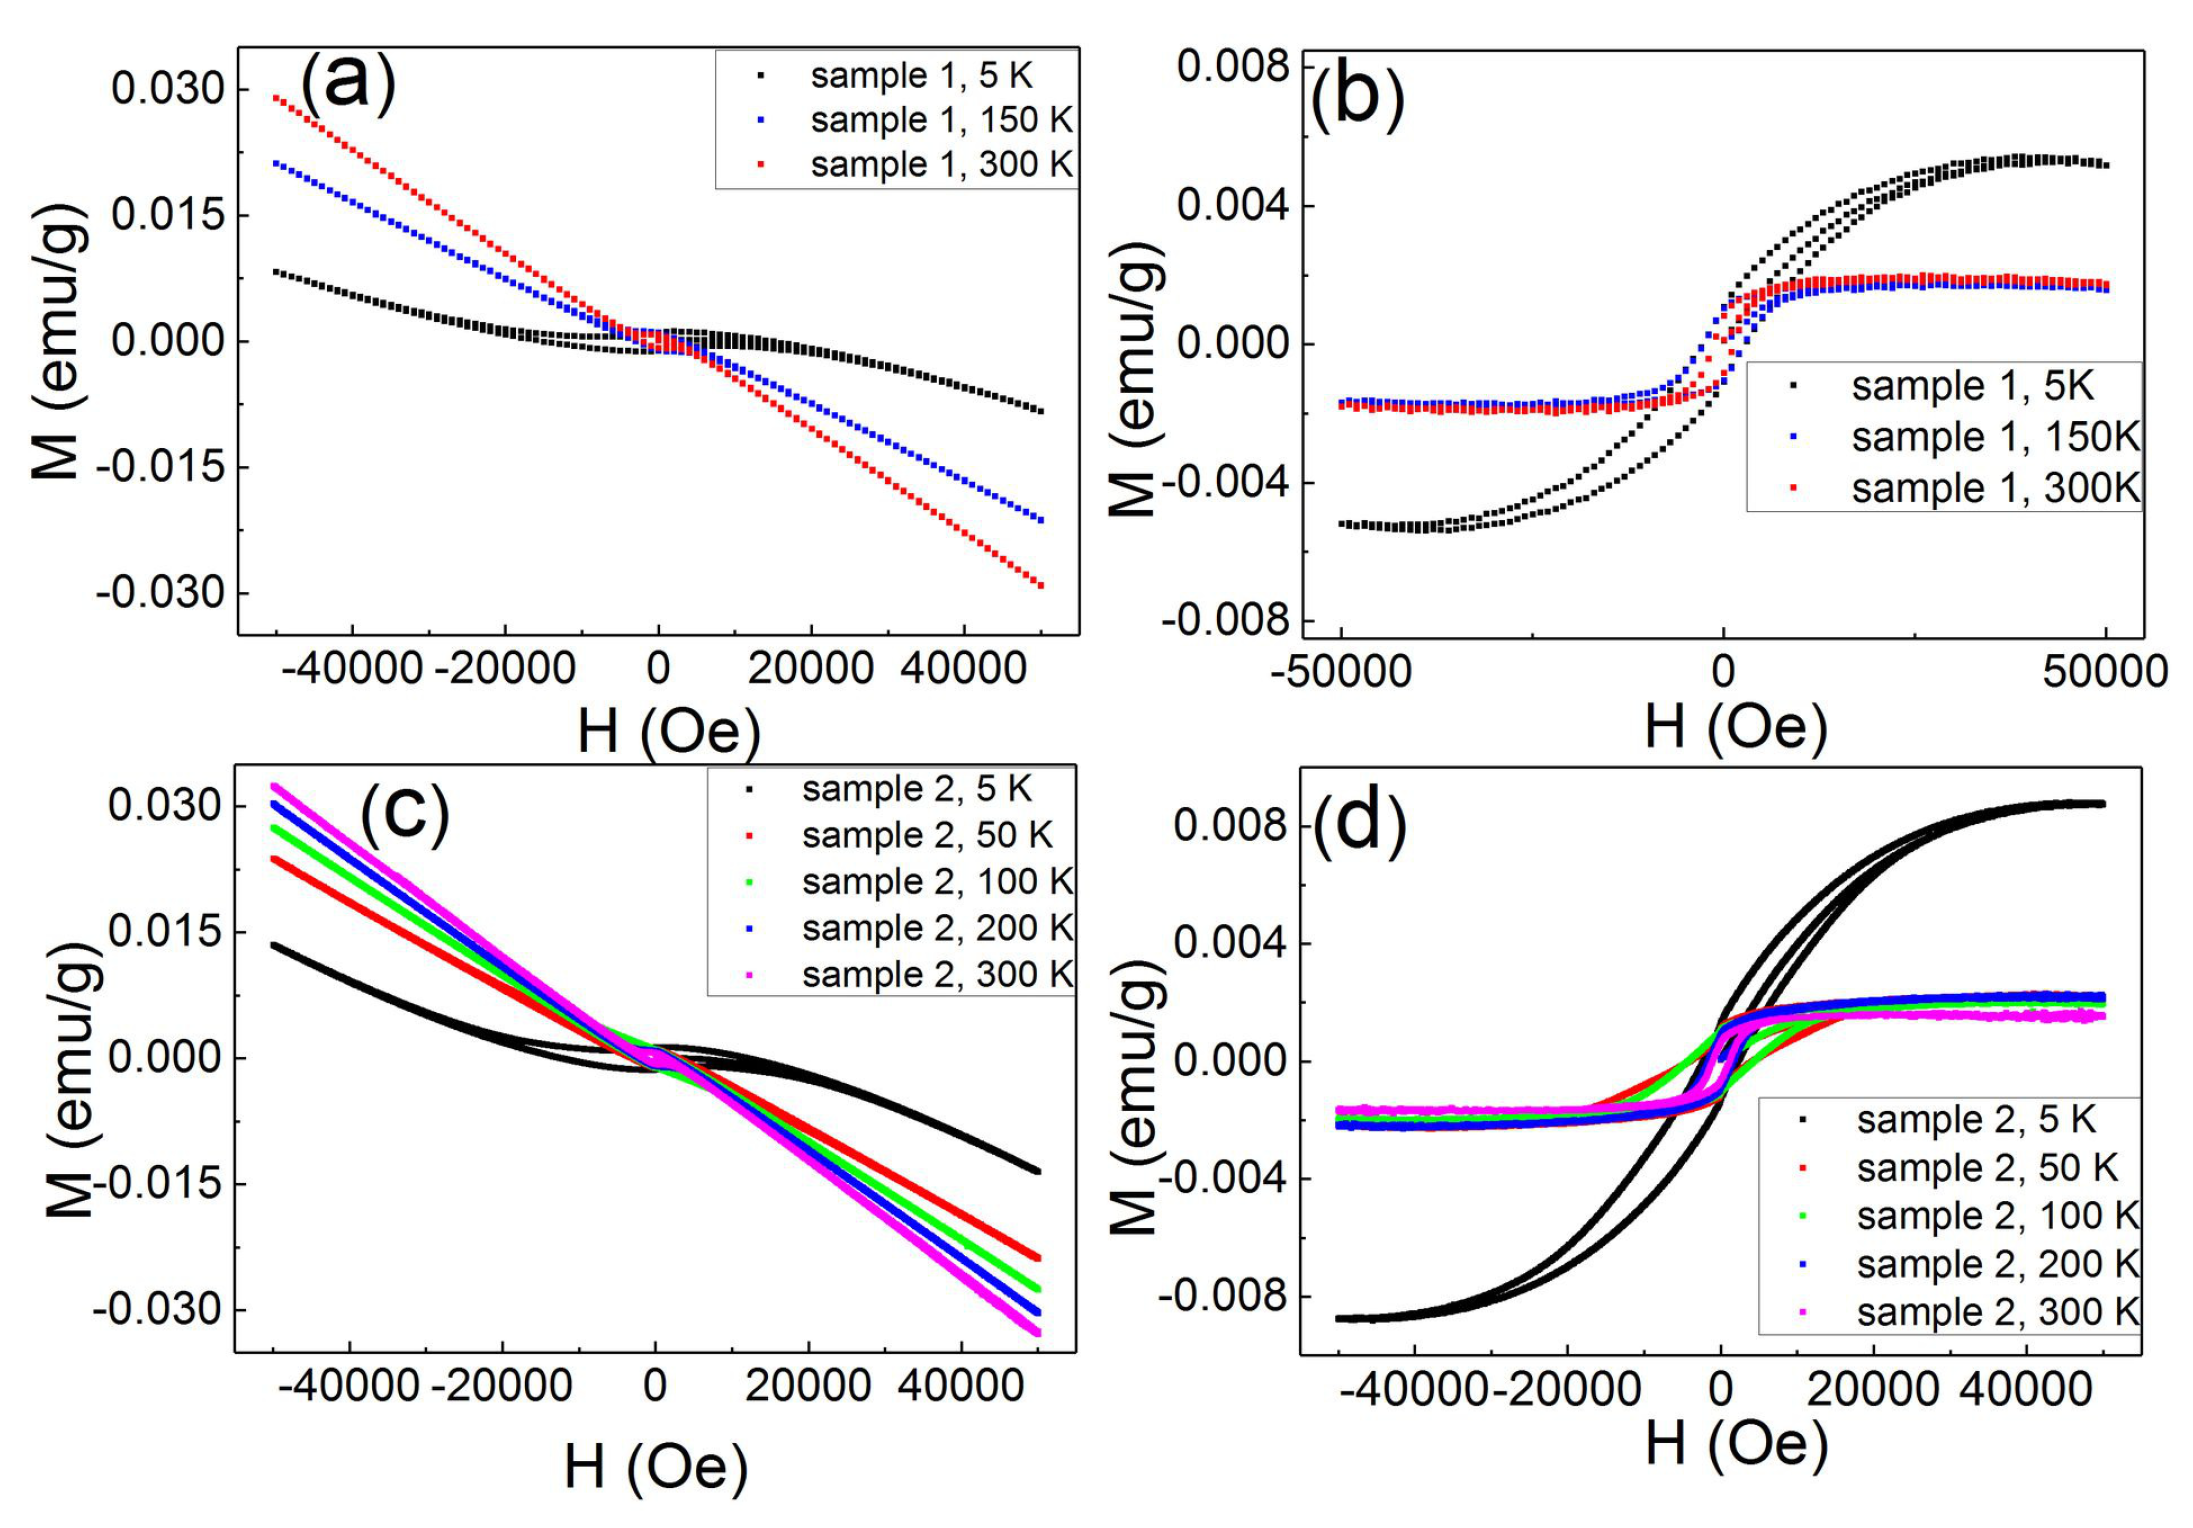
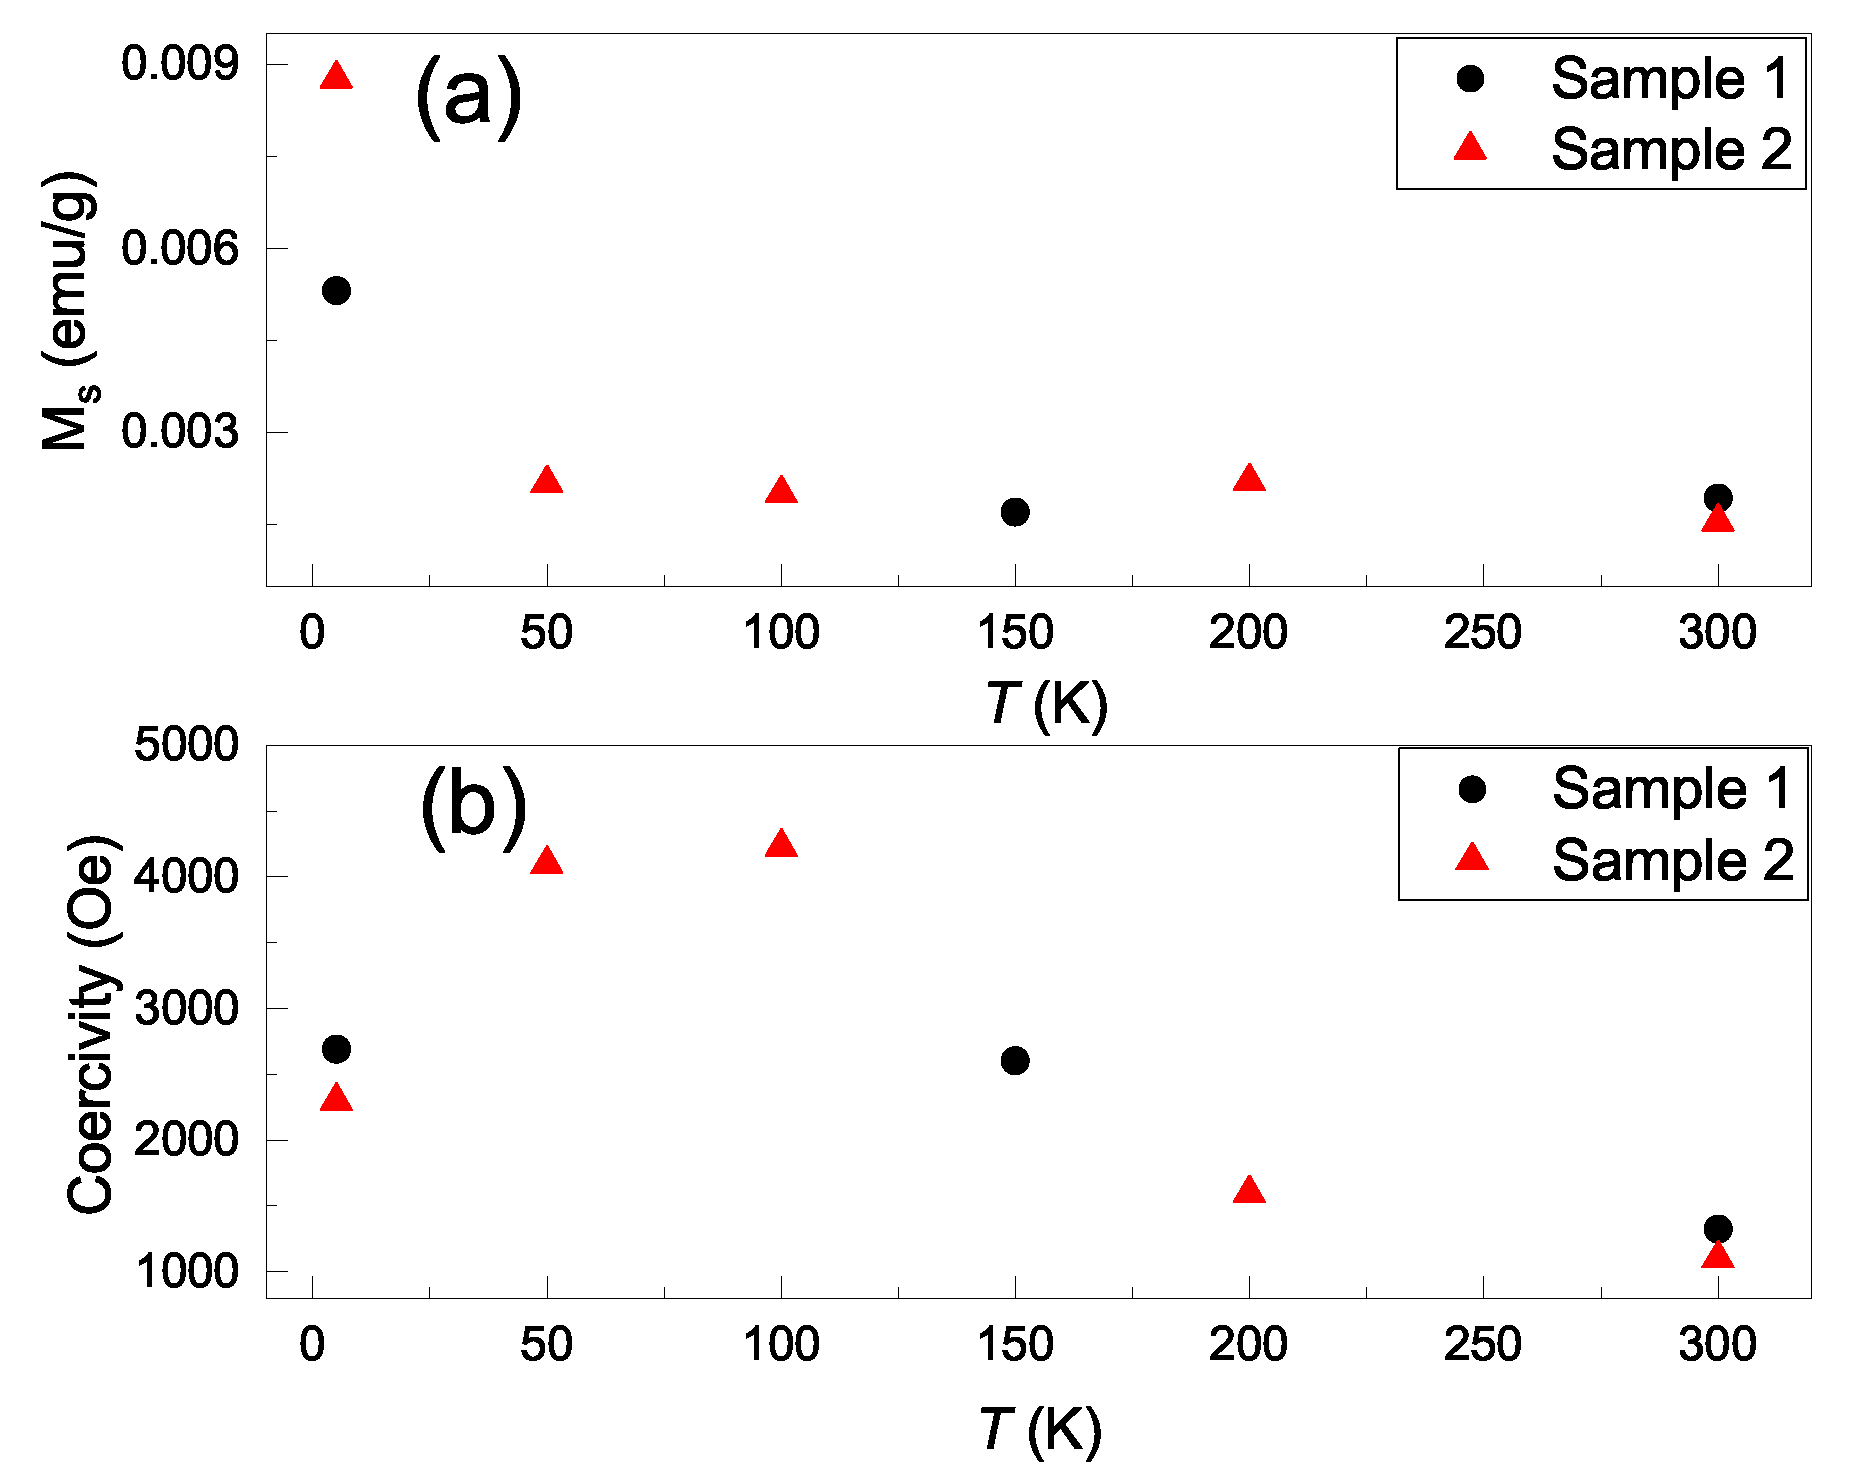
| WSe/MoSe powder | 2695 Oe | 0.0053 emu/g | 5 K | interface | This work |
| WSe/MoSe powder | 2606 Oe | 0.0017 emu/g | 150 K | interface | This work |
| WSe/MoSe powder | 1324 Oe | 0.0019 emu/g | 300 K | interface | This work |
| WSe/MoSe powder | 2299 Oe | 0.0087 emu/g | 5 K | interface | This work |
| WSe/MoSe powder | 4100 Oe | 0.0022 emu/g | 50 K | interface | This work |
| WSe/MoSe powder | 4233 Oe | 0.0020 emu/g | 100 K | interface | This work |
| WSe/MoSe powder | 1600 Oe | 0.0022 emu/g | 200 K | interface | This work |
| WSe/MoSe powder | 1100 Oe | 0.0015 emu/g | 300 K | interface | This work |
| WSe nanosheet | 414 Oe | 211 emu/cm | 20 K | edge | Ref. [7] |
| WSe naosheet | 106 Oe | 70 emu/cm | 300 K | edge | Ref. [7] |
| WSe few-layer | 578 Oe | 0.078 emu/g | 10 K | zigzag | Ref. [8] |
| WSe few-layer | 200 Oe | 0.0073 emu/g | 300 K | zigzag | Ref. [8] |
| WS nanosheet | 1115 Oe | 0.0046 emu/g | 3 K | zigzag | Ref. [9] |
| WS nanosheet | 92 Oe | 0.0052 emu/g | 300 K | zigzag | Ref. [9] |
| WS nanosheet | 240 Oe | 0.39 emu/g | 10 K | zigzag and structure defect | Ref. [10] |
| WS nanosheet | 140 Oe | 0.2 emu/g | 300 K | zigzag and structure defect | Ref. [10] |
| WS exfoiled nanosheet | 400 Oe | 0.004 emu/g | 10 K | zigzag or vacancy | Ref. [11] |
| WS exfoiled nanosheet | 125 Oe | 0.002 emu/g | 300 K | zigzag or vacancy | Ref. [11] |
| WS few-layer | 295 Oe | 0.098 emu/g | 10 K | zigzag | Ref. [8] |
| WS few-layer | 130 Oe | 0.009 emu/g | 300 K | zigzag | Ref. [8] |
| WS powder | ∼60 Oe | 0.002 emu/g | 300 K | vacancy | Ref. [12] |
| WS nanoflake | 293 Oe | 3.67 emu/g | 60 K | Ref. [13] | |
| WS nanoflake | 171 Oe | 1.82 emu/g | 300 K | Ref. [13] | |
| WS nanoflake | 967 Oe | 7.59 emu/g | 60 K | Ref. [13] | |
| WS nanoflake | 239 Oe | 3.08 emu/g | 300 K | Ref. [13] | |
| MoSe nanoflake | 100 Oe | 1.39 emu/g | 300 K | zigzag | Ref. [14] |
| MoSe few-layer | 435 Oe | 0.013 emu/g | 10 K | zigzag | Ref. [8] |
| MoSe few-layer | 40 Oe | 0.0026 emu/g | 300 K | zigzag | Ref. [8] |
| MoSe nanoflowers | 50 Oe | 0.027 emu/g | 300 K | thermal vacancy | Ref. [15] |
| MoSe nanoflowers | 80 Oe | 0.017 emu/g | 300 K | thermal vacancy | Ref. [15] |
| MoSe nanoflowers | 60 Oe | 0.003 emu/g | 300 K | thermal vacancy | Ref. [15] |
| MoS nanosheet | 150 Oe | 1 emu/g | 300 K | vacancy | Ref. [16] |
| MoS 1T phase | 150 Oe | 12.5 emu/g | 300 K | structure phase | Ref. [16] |
| MoS nanosheets | 50∼200 Oe | 0.1 emu/g | 5 K | thermal vacancy | Ref. [17] |
| MoS nanosheets | 20∼50 Oe | 0.008 emu/g | 300 K | thermal vacancy | Ref. [17] |
| MoS film | 260 Oe | 0.00125 emu/cm | 300 K | proton irradiation | Ref. [18] |
| MoS film | 700 Oe | 0.0015 emu/cm | 10 K | proton irradiation | Ref. [18] |
| MoS film | 276 Oe | 0.0486 emu/g | 300 K | web buckle-mediated strain | Ref. [19] |
| MoS nanoparticles | 20.8 Oe | 0.1 emu/g | 5 K | thermal vacancy | Ref. [20] |
| MoS nanosheet | 241.3 Oe | 1.08 emu/g | 10 K | zigzag and structure vacancy | Ref. [10] |
| MoS nanosheet | ∼80 Oe | 0.8 emu/g | 300 K | zigzag and structure vacancy | Ref. [10] |
| MoS single crystal bulk | 400 Oe | 0.004 emu/g | 50 K | zigzag | Ref. [21] |
| MoS single crystal bulk | 100 Oe | 0.0038 emu/g | 300 K | zigzag | Ref. [21] |
| MoS pyramid (films) | ∼200 Oe | 3 emu/g | 2 K | zigzag | Ref. [22] |
| MoS pyramid (films) | ∼50 Oe | 2.9 emu/g | 300 K | zigzag | Ref. [22] |
| MoS nanosheet | ∼55 Oe | 0.01 emu/g | 300 K | S vacancy and substitutional dopants | Ref. [23] |
| MoS 1T phase | 200 Oe | 0.057 emu/g | 5 K | electron beam formed defects | Ref. [24] |
| MoS nanosheet | ∼200 Oe | 0.0073 emu/g | 300 K | un-paired Mo or edge | Ref. [25] |
| MoS few-layer | 517 Oe | 0.019 emu/g | 10 K | zigzag | Ref. [8] |
| MoS few-layer | 146 Oe | 0.0043 emu/g | 300 K | zigzag | Ref. [8] |
| MoS nanoribbons | ∼250 Oe | 0.032 emu/g | 2 K | zigzag | Ref. [26] |
| MoS nanoribbons | ∼250 Oe | 0.026 emu/g | 300 K | zigzag | Ref. [26] |
| Co doped WSe | 515 Oe | 6.89 emu/g | 5 K | dopant | Ref. [20] |
| Co doped WSe | 400 Oe | 5 emu/g | 300 K | dopant | Ref. [20] |
| Ni doped WSe | 40 Oe | 0.0067 emu/g | 300 K | dopant | Ref. [29] |
| Co doped WSe | 465 Oe | 3 K | dopant | Ref. [10] | |
| Nb and Co codoped WSe | 1200 Oe | 250 emu/cm | 10 K | dopant | Ref. [35] |
| Nb and Co codoped WSe | 0 Oe | 150 emu/cm | 300 K | dopant | Ref. [35] |
| Co doped MoS | 400 Oe | 0.025 emu/g | 300 K | dopant | Ref. [30] |
| Ni doped MoS | 175 Oe | 0.14 emu/g | 300 K | dopant | Ref. [30] |
| Mn doped MoS | 1076 Oe | 0.015 emu/g | 50 K | dopant | Ref. [31] |
| V doped MoS | 1870 Oe | 0.067 emu/g | 10 K | dopant | Ref. [32] |
| V doped MoS | 81 Oe | 300 K | dopant | Ref. [32] | |
| N doped ReS | 1200 Oe | 1.2 emu/g | 20 K | dopant | Ref. [33] |
| Fe doped SnS | 400 Oe | 3.5 emu/g | 2 K | dopant | Ref. [34] |
Publisher’s Note: MDPI stays neutral with regard to jurisdictional claims in published maps and institutional affiliations. |
© 2021 by the authors. Licensee MDPI, Basel, Switzerland. This article is an open access article distributed under the terms and conditions of the Creative Commons Attribution (CC BY) license (https://creativecommons.org/licenses/by/4.0/).
Share and Cite
Huang, S.-M.; Chen, P.-C.; Wang, P.-C. The High Coercivity Field in Chemically Bonded WSe2/MoSe2 Powder. Nanomaterials 2021, 11, 3263. https://doi.org/10.3390/nano11123263
Huang S-M, Chen P-C, Wang P-C. The High Coercivity Field in Chemically Bonded WSe2/MoSe2 Powder. Nanomaterials. 2021; 11(12):3263. https://doi.org/10.3390/nano11123263
Chicago/Turabian StyleHuang, Shiu-Ming, Pin-Cyuan Chen, and Pin-Cing Wang. 2021. "The High Coercivity Field in Chemically Bonded WSe2/MoSe2 Powder" Nanomaterials 11, no. 12: 3263. https://doi.org/10.3390/nano11123263
APA StyleHuang, S.-M., Chen, P.-C., & Wang, P.-C. (2021). The High Coercivity Field in Chemically Bonded WSe2/MoSe2 Powder. Nanomaterials, 11(12), 3263. https://doi.org/10.3390/nano11123263