
Silver Flowerlike Structures for Surface-Enhanced Raman Spectroscopy

 , ,
, ,  ,
,  and
and 
Abstract
1. Introduction
2. Materials and Methods
2.1. Preparation and Characterization of the SERS Substrates
2.2. Methodology of the SERS Measurements
3. Results and Discussion
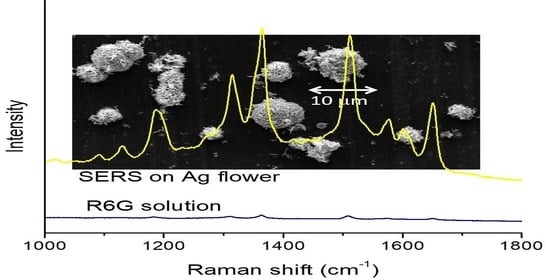
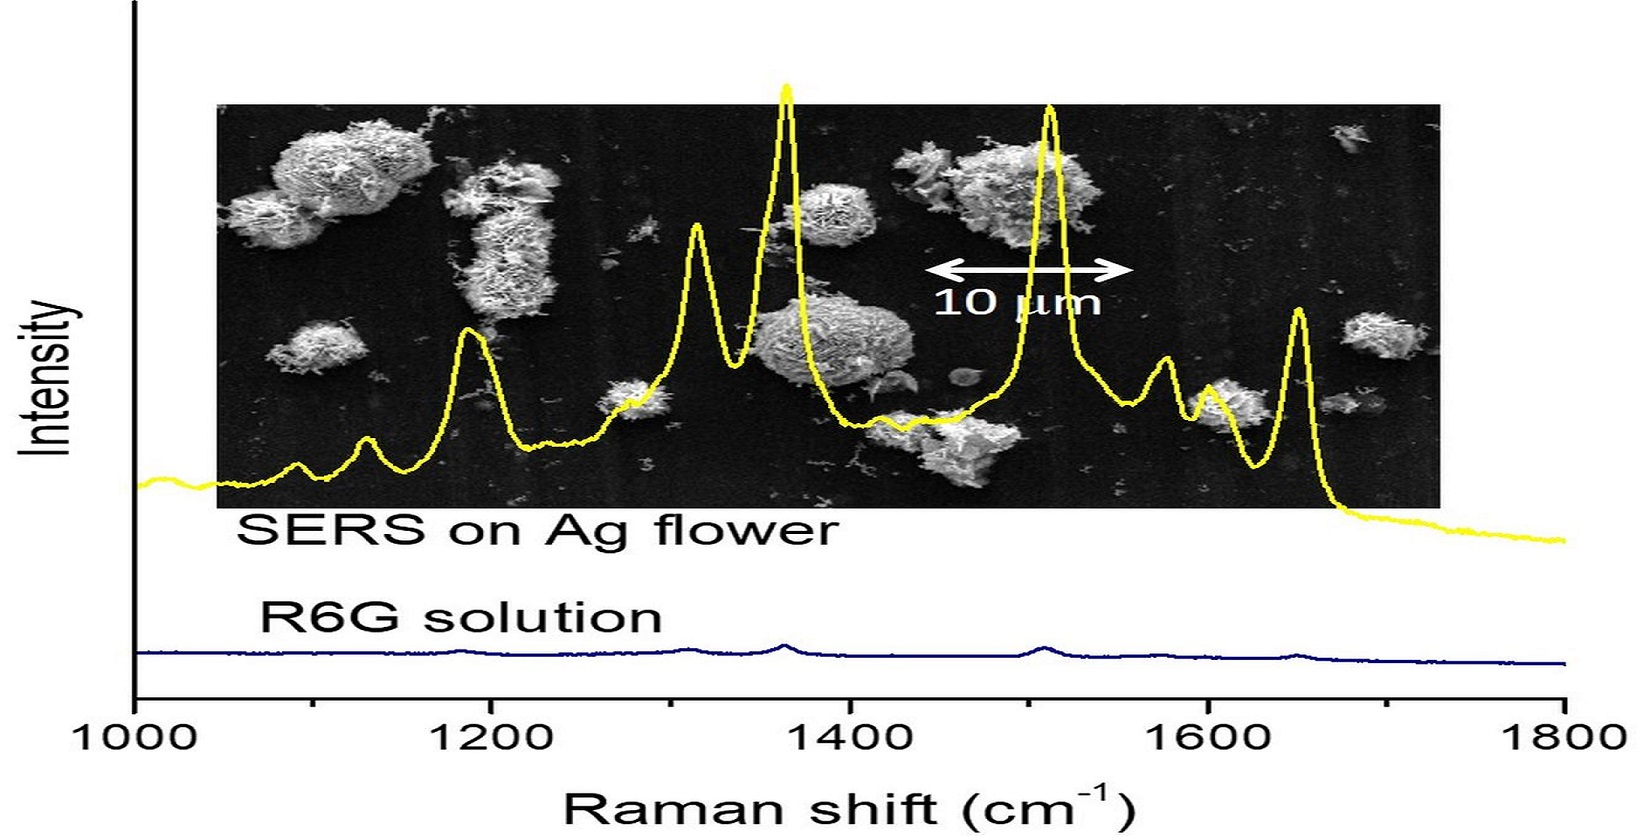
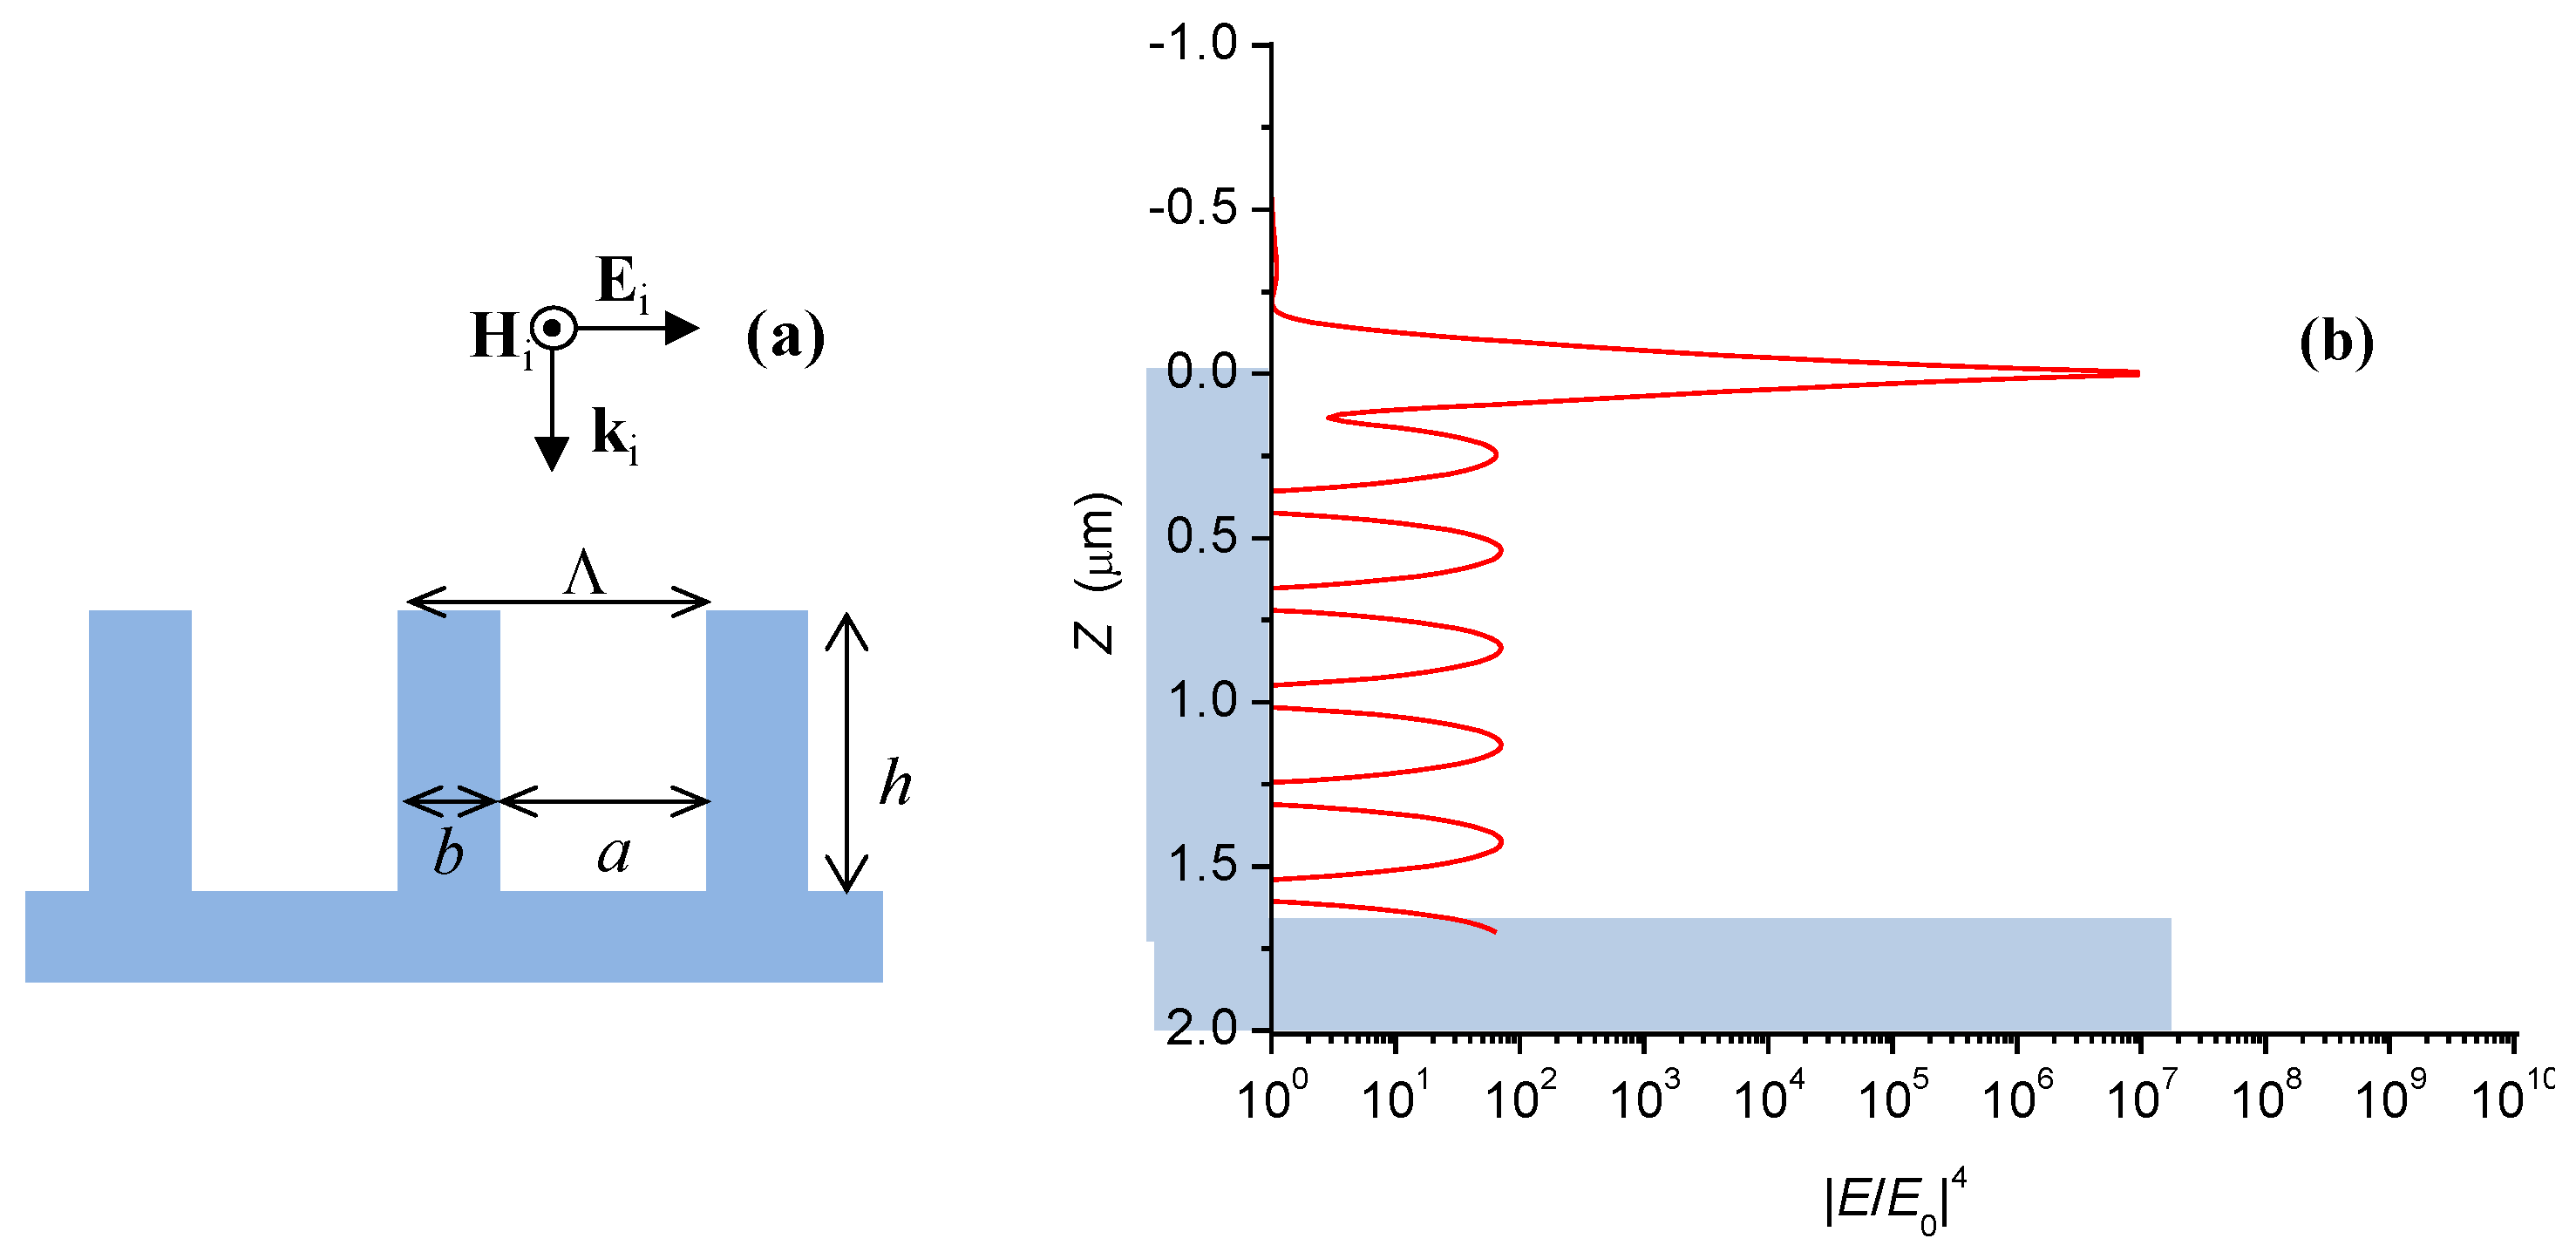
- Uneven distribution of the adsorbed molecules over the surface of the silver sheets. Plausibly, the R6G molecules are more likely to settle at the upper parts of the sheets, i.e., near the edges where the local electrodynamic enhancement is higher. This fact may explain qualitatively the experimental EF values superior to 105, which are higher than the calculated averaged EFs.
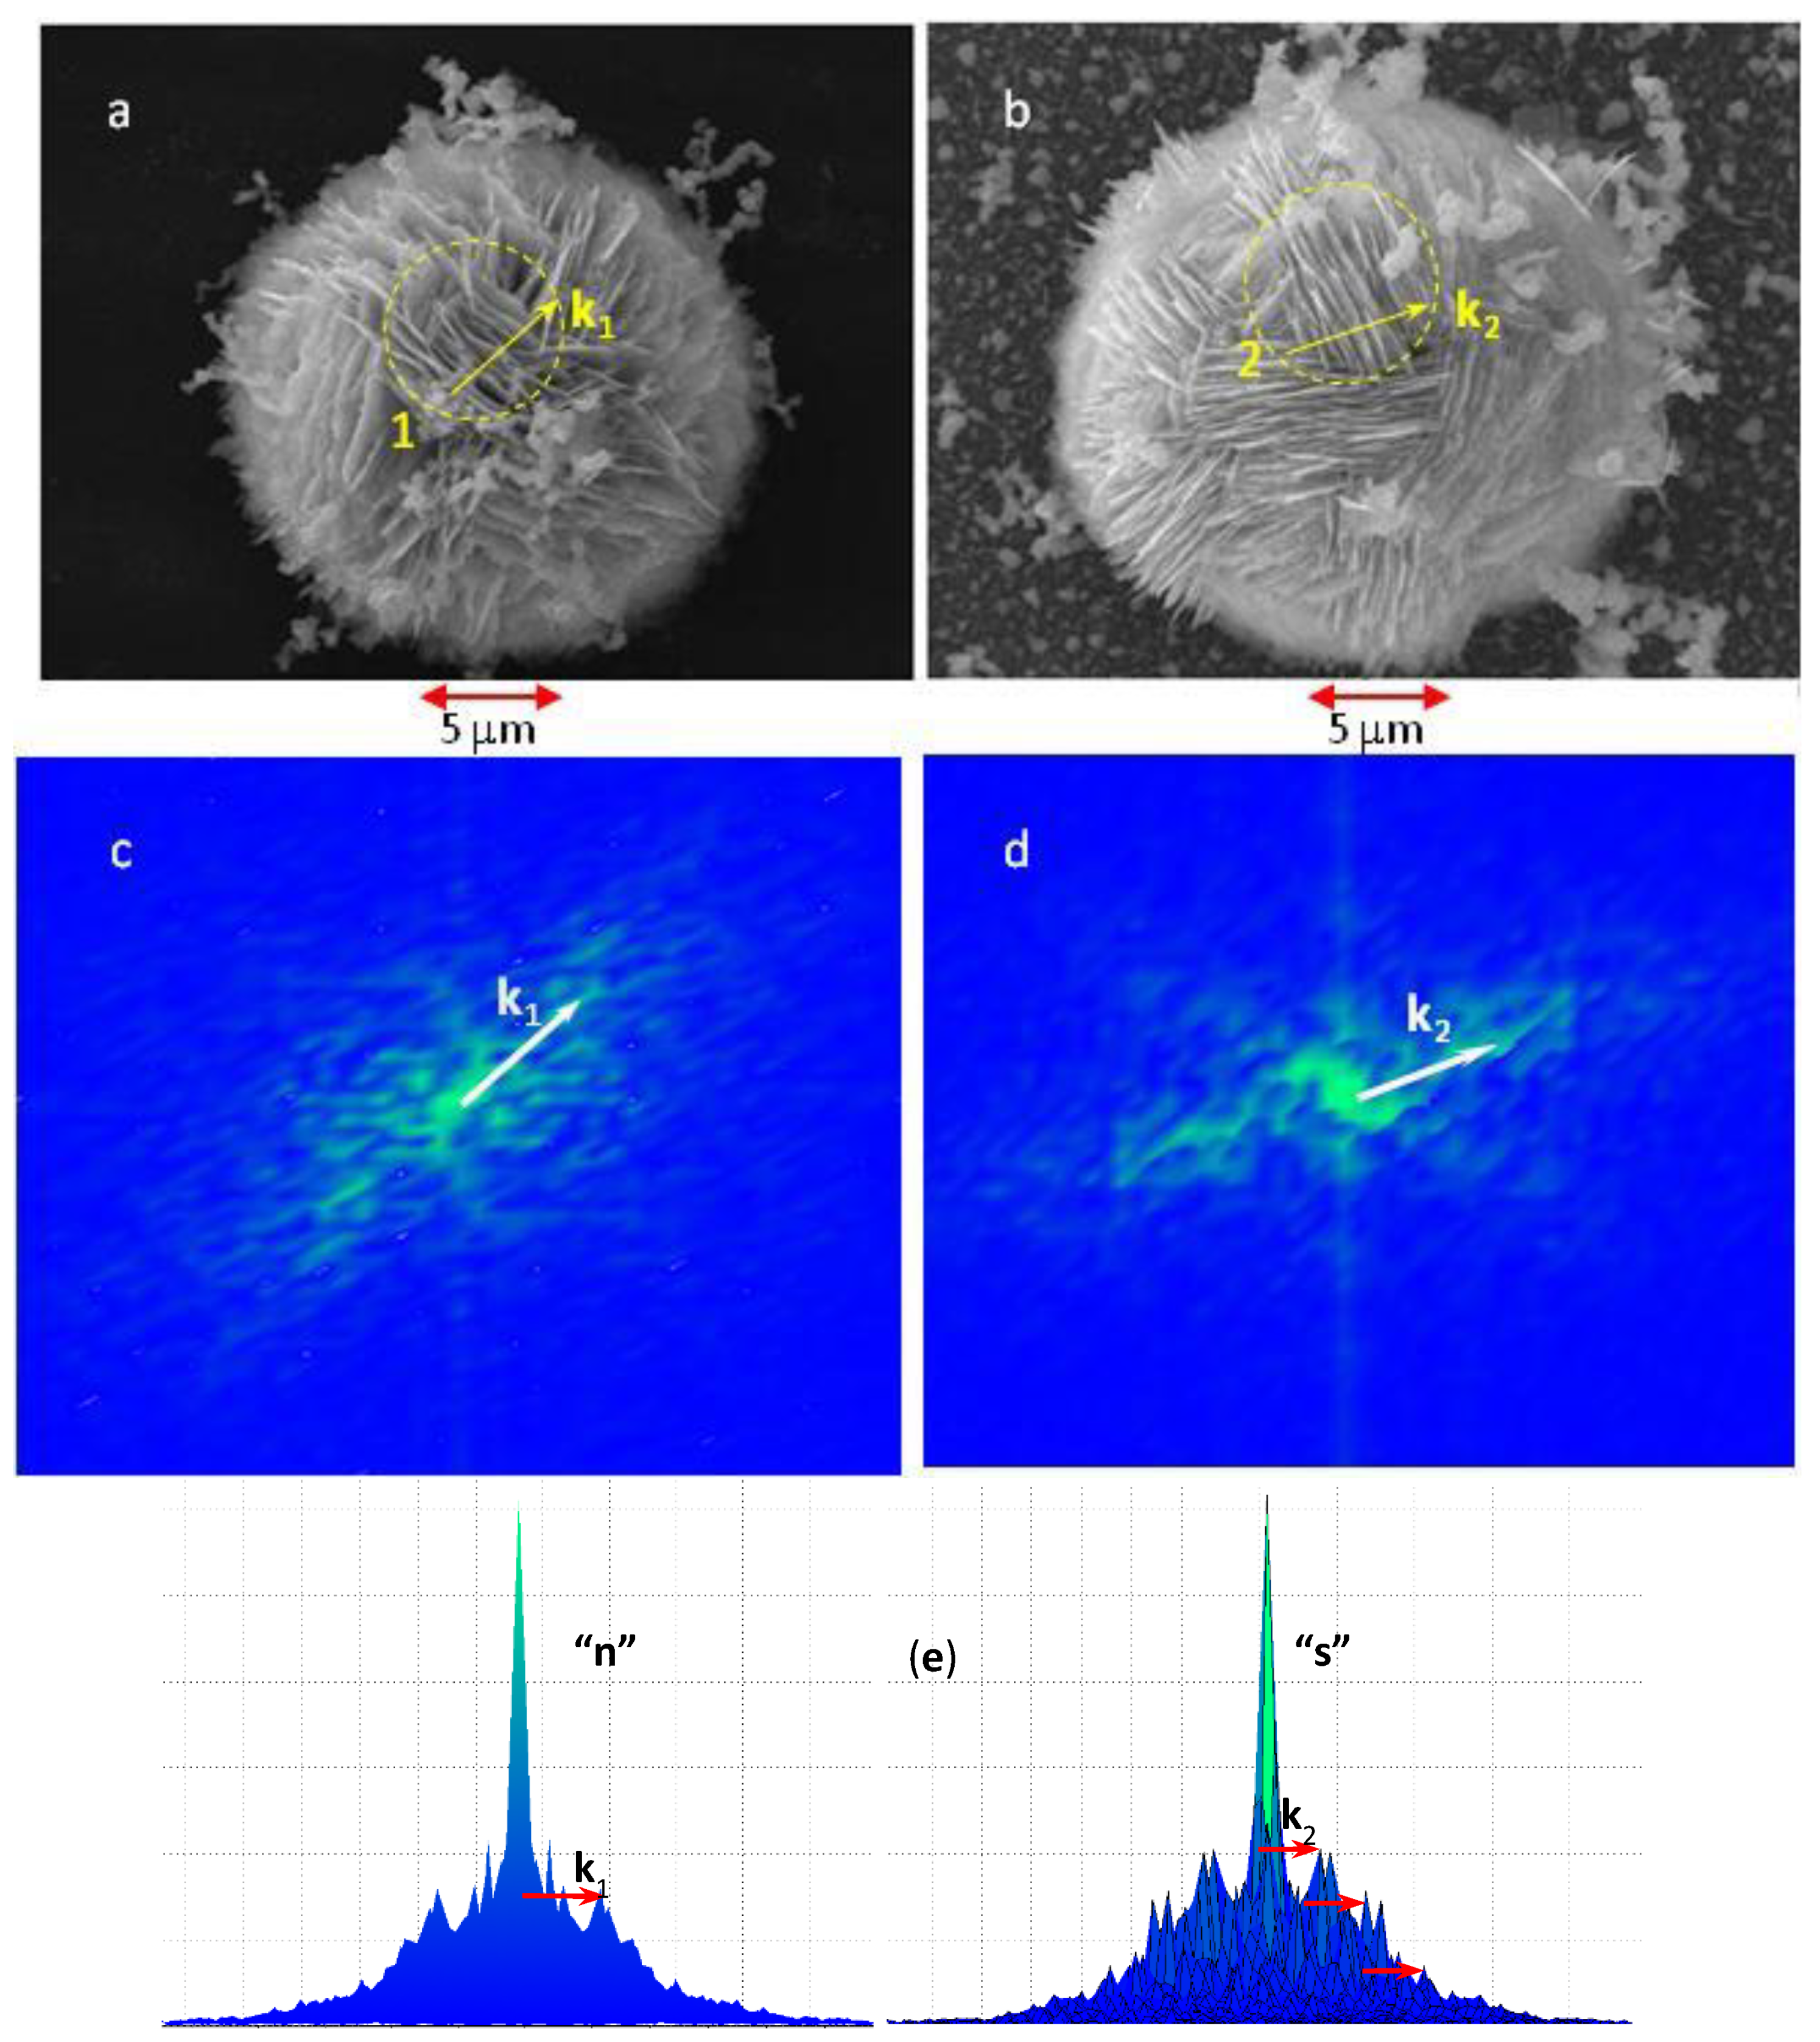
- Local field enhancement at the contact area between neighboring nanosheet arrays of different orientation. In these areas, the contacting nanosheets make an angle close to , which is also favorable for formation of linear hot spots.
- Field enhancement around defects on the surface of the silver sheets.
4. Summary and Conclusions
Author Contributions
Funding
Informed Consent Statement
Data Availability Statement
Acknowledgments
Conflicts of Interest
Appendix A


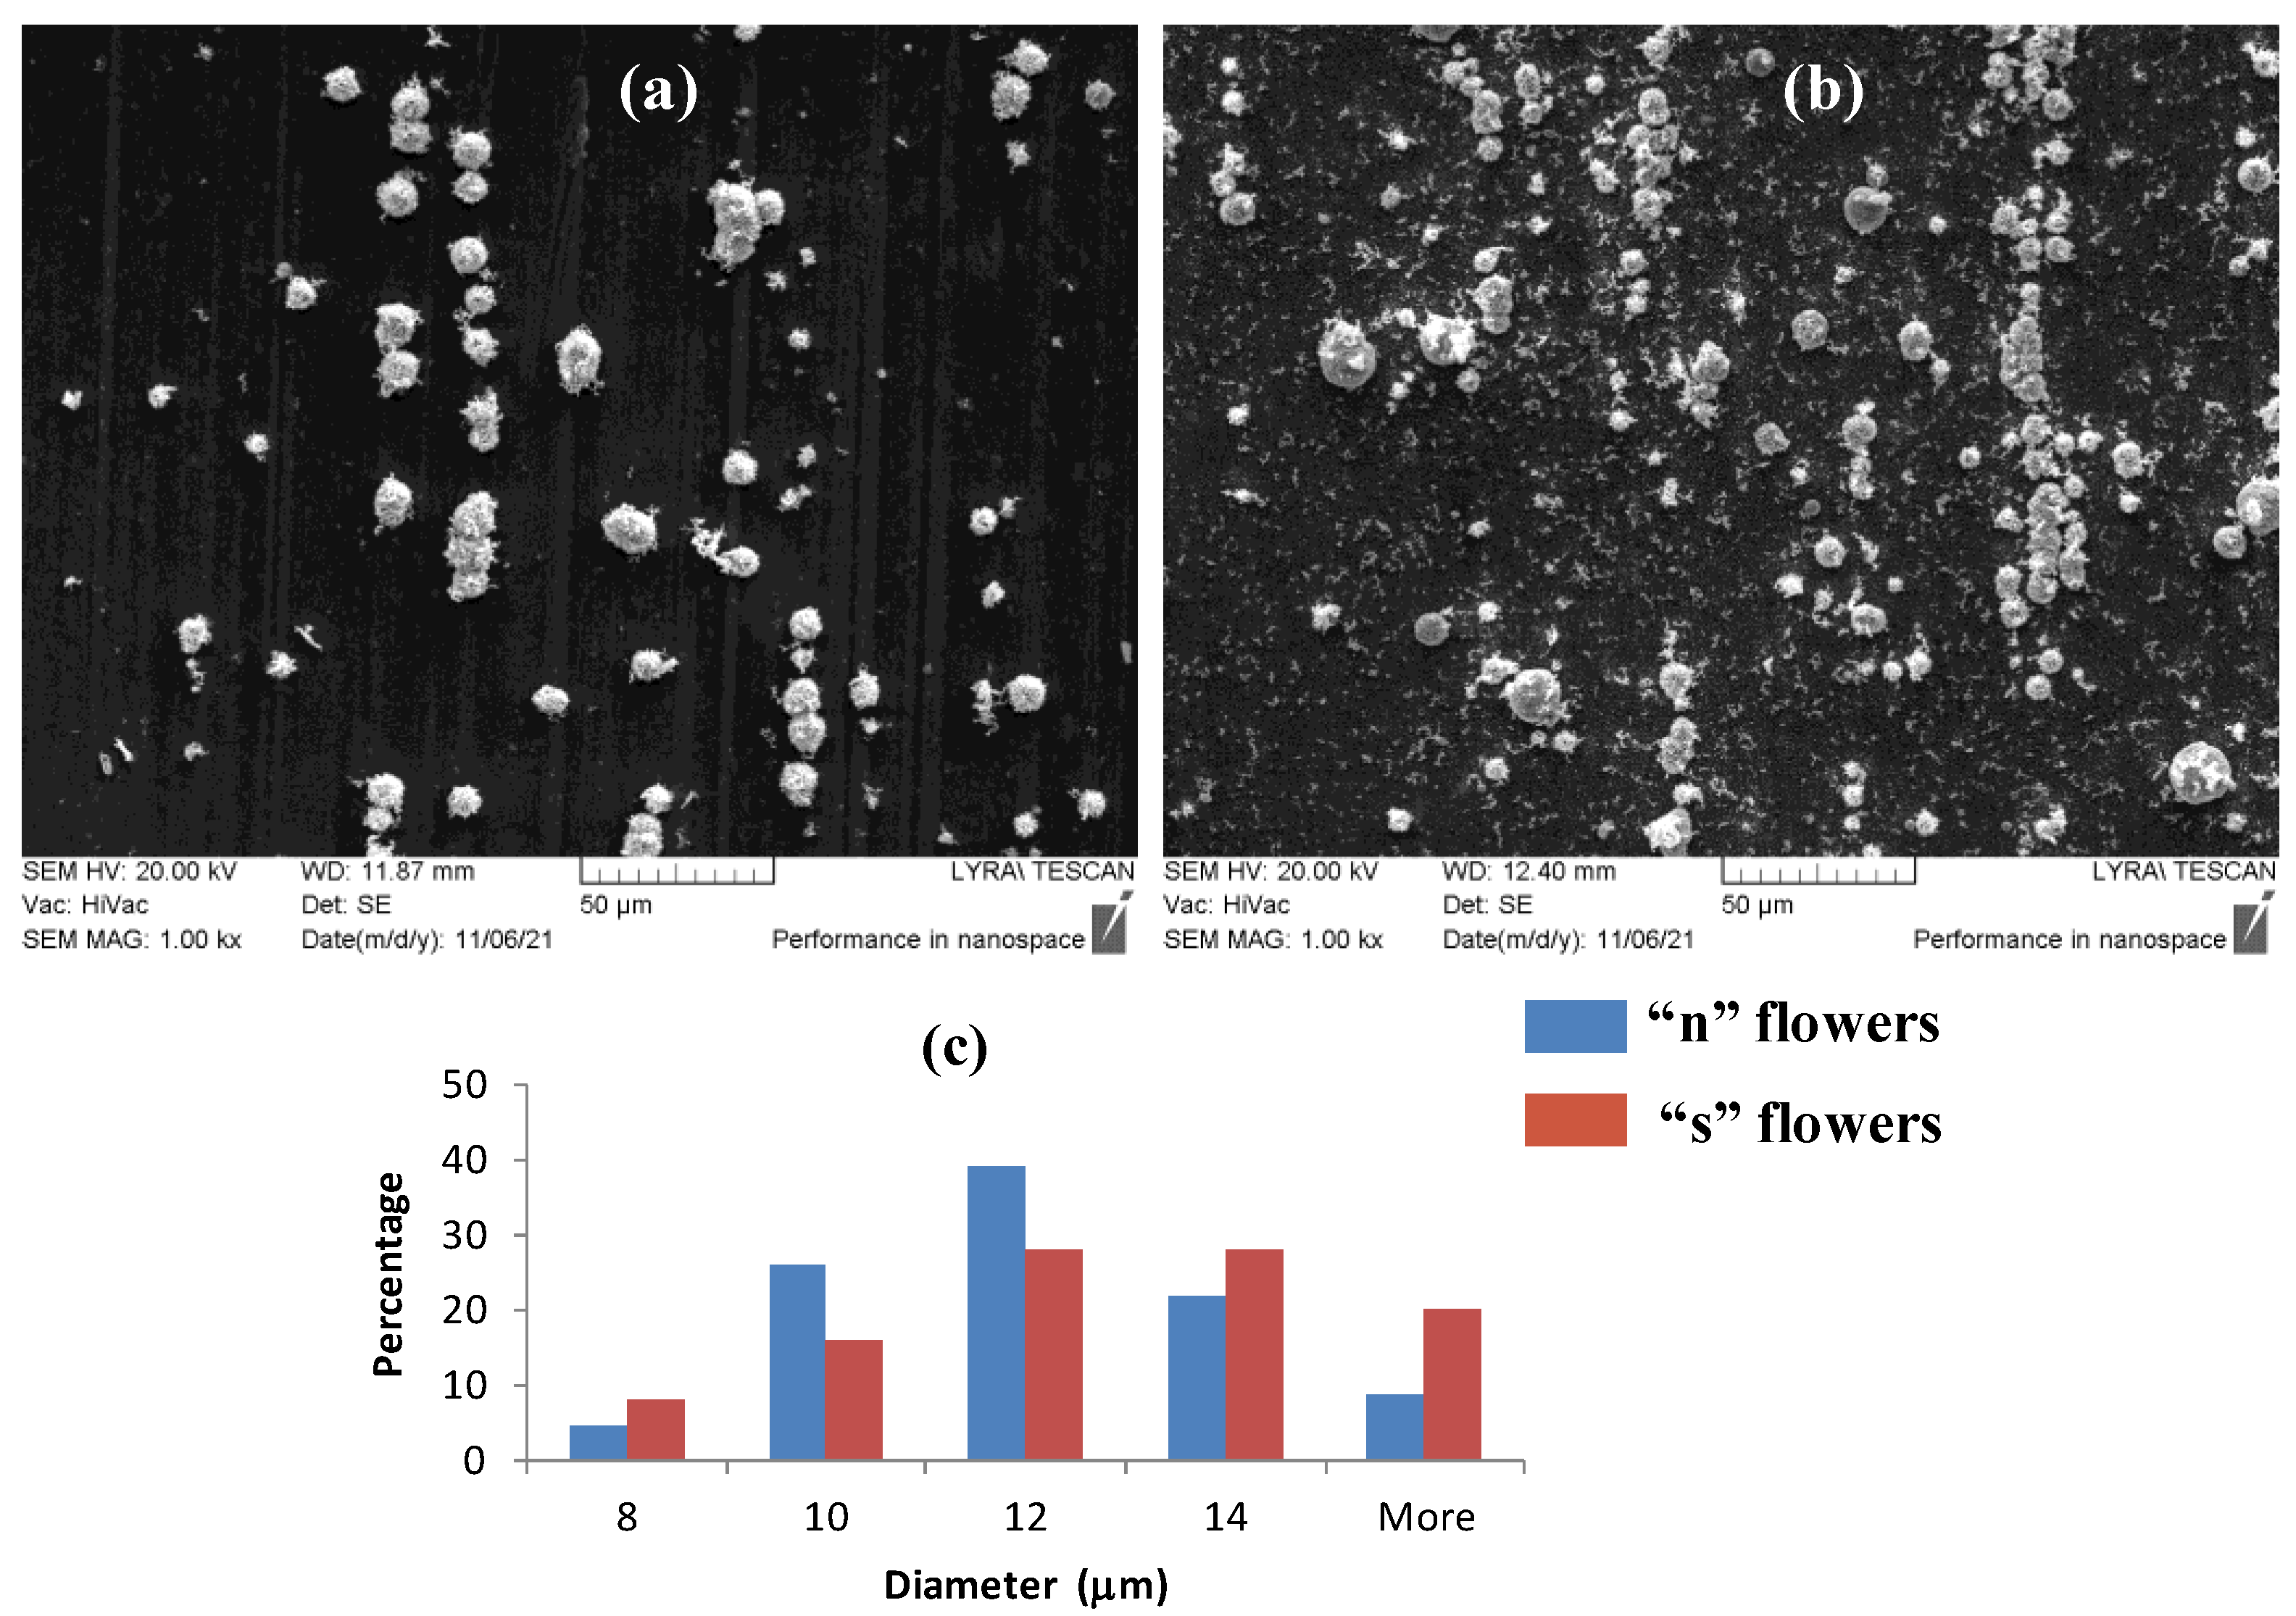
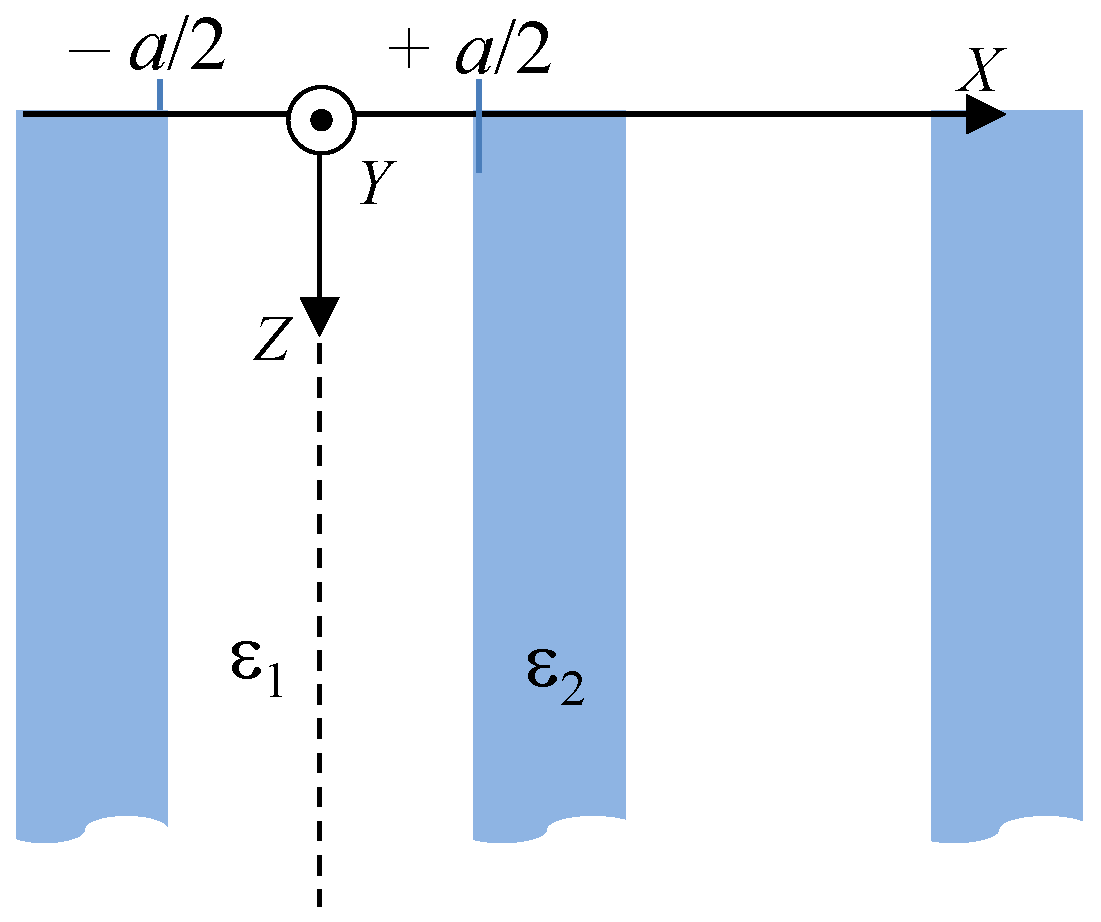
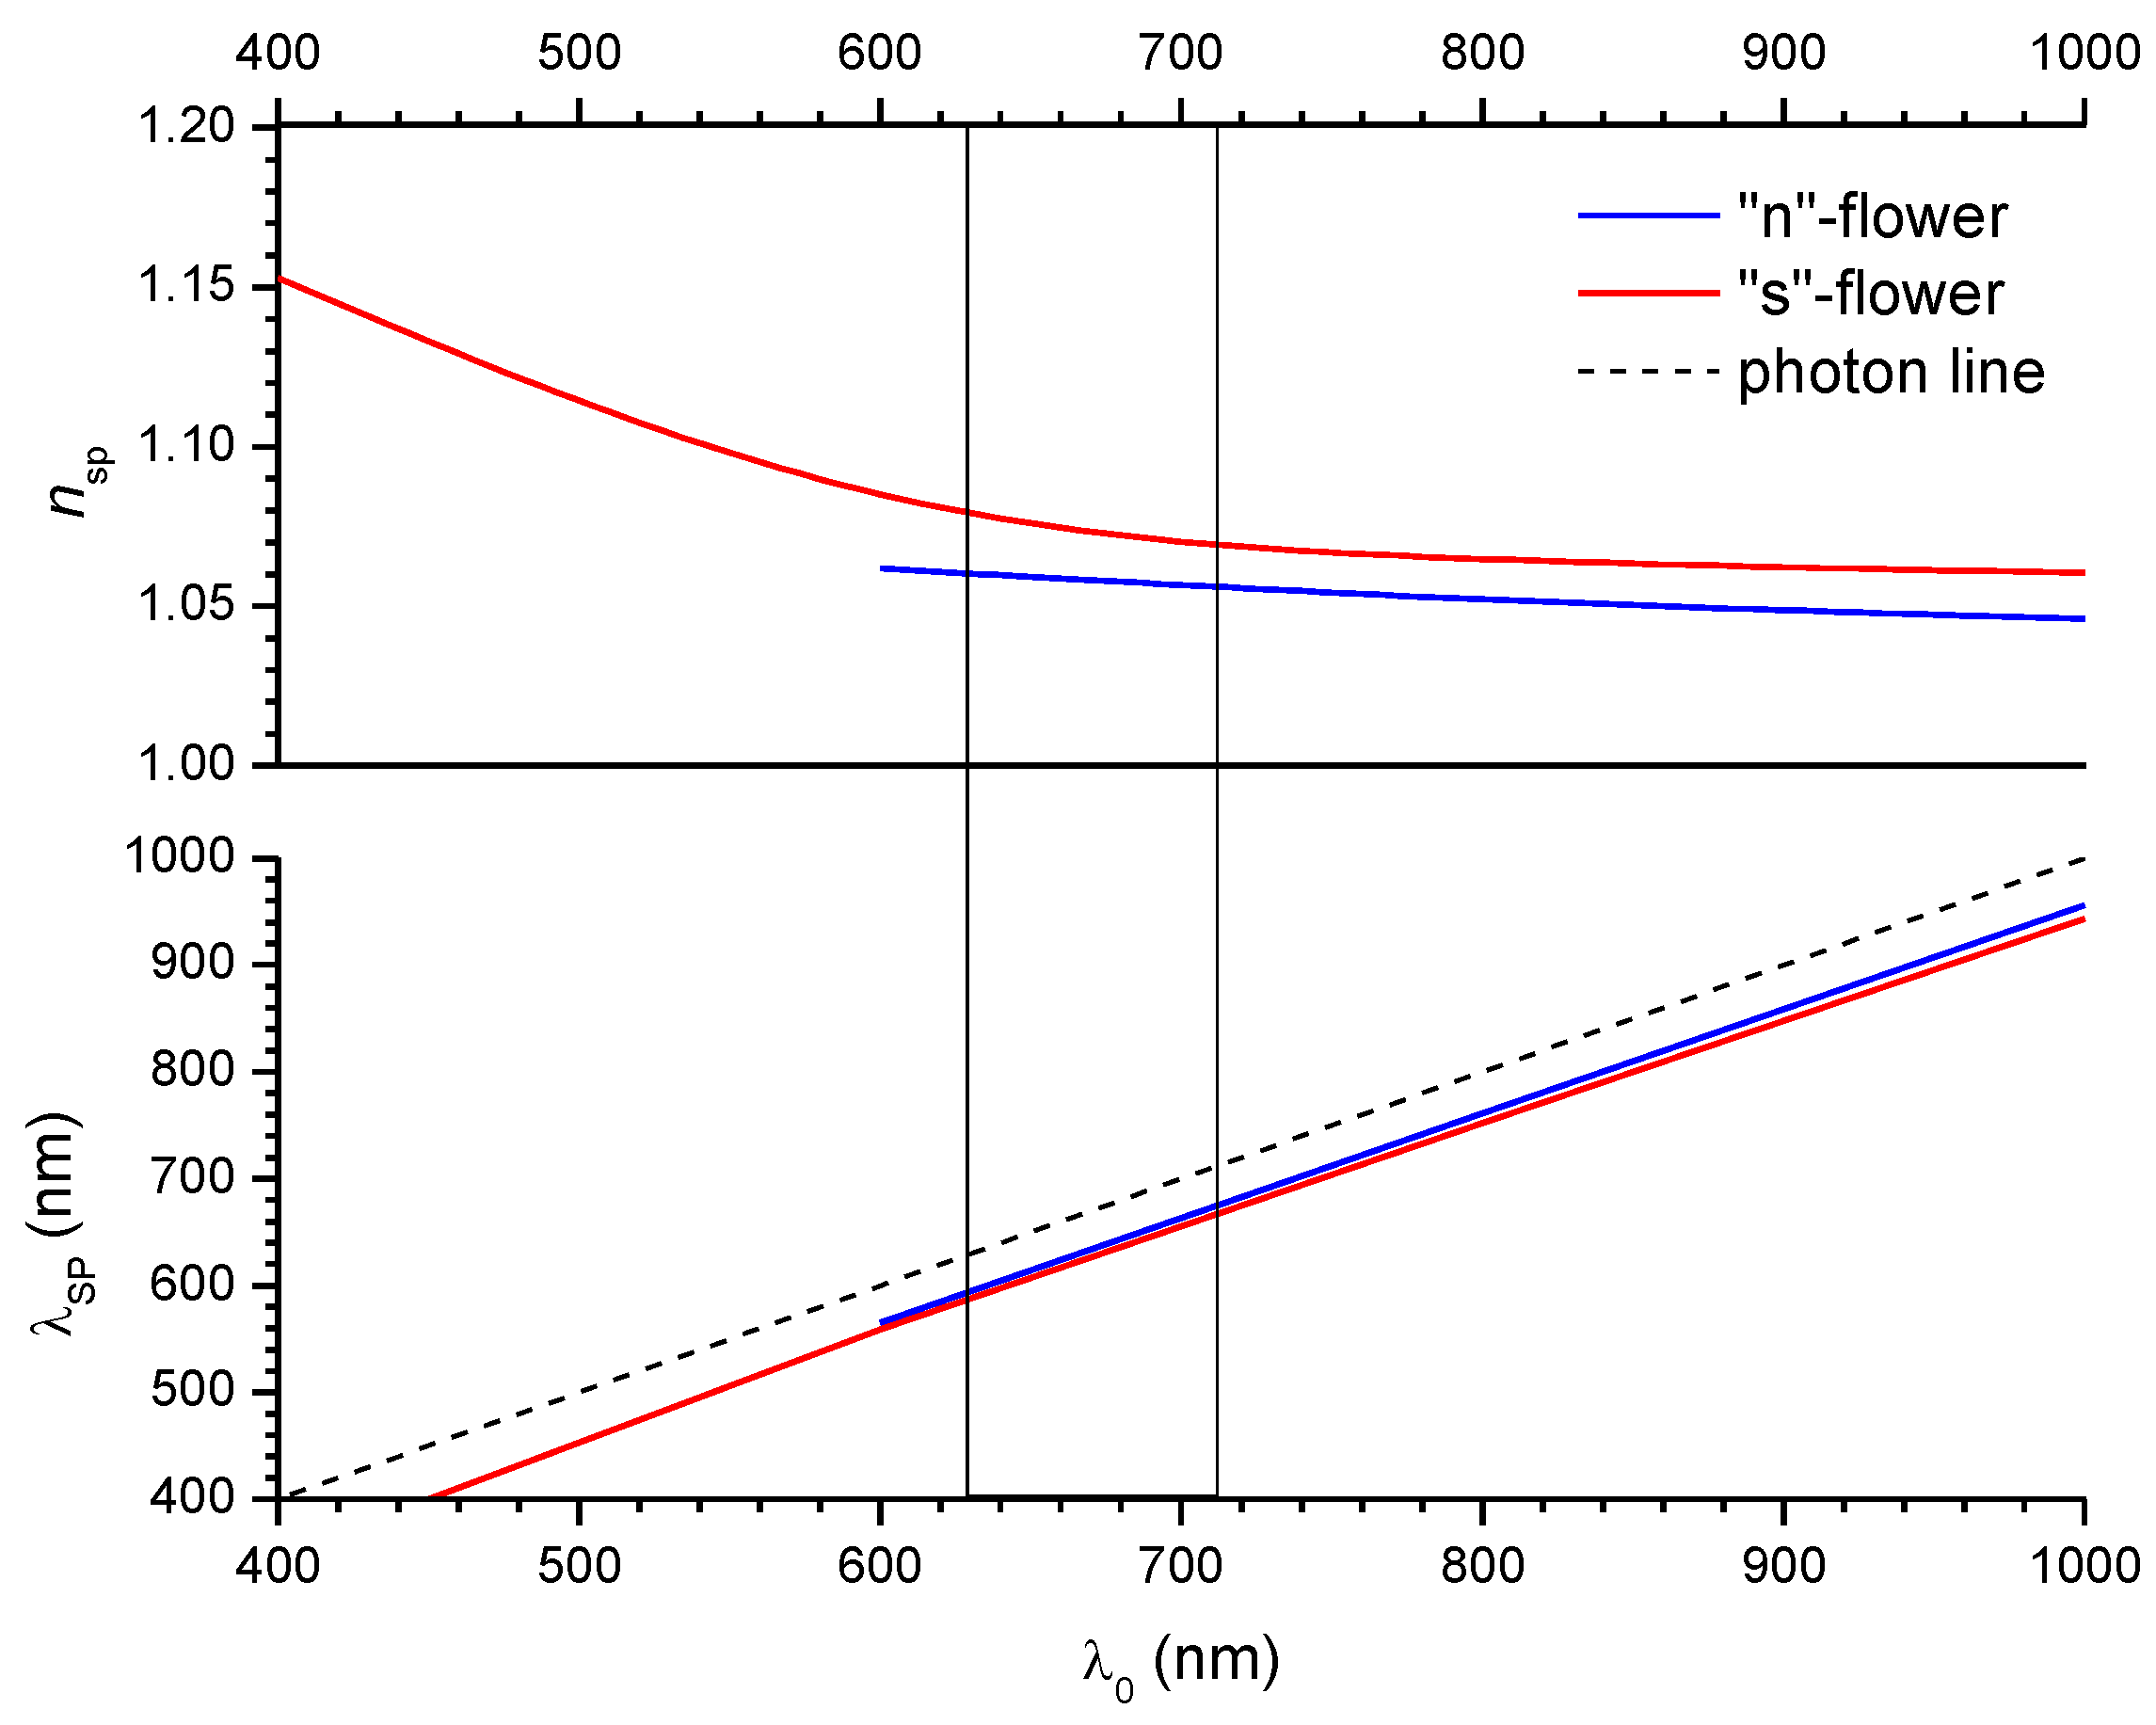
| Parameter | “n”-Flowers | “s”-Flowers |
|---|---|---|
| Λ (nm) | 580 | 390 |
| Filing factor F | 0.15 | 0.15 |
| a = (1 − F)Λ (nm) | 493 | 332 |
| b = FΛ (nm) | 87 | 58 |
| nSP (633 nm) | 1.060 | 1.079 |

References
- Campion, A.; Kambhampati, P. Surface-Enhanced Raman Scattering. Chem. Soc. Rev. 1998, 27, 241–250. [Google Scholar] [CrossRef]
- Tian, Z.Q. Surface-enhanced Raman spectroscopy: Advancements and applications. J. Raman Spectrosc. 2005, 36, 466–470. [Google Scholar] [CrossRef]
- Cialla, D.; März, A.; Böhme, R.; Theil, F.; Weber, K.; Schmitt, M.; Popp, J. Surface-enhanced Raman spectroscopy (SERS): Progress and trends. Anal. Bioanal. Chem. 2012, 403, 27–54. [Google Scholar] [CrossRef]
- Sharma, B.; Frontiera, R.R.; Henry, A.I.; Ringe, E.; Van Duyne, R.P. SERS: Materials, Applications, and the Future. Mater. Today 2012, 15, 16–25. [Google Scholar] [CrossRef]
- Zhang, W.; Yeo, B.S.; Schmid, A.T.; Zenobi, R. Single Molecule Tip-Enhanced Raman Spectroscopy with Silver Tips. J. Phys. Chem. C 2007, 111, 1733–1738. [Google Scholar] [CrossRef]
- Zrimsek, A.B.; Chiang, N.; Mattei, M.; Zaleski, S.; McAnally, M.O.; Chapman, C.T.; Henry, A.-I.; Schatz, G.C.; Van Duyne, R.P. Single-Molecule Chemistry with Surface- and Tip-Enhanced Raman Spectroscopy. Chem. Rev. 2016, 117, 7583–7613. [Google Scholar] [CrossRef]
- Zong, C.; Premasiri, R.; Lin, H.; Huang, Y.; Zhang, C.; Yang, C.; Ren, B.; Ziegler, L.D.; Cheng, J.-X. Plasmon-enhanced stimulated Raman scattering microscopy with single-molecule detection sensitivity. Nat. Commun. 2019, 10, 5318. [Google Scholar] [CrossRef]
- Chen, Y.; Premasiri, W.R.; Ziegler, L.D. Surface enhanced Raman spectroscopy of Chlamydia trachomatis and Neisseria gonorrhoeae for diagnostics, and extra-cellular metabolomics and biochemical monitoring. Sci. Rep. 2018, 8, 5163. [Google Scholar] [CrossRef] [PubMed]
- Felten, J.; Hall, H.; Jaumot, J.; Tauler, R.; de Juan, A.; Gorzsás, A. Vibrational spectroscopic image analysis of biological material using multivariate curve resolution–alternating least squares (MCR-ALS). Nat. Protoc. 2015, 10, 217–240. [Google Scholar] [CrossRef]
- Zong, C.; Xu, M.; Xu, L.-J.; Wei, T.; Ma, X.; Zheng, X.-S.; Hu, R.; Ren, B. Surface-Enhanced Raman Spectroscopy for Bioanalysis: Reliability and Challenges. Chem. Rev. 2018, 118, 4946–4980. [Google Scholar] [CrossRef]
- Kim, N.; Thomas, M.R.; Bergholt, M.S.; Pence, I.J.; Seong, H.; Charchar, P.; Todorova, N.; Nagelkerke, A.; Belessiotis-Richards, A.; Payne, D.J.; et al. Surface enhanced Raman scattering artificial nose for high dimensionality fingerprinting. Nat. Commun. 2020, 11, 207. [Google Scholar] [CrossRef]
- Kambhampati, P.; Child, C.M.; Foster, M.C.; Campion, A. On the chemical mechanism of surface enhanced Raman scattering: Experiment and theory. J. Chem. Phys. 1998, 108, 5013–5026. [Google Scholar] [CrossRef]
- Schatz, G.C.; Young, M.A.; Duyne, R.P. Electromagnetic Mechanism of SERS. In Surface-Enhanced Raman Scattering; Kneipp, K., Moskovits, M., Kneipp, H., Eds.; Topics in Applied Physics; Springer: Berlin/Heidelberg, Germany, 2006; Volume 103, pp. 19–45. [Google Scholar]
- West, P.; Ishii, S.; Naik, G.; Emani, N.K.; Shalaev, V.; Boltasseva, A. Searching for better plasmonic materials. Laser Photon. Rev. 2010, 4, 795–808. [Google Scholar] [CrossRef]
- Etchegoin, P.; Cohen, L.; Hartigan, H.; Brown, R.J.C.; Milton, M.J.T.; Gallop, J.C. Electromagnetic contribution to surface enhanced Raman scattering revisited. J. Chem. Phys. 2003, 119, 5281–5289. [Google Scholar] [CrossRef]
- McRae, D.; Lagugné-Labarthet, F. In search of the hot spot. Nat. Nanotechnol. 2019, 14, 922–923. [Google Scholar] [CrossRef] [PubMed]
- Pettinger, B.; Picardi, G.; Schuster, R.; Ertl, G. Surface-enhanced and STM-tip-enhanced Raman Spectroscopy at Metal Surfaces. Single Mol. 2002, 3, 285–294. [Google Scholar] [CrossRef]
- Steidtner, J.; Pettinger, B. Tip-Enhanced Raman Spectroscopy and Microscopy on Single Dye Molecules with 15 nm Resolution. Phys. Rev. Lett. 2008, 100, 236101. [Google Scholar] [CrossRef] [PubMed]
- Liu, Y.-C.; Yu, C.-C.; Sheu, S.-F. Low concentration rhodamine 6G observed by surface-enhanced Raman scattering on optimally electrochemically roughened silver substrates. J. Mater. Chem. 2006, 16, 3546–3551. [Google Scholar] [CrossRef]
- Yang, K.-H.; Liu, Y.-C.; Yu, C.-C. Simple Strategy to Improve Surface-Enhanced Raman Scattering Based on Electrochemically Prepared Roughened Silver Substrates. Langmuir 2010, 26, 11512–11517. [Google Scholar] [CrossRef]
- Kudelski, A.; Pisarek, M.; Roguska, A.; Holdynski, M.; Janik-Czachor, M. Surface-Enhanced Raman Scattering Investigations on Silver Nanoparticles Deposited on Alumina and Titania Nanotubes: Influence of the Substrate Material on Surface-Enhanced Raman Scattering Activity of Ag Nanoparticles: Surface-Enhanced Raman Scattering Investigations. J. Raman Spectrosc. 2012, 43, 1360–1366. [Google Scholar]
- Chen, Y.; Tian, G.; Pan, K.; Tian, C.; Zhou, J.; Zhou, W.; Rena, Z.; Fu, H. In Situ Controlled Growth of Well-Dispersed Gold Nanoparticles in TiO2 Nanotube Arrays as Recyclable Substrates for Surface-Enhanced Raman Scattering. Dalton Trans. 2012, 41, 1020. [Google Scholar] [CrossRef]
- Roguska, A.; Kudelski, A.; Pisarek, M.; Opara, M.; Janik-Czachor, M. Surface-Enhanced Raman Scattering (SERS) Activity of Ag, Au and Cu Nanoclusters on TiO2-Nanotubes/Ti Substrate. Appl. Surf. Sci. 2011, 257, 8182. [Google Scholar] [CrossRef]
- Panagopoulou, M.; Pantiskos, N.; Photopoulos, P.; Tang, J.; Tsoukalas, D.; Raptis, Y.S. Raman Enhancement of Rhodamine Adsorbed on Ag Nanoparticles Self-Assembled into Nanowire-like Arrays. Nanoscale Res. Lett. 2011, 6, 629. [Google Scholar] [CrossRef]
- Ritacco, T.; Ricciardi, L.; La Deda, M.; Giocondo, M. Controlling the optical creation of gold nanoparticles in a PVA matrix by direct laser writing. J. Eur. Opt. Soc. Rapid Publ. 2016, 11, 16008. [Google Scholar] [CrossRef]
- Ivanov, V.G.; Todorov, N.D.; Petrov, L.S.; Ritacco, T.; Giocondo, M.; Vlakhov, E.S. Strong surface enhanced Raman scattering from gold nanoarrays obtained by direct laser writing. J. Phys. Conf. Ser. 2016, 764, 012023. [Google Scholar] [CrossRef]
- Michaels, A.M.; Nirmal, M.; Brus, L.E. Surface Enhanced Raman Spectroscopy of Individual Rhodamine 6G Molecules on Large Ag Nanocrystals. J. Am. Chem. Soc. 1999, 121, 9932–9939. [Google Scholar] [CrossRef]
- Chen, H.; Simon, F.; Eychmüller, A. Large-Scale Synthesis of Micrometer-Sized Silver Nanosheets. J. Phys. Chem. C 2010, 114, 4495–4501. [Google Scholar] [CrossRef]
- Jie, Z.; Zenghe, Y.; Tiancheng, G.; Yunfei, L.; Dapeng, W.; Yong, Z. Graphene/Ag nanoholes composites for quantitative surface-enhanced Raman scattering. Opt. Express 2018, 26, 22432–22439. [Google Scholar] [CrossRef]
- Vigderman, L.; Zubarev, E.R. Starfruit-Shaped Gold Nanorods and Nanowires: Synthesis and SERS Characterization. Langmuir 2012, 28, 9034–9040. [Google Scholar] [CrossRef]
- Lee, M.-K.; Seo, J.; Cho, S.J.; Jo, Y.; Kim, S.; Kang, Y.; Lee, H. Novel 3D arrays of gold nanostructures on suspended platinum-coated carbon nanotubes as surface-enhanced Raman scattering substrates. Mater. Lett. 2012, 81, 9–12. [Google Scholar] [CrossRef]
- Ding, S.-Y.; Yi, J.; Li, J.-F.; Ren, B.; Wu, D.-Y.; Panneerselvam, R.; Tian, Z.-Q. Nanostructure-based plasmon-enhanced Raman spectroscopy for surface analysis of materials. Nat. Rev. Mater. 2016, 1, 16021. [Google Scholar] [CrossRef]
- Nafie, L.A. Recent Advances in Linear and Nonlinear Raman Spectroscopy. Part VI: Recent Advances in Linear and Nonlinear Raman Spectroscopy. Part XVI. J. Raman Spectrosc. 2012, 43, 1845–1863. [Google Scholar] [CrossRef]
- Chen, J.; Mårtensson, T.; Dick, K.; Deppert, K.; Xu, H.; Samuelson, L.; Xu, H.X. Surface-enhanced Raman scattering of rhodamine 6G on nanowire arrays decorated with gold nanoparticles. Nanotechnology 2008, 19, 275712. [Google Scholar] [CrossRef] [PubMed]
- Nasrollahzadeh, M.; Issaabadi, Z.; Sajjadi, M.; Sajadi, S.M.; Atarod, M. Types of Nanostructures. In Interface Science and Technology; Elsevier: Amsterdam, The Netherlands, 2019; Volume 28, pp. 29–80. [Google Scholar]
- Shende, P.; Kasture, P.; Gaud, R. Nanoflowers: The future trend of nanotechnology for multi-applications. Artif. Cells Nanomed. Biotechnol. 2018, 46 (Suppl. 1), 413–422. [Google Scholar] [CrossRef]
- Liang, H.; Li, Z.; Wang, W.; Wu, Y.; Xu, H. Highly Surface-Roughened “Flower-like” Silver Nanoparticles for Extremely Sensitive Substrates of Surface-Enhanced Raman Scattering. Adv. Mater. 2009, 21, 4614–4618. [Google Scholar] [CrossRef]
- Xing, C.; Zhong, S.; Yu, J.; Li, X.; Cao, A.; Men, D.; Wu, B.; Cai, W.; Li, Y. Two-dimensional flower-shaped Au@Ag nanoparticle arrays as effective SERS substrates with high sensitivity and reproducibility for detection of thiram. J. Mater. Chem. C 2020, 8, 3838–3845. [Google Scholar] [CrossRef]
- Yang, J.; Cao, B.; Li, H.; Liu, B. Investigation of the catalysis and SERS properties of flower-like and hierarchical silver microcrystals. J. Nanopart. Res. 2014, 16, 2651. [Google Scholar] [CrossRef]
- Zhang, G.; Deng, C.; Shi, H.; Zou, B.; Li, Y.; Liu, T.; Wang, W. ZnO/Ag composite nanoflowers as substrates for surface-enhanced Raman scattering. Appl. Surf. Sci. 2017, 402, 154–160. [Google Scholar] [CrossRef]
- Tsutsumanova, G.; Lyutov, L.; Tzonev, A.; Russev, S. Ordering of silver flowerlike nanosheet structures on an aluminium substrate. Mater. Lett. 2008, 62, 3588–3590. [Google Scholar] [CrossRef]
- He, Y.; Wu, X.; Lu, G.; Shi, G. Fabrication of two-dimensional staggered silver nanosheets on an aluminium foil. Nanotechnology 2005, 16, 791–796. [Google Scholar] [CrossRef][Green Version]
- Le Ru, E.C.; Etchegoin, P.G. Quantifying SERS enhancements. MRS Bull. 2013, 38, 631–640. [Google Scholar] [CrossRef]
- Ojha, A.K.; Donfack, P.; Materny, A. Complex Concentration Dependence of SERS and UV-Vis Absorption of Glycine/Ag-Substrates Because of Glycine-Mediated Ag-Nanostructure Modifications: Complex Concentration Dependence of SERS and UV-Vis Absorption of Glycine/Ag-Substrates. J. Raman Spectrosc. 2012, 43, 1183–1190. [Google Scholar] [CrossRef]
- Gamberini, M.C.; Mary, Y.S.; Mary, Y.S.; Krátký, M.; Vinsova, J.; Baraldi, C. Spectroscopic investigations, concentration dependent SERS, and molecular docking studies of a benzoic acid derivative. Spectrochim. Acta A Mol. Biomol. Spectrosc. 2021, 248, 119265. [Google Scholar] [CrossRef] [PubMed]
- Miyazaki, H.T.; Kurokawa, Y. Controlled plasmon resonance in closed metal/insulator/metal nanocavities. Appl. Phys. Lett. 2006, 89, 211126. [Google Scholar] [CrossRef]
- Kurokawa, Y.; Miyazaki, H. Metal-insulator-metal plasmon nanocavities: Analysis of optical properties. Phys. Rev. B 2007, 75, 035411. [Google Scholar] [CrossRef]
- Xu, S.; Su, H.; Qin, K.; Xie, Y.; Wang, Q.; Zhang, X.; Lu, Y.; Zhu, Y. SERS Application of Propagating Surface Plasmon Modes in 1D Metallic Gratings. In Proceedings of the Applied Optics and Photonics China (AOPC2015), Beijing, China, 5–7 May 2015; p. 96730T. [Google Scholar]
- Yaremchuk, I.; Petrovska, H.; Karelko, I.; Fitio, V.; Bobitski, Y. Optimization of the Grating-Based Structures for the Efficient SERS Substrates. In Proceedings of the 2017 IEEE 37th International Conference on Electronics and Nanotechnology (ELNANO), Kyiv, Ukraine, 18–20 April 2017; pp. 119–123. [Google Scholar]
- Mattiucci, N.; D’Aguanno, G.; Everitt, H.; Foreman, J.V.; Callahan, J.M.; Buncick, M.C.; Bloemer, M.J. Ultraviolet surface-enhanced Raman scattering at the plasmonic band edge of a metallic grating. Opt. Express 2012, 20, 1868–1877. [Google Scholar] [CrossRef] [PubMed]
- Turunen, J.; Tervo, J. Fourier Modal Method and Its Applications to Inverse Diffraction, Near-Field Imaging, and Nonlinear Optics. In Fringe 2013; Osten, W., Ed.; Springer: Berlin/Heidelberg, Germany, 2014; pp. 25–33. [Google Scholar] [CrossRef]
- Johnson, P.B.; Christy, R.W. Optical Constants of the Noble Metals. Phys. Rev. B 1972, 6, 4370–4379. [Google Scholar] [CrossRef]
- Polyanskiy, M.N. Refractive Index Database. Available online: https://refractiveindex.info (accessed on 15 October 2021).


| Mode Frequency (cm–1) | Dilution Order | |||||||||
|---|---|---|---|---|---|---|---|---|---|---|
| 0 EF (×102) | 1 EF (×103) | 2 EF (×103) | 3 EF (×104) | 4 EF (×105) | ||||||
| 1089 | 1.6 | 7.4 | 1.1 | 34 | 5.9 | 26 | 21 | 27 | 1.3 | 8.2 |
| 1126 | 0.6 | 1.5 | 0.3 | 0.4 | 1.5 | 0.4 | 1.0 | 0.4 | 0.07 | 0.6 |
| 1183 | 6.4 | 6.3 | 1.1 | 5.3 | 9.7 | 2.2 | 6.4 | 0.5 | 0.07 | 0.8 |
| 1273 | 5.9 | 5.8 | 0.2 | 2.8 | 1.3 | 2.5 | 3.6 | 3.0 | 0.29 | 2.7 |
| 1309 | 3.2 | 3.3 | 0.9 | 4.6 | 5.9 | 3.6 | 7.7 | 3.9 | 0.25 | 0.9 |
| 1364 | 5.5 | 4.7 | 1.2 | 5.7 | 10 | 6.4 | 13 | 2.3 | 0.50 | 1.6 |
| 1509 | 5.9 | 5.2 | 1.5 | 3.6 | 12 | 4.8 | 11 | 1.6 | 0.29 | 0.3 |
| 1571 | 4.2 | 3.6 | 0.6 | 2.5 | 7.1 | 2.9 | 9.9 | 3.3 | 0.32 | 1.7 |
| 1598 | 1.8 | 1.2 | 0.3 | 2.2 | 2.5 | 2.1 | 8.1 | 3.1 | 0.32 | 0.7 |
| 1651 | 4.3 | 4.3 | 1.3 | 3.2 | 7.8 | 4.0 | 9.4 | 1.8 | 0.26 | 0.8 |
| SAEF | 4.0 × 10² | 4.1 × 10² | 8.6 × 10² | 3.2 × 10³ | 7.1 × 10³ | 4.0 × 10³ | 8.3 × 10⁴ | 2.5 × 10⁴ | 3.0 × 10⁴ | 1.1 × 10⁵ |
Publisher’s Note: MDPI stays neutral with regard to jurisdictional claims in published maps and institutional affiliations. |
© 2021 by the authors. Licensee MDPI, Basel, Switzerland. This article is an open access article distributed under the terms and conditions of the Creative Commons Attribution (CC BY) license (https://creativecommons.org/licenses/by/4.0/).
Share and Cite
Tsutsumanova, G.G.; Todorov, N.D.; Russev, S.C.; Abrashev, M.V.; Ivanov, V.G.; Lukoyanov, A.V. Silver Flowerlike Structures for Surface-Enhanced Raman Spectroscopy. Nanomaterials 2021, 11, 3184. https://doi.org/10.3390/nano11123184
Tsutsumanova GG, Todorov ND, Russev SC, Abrashev MV, Ivanov VG, Lukoyanov AV. Silver Flowerlike Structures for Surface-Enhanced Raman Spectroscopy. Nanomaterials. 2021; 11(12):3184. https://doi.org/10.3390/nano11123184
Chicago/Turabian StyleTsutsumanova, Gitchka G., Neno D. Todorov, Stoyan C. Russev, Miroslav V. Abrashev, Victor G. Ivanov, and Alexey V. Lukoyanov. 2021. "Silver Flowerlike Structures for Surface-Enhanced Raman Spectroscopy" Nanomaterials 11, no. 12: 3184. https://doi.org/10.3390/nano11123184
APA StyleTsutsumanova, G. G., Todorov, N. D., Russev, S. C., Abrashev, M. V., Ivanov, V. G., & Lukoyanov, A. V. (2021). Silver Flowerlike Structures for Surface-Enhanced Raman Spectroscopy. Nanomaterials, 11(12), 3184. https://doi.org/10.3390/nano11123184