
Ultrafast Quenching of Excitons in the ZnxCd1−xS/ZnS Quantum Dots Doped with Mn2+ through Charge Transfer Intermediates Results in Manganese Luminescence

 , ,
, , 
Abstract
:1. Introduction
2. Materials and Methods
3. Results and Discussion
3.1. QDs Characterization
3.2. Femtosecond Transient Absorption (TA) Spectra
3.3. Distribution of Relaxation Processes in the Photoinduced Transient Absorption
3.4. Decomposition of Transient Absorption into Gaussian Components
4. Conclusions
Supplementary Materials
Author Contributions
Funding
Institutional Review Board Statement
Acknowledgments
Conflicts of Interest
References
- Shan, S.P.; Chen, S.H.; Zhuang, R.Z.; Hu, C. Influence of magnetic field on the properties of polaron in an asymmetric quantum dot. Int. J. Mod. Phys. B 2019, 33, 1950263. [Google Scholar] [CrossRef]
- Rastrello, L.R.; Guimarães, E.V.; da Silva, M.A.T.; Dantas, N.O.; Cano, N.F.; Lourenço, S.A.; da Silva, R.S. Effect of thermal annealing and sp − d exchange interaction in the optical properties of Mn2+-doped PbS nanocrystals embedded in a glass matrix. J. Lumin. 2020, 222, 117144. [Google Scholar] [CrossRef]
- Mehata, M.S.; Ratnesh, R.K. Luminescence properties and exciton dynamics of core-multi-shell semiconductor quantum dots leading to QLEDs. Dalt. Trans. 2019, 48, 7619–7631. [Google Scholar] [CrossRef]
- Rice, W.D.; Liu, W.; Pinchetti, V.; Yakovlev, D.R.; Klimov, V.I.; Crooker, S.A. Direct Measurements of Magnetic Polarons in Cd1-xMnxSe Nanocrystals from Resonant Photoluminescence. Nano Lett. 2017, 17, 3068–3075. [Google Scholar] [CrossRef] [PubMed] [Green Version]
- McLaurin, E.J.; Vlaskin, V.A.; Gamelin, D.R. Water-soluble dual-emitting nanocrystals for ratiometric optical thermometry. J. Am. Chem. Soc. 2011, 133, 14978–14980. [Google Scholar] [CrossRef]
- Li, C.; Wu, P. Cu-doped quantum dots: A new class of near-infrared emitting fluorophores for bioanalysis and bioimaging. Luminescence 2019, 34, 782–789. [Google Scholar] [CrossRef] [PubMed]
- Archer, P.I.; Santangelo, S.A.; Gamelin, D.R. Direct observation of sp − d exchange interactions in colloidal Mn2+- and Co2+-doped CdSe quantum dots. Nano Lett. 2007, 7, 1037–1043. [Google Scholar] [CrossRef]
- Delikanli, S.; Akgul, M.Z.; Murphy, J.R.; Barman, B.; Tsai, Y.; Scrace, T.; Zhang, P.; Bozok, B.; Hernández-Martínez, P.L.; Christodoulides, J.; et al. Mn2+-Doped CdSe/CdS Core/Multishell Colloidal Quantum Wells Enabling Tunable Carrier-Dopant Exchange Interactions. ACS Nano 2015, 9, 12473–12479. [Google Scholar] [CrossRef] [PubMed]
- Nelson, H.D.; Bradshaw, L.R.; Barrows, C.J.; Vlaskin, V.A.; Gamelin, D.R. Picosecond Dynamics of Excitonic Magnetic Polarons in Colloidal Diffusion-Doped Cd1−xMnxSe Quantum Dots. ACS Nano 2015, 9, 11177–11191. [Google Scholar] [CrossRef]
- Pradhan, N.; Sarma, D.D. Advances in light-emitting doped semiconductor nanocrystals. J. Phys. Chem. Lett. 2011, 2, 2818–2826. [Google Scholar] [CrossRef]
- Chen, H.Y.; Son, D.H. Energy and charge transfer dynamics in doped semiconductor nanocrystals. Isr. J. Chem. 2012, 52, 1016–1026. [Google Scholar] [CrossRef]
- Barman, B.; Pientka, J.M.; Murphy, J.R.; Cartwright, A.N.; Chou, W.C.; Fan, W.C.; Oszwałdowski, R.; Petrou, A. Circular Polarization Dynamics during Magnetic Polaron Formation in Type-II Magnetic Quantum Dots. J. Phys. Chem. C 2020, 124, 12766–12773. [Google Scholar] [CrossRef]
- Qiao, T.; Parobek, D.; Son, D.H.; Son, D.H. Photons and charges from colloidal doped semiconductor quantum dots. J. Mater. Chem. C 2019, 7, 14788–14797. [Google Scholar] [CrossRef]
- Batista, E.A.; Silva, A.C.A.; de Lima, T.K.; Guimarães, E.V.; da Silva, R.S.; Dantas, N.O. Effect of the location of Mn2+ ions in the optical and magnetic properties of ZnO nanocrystals. J. Alloys Compd. 2021, 850, 156611. [Google Scholar] [CrossRef]
- Viswanatha, R.; Pietryga, J.M.; Klimov, V.I.; Crooker, S.A. Spin-polarized Mn2+ emission from mn-doped colloidal nanocrystals. Phys. Rev. Lett. 2011, 107, 067402. [Google Scholar] [CrossRef] [PubMed] [Green Version]
- Shornikova, E.V.; Yakovlev, D.R.; Tolmachev, D.O.; Ivanov, V.Y.; Kalitukha, I.V.; Sapega, V.F.; Kudlacik, D.; Kusrayev, Y.G.; Golovatenko, A.A.; Shendre, S.; et al. Magneto-Optics of Excitons Interacting with Magnetic Ions in CdSe/CdMnS Colloidal Nanoplatelets. ACS Nano 2020, 14, 9032–9041. [Google Scholar] [CrossRef] [PubMed]
- Beaulac, R.; Schneider, L.; Archer, P.I.; Bacher, G.; Gamelin, D.R. Light-induced spontaneous magnetization in doped colloidal quantum dots. Science 2009, 325, 973–976. [Google Scholar] [CrossRef]
- Lorenz, S.; Erickson, C.S.; Riesner, M.; Gamelin, D.R.; Fainblat, R.; Bacher, G. Directed Exciton Magnetic Polaron Formation in a Single Colloidal Mn2+:CdSe/CdS Quantum Dot. Nano Lett. 2020, 20, 1896–1906. [Google Scholar] [CrossRef]
- Harris, R.D.; Bettis Homan, S.; Kodaimati, M.; He, C.; Nepomnyashchii, A.B.; Swenson, N.K.; Lian, S.; Calzada, R.; Weiss, E.A. Electronic Processes within Quantum Dot-Molecule Complexes. Chem. Rev. 2016, 116, 12865–12919. [Google Scholar] [CrossRef]
- Xu, G.; Zeng, S.; Zhang, B.; Swihart, M.T.; Yong, K.T.; Prasad, P.N. New Generation Cadmium-Free Quantum Dots for Biophotonics and Nanomedicine. Chem. Rev. 2016, 116, 12234–12327. [Google Scholar] [CrossRef]
- Jing, L.; Kershaw, S.V.; Li, Y.Y.; Huang, X.; Li, Y.Y.; Rogach, A.L.; Gao, M. Aqueous Based Semiconductor Nanocrystals. Chem. Rev. 2016, 116, 10623–10730. [Google Scholar] [CrossRef] [PubMed]
- Zhang, K.Y.; Yu, Q.; Wei, H.; Liu, S.; Zhao, Q.; Huang, W. Long-Lived Emissive Probes for Time-Resolved Photoluminescence Bioimaging and Biosensing. Chem. Rev. 2018, 118, 1770–1839. [Google Scholar] [CrossRef] [PubMed]
- Chen, H.Y.; Chen, T.Y.; Son, D.H. Measurement of energy transfer time in colloidal Mn-doped semiconductor nanocrystals. J. Phys. Chem. C 2010, 114, 4418–4423. [Google Scholar] [CrossRef]
- Deng, Z.; Tong, L.; Flores, M.; Lin, S.; Cheng, J.X.; Yan, H.; Liu, Y. High-quality manganese-doped zinc sulfide quantum rods with tunable dual-color and multiphoton emissions. J. Am. Chem. Soc. 2011, 133, 5389–5396. [Google Scholar] [CrossRef] [PubMed] [Green Version]
- Zheng, J.; Cao, S.; Wang, L.; Gao, F.; Wei, G.; Yang, W. Temperature-dependent photoluminescence properties of Mn:ZnCdS quantum dots. RSC Adv. 2014, 4, 30948–30952. [Google Scholar] [CrossRef]
- Nadtochenko, V.; Kostrov, A.; Titov, A.; Aybush, A.; Gostev, F.; Shelaev, I.; Shepel, D.; Antonova, O.; Kochev, S.; Kabachii, Y. Multiexponential dynamics of Mn2+(3d5) excitation in manganese doped ZnCdS quantum dots: Stimulated emission band in femtosecond transient spectra reveals ultrafast nonradiative energy transfer to Mn2+(3d5). Chem. Phys. Lett. 2020, 743, 137160. [Google Scholar] [CrossRef]
- Chernenko, A.V. On the Dominant Mechanism of the Nonradiative Excitation of Manganese Ions in II–VI Diluted Magnetic Semiconductors. Semiconductors 2020, 54, 433–436. [Google Scholar] [CrossRef]
- Gahlot, K.; Pradeep, K.; Camellini, A.; Sirigu, G.; Cerullo, G.; Zavelani-Rossi, M.; Singh, A.; Waghmare, U.V.; Viswanatha, R. Transient Species Mediating Energy Transfer to Spin-Forbidden Mn d States in II-VI Semiconductor Quantum Dots. ACS Energy Lett. 2019, 4, 729–735. [Google Scholar] [CrossRef]
- Chernenko, A.V.; Brichkin, A.S.; Sobolev, N.A.; Carmo, M.C. Mechanisms of Manganese-Assisted Nonradiative Recombination in Cd(Mn)Se/Zn(Mn)Se Quantum Dots. J. Phys. Condens. Matter 2009, 22, 355306. [Google Scholar] [CrossRef]
- Chernenko, A.V.; Brichkin, A.S.; Kulakovskii, V.D.; Sobolev, N.A.; Ivanov, S.V. Effect of Mn ions on spin relaxation and life-time of e–h complexes in CdSe/ZnSe/ZnMnSe quantum dots. Int. J. Mod. Phys. B 2009, 23, 2984–2988. [Google Scholar] [CrossRef]
- Yang, Y.; Chen, O.; Angerhofer, A.; Cao, Y.C. Radial-position-controlled doping of CdS/ZnS core/shell nanocrystals: Surface effects and position-dependent properties. Chem. Eur. J. 2009, 15, 3186–3197. [Google Scholar] [CrossRef] [PubMed]
- Fery-Forgues, S.; Lavabre, D. Are Fluorescence Quantum Yields So Tricky to Measure? A Demonstration Using Familiar Stationery Products. J. Chem. Educ. 1999, 76, 1260–1264. [Google Scholar] [CrossRef]
- Nadtochenko, V.; Denisov, N.; Aybush, A.; Gostev, F.; Shelaev, I.; Titov, A.; Umanskiy, S.; Cherepanov, D. Ultrafast spectroscopy of fano-like resonance between optical phonon and excitons in CdSe quantum dots: Dependence of coherent vibrational wave-packet dynamics on pump fluence. Nanomaterials 2017, 7, 371. [Google Scholar] [CrossRef] [PubMed] [Green Version]
- Cherepanov, D.A.; Gostev, F.E.; Shelaev, I.V.; Denisov, N.N.; Nadtochenko, V.A. Monitoring the electric field in CdSe quantum dots under ultrafast interfacial electron transfer: Via coherent phonon dynamics. Nanoscale 2018, 10, 22409–22419. [Google Scholar] [CrossRef]
- Butler, W.L.; Hopkins, D.W. Higher Derivative Analysis of Complex Absorption Spectra. Photochem. Photobiol. 1970, 12, 439–450. [Google Scholar] [CrossRef]
- Sambandam, B.; Manoharan, P.T. Davydov split PL emission and EPR correlation in β-mns layered cds nanorods. J. Phys. Chem. C 2009, 113, 9486–9496. [Google Scholar] [CrossRef]
- Counio, G.; Esnouf, S.; Gacoin, T.; Boilot, J.P. CdS:Mn nanocrystals in transparent xerogel matrices: Synthesis and luminescence properties. J. Phys. Chem. 1996, 100, 20021–20026. [Google Scholar] [CrossRef]
- Levy, L.; Feltin, N.; Ingert, D.; Pileni, M.P. Isolated Mn2+ in CdS quantum dots. Langmuir 1999, 15, 3386–3389. [Google Scholar] [CrossRef]
- Igarashi, T.; Isobe, T.; Senna, M. EPR study of electronic states for the nanosized ZnS:Mn powder modified by acrylic acid. Phys. Rev. B Condens. Matter Mater. Phys. 1997, 56, 6444–6445. [Google Scholar] [CrossRef]
- Nistor, S.V.; Stefan, M.; Ghica, D.; Nistor, L.C. Nanosize induced effects in luminescent ZnS:Mn2+ quantum dots. Radiat. Meas. 2013, 56, 40–43. [Google Scholar] [CrossRef]
- Nistor, S.V.; Stefan, M.; Nistor, L.C.; Ghica, D.; Vlaicu, I.D. Distribution and interaction of Mn2+ ions incorporated in cubic ZnS quantum dots over a broad concentration range. J. Alloys Compd. 2016, 662, 193–199. [Google Scholar] [CrossRef]
- Gonzalez Beermann, P.A.; McGarvey, B.R.; Muralidharan, S.; Sung, R.C.W. EPR Spectra of Mn2+-Doped ZnS Quantum Dots. Chem. Mater. 2004, 16, 915–918. [Google Scholar] [CrossRef]
- Biswas, S.; Kar, S.; Chaudhuri, S. Optical and magnetic properties of manganese-incorporated zinc sulfide nanorods synthesized by a solvothermal process. J. Phys. Chem. B 2005, 109, 17526–17530. [Google Scholar] [CrossRef] [PubMed]
- Kulkarni, S.K.; Shinde, R.F.; Date, S.K. Effect of (formula presented) concentration in ZnS nanoparticles on photoluminescence and electron-spin-resonance spectra. Phys. Rev. B Condens. Matter Mater. Phys. 1999, 60, 8659–8664. [Google Scholar] [CrossRef]
- Counio, G.; Gacoin, T.; Boilot, J.P.; Polytechnique, Ä.; Cedex, P. Synthesis and Photoluminescence of Cd1−xMnxS (x ≤ 5%). Nanocrystals 1998, 5647, 5257–5260. [Google Scholar]
- Kennedy, T.A.; Glaser, E.R.; Klein, P.B.; Bhargava, R.N. Symmetry and electronic structure of the Mn impurity in ZnS nanocrystals. Phys. Rev. B 1995, 52, R14356. [Google Scholar] [CrossRef]
- Klimov, V.I. Optical nonlinearities and ultrafast carrier dynamics in semiconductor nanocrystals. J. Phys. Chem. B 2000, 104, 6112–6123. [Google Scholar] [CrossRef]
- Klimov, V.; Hunsche, S.; Kurz, H. Biexciton effects in femtosecond nonlinear transmission of semiconductor quantum dots. Phys. Rev. B 1994, 50, 8110. [Google Scholar] [CrossRef]
- Pradeep, K.R.; Viswanatha, R. Mechanism of Mn emission: Energy transfer vs charge transfer dynamics in Mn-doped quantum dots. APL Mater. 2020, 8, 020901. [Google Scholar] [CrossRef]
- Zhang, C.; Do, T.N.; Ong, X.; Chan, Y.; Tan, H.S. Understanding the features in the ultrafast transient absorption spectra of CdSe quantum dots. Chem. Phys. 2016, 481, 157–164. [Google Scholar] [CrossRef]
- Rawalekar, S.; Kaniyankandy, S.; Verma, S.; Ghosh, H.N. Effect of surface states on charge-transfer dynamics in type II CdTe/ZnTe core-shell quantum dots: A femtosecond transient absorption study. J. Phys. Chem. C 2011, 115, 12335–12342. [Google Scholar] [CrossRef]
- Provencher, S.W. CONTIN: A general purpose constrained regularization program for inverting noisy linear algebraic and integral equations. Comput. Phys. Commun. 1982, 27, 229–242. [Google Scholar] [CrossRef]
- Smitienko, O.A.; Feldman, T.B.; Petrovskaya, L.E.; Nekrasova, O.V.; Yakovleva, M.A.; Shelaev, I.V.; Gostev, F.E.; Cherepanov, D.A.; Kolchugina, I.B.; Dolgikh, D.A.; et al. Comparative Femtosecond Spectroscopy of Primary Photoreactions of Exiguobacterium sibiricum Rhodopsin and Halobacterium salinarum Bacteriorhodopsin. J. Phys. Chem. B 2021, 125, 995–1008. [Google Scholar] [CrossRef] [PubMed]
- Norris, D.; Bawendi, M. Measurement and assignment of the size-dependent optical spectrum in CdSe quantum dots. Phys. Rev. B Condens. Matter Mater. Phys. 1996, 53, 16338–16346. [Google Scholar] [CrossRef] [Green Version]
- Kambhampati, P. Multiexcitons in semiconductor nanocrystals: A platform for optoelectronics at high carrier concentration. J. Phys. Chem. Lett. 2012, 3, 1182–1190. [Google Scholar] [CrossRef]
- Sewall, S.L.; Franceschetti, A.; Cooney, R.R.; Zunger, A.; Kambhampati, P. Direct observation of the structure of band-edge biexcitons in colloidal semiconductor CdSe quantum dots. Phys. Rev. B Condens. Matter Mater. Phys. 2009, 80, 081310. [Google Scholar] [CrossRef] [Green Version]
- Klimov, V.I. Spectral and Dynamical Properties of Multiexcitons in Semiconductor Nanocrystals. Annu. Rev. Phys. Chem. 2007, 58, 635–673. [Google Scholar] [CrossRef]
- Sewall, S.L.; Cooney, R.R.; Dias, E.A.; Tyagi, P.; Kambhampati, P. State-resolved observation in real time of the structural dynamics of multiexcitons in semiconductor nanocrystals. Phys. Rev. B Condens. Matter Mater. Phys. 2011, 84, 235304. [Google Scholar] [CrossRef]
- Nadtochenko, V.; Kostrov, A.; Titov, A.; Aybush, A.; Gostev, F.; Shelaev, I.; Shepel, D.; Antonova, O.; Kochev, S.; Kabachii, Y.; et al. The binding energy of biexcitons in alloy ZnxCd1−xS quantum dots detected by femtosecond laser spectroscopy. Appl. Phys. A Mater. Sci. Process. 2020, 126, 1–9. [Google Scholar] [CrossRef]
- Kambhampati, P. Hot exciton relaxation dynamics in semiconductor quantum dots: Radiationless transitions on the nanoscale. J. Phys. Chem. C 2011, 115, 22089–22109. [Google Scholar] [CrossRef]
- Sewall, S.L.; Cooney, R.R.; Anderson, K.E.H.; Dias, E.A.; Kambhampati, P. State-to-state exciton dynamics in semiconductor quantum dots. Phys. Rev. B Condens. Matter Mater. Phys. 2006, 74, 235328. [Google Scholar] [CrossRef]
- Sewall, S.L.; Cooney, R.R.; Anderson, K.E.H.; Dias, E.A.; Sagar, D.M.; Kambhampati, P. State-resolved studies of biexcitons and surface trapping dynamics in semiconductor quantum dots. J. Chem. Phys. 2008, 129, 084701. [Google Scholar] [CrossRef] [PubMed]
- Lin, C.L.; Lee, C.C.; Ho, K.C. Spectroelectrochemical studies of manganese phthalocyanine thin films for applications in electrochromic devices. J. Electroanal. Chem. 2002, 524–525, 81–89. [Google Scholar] [CrossRef]
- Lever, A.B.P.; Pickens, S.R.; Minor, P.C.; Licoccia, S.; Ramaswamy, B.S.; Magnell, K. Charge-Transfer Spectra of Metallophthalocyanines: Correlation with Electrode Potentials. J. Am. Chem. Soc. 1981, 103, 6800–6806. [Google Scholar] [CrossRef]
- Sjödin, M.; Gätjens, J.; Tabares, L.C.; Thuéry, P.; Pecoraro, V.L.; Un, S. Tuning the redox properties of manganese(II) and its implications to the electrochemistry of manganese and iron superoxide dismutases. Inorg. Chem. 2008, 47, 2897–2908. [Google Scholar] [CrossRef] [PubMed]
- Takeda, H.; Kamiyama, H.; Okamoto, K.; Irimajiri, M.; Mizutani, T.; Koike, K.; Sekine, A.; Ishitani, O. Highly Efficient and Robust Photocatalytic Systems for CO2 Reduction Consisting of a Cu(I) Photosensitizer and Mn(I) Catalysts. J. Am. Chem. Soc. 2018, 140, 17241–17254. [Google Scholar] [CrossRef] [Green Version]
- Yamaguchi, K.S.; Sawyer, D.T. The Redox Chemistry of Manganese(III) and -(IV) Complexes. Isr. J. Chem. 1985, 25, 164–176. [Google Scholar] [CrossRef]
- Beaulac, R.; Gamelin, D.R. Two-center formulation of Mn2+-electron sp − d exchange coupling in bulk and quantum-confined diluted magnetic semiconductors. Phys. Rev. B Condens. Matter Mater. Phys. 2010, 82, 224401. [Google Scholar] [CrossRef]
- Beaulac, R.; Feng, Y.; May, J.W.; Badaeva, E.; Gamelin, D.R.; Li, X. Orbital pathways for Mn2+-carrier sp − d exchange in diluted magnetic semiconductor quantum dots. Phys. Rev. B Condens. Matter Mater. Phys. 2011, 84, 195324. [Google Scholar] [CrossRef] [Green Version]
- Taguchi, S.; Ishizumi, A.; Kanemitsu, Y. Multicarrier Recombination and Energy Transfer in Mn-Doped CdS Nanocrystals Studied by Femtosecond Pump–Probe Spectroscopy. J. Phys. Soc. Jpn. 2010, 79, 063710. [Google Scholar] [CrossRef]
- Chung, J.H.; Ah, C.S.; Jang, D.J. Formation and distinctive decay times of surface- and lattice-bound Mn2+ impurity luminescence in ZnS nanoparticles. J. Phys. Chem. B 2001, 105, 4128–4132. [Google Scholar] [CrossRef]
- Olano, E.M.; Grant, C.D.; Norman, T.J.; Castner, E.W.; Zhang, J.Z. Photoluminescence decay dynamics and mechanism of energy transfer in undoped and Mn2+ doped ZnSe nanoparticles. J. Nanosci. Nanotechnol. 2005, 5, 1492–1497. [Google Scholar] [CrossRef] [PubMed]
- Shibata, K.; Nakayama, E.; Souma, I.; Murayama, A.; Oka, Y. Exciton recombination processes in Cd1−xMnxSe/ZnSe quantum dots under magnetic fields. Phys. Status Solidi Basic Res. 2002, 229, 473–476. [Google Scholar] [CrossRef]
- Chen, H.Y.; Maiti, S.; Son, D.H. Doping location-dependent energy transfer dynamics in Mn-doped CdS/ZnS nanocrystals. ACS Nano 2012, 6, 583–591. [Google Scholar] [CrossRef] [PubMed]
- Santra, P.K.; Kamat, P.V. Mn-doped quantum dot sensitized solar cells: A strategy to boost efficiency over 5%. J. Am. Chem. Soc. 2012, 134, 2508–2511. [Google Scholar] [CrossRef]


| X1 | X2 | X3 | X4 | ||||||
|---|---|---|---|---|---|---|---|---|---|
| ħω1 eV | ħw1 eV | ħδ1 eV | ħω′1 eV | ħw′1 eV | ħω2 eV | ħw2 eV | ħω3 eV | ħω3 eV | |
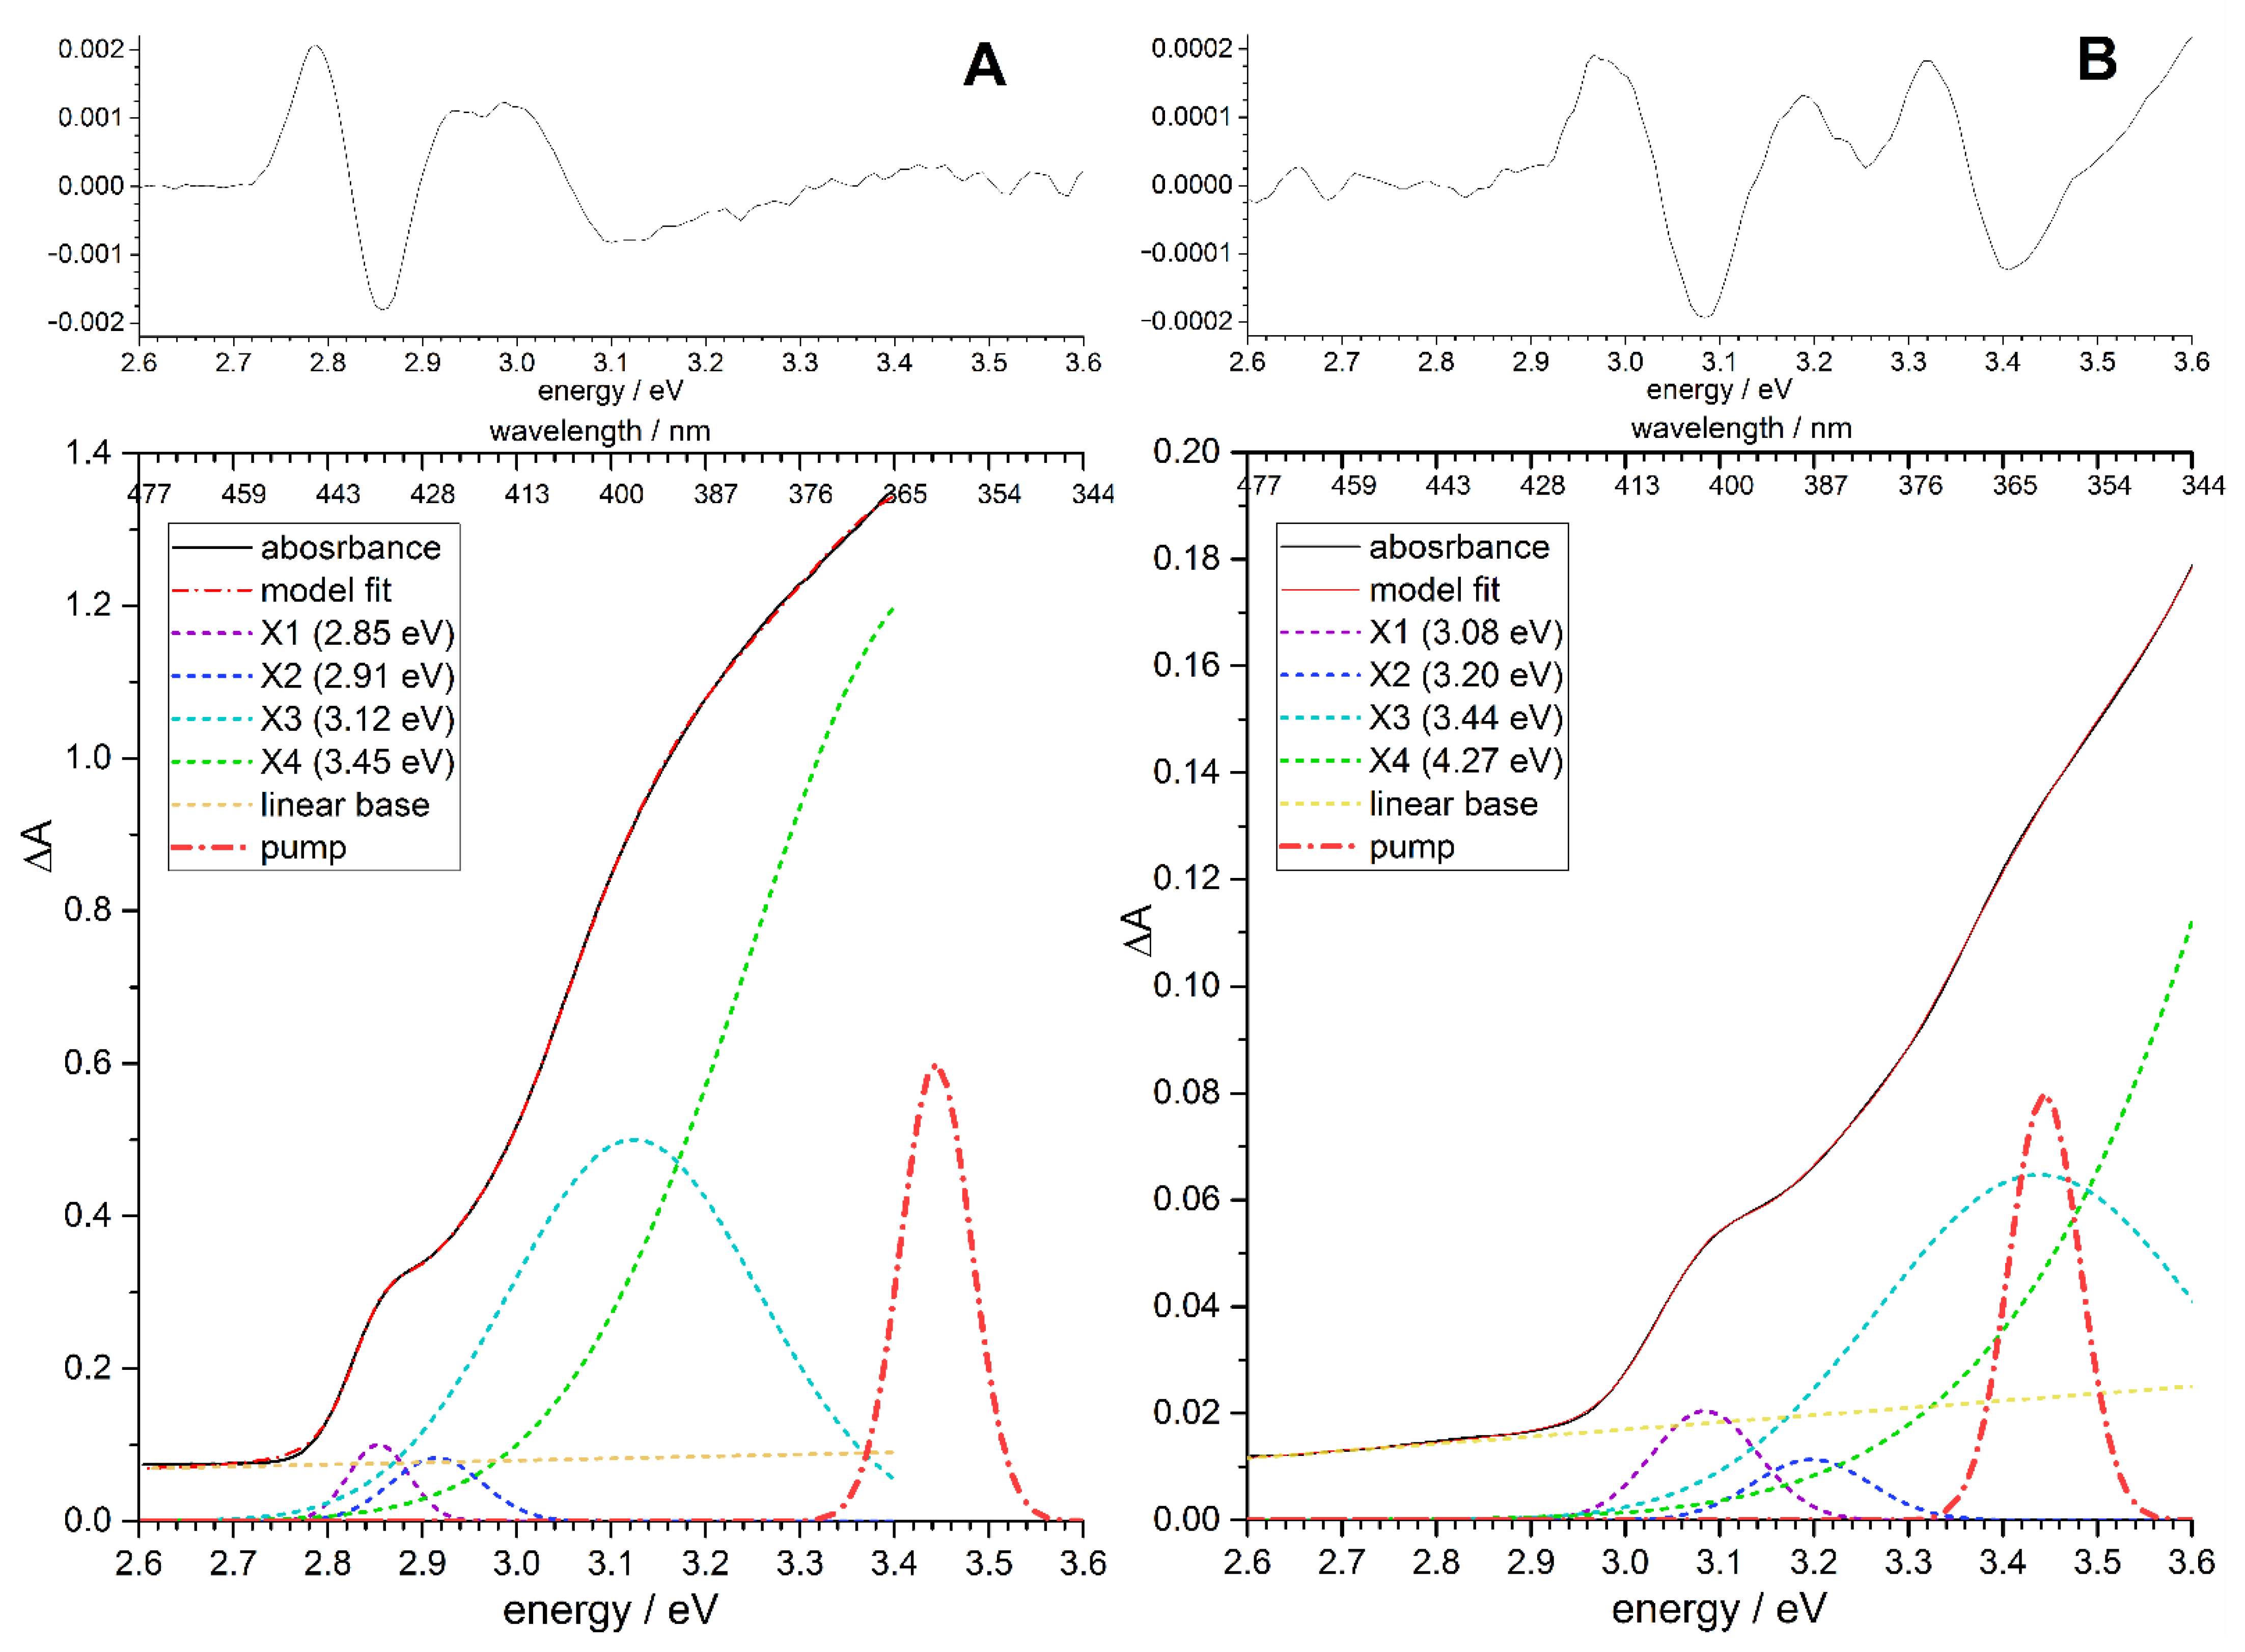
| QD-1 sample | 2.85 | 0.03 | 0.08 | 2.92 | 0.05 | 3.08 | 0.13 | 3.45 | 0.20 |
| QD-2 sample | 3.08 | 0.05 | 0.10 | 3.20 | 0.06 | 3.44 | 0.17 | 4.27 | 0.36 |
| Fractions | Kinetic Constants | |||||||
|---|---|---|---|---|---|---|---|---|
| fA | fB | fC | ξ3 | 1/k3 (ps) | 1/m1 (ps) | 1/m2A (ps) | 1/m2B (ps) | θ |
| 0.39 | 0.55 | 0.06 | 0.19 | 0.11 ± 0.04 | 0.38 ± 0.02 | 1.03 ± 0.1 | 9.6 ± 0.9 | 0.49 |
Publisher’s Note: MDPI stays neutral with regard to jurisdictional claims in published maps and institutional affiliations. |
© 2021 by the authors. Licensee MDPI, Basel, Switzerland. This article is an open access article distributed under the terms and conditions of the Creative Commons Attribution (CC BY) license (https://creativecommons.org/licenses/by/4.0/).
Share and Cite
Cherepanov, D.; Kostrov, A.; Gostev, F.; Shelaev, I.; Motyakin, M.; Kochev, S.; Kabachii, Y.; Nadtochenko, V. Ultrafast Quenching of Excitons in the ZnxCd1−xS/ZnS Quantum Dots Doped with Mn2+ through Charge Transfer Intermediates Results in Manganese Luminescence. Nanomaterials 2021, 11, 3007. https://doi.org/10.3390/nano11113007
Cherepanov D, Kostrov A, Gostev F, Shelaev I, Motyakin M, Kochev S, Kabachii Y, Nadtochenko V. Ultrafast Quenching of Excitons in the ZnxCd1−xS/ZnS Quantum Dots Doped with Mn2+ through Charge Transfer Intermediates Results in Manganese Luminescence. Nanomaterials. 2021; 11(11):3007. https://doi.org/10.3390/nano11113007
Chicago/Turabian StyleCherepanov, Dmitry, Andrei Kostrov, Fedor Gostev, Ivan Shelaev, Mikhail Motyakin, Sergei Kochev, Yuriy Kabachii, and Victor Nadtochenko. 2021. "Ultrafast Quenching of Excitons in the ZnxCd1−xS/ZnS Quantum Dots Doped with Mn2+ through Charge Transfer Intermediates Results in Manganese Luminescence" Nanomaterials 11, no. 11: 3007. https://doi.org/10.3390/nano11113007
APA StyleCherepanov, D., Kostrov, A., Gostev, F., Shelaev, I., Motyakin, M., Kochev, S., Kabachii, Y., & Nadtochenko, V. (2021). Ultrafast Quenching of Excitons in the ZnxCd1−xS/ZnS Quantum Dots Doped with Mn2+ through Charge Transfer Intermediates Results in Manganese Luminescence. Nanomaterials, 11(11), 3007. https://doi.org/10.3390/nano11113007