
Enhancement in Electromagnetic Wave Shielding Effectiveness through the Formation of Carbon Nanofiber Hybrids on Carbon-Based Nonwoven Fabrics


Abstract
:1. Introduction
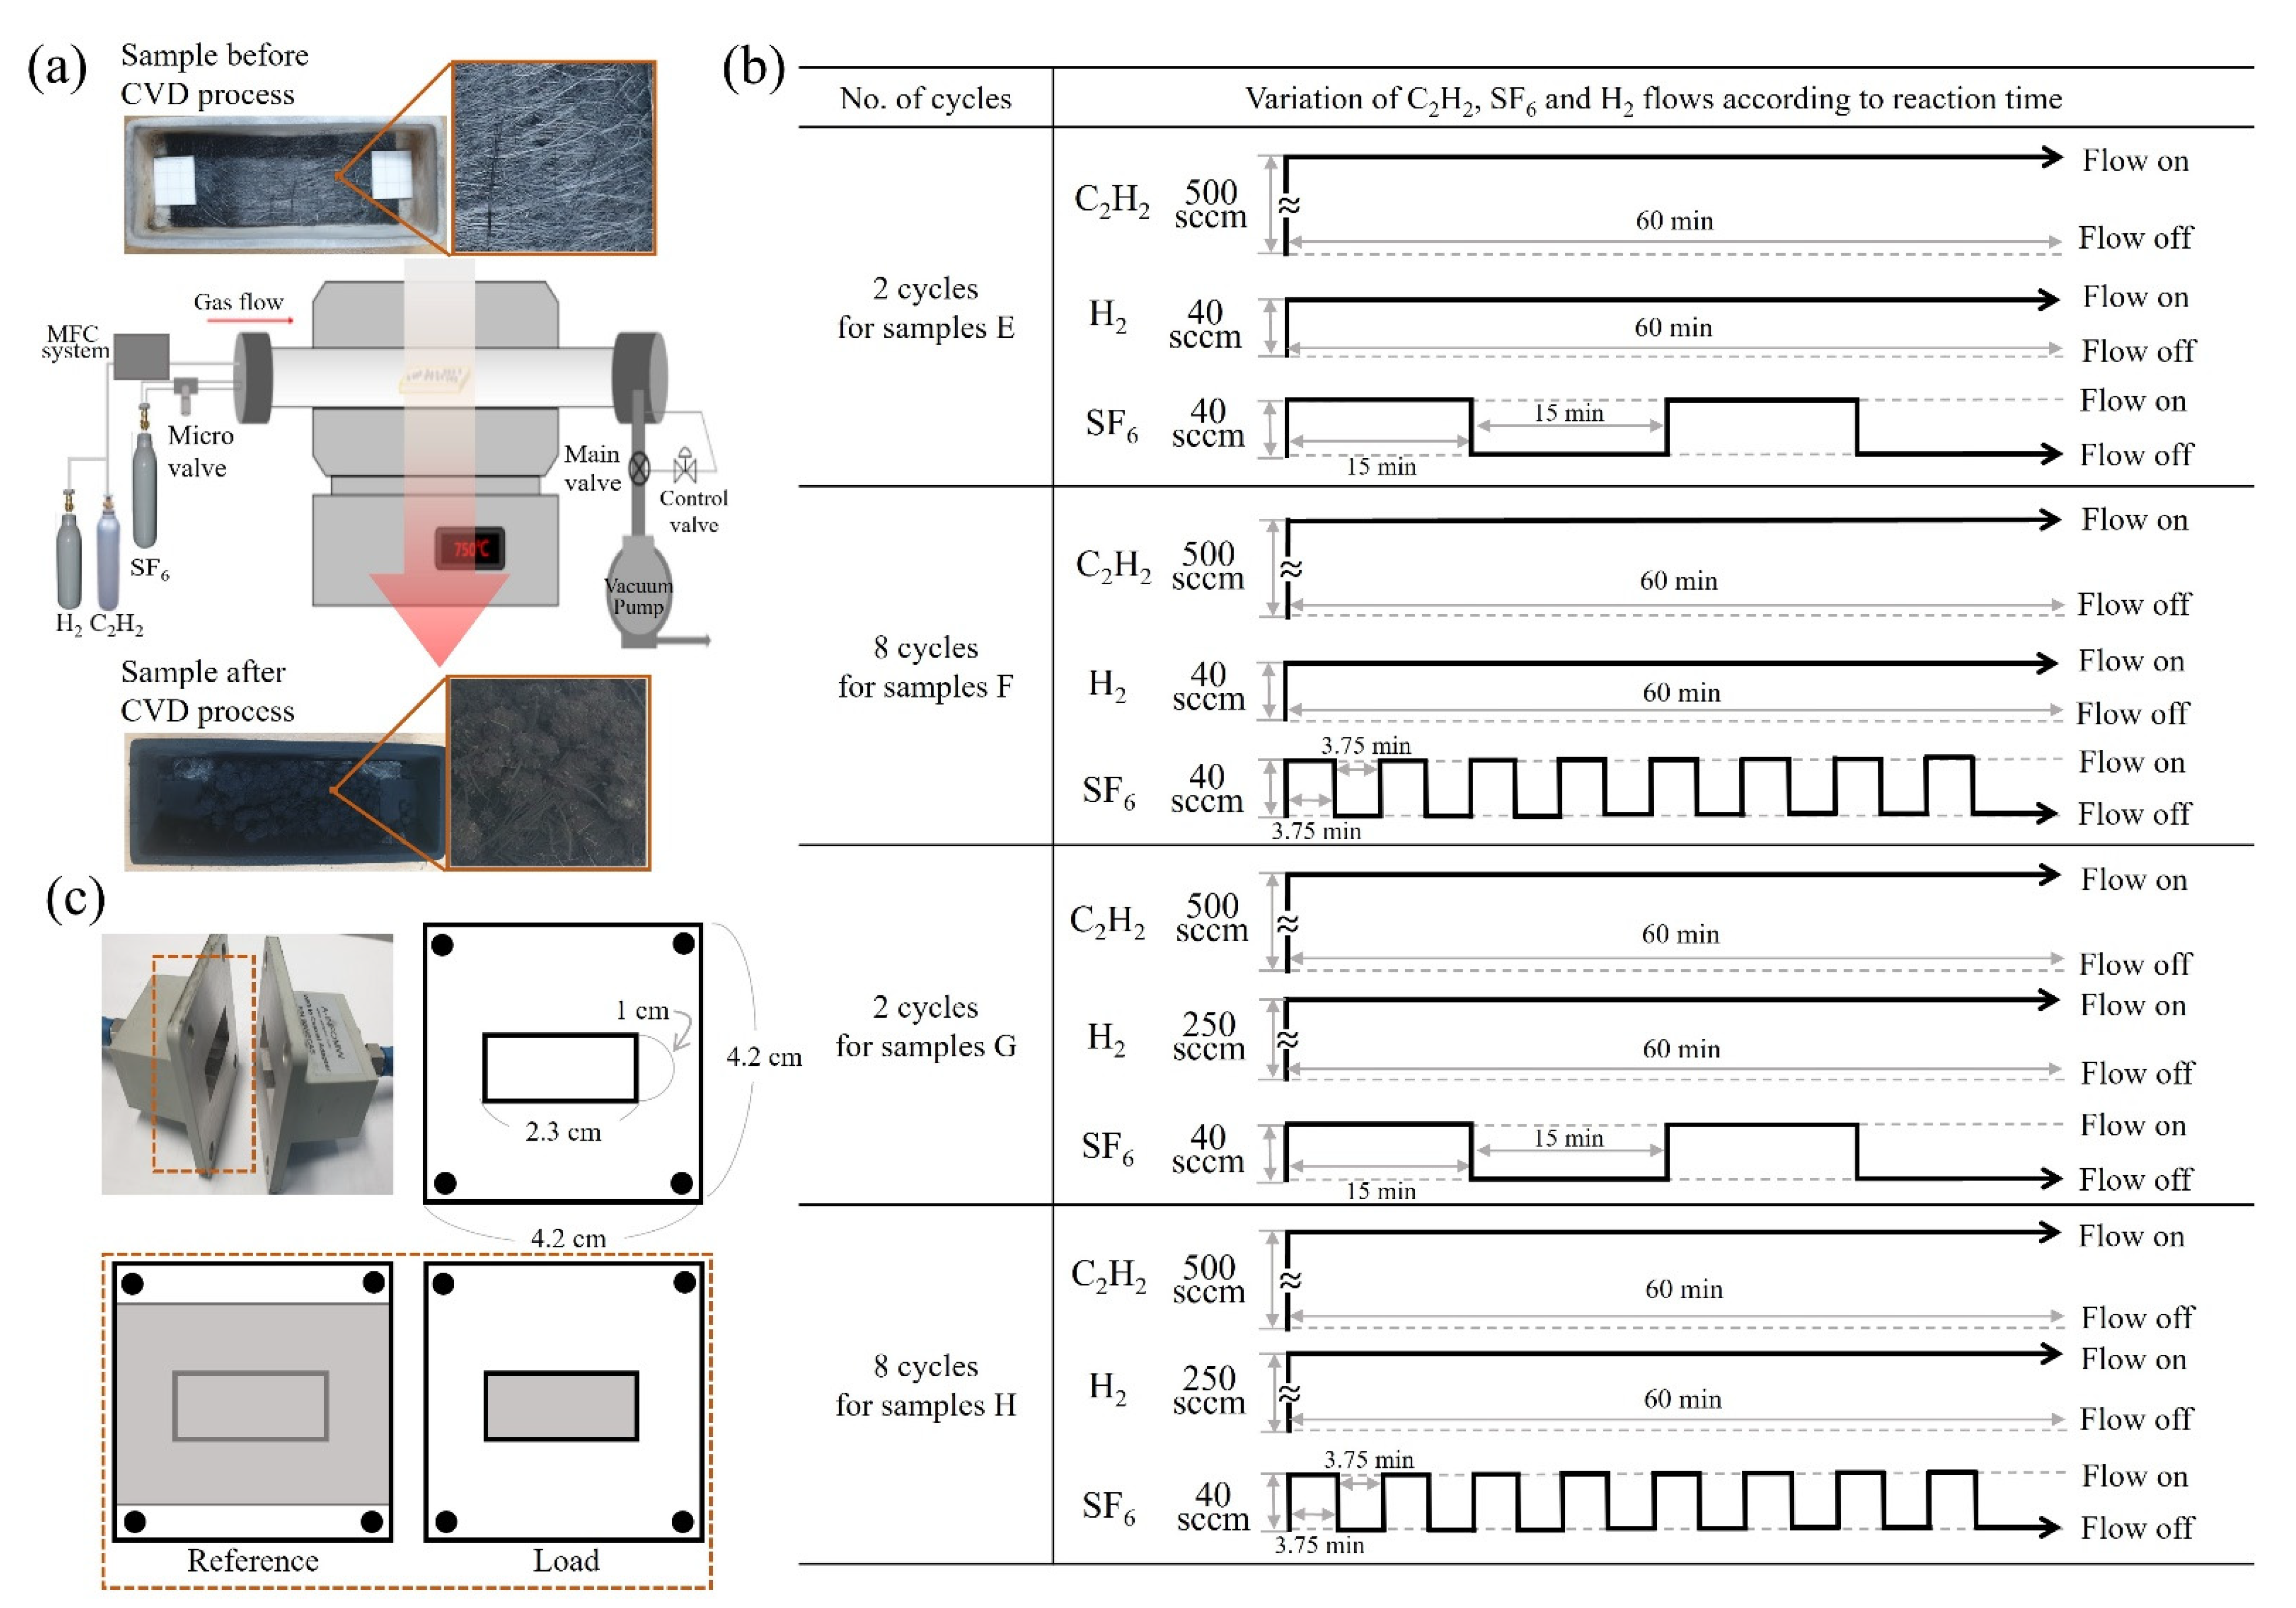
2. Materials and Methods
3. Results
4. Conclusions
Author Contributions
Funding
Informed Consent Statement
Data Availability Statement
Conflicts of Interest
References
- Schulz, R.B.; Plantz, V.C.; Brush, D.R. Shielding Theory and Practice. Inst. Electr. Electron. Eng. 1988, 30, 187–201. [Google Scholar] [CrossRef]
- Chung, D.L. Materials for Electromagnetic Interference Shielding. J. Mater. Eng. Perform. 2000, 9, 350–354. [Google Scholar] [CrossRef]
- Al-Saleh, M.H.; Sundararaj, U. Electromagnetic Interference Shielding Mechanisms of CNT/polymer Composites. Carbon 2009, 47, 1738–1746. [Google Scholar]
- Simon, R.M. Emi Shielding Through Conductive Plastics. Polym. Plast. Technol. Eng. 1981, 17, 1–10. [Google Scholar] [CrossRef]
- Chung, D.L. Electromagnetic Interference Shielding Effectiveness of Carbon Materials. Carbon 2001, 39, 279–285. [Google Scholar] [CrossRef]
- Kim, H.-J.; Kim, S.-H.; Park, S. Effects of the Carbon Fiber-Carbon Microcoil Hybrid Formation on the Effectiveness of Electromagnetic Wave Shielding on Carbon Fibers-Based Fabrics. Materials 2018, 11, 2344. [Google Scholar] [CrossRef] [Green Version]
- Kim, H.-J.; Kang, G.-H.; Kim, S.-H.; Park, S. Enhancement of Electromagnetic Wave Shielding Effectiveness of Carbon Fibers via Chemical Composition Transformation Using H2 Plasma Treatment. Nanomaterials 2020, 10, 1611. [Google Scholar] [CrossRef]
- Motojima, S.; Hoshiya, S.; Hishikawa, Y. Electromagnetic Wave Absorption Properties of Carbon Microcoils/PMMA Composite Beads in W Bands. Carbon 2003, 41, 2658–2660. [Google Scholar]
- Zhao, D.L.; Shen, Z.M. Preparation and Microwave Absorption Properties of Carbon Nanocoils. Mater. Lett. 2008, 62, 3704–3706. [Google Scholar] [CrossRef]
- Motojima, S.; Noda, Y.; Hoshiya, S.; Hishikawa, Y. Electromagnetic Wave Absorption Property of Carbon Microcoils in 12–110 GHz region. J. Appl. Phys. 2003, 94, 2325. [Google Scholar] [CrossRef]
- Kang, G.-H.; Kim, S.-H.; Park, S. Enhancement of shielding effectiveness for electromagnetic wave radiation using carbon nanocoil-carbon microcoil hybrid materials. Appl. Surf. Sci. 2019, 447, 264–270. [Google Scholar] [CrossRef]
- Pothupitiya Gamage, S.; Yang, K.; Braveenth, R. MWCNT coated free-standing carbon fiber fabric for enhanced performance in EMI shielding with a higher absolute EMI SE. Materials 2017, 10, 1350. [Google Scholar] [CrossRef] [Green Version]
- Kong, L.; Yin, X.; Xu, H. Powerful absorbing and lightweight electromagnetic shielding CNTs/RGO composite. Carbon 2019, 145, 61–66. [Google Scholar] [CrossRef]
- Smits, F. Measurement of Sheet Resistivities with the Four-Point Probe. Bell Syst. Tech. J. 1958, 37, 711–718. [Google Scholar] [CrossRef]
- Shuying, Y.; Karen, L.; Azalia, L.; Heinrich, D.F.; Robert, J. Electromagnetic Interference Shielding Effectiveness of Carbon Nanofiber/LCP Composites. Compos. Part A Appl. Sci. Manuf. 2005, 36, 691–697. [Google Scholar]
- Pütz, J.; Heusing, S.; Aegerter, M.A. Characterization of Electrical Properties. In Handbook of Sol-Gel Science and Technology; Klein, L., Aparicio, M., Jitianu, A., Eds.; Springer: Cham, Switzerland, 2016; pp. 1–30. [Google Scholar]
- Song, W.L.; Cao, M.S.; Lu, M.M.; Bi, S.; Wang, C.Y.; Liu, J.; Yuan, J.; Fan, L.Z. Flexible Graphene/Polymer Composite Films in Sandwich Structures for Effective Electromagnetic Interference Shielding. Carbon 2014, 66, 67–76. [Google Scholar] [CrossRef]
- Song, W.L.; Wang, J.; Fan, L.Z.; Li, Y.; Wang, C.Y.; Cao, M.S. Interfacial Engineering of Carbon Nanofiber@Graphene@Carbon Nanofiber Heterojunctions in Flexible Lightweight Electromagnetic Shielding Networks. ACS Appl. Mater. Interface 2014, 6, 10516–10523. [Google Scholar] [CrossRef]
- Cao, M.S.; Song, W.L.; Hou, Z.L.; Wen, B.; Yuan, J. The Effects of Temperature and Frequency on the Dielectric Properties, Electromagnetic Interference Shielding and Microwave-Absorption of Short Carbon Fiber/Silica Composites. Carbon 2010, 48, 788–796. [Google Scholar]
- Huang, H.D.; Liu, C.Y.; Zhou, D.; Jiang, X.; Zhong, G.J. Cellulose Composite Aerogel for Highly Efficient Electromagnetic Interference Shielding. J. Mater. Chem. A 2015, 3, 4983–4991. [Google Scholar] [CrossRef]
- Kang, G.-H.; Bae, M.-K.; Kim, S.-H. Formation of noble-shaped carbon nanostructures. J. Incl. Phenom. Macrocycl. Chem. 2015, 82, 179–186. [Google Scholar] [CrossRef]
- Zhu, S.; Su, C.H.; Lehoczky, S.L.; Muntele, I.; Ila, D. Carbon nanotube growth on carbon fibers. Diam. Relat. Mater. 2003, 12, 1825–1828. [Google Scholar] [CrossRef]
- Zhao, Z.G.; Ci, L.J.; Cheng, H.M.; Bai, J.B. The growth of multi-walled carbon nanotubes with different morphologies on carbon fibers. Carbon 2005, 43, 651–673. [Google Scholar] [CrossRef]
- Shaikjee, A.; Coville, N.J. The synthesis, properties and uses of carbon materials with helical morphology. J. Adv. Res. 2012, 3, 195–223. [Google Scholar] [CrossRef] [Green Version]
- Nishino, T.; Naito, H.; Nakamura, K.; Nakamae, K. X-ray diffraction studies on the stress transfer of transversely loaded carbon fibre reinforced composite. Compos. Part A 2000, 31, 1225–1230. [Google Scholar] [CrossRef]
- Qiu, T.; Yang, J.-G.; Bai, X.-J.; Wang, Y.-L. The preparation of synthetic graphite materials with hierarchical pores from lignite by one-step impregnation and their characterization as dye absorbents. RSC Adv. 2019, 9, 12737. [Google Scholar] [CrossRef] [Green Version]
- Kang, G.-H.; Kim, S.-H.; Park, S. Controllable synthesis of carbon-nanocoil–carbon-microcoil hybrid materials. Mater. Des. 2016, 116, 42–50. [Google Scholar] [CrossRef]
- Zhang, M.; Li, J. Carbon nanotube in different shapes. Mater. Today 2009, 12, 12. [Google Scholar] [CrossRef]
- Mohammed, H.A.-S.; Walaa, H.S.; Uttandaraman, S. EMI shielding effectiveness of carbon based nanostructured polymeric materials: A comparative study. Carbon 2013, 60, 146–156. [Google Scholar]
- Lv, X.; Yang, S.; Jin, J.; Zhang, L.; Li, G.; Jiang, J. Preparation and electromagnetic properties of carbon nanofiber/epoxy composites. J. Macromol. Sci. B 2010, 49, 355–365. [Google Scholar] [CrossRef]
- Wu, Z.P.; Li, M.M.; Hu, Y.Y.; Li, Y.S.; Wang, Z.X.; Yin, Y.H.; Chen, Y.S.; Zhou, X. Electromagnetic interference shielding of carbon nanotube macrofilms. Scr. Mater. 2011, 64, 809–812. [Google Scholar] [CrossRef]
- Das, N.C.; Khastgir, D.; Chaki, T.K.; Chakraborty, A. Electromagnetic interference shielding effectiveness of carbon black and carbon fibre filled EVA and NR based composites. Compos. Part A 2000, 31, 1069–1081. [Google Scholar] [CrossRef]
- Fan, Z.; Wang, D.; Yuan, Y.; Wang, Y.; Cheng, Z.; Liu, Y.; Xie, Z. A lightweight and conductive MXene/graphene hybrid foam for superior electromagnetic interference shielding. Chem. Eng. J. 2020, 381, 122696. [Google Scholar] [CrossRef]
- Lee, S.-H.; Kang, D.; Oh, I.-K. Multilayered graphene-carbon nanotube-iron oxide three-dimensional heterostructure for flexible electromagnetic interference shielding film. Carbon 2017, 111, 248–257. [Google Scholar] [CrossRef]
- Wang, Z.; Mao, B.; Wang, Q.; Yu, J.; Dai, J.; Song, R.; Pu, Z.; He, D.; Wu, Z.; Mu, S. Ultrahigh Conductive Copper/Large Flake Size Graphene Heterostructure Thin-Film with Remarkable Electromagnetic Interference Shielding Effectiveness. Small 2018, 14, e1704332. [Google Scholar] [CrossRef]
- Wang, Y.; Zhou, W.; Zeng, G.; Chen, H.; Luo, H.; Fan, X.; Li, Y. Rational design of multi-shell hollow carbon submicrospheres for high-performance microwave absorbers. Carbon 2021, 175, 233–242. [Google Scholar] [CrossRef]
- Zhang, Y.; Zhou, W.; Chen, H.; Duan, G.; Luo, H.; Li, Y. Facile preparation of CNTs microspheres as improved carbon absorbers for high-efficiency electromagnetic wave absorption. Ceram. Int. 2021, 47, 10013–10018. [Google Scholar] [CrossRef]
- Liang, J.; Gu, Y.; Bai, M.; Wang, S.; Li, M.; Zhang, Z. Electromagnetic shielding property of carbon fiber felt made of different types of short-chopped carbon fibers. Compos. Part A 2019, 121, 289–298. [Google Scholar]
- Li, J.; Ding, Y.; Yu, N.; Gao, Q.; Fan, X.; Wei, X.; Zhang, G.; Ma, Z.; He, X. Lightweight and stiff carbon foams derived from rigid thermosetting polyimide foam with superior electromagnetic interference shielding performance. Carbon 2020, 158, 45–54. [Google Scholar] [CrossRef]
- Yu, J.D.; Kim, H.J.; Kim, D.Y.; Choi, J.W.; Ji, W.J.; Sim, W.D.; Lee, C.O.; Yu, J.H. Electromagnetic Wave Shielding Material and Method for Producing the Same. Korea Patent 10-2020-0108268, 27 August 2020. [Google Scholar]


| Samples | C2H2 Gas Flow Rate (sccm) | H2 Gas Flow Rate (sccm) | SF6 Gas Flow Rate (sccm) | No. of SF6 Cycles On/Off | Total Gas Pressure (Torr) | Total Reaction Time (min) | Substrate Temp. (°C) | Remarks |
|---|---|---|---|---|---|---|---|---|
| A | - | - | - | - | - | - | - | Native c-NFs |
| B | 500 | - | 40 | - | 100 | 60 | 750 | Without cyclic process |
| C | 500 | 40 | 40 | - | 100 | 60 | 750 | Without cyclic process |
| D | 500 | 250 | 40 | - | 100 | 60 | 750 | Without cyclic process |
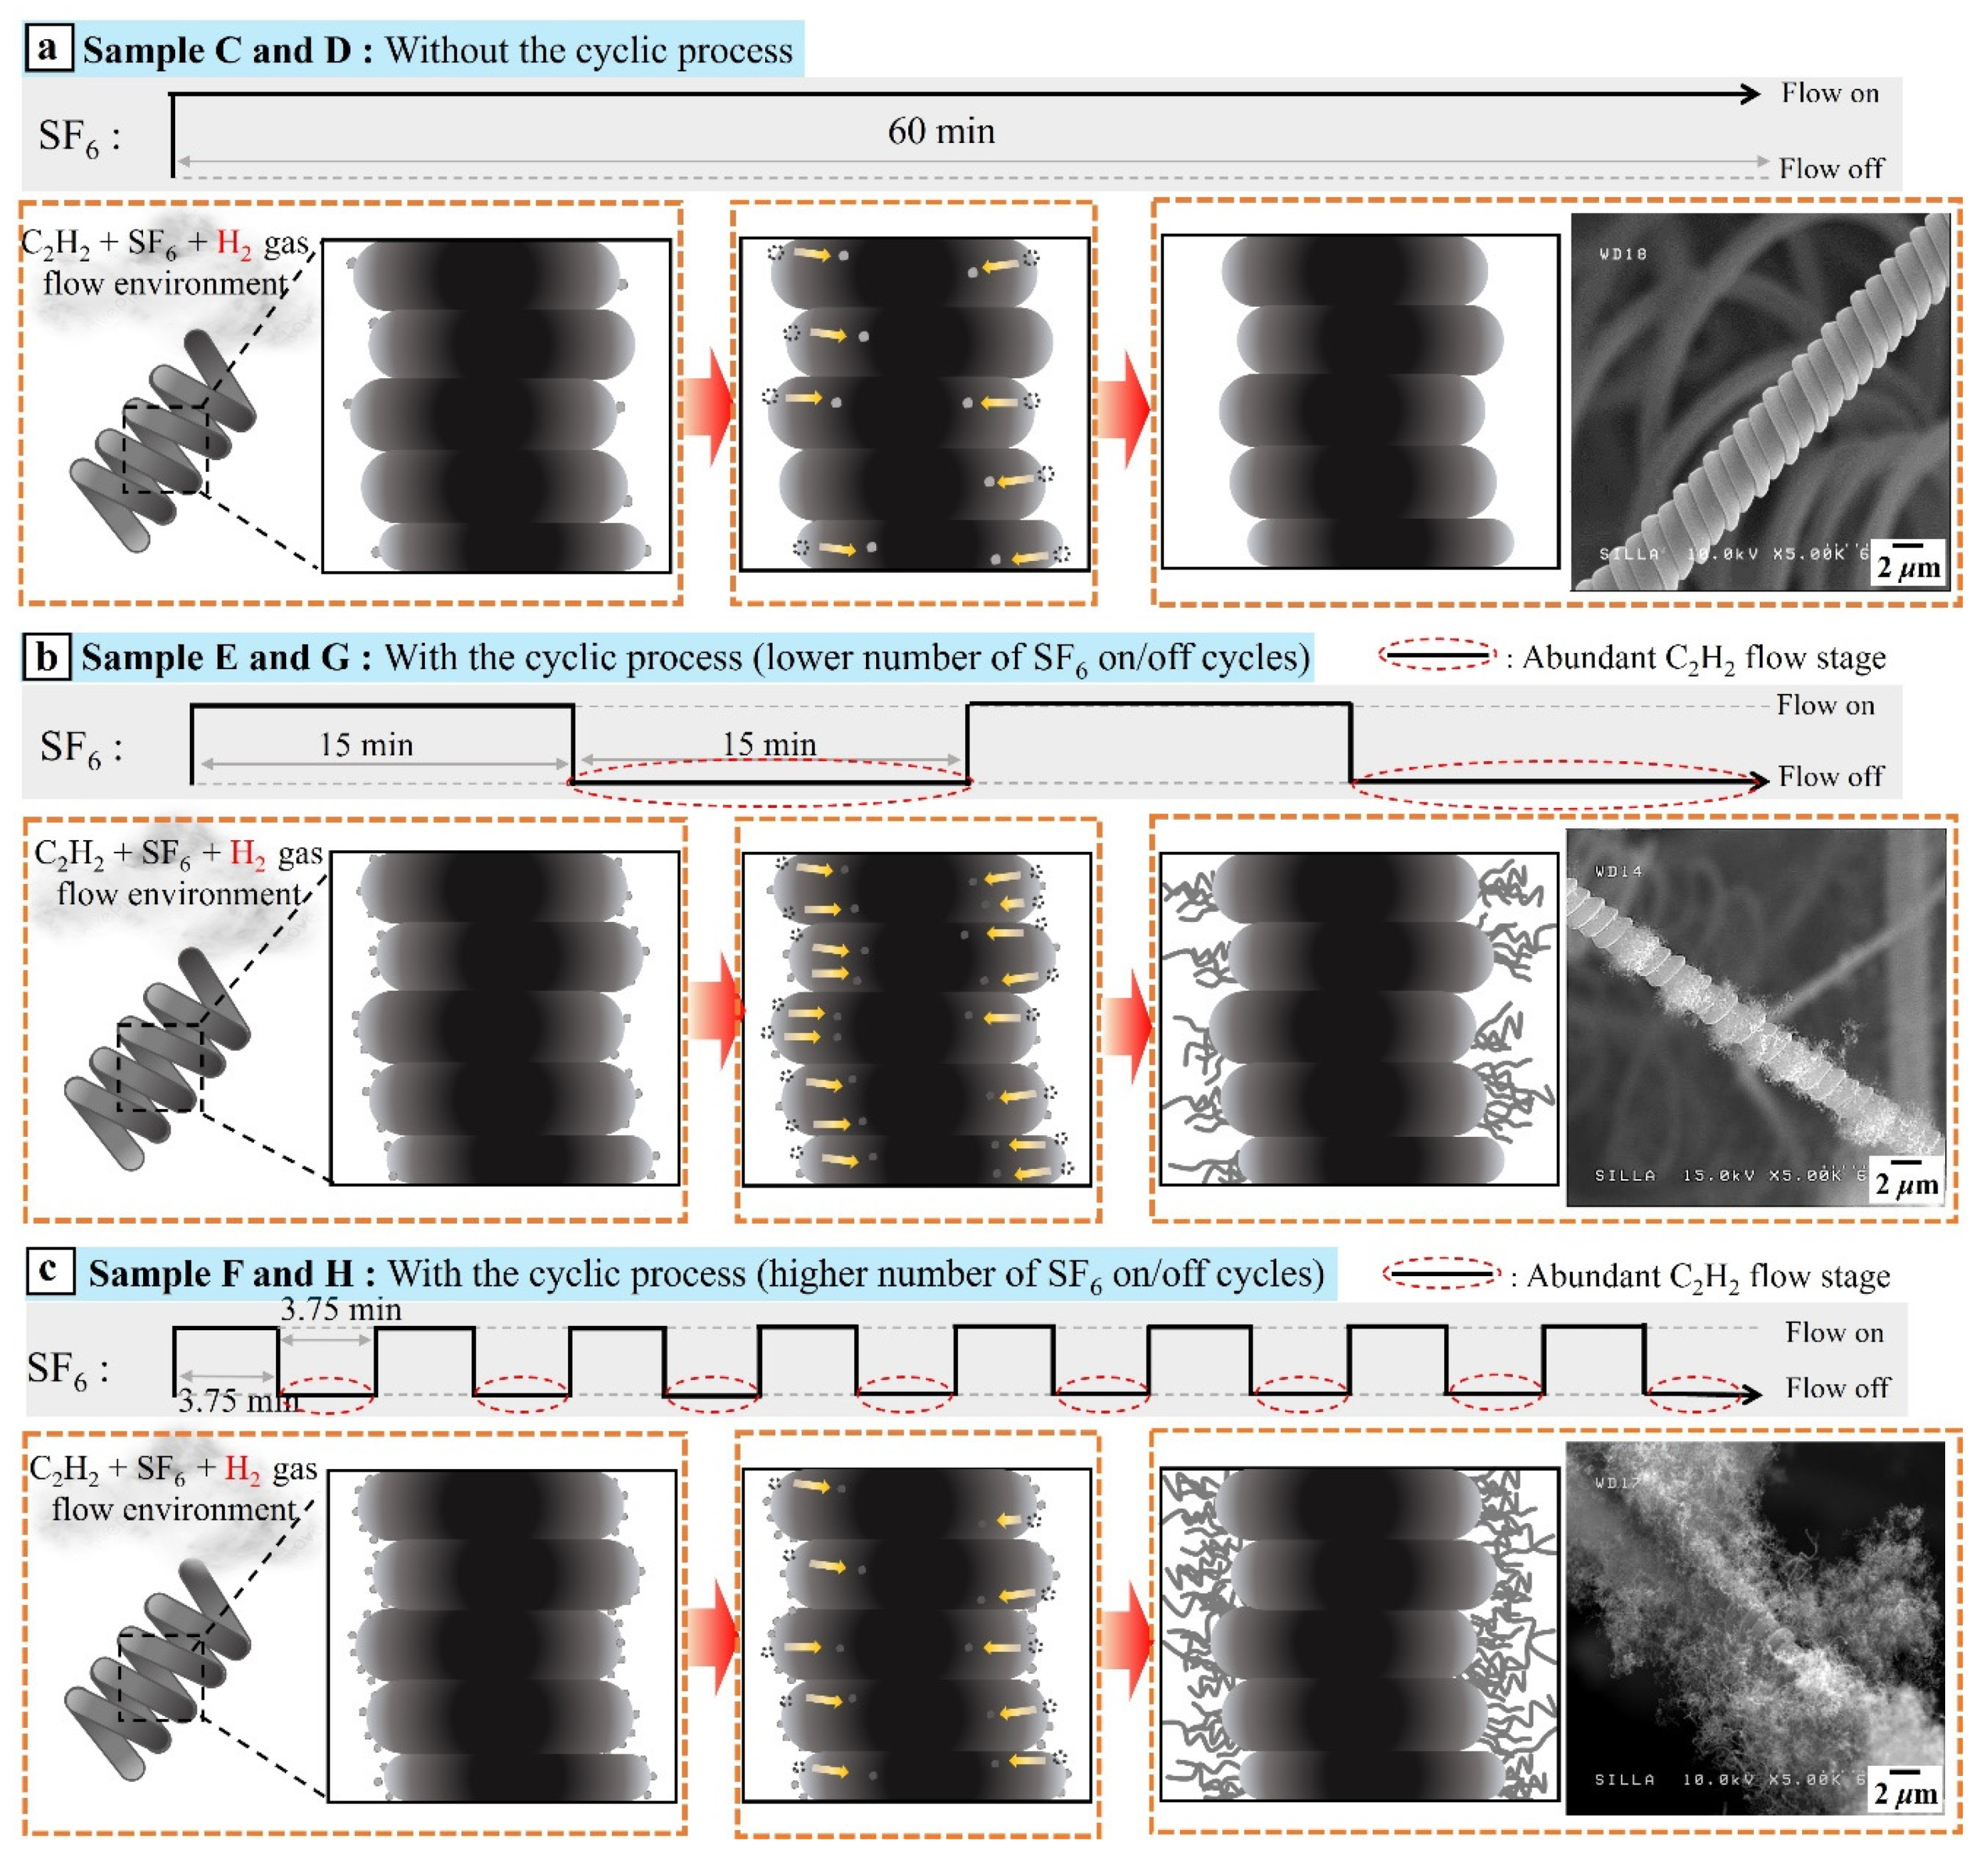
| E | 500 | 40 | 40 | 2 | 100 | 60 | 750 | With cyclic process |
| F | 500 | 40 | 40 | 8 | 100 | 60 | 750 | With cyclic process |
| G | 500 | 250 | 40 | 2 | 100 | 60 | 750 | With cyclic process |
| H | 500 | 250 | 40 | 8 | 100 | 60 | 750 | With cyclic process |
| Samples | Thickness t (mm) | Electrical Resistivity ρ (Ω·m) | Electrical Conductivity σ (S/m) | * Correction Factor F (F/w) |
|---|---|---|---|---|
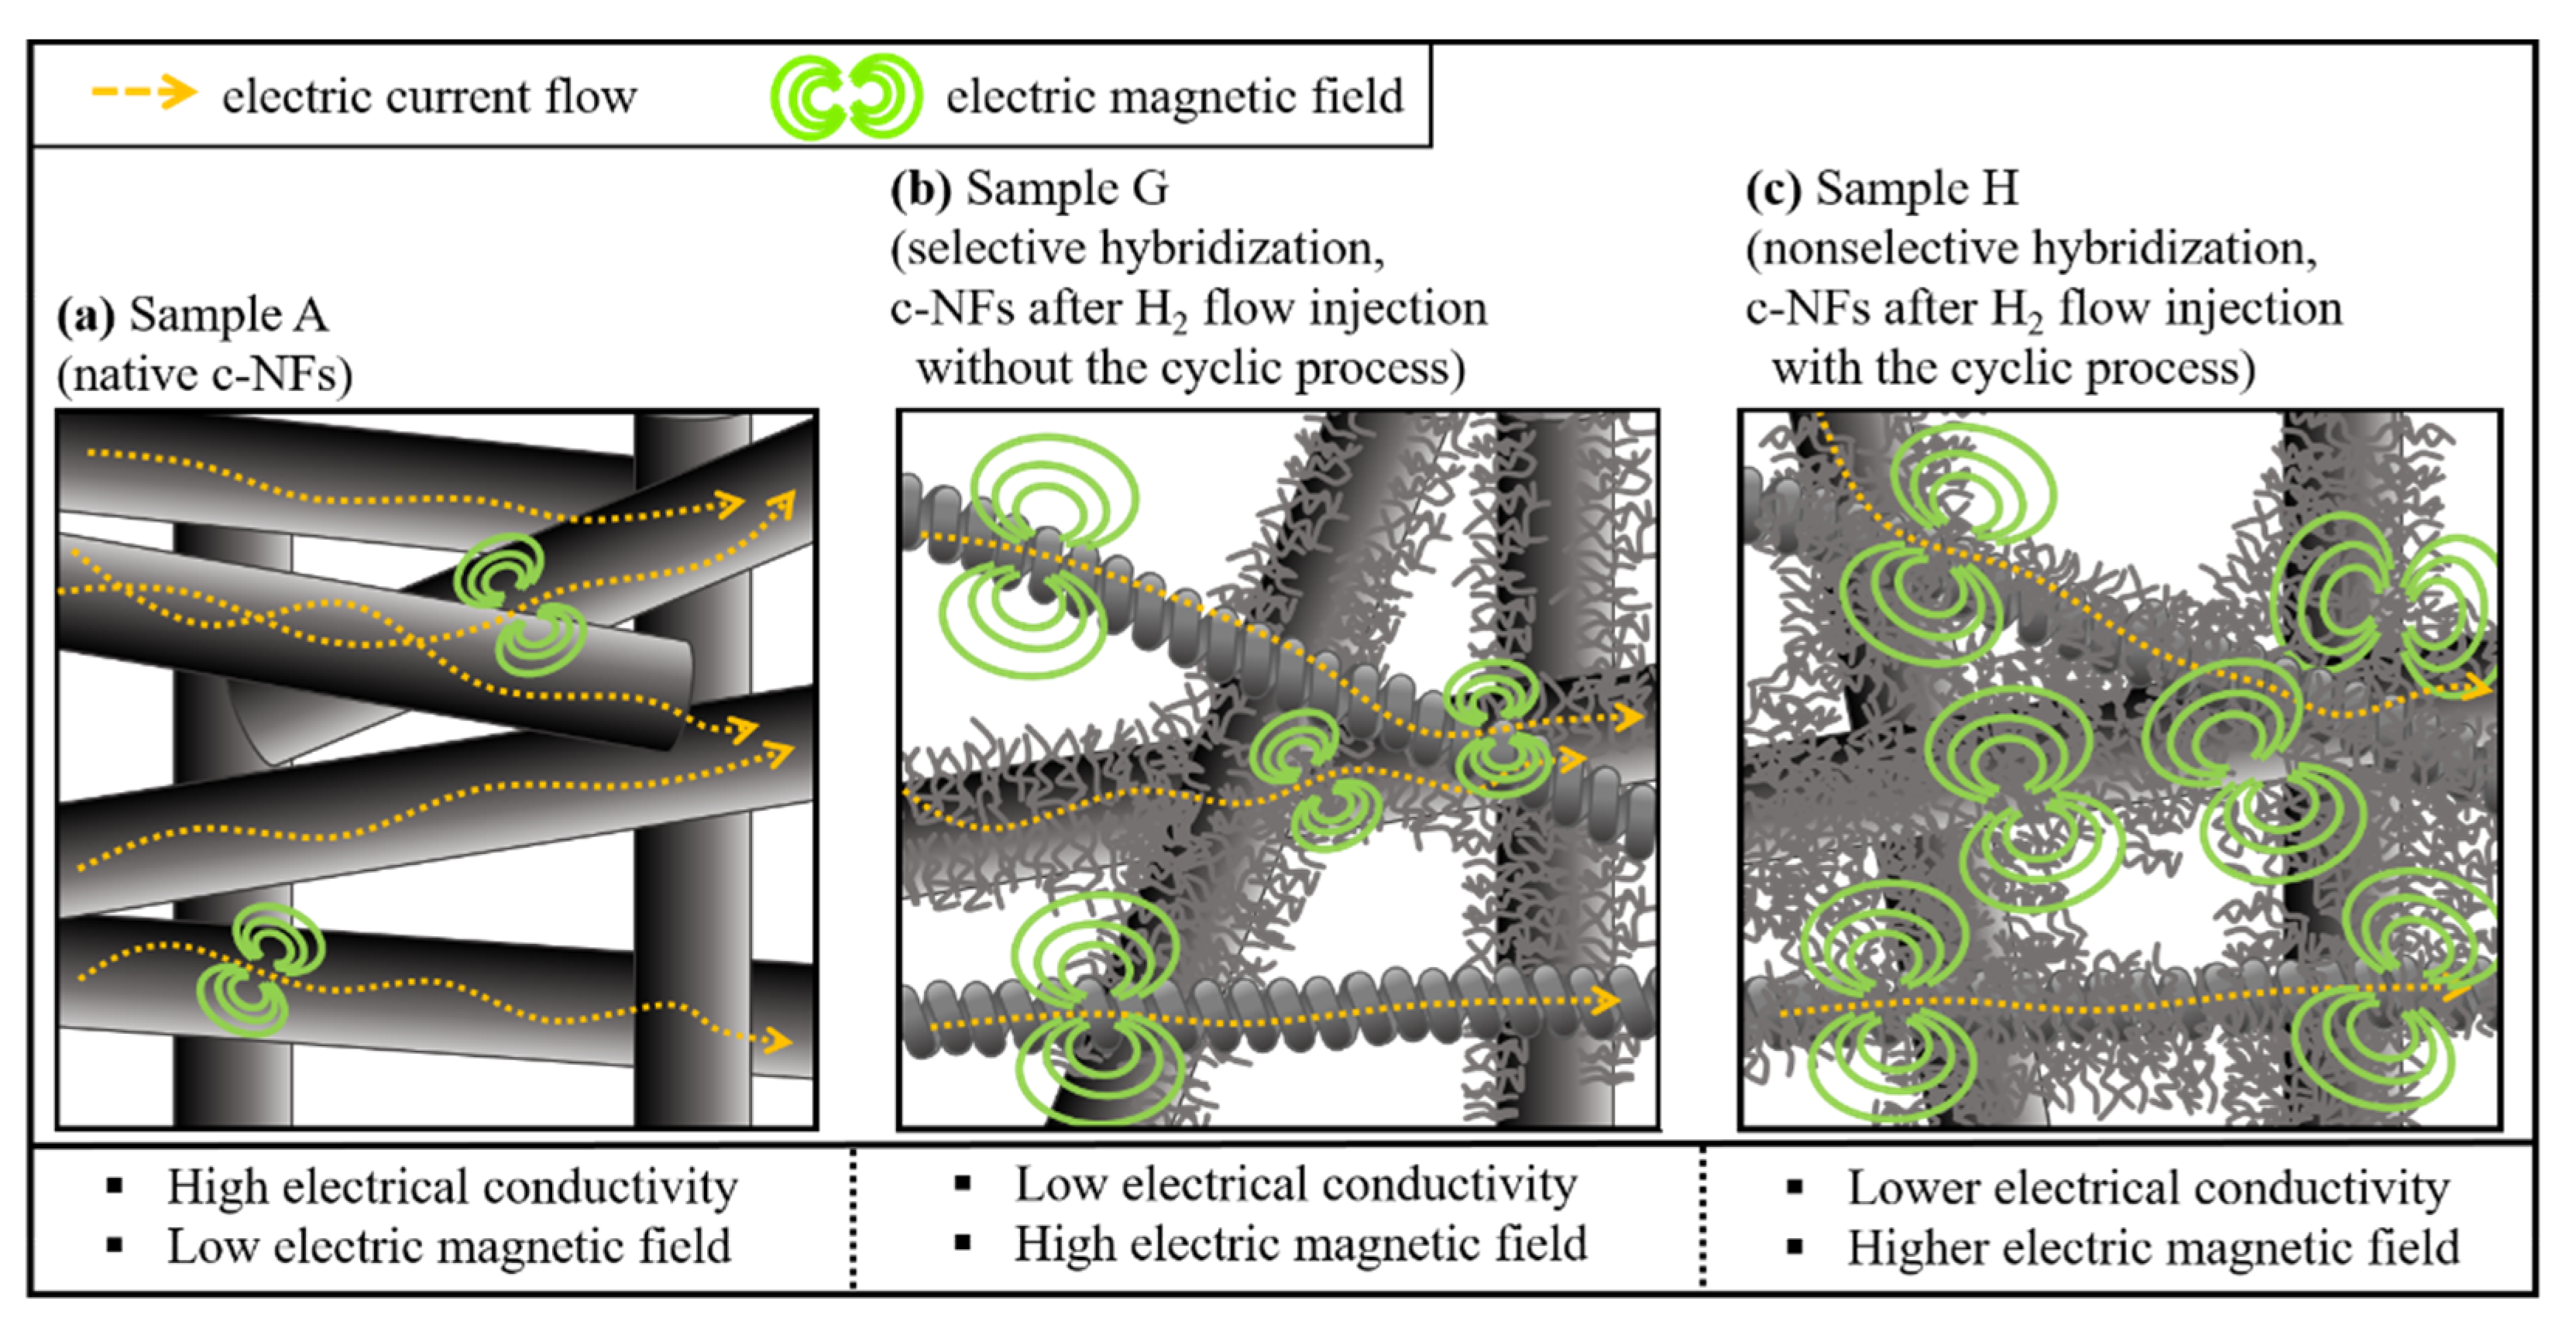
| A | 1.5 (±0.05) | 4.61 (±0.14) × 10−4 | 2.17 (±0.07) × 103 | 0.99 |
| B | 1.8 (±0.35) | 4.64 (±1.23) × 10−4 | 2.16 (±0.46) × 103 | 0.98 |
| D | 1.7 (±0.11) | 4.92 (±0.65) × 10−4 | 2.03 (±0.23) × 103 | 0.98 |
| G | 2.9 (±0.78) | 1.07 (±0.29) × 10−3 | 9.33 (±1.98) × 102 | 0.92 |
| H | 4.6 (±0.35) | 2.02 (±0.15) × 10−3 | 4.96 (±0.35) × 102 | 0.79 |
| Carbon-Based Materials | Thickness (mm) | Electrical Conductivity or Resistivity | Operating Frequency (GHz) | SE (dB) | Ref. |
|---|---|---|---|---|---|
| 15 wt% * CB/* ABS | 1.1 | - | 8.2–12.4 | 21 | [29] |
| 15 wt% * CNF/* ABS | 1.5 ± 0.1 Ω·cm | 35 | |||
| 15 wt% * CNT/* ABS | 0.81 ± 0.05 Ω·cm | 51 | |||
| * CNF/epoxy | 2.1 | - | 5–34 | [30] | |
| * CNT macro-films | 0.004 | - | 61–67 | [31] | |
| * SCF/* EVA | 3.5 | - | 8–12 | 29.5–34.1 | [32] |
| * MX/* RGO | 3 | 1000 S/m | 51 | [33] | |
| * 3D G–CNT–Fe2O3 | 0.6 | 22,781 S/m | 130–134 | [34] | |
| * GN/Cu | 0.009 (±0.0015) | 5.88 (±0.29) × 106 S/m | 1–18 | 52–63 | [35] |
| * THCS/paraffin | 2.8 | - | 2–18 | 48.5 | [36] |
| * CNTsM | 4.6 | - | 2–18 | 35 | [37] |
| * M40J SCF felt | 0.422 | 1.88 × 10³ S/m | 8.2–12.4 | 66.7–71.4 | [38] |
| * CF-1200 | 4 | 0.159 S/cm | 8–12 | 64 | [39] |
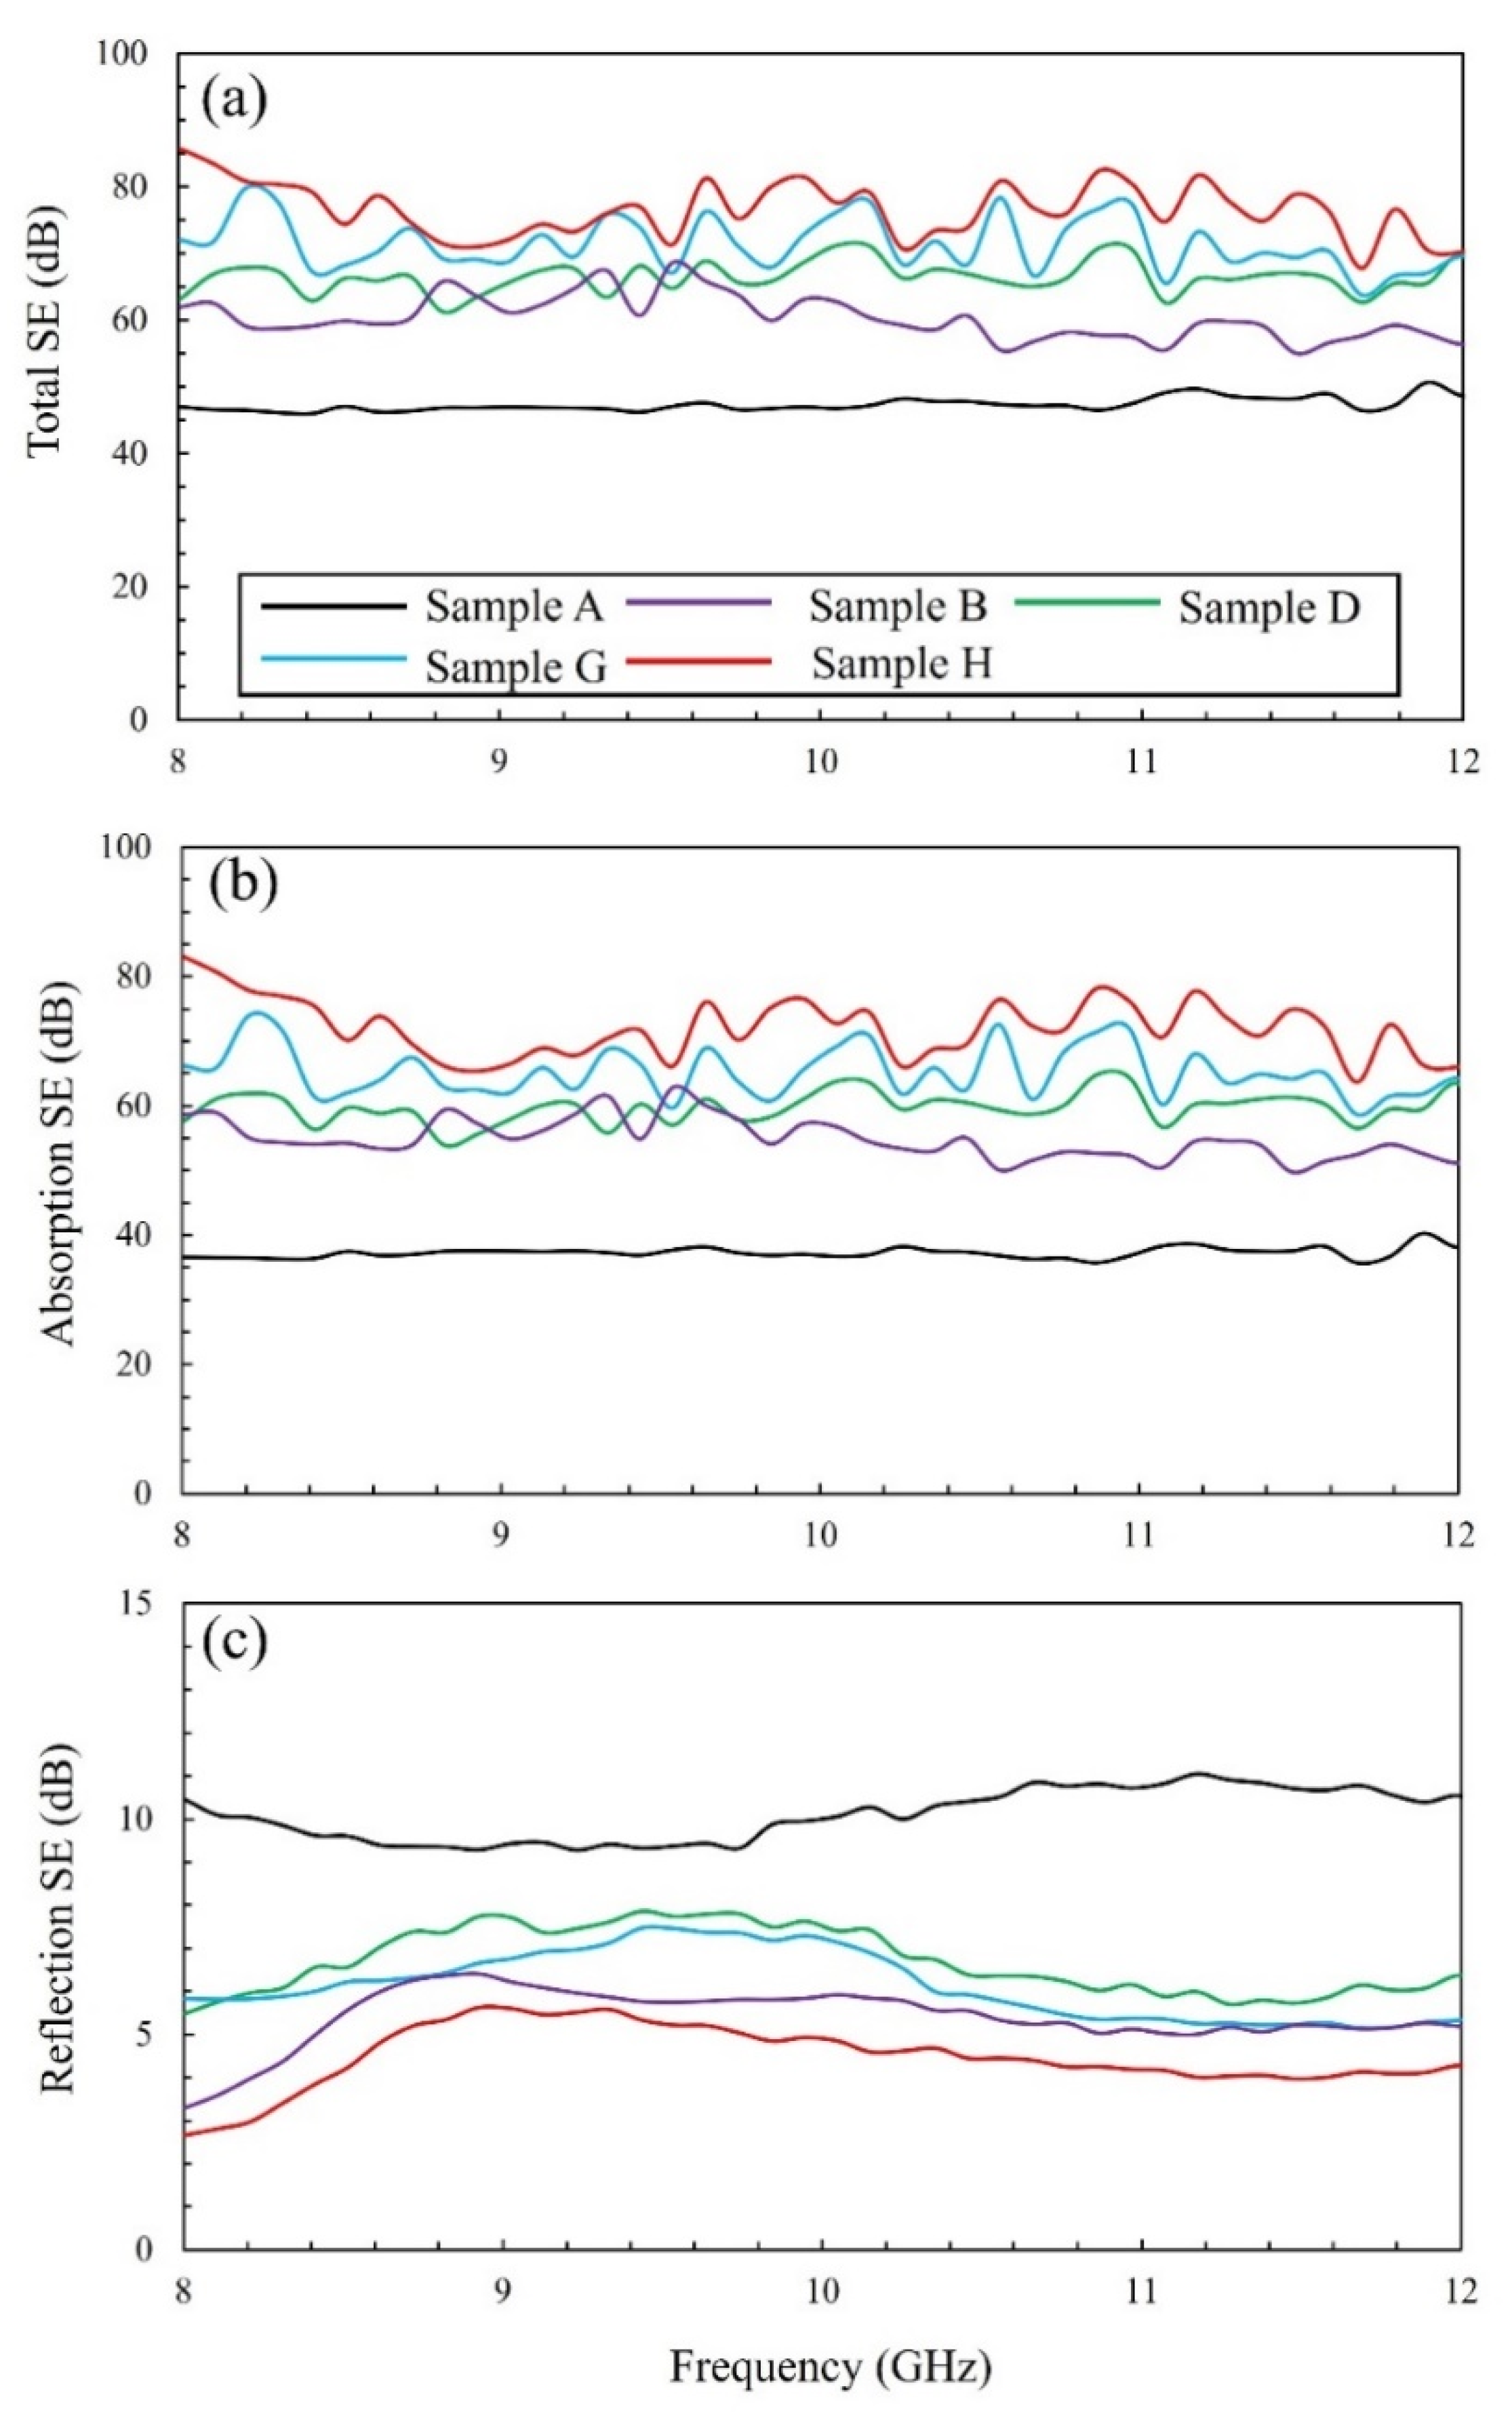
| * c-NFs | 1.5 (±0.05) | 2.17 (±0.07) × 103 S/m | 8–12 | 46–53 | This work |
| * CMCs on c-NFs | 1.8 (±0.35) | 2.16 (±0.46) × 103 S/m | 55–68 | ||
| * CNF–i-CF hybrids in c-NFs | 1.7 (±0.11) | 2.03 (±0.23) × 103 S/m | 61–75 | ||
| * CNF–CMC and CNF–i-CF hybrids in c-NFs | 2.9 (±0.78)–4.6 (±0.35) | 4.96 (±0.35)–9.33 (±1.98) × 102 S/m | 64–86 |
Publisher’s Note: MDPI stays neutral with regard to jurisdictional claims in published maps and institutional affiliations. |
© 2021 by the authors. Licensee MDPI, Basel, Switzerland. This article is an open access article distributed under the terms and conditions of the Creative Commons Attribution (CC BY) license (https://creativecommons.org/licenses/by/4.0/).
Share and Cite
Kim, H.-J.; Kang, G.-H.; Kim, S.-H.; Park, S. Enhancement in Electromagnetic Wave Shielding Effectiveness through the Formation of Carbon Nanofiber Hybrids on Carbon-Based Nonwoven Fabrics. Nanomaterials 2021, 11, 2910. https://doi.org/10.3390/nano11112910
Kim H-J, Kang G-H, Kim S-H, Park S. Enhancement in Electromagnetic Wave Shielding Effectiveness through the Formation of Carbon Nanofiber Hybrids on Carbon-Based Nonwoven Fabrics. Nanomaterials. 2021; 11(11):2910. https://doi.org/10.3390/nano11112910
Chicago/Turabian StyleKim, Hyun-Ji, Gi-Hwan Kang, Sung-Hoon Kim, and Sangmoon Park. 2021. "Enhancement in Electromagnetic Wave Shielding Effectiveness through the Formation of Carbon Nanofiber Hybrids on Carbon-Based Nonwoven Fabrics" Nanomaterials 11, no. 11: 2910. https://doi.org/10.3390/nano11112910
APA StyleKim, H.-J., Kang, G.-H., Kim, S.-H., & Park, S. (2021). Enhancement in Electromagnetic Wave Shielding Effectiveness through the Formation of Carbon Nanofiber Hybrids on Carbon-Based Nonwoven Fabrics. Nanomaterials, 11(11), 2910. https://doi.org/10.3390/nano11112910