Article

Visible-Light-Assisted Photoelectrochemical Biosensing of Uric Acid Using Metal-Free Graphene Oxide Nanoribbons

1
Biomedical Engineering Research Center, Department of Chemical and Materials Engineering, Chang Gung University, Taoyuan City 333323, Taiwan
2
Department of Neurosurgery, Linkou Chang Gung Memorial Hospital, Taoyuan City 333423, Taiwan
3
Center for High Technology Development, Vietnam Academy of Science and Technology, Hanoi 100000, Vietnam
4
Institute of Analytical and Environmental Sciences, National Tsing Hua University, Hsinchu 300044, Taiwan
5
Center for Plasma and Thin Film Technologies (CPTFT), Department of Materials Engineering, Ming Chi University of Technology, New Taipei City 243303, Taiwan
*
Authors to whom correspondence should be addressed.
Nanomaterials 2021, 11(10), 2693; https://doi.org/10.3390/nano11102693
Submission received: 21 September 2021 / Revised: 10 October 2021 / Accepted: 10 October 2021 / Published: 13 October 2021
(This article belongs to the Special Issue Advances in Carbon-Based Nanomaterials for (Bio)Sensor Development)

Abstract

:
In this study, we demonstrate the visible-light-assisted photoelectrochemical (PEC) biosensing of uric acid (UA) by using graphene oxide nanoribbons (GONRs) as PEC electrode materials. Specifically, GONRs with controlled properties were synthesized by the microwave-assisted exfoliation of multi-walled carbon nanotubes. For the detection of UA, GONRs were adopted to modify either a screen-printed carbon electrode (SPCE) or a glassy carbon electrode (GCE). Cyclic voltammetry analyses indicated that all Faradaic currents of UA oxidation on GONRs with different unzipping/exfoliating levels on SPCE increased by more than 20.0% under AM 1.5 irradiation. Among these, the GONRs synthesized under a microwave power of 200 W, namely GONR(200 W), exhibited the highest increase in Faradaic current. Notably, the GONR(200 W)/GCE electrodes revealed a remarkable elevation (~40.0%) of the Faradaic current when irradiated by light-emitting diode (LED) light sources under an intensity of illumination of 80 mW/cm2. Therefore, it is believed that our GONRs hold great potential for developing a novel platform for PEC biosensing.

1. Introduction

In recent years, nanocarbon materials, including graphene nanoribbons (GNRs), have been of great interest to the scientific community and have been widely investigated for various applications [1,2,3,4,5]. Among different research fields, nanocarbon-based electrochemical biosensors have attracted significant attention due to the tremendous demands of our modern society. Conversely, semiconductor materials or earth-abundant catalysts have been studied for their photoelectrochemical (PEC) activities, such as energy conversion and water splitting, including hydrogen evolution reaction and oxygen evolution reaction [6,7,8]. Interestingly, semiconductor electrocatalysts with PEC properties can be exploited as photoelectrodes for PEC biosensors [9,10,11,12,13,14,15,16,17,18,19,20]. For example, Li et al. used TiO2/g-C3N4 in conjunction with dendrimer and alkaline phosphatase for the sensitive detection of protein kinase A activity [9]. Lin et al. combined carbon quantum dots-functionalized MnO2 nanosheets with glucose oxidase (GOx), labeled as AFB1-bovine serum albumin, for monitoring aflatoxin B1 [10]. Zhou et al. synthesized reduced graphene oxide/BiFeO3 nanohybrids on a magnetic microfluidic device for detection of a prostate-specific antigen [12]. More recently, Sun et al. fabricated a CdS–In2S3 heterojunction for detecting bleomycin [13]. Zhu et al. prepared ultrathin PtNi nanozyme and benzene-ring doped g-C3N4 for the ultrasensitive sensing of chloramphenicol [15]. Detailed information on recently developed PEC biosensors that use a variety of photoactive materials and light sources is summarized in Table 1 [9,10,12,13,14,15,16,17,18,19,20].
GNRs exhibit extraordinary properties, such as superlubricity, band structure, magnetism, charge/spin transports, high-capacity energy storage, and topological behavior, which are not present in other nanocarbons [21,22,23,24]. As for electrochemical biosensors, Vukojević et al. developed RuO2/GNR-modified screen-printed carbon electrodes to enhance the electrocatalytic biosensing of ethanol and nicotinamide [25]. Tang et al. employed N-GNRs-Fe-MOFs@Au nanocomposites to modify a glassy carbon electrode (GCE) in order to detect Galectin-3, a biomarker for heart failure [26]. Li et al. used nitrogen-doped GNRs and n-C60-PdPt as a dual-type responsive electrochemical immunosensor for the quantitative detection of proprotein convertase subtilisin/kexin type 9 [27]. Feng et al. utilized a combination of gold nanocages and GNRs with large specific surface areas and excellent electrical conductivities to develop a stochastic DNA walker [28]. Liu et al. modified a glassy carbon electrode with a heterostructure of core-shell multi-walled carbon nanotubes at reduced graphene oxide nanoribbons (GONRs) for glutathione detection [29]. Pajooheshpour et al. combined Au-Pt nanoclusters, bovine serum albumin, and GNRs to modify a GCE for the electrochemical detection of diazinon [30]. Although numerous studies have focused on nanocarbon-based biosensors, there is little information available on light sources and their effects on the PEC activities of GONRs. In this context, and based on our previous studies [31,32,33,34,35,36], we herein report visible-light-assisted PEC biosensors for the detection of uric acid (UA) by using GONRs with controllable properties. The PEC sensing activities of GONRs, synthesized under different microwave powers for the detection of UA, are systematically investigated via a solar simulator. Furthermore, the effects of wavelengths and irradiation intensities of light-emitting diode (LED) light sources on the Faradaic currents of UA oxidation are explored. These findings are especially interesting for the rational design of miniature power-saving devices or systems based on the PEC activities of GONRs towards point-of-care testing.

2. Experimental Section

2.1. Chemicals

MWCNTs (Ctube 120, CNT Co., Ltd., Songdo, Korea) were purchased from a new international vendor in replacement of an old vendor in our earlier publications [31,32,33,34,35,36]. The reason being that the original Mistui company has closed their production line in recent years [37]. All the other reagents were of analytical grade and used without further purification.

2.2. Preparation of GONRs

The GONRs and their electrodes were prepared by a focused microwave reactor (CEM-Discover, CEM, Charlotte, NC, USA) and a freeze dryer (FDS-1000, EYELA, Tokyo, Japan), following the similar procedures in our previous papers [31,32,33,34,35,36]. It is worthwhile to mention that the nanoribbon powders were collected and placed for drying in a freeze dryer overnight. The ribbon powders were mixed with water, ethanol, and Nafion to form a suspension. 10 µL of the suspension was dropped onto either a screen-printed carbon electrode or a glassy carbon electrode, followed by vacuum drying, to prepare a working electrode.

2.3. Characterization

The TEM (JEM-1230, JEOL, Tokyo, Japan) studies were performed to monitor the morphology evolution at an operating voltage of 100 kV. X-ray photoelectron spectroscopy (XPS) (ESCALAB 250, VG Scientific, Waltham, MA, USA) was used to analyze the changes in composition and bonding. The Raman spectra were characterized by a Raman spectrometer (UniDRON, UniNanoTech, Yongin, Korea), with a laser of 532 nm.

2.4. Electrochemical and Photoelectrochemical Measurements

A 3 mm diameter glassy carbon electrode (002012, ALS Co., Inc., Tokyo, Japan), a Ag/AgCl electrode (RE-1S, BAS Inc., Tokyo, Japan), and a platinum wire were used as a working electrode, a reference electrode, and a counter electrode, respectively. Cyclic voltammetry and differential pulsed voltammetry measurements were performed by an electrochemical analyzer (CHI7062E, CH Instruments, Inc., Austin, TX, USA). All solutions were prepared with de-ionized water with a resistivity of 18 MΩ/cm. Either a solar simulator (Newport, SP94022A, Newport, Irvine, CA, USA) or a wavelength-switchable LED (WLS-22-A, Mightex, T.O., Canada) were provided as the light source. For the PEC measurement, the distance between the light source and the working electrode was normally kept as 10 cm. When we set up the light intensity, the absorption of the wall of a quartz beaker and the electrolyte were ignored. Through a computer, we could adjust the current of an LED to change the light intensity. For example, the current of the blue light bulb of an LED is around 300 mA for the light intensity of 80 mW/cm2, as determined by a power meter (StarLite, Ophir, Darmstadt, Germany).

3. Results and Discussion

3.1. Characterization

Figure 1a displays transmission electron microscopy (TEM) images of the as-purchased/untreated MWCNT, verifying the hollow structure of the material. A microwave-assisted reaction was utilized to unzip the MWCNT in a mixed acid solution. During the reaction, functional groups that contained oxygen could connect to the sidewalls and both ends of the nanotubes, providing attack sites for permanganate ions. Then, sufficient energy input cleaved local carbon–carbon bonds at the outer layers of the nanotubes. Consequently, the nanotubes were gradually unzipped into nanoribbons [31,32]. TEM images of the GONRs unzipped at different microwave powers are shown in Figure 1b–f. The longitudinal length of the GONRs was not considerably different from that of the MWCNTs, demonstrating that the reaction did not shorten the nanotubes. Conversely, the widths of the GONRs were wider than the diameter of the MWCNTs. Compared to other ribbons at higher microwave powers, the sidewalls of GONR(50 W) did not seem to be completely unzipped. Furthermore, the edges of all the ribbon samples were not as continuous as that of our early study, and always contained some broken parts within a certain distance. Figure S1a illustrates the Raman spectra of MWCNTs and GONRs at the excitation laser wavelength of 532 nm. All spectra revealed two main bands, the G band (~1580 cm−1) and the D band (~1350 cm−1), indicating the characteristics of nanocarbon materials [38,39]. It was found that the ID/IG ratios (Figure S1b) of all ribbons were higher than that of MWCNT, indicating the highest value for GONRs unzipped at 50 W. This can be ascribed to the microwave power (50 W) being insufficient for completely unzipping the MWCNTs yet being high enough for a generation of abundant oxygen-containing groups, consequently contributing to the largest amount of defective sites (i.e., highest ID/IG ratio). On the contrary, greater powers (100–250 W) could help in unzipping the nanotubes into ribbons at larger extents, thereby possessing more graphitic regions (from the inner walls of the MWCNTs), i.e., contributing more graphitic Raman signals (lower ID/IG ratios). These results were in good agreement with the TEM observation, confirming that GONR(50 W) was not entirely unzipped.
X-ray photoelectron spectroscopy (XPS) was adopted to determine the surface compositions and the types of functional groups of the MWCNT and the GONRs. Figure 2 shows the XPS C1s spectra of MWCNT and GONR(50 ~ 250 W). The deconvolution peaks belonged to C-C/C=C (284.5 eV), C-OH (286.0 eV), C-O-C (287.3 eV), C=O (288.7 eV), and O-C=O (290.4 eV). The ratios of different functional groups of the MWCNT and the GONRs, derived from Figure 2, are summarized in Figure S2. In Figure S2, it is noticed that the C=O and O-C=O concentrations rose along with increasing microwave powers. Meanwhile, C-OH concentration reached the highest value at 50 W and later declined, implying that the C-OH group might have joined the reaction through the unzipping process. Some C-OH groups remained on the walls without completely unzipping at higher powers. Besides the surface analysis, elemental analyses confirmed the weight ratios of C and O for all samples. The similar trends can be observed.

3.2. Electrochemical Measurements

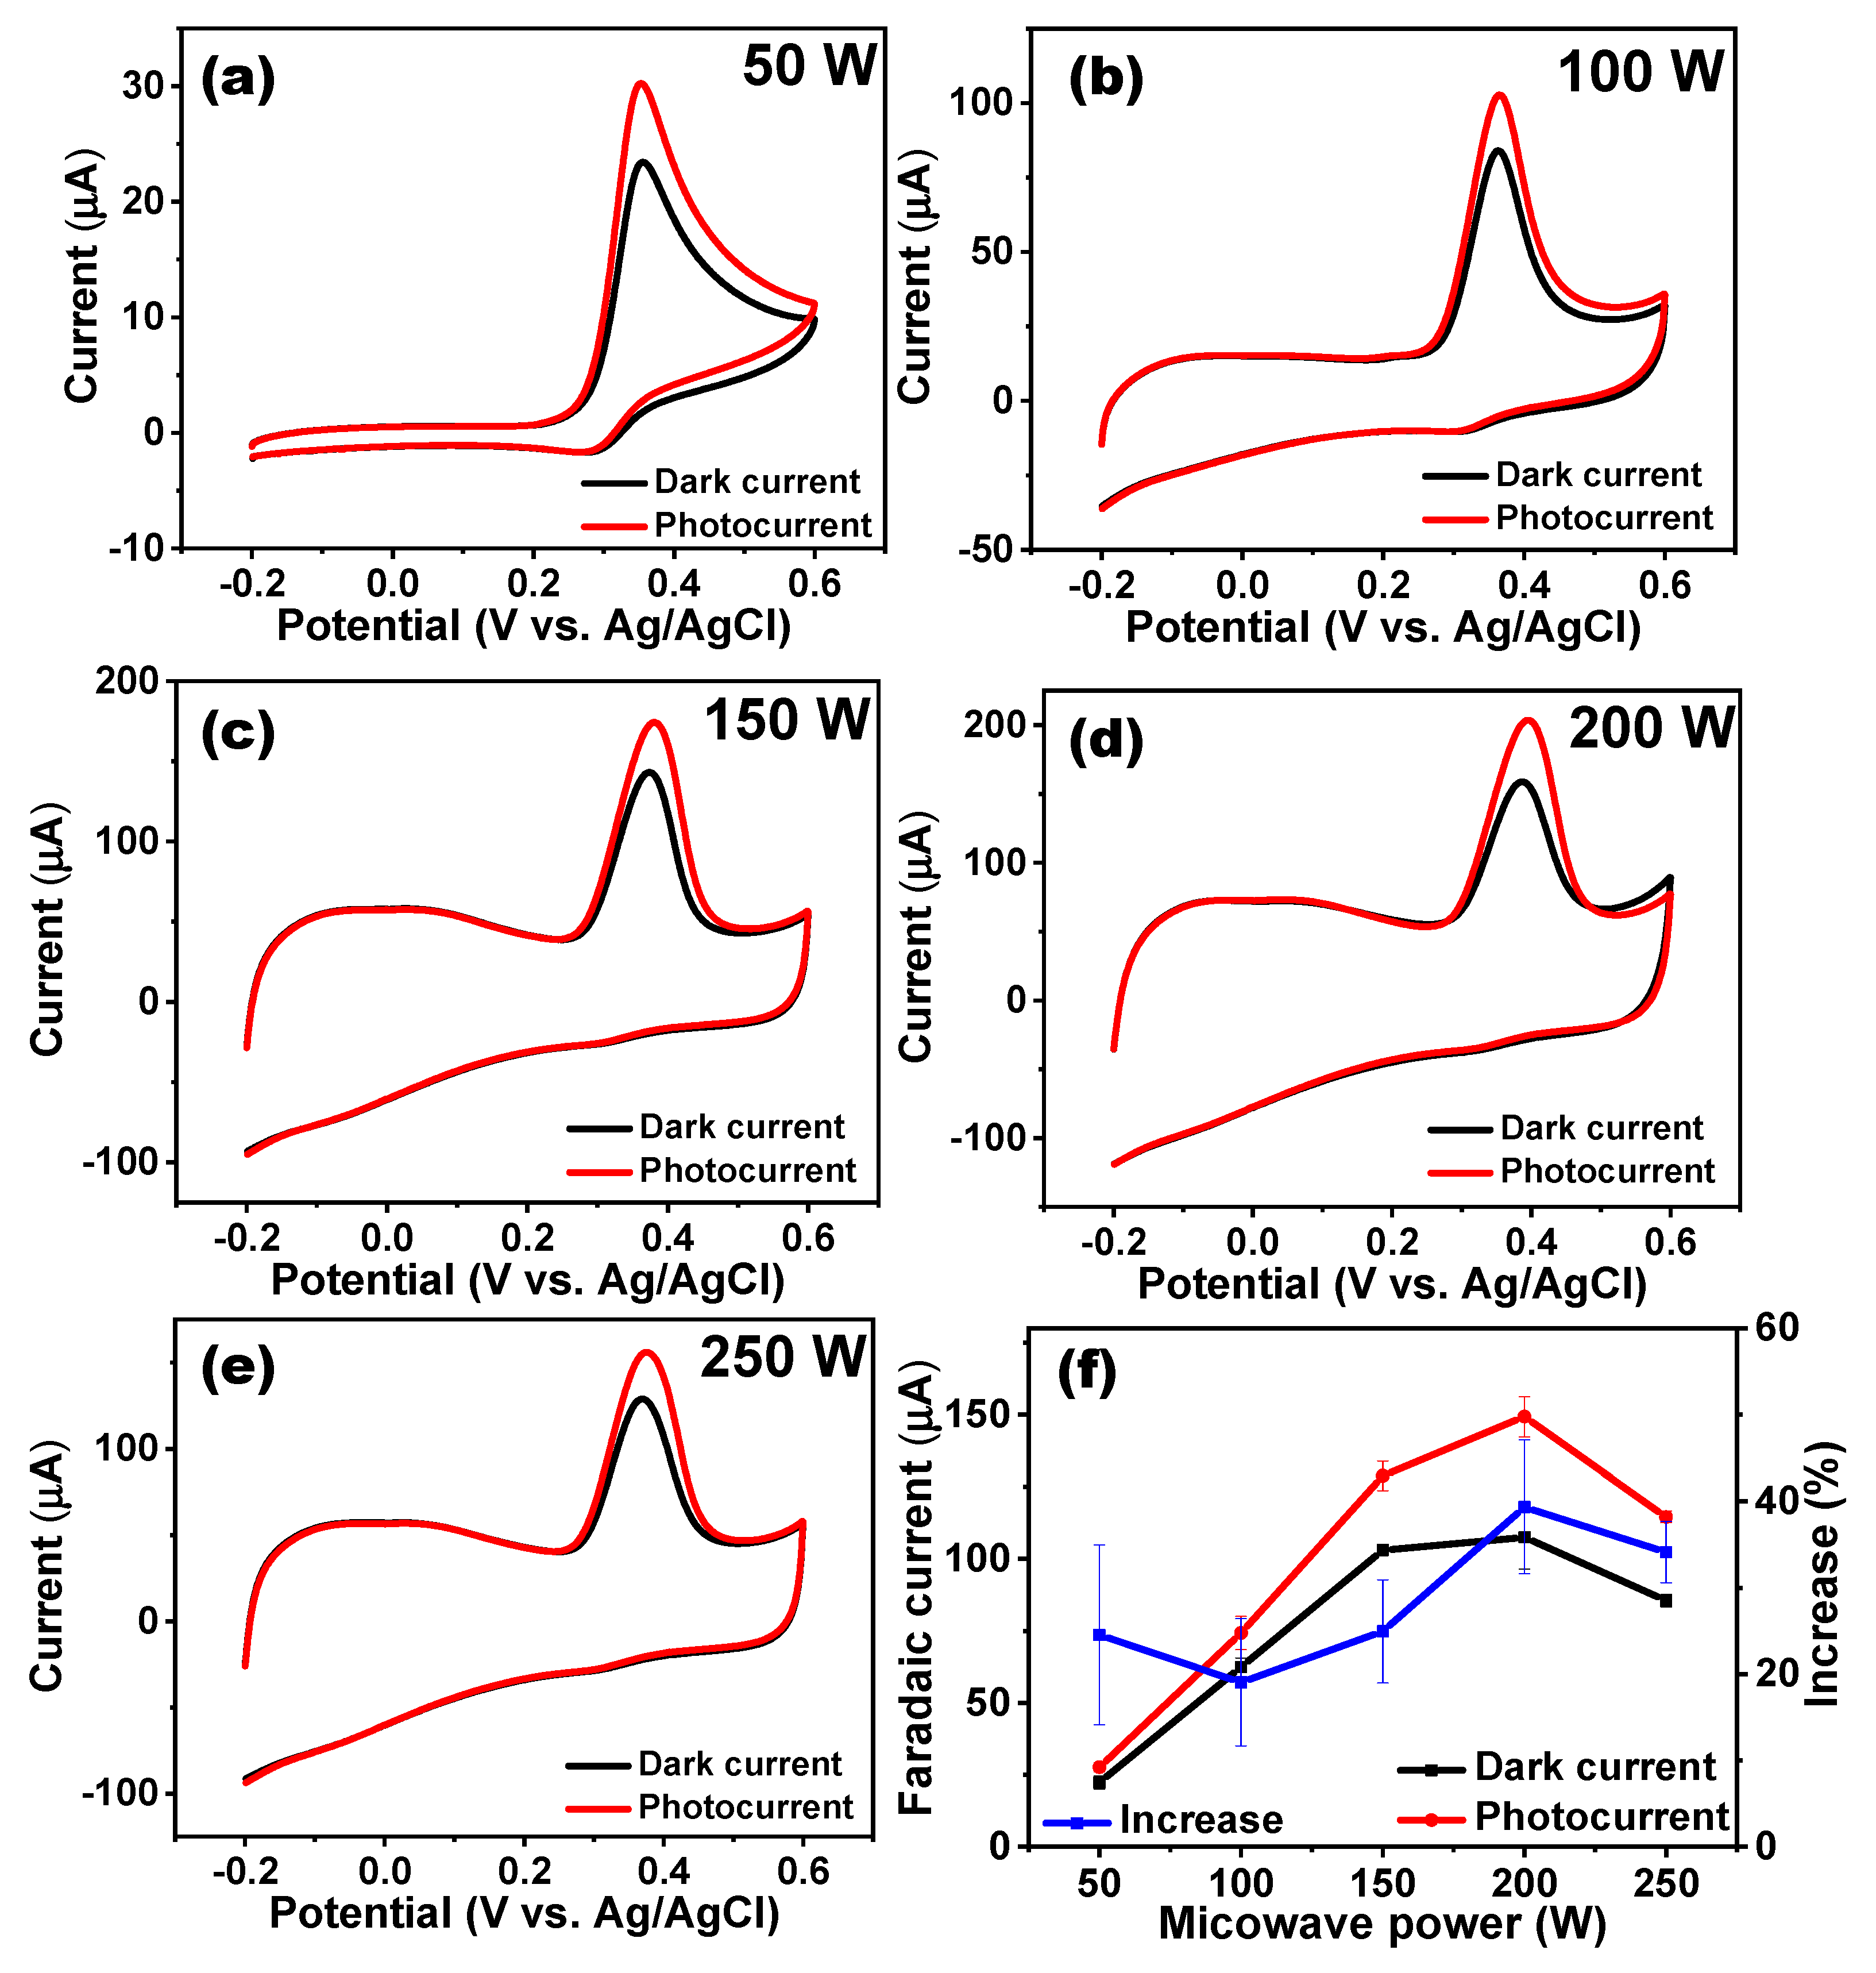
The cyclic voltammetry (CV) curves in Figure 3a–e show the dark currents and photocurrents of UA oxidation, using GONR(50–250 W) on SPCEs before and after AM 1.5 light irradiation. The electrolyte was 0.1 M phosphate-buffered saline (PBS) containing 0.3 mM UA, and the scan rate remained at 50 mV/s. The oxidation peaks of UA were located at 0.35 V to 0.39 V. The increase in Faradaic currents was gradually raised from 34.1% (GONR(50 W)) to 50.0% (GONR(200 W)), and then was dropped to 31.4% (GONR(250 W)). Among all catalysts, GONR(200 W) exhibited both the highest Faradaic dark current as well as the highest photocurrent. Its Faradaic dark current of 97.7 mA could grow up to 146.5 mA under light irradiation, demonstrating that GONR(200 W) was our best sample at this stage. In Figure 3f, using the low dark Faradaic current as the denominator for calculating the increase led to a more extensive error bar than the high dark Faradaic current. Conversely, we summarized the error bars in the increase from the experimental data by repeating the procedure five times. Consequently, they may appear to have had a wider distribution. The CV results for detecting ascorbic acid, dopamine, and UA are displayed in Figure S3 before and after light (AM 1.5) irradiation using GONR(200 W). Unlike UA oxidation, there was no obvious photo-enhanced phenomenon for ascorbic acid and dopamine detection. Therefore, in following experiments, we only focused on the UA oxidation reaction. It is worthwhile to mention that the double-layer CV curves with no UA added are recorded in Figure S4, indicating that GONR(200 W) could have also owned the largest capacitance among all ribbons.
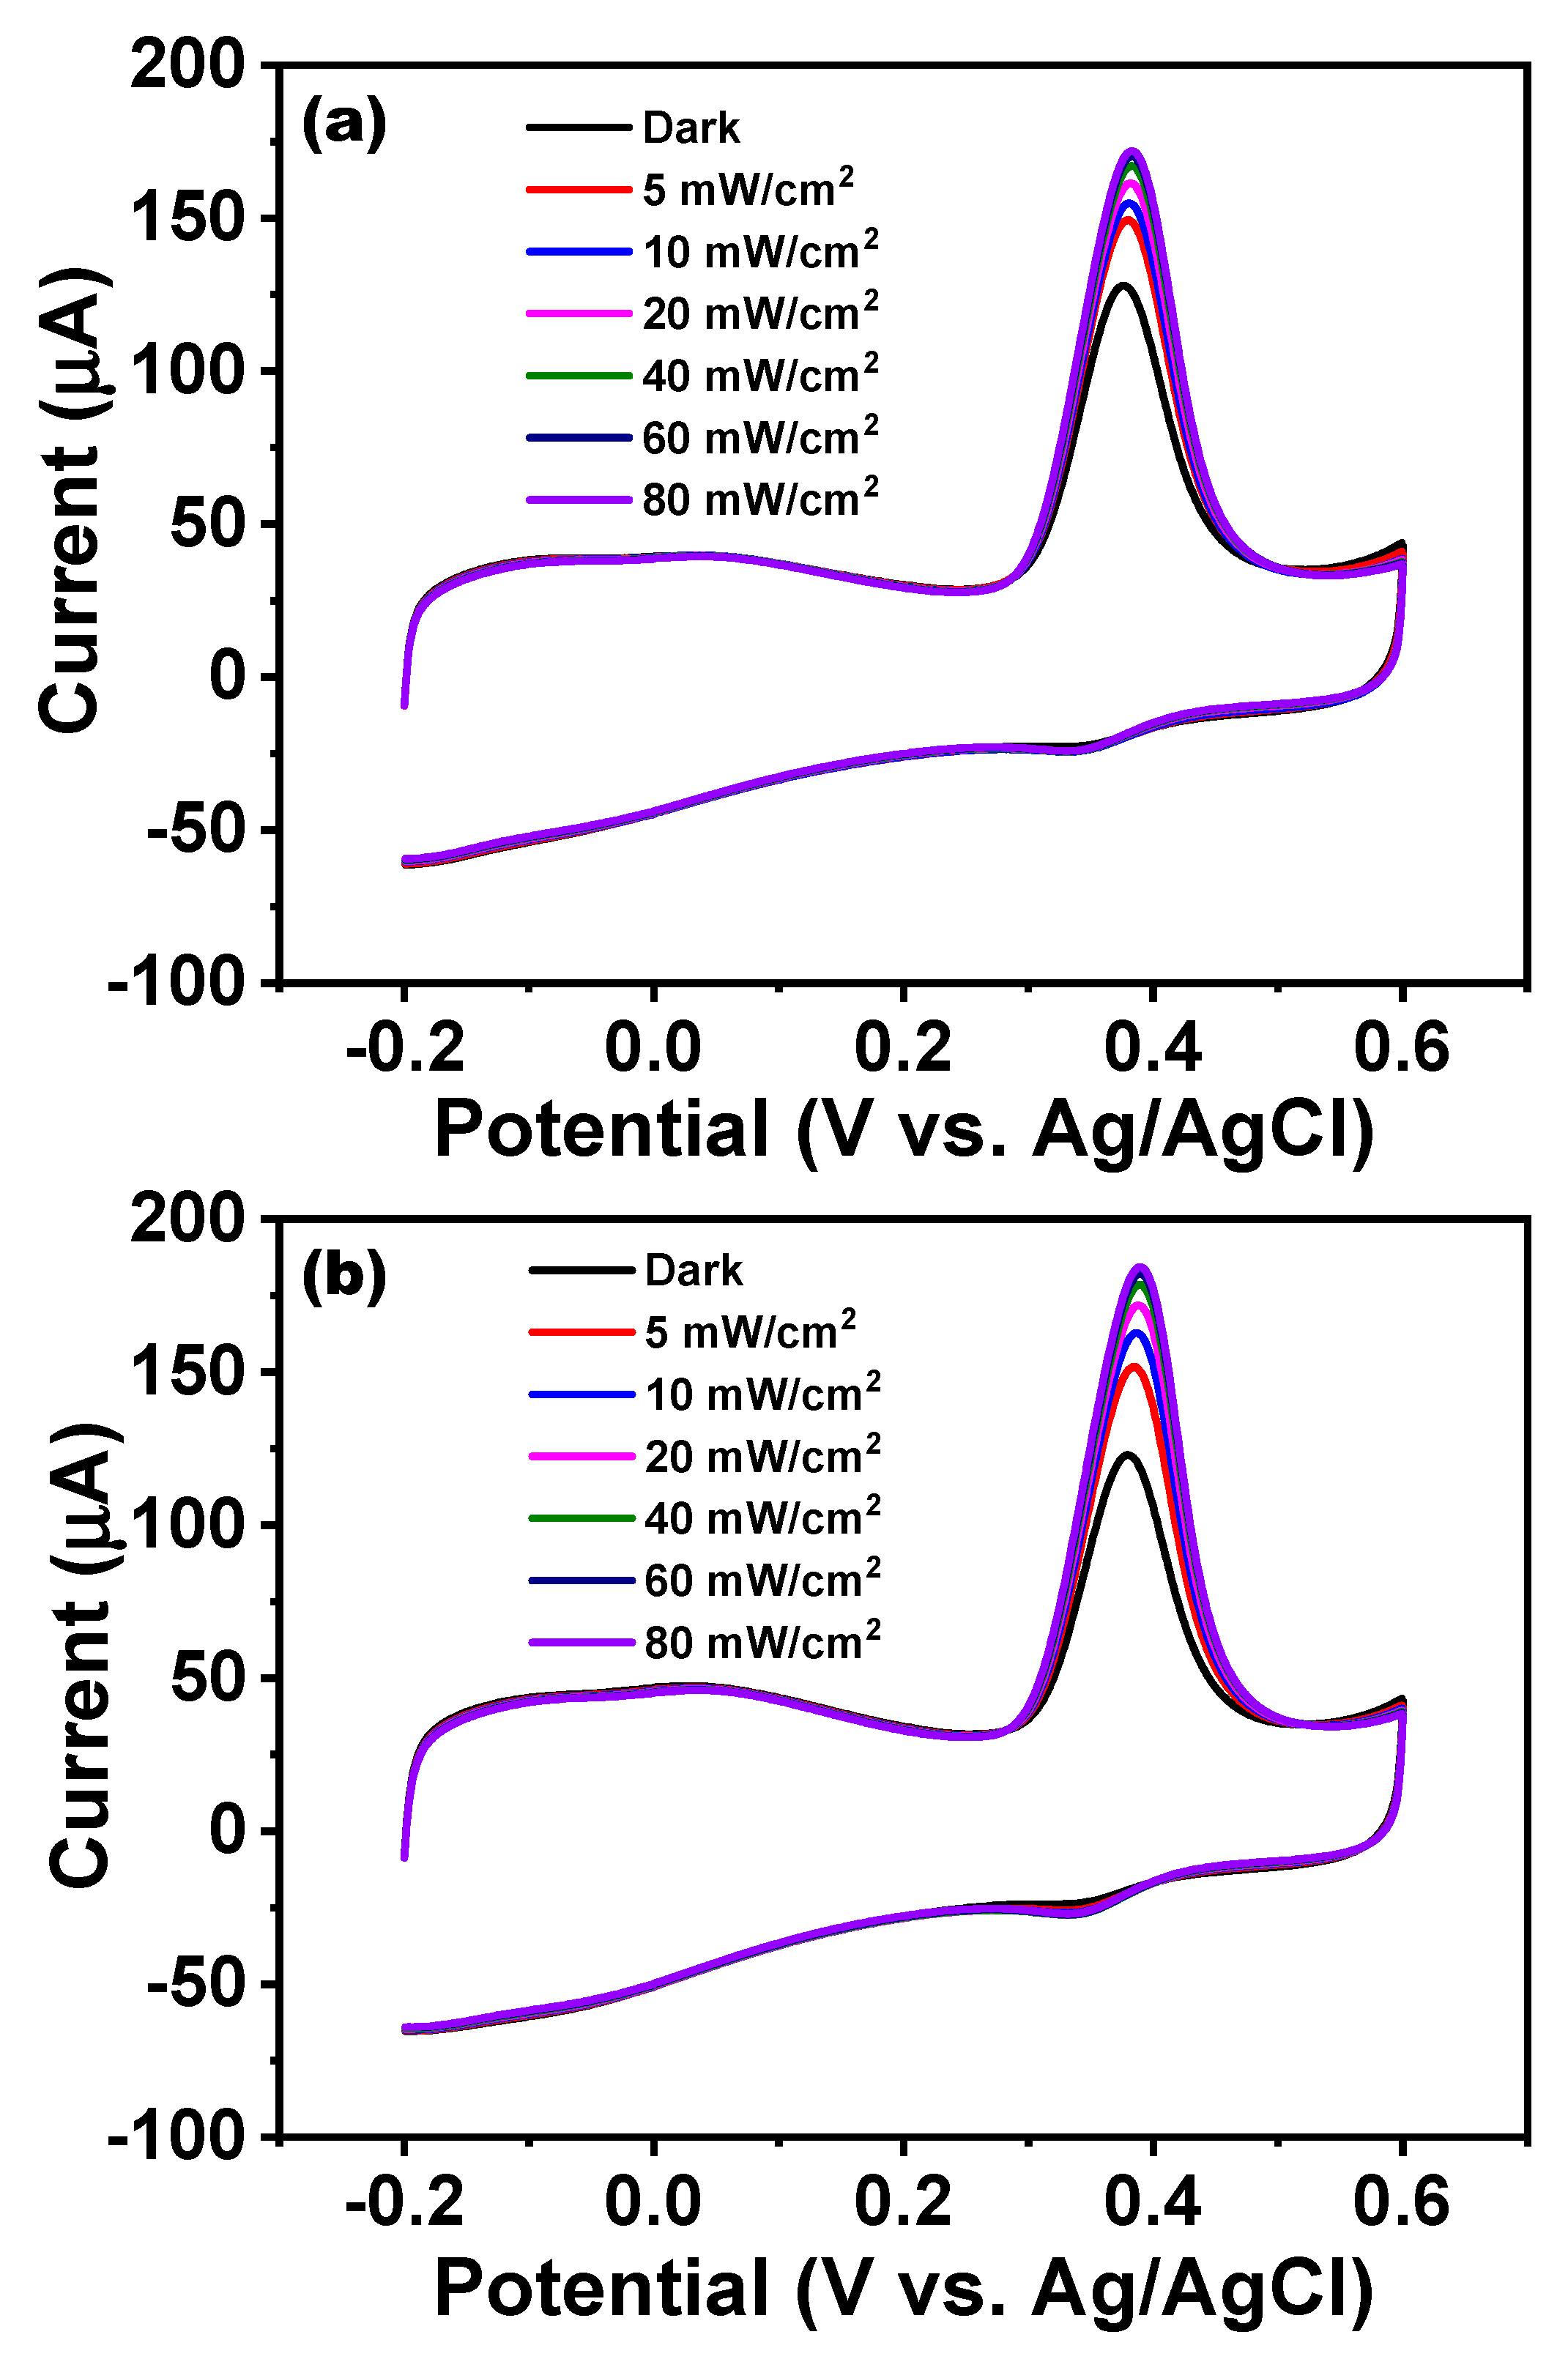
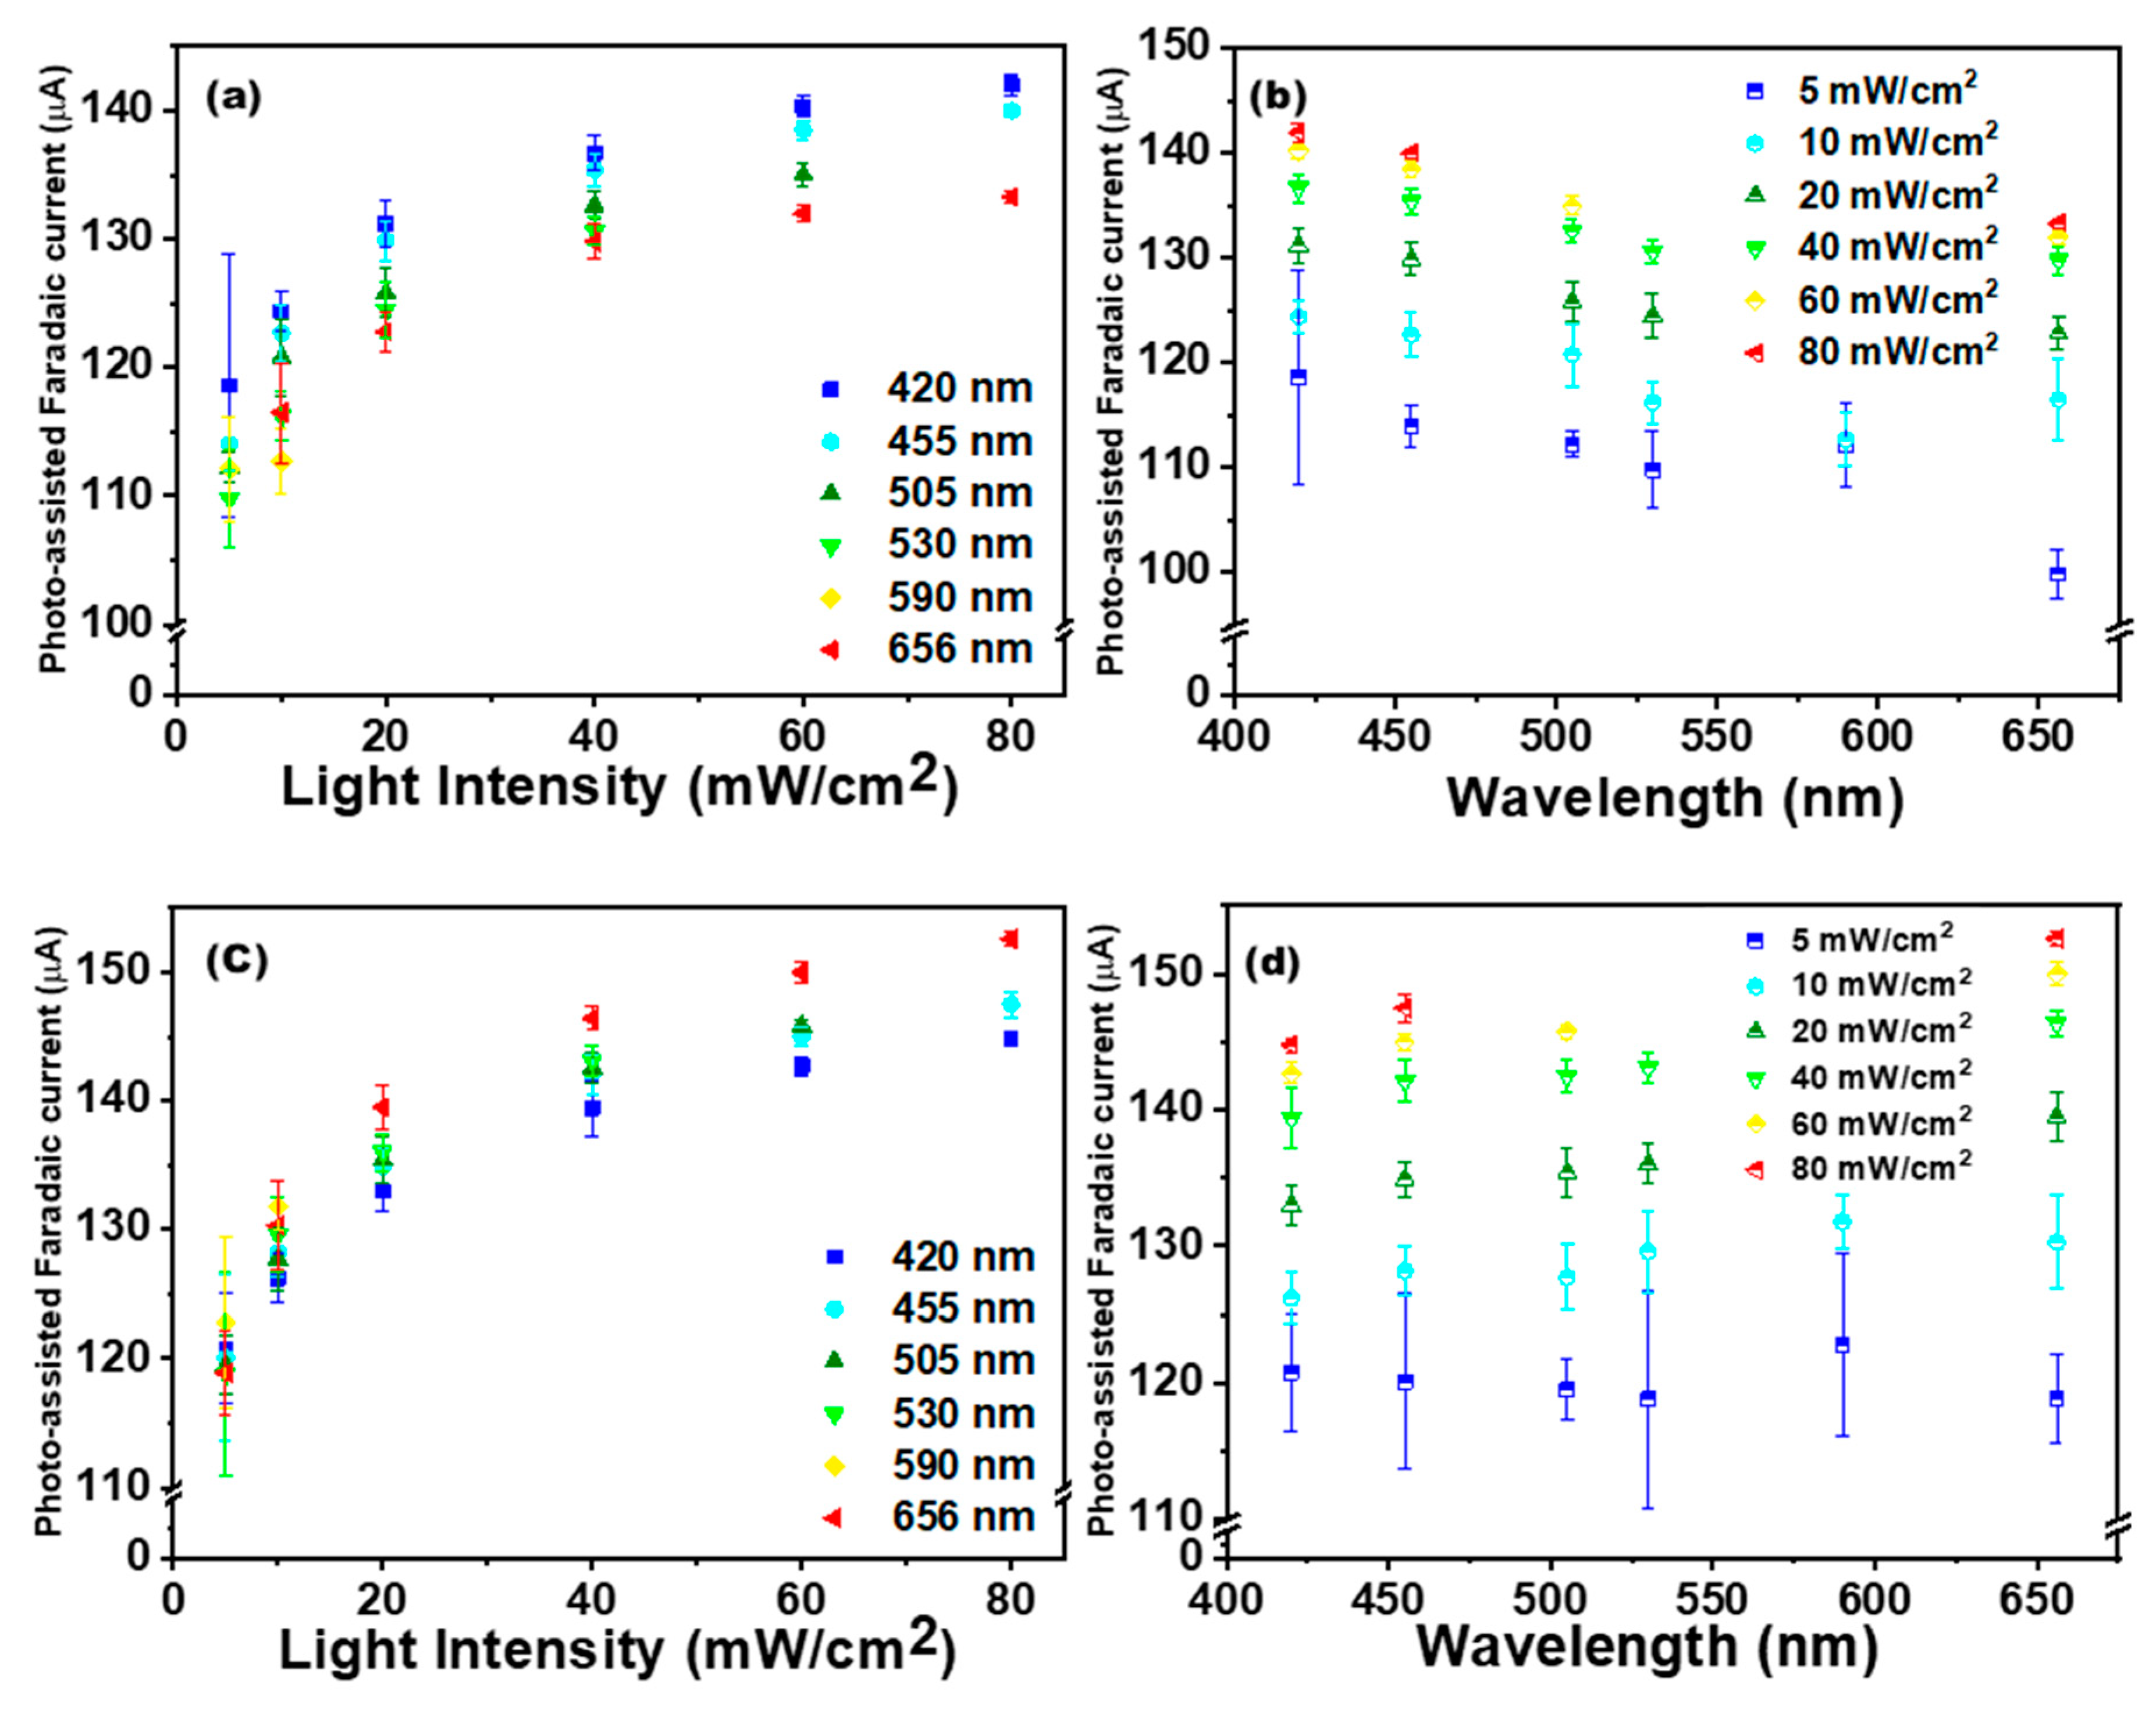
Figure 4a shows that the anodic oxidation peak current without light irradiation was 128.1 µA at a potential of approximately 0.38 V. After irradiation with blue light of 420 nm at an intensity of 5 mW/cm2 through LED, the anodic current rose to 149.4 µA, and the Faradaic current was increased by approximately 22.7%. Under subsequent blue light irradiations at different intensities of 10, 20, 40, 60, and 80 mW/cm2, the Faradaic currents were increased by 28.7%, 35.7%, 41.4%, 45.1%, and 46.9%, respectively. Thus, the Faradaic current increased with the light intensity, but at a gradually decreasing rate. Conversely, Figure 4b displays a CV plot under red light (656 nm) irradiation. At a potential of 0.38 V, the anodic peak current without irradiation was 122.8 µA. After red light irradiation with an intensity of 5 mW/cm2, the anodic current rose to 151.93 µA, and the Faradaic current increased by approximately 32.16%. Similarly, the Faradaic currents were increased by 44.8%, 55.1%, 62.7%, 66.7%, and 69.6% under the subsequent red light irradiation at the intensities of 10, 20, 40, 60, and 80 mW/cm2. Thus, under both blue and red light irradiation, the GONR(200 W) exhibited significant improvement in photo-assisted electrochemical biosensing. This phenomenon of using red light followed a similar trend observed under blue light irradiation, that is, the Faradaic current increased with the light intensity at a decreasing rate. In order to more carefully investigate this, six wavelengths from an LED were utilized for PEC experiments in addition to the original AM 1.5 light source. Figure 5a,c shows the processed Faradaic current data in CV measurement under light irradiations of 420, 455, 505, 530, 590, and 656 nm at different intensities. For example, when choosing the wavelength of 420 nm, we started the measurements by gradually increasing the light intensities from 5, 10, 20, 40, 60 to 80 mW/cm2. After finishing the 420 nm, we moved to the following wavelengths of 455, 505, 530, 590, and 656 nm, one by one. On the contrary, we started from 420 nm to 656 nm in Figure 5a, but reversed the sequences from 656 nm to 420 nm in Figure 5c. Irrespective of the wavelengths of light, we clearly observed that the light-assisted Faradaic current gradually increased with the light intensity, but at a gradually decreasing rate under all six wavelengths. Notably, the increase in the Faradaic current decreased after changing wavelengths, presumably due to the reduced catalyst activity over the extended experimental time. Figure 5b,d shows that the increase in the photo-assisted Faradaic current could be independent of wavelengths. Therefore, this suggests that light intensity had a stronger effect than the wavelength on enhancing the photo-assisted Faradaic current. As seen in Figure 5, we always started the experiments from low light intensity to high intensity for one specific wavelength. The total experiment time for either Figure 5a,b or Figure 5c,d took approximately 7 h. It was observed that the data from the low light intensity of 5 mW/cm2 usually had a more expansive error bar. Finally, differential pulse voltammetry (DPV) results from when we changed UA concentrations with or without blue light (80 mW/cm2) irradiation are presented in Figure S5. Under a dark circumstance, it was found that the anodic oxidation peak current was barely detectable at relatively low UA concentrations, that is, concentrations below 10 μM. The sensitivity displayed in Figure S5 is the slope divided by the carbon electrode’s geometry area (3 mm diameter circle). The calculated sensitivity was 2.69 µA/µMcm2 for the dark current. Figure S5c shows the response current depending on UA concentration under blue light (80 mW/cm2) irradiation. The calculated sensitivity was 5.52 µA/µMcm2 below 200 mM. It shows a considerably higher sensitivity to low-concentration UA with light irradiation compared to that without light irradiation. A summary on the average conversion efficiencies in cyclic voltammograms of GONR(200 W) with LED irradiation under different wavelengths and light intensities is depicted in Figure 6, with detailed information provided in Figure S6 and Tables S1–S4. There are two examples for calculating the conversion efficiencies displayed in Supplementary Tables S1 and S2. In Supplementary Table S1, we dealt with the case for 420 nm with 5 mW/cm2. In Supplementary Table S2, we turned to 656 nm with 80 mW/cm2. All the exact numbers can be found in the Supplementary Tables S3 and S4. On the one hand, the photon with the lower wavelength and higher energy could exhibit the better average conversion efficiency. On the other hand, the photon from the lower light intensity at the same wavelength could also own better conversion efficiency. Therefore, we can observe that the best average photon-to-electron conversion efficiency is over 20.00% for the short wavelength of 420 nm and the low intensity of 5 mW/cm2.

4. Conclusions

In summary, we have applied a microwave heating process to unzip MWCNTs into GONRs in a mixed acid solution. The GONRs were used to modify a working electrode for the photo-assisted biosensing of UA. The GONR(200 W) displayed better photo-enhanced electrochemical UA oxidation activity than other nanoribbons. Furthermore, irradiating the electrode surface with different light sources increased the response current over that obtained in a dark environment. For 0.3 mM UA and a light intensity of 5 mW/cm2, the Faradaic current of GONR(200 W) increased by approximately 20.0%, irrespective of light wavelengths. At a light intensity of 80 mW/cm2, the Faradaic current was increased by around 40.0%, suggesting that light intensity plays a significant role in our experiments. A DPV experiment showed an approximately two-fold increase in sensitivity from 2.687 µA/µMcm2 to 5.517 µA/µMcm2 under light irradiation at low concentrations. Therefore, it is believed that GONRs exhibited an excellent photocurrent response under light illumination for PEC biosensing applications.

Supplementary Materials

The following are available online at www.mdpi.com/2079-4991/11/10/2693/s1, Figure S1: Raman spectra of MWCNT and GONRs, Figure S2: XPS bonding ratios of MWCNT and GONRs. Figure S3: CVs of GONR(200 W)., Figure S4: CVs of GONRs. Figure S5: DPVs of GONR(200 W). Figure S6: Conversion efficiencies of GONR(200 W), Table S1: Conversion efficiency (%) calculation for 420 nm with 5 mW/cm2, Table S2: Conversion efficiency (%) calculation for 656 nm with 80 mW/cm2, Table S3: Calculation details when light illumination was carried out from 420 nm to 656 nm, Table S4: Calculation details when light illumination was carried out from 656 nm to 420 nm.

Author Contributions

Conceptualization, C.-L.S. and Y.-J.L.; methodology, C.-H.L. and C.-H.K.; formal analysis, C.-L.S., T.-C.C., C.-Y.C. and Y.-J.L.; investigation, C.-H.L., C.-H.K., C.-W.H. and D.D.N.; resources, C.-L.S. and Y.-J.L.; writing—original draft preparation, C.-L.S., T.-C.C., C.-Y.C. and Y.-J.L.; writing—review and editing, C.-L.S. and Y.-J.L.; supervision, C.-L.S.; project administration, C.-L.S.; funding acquisition, C.-L.S. and Y.-J.L. All authors have read and agreed to the published version of the manuscript.

Funding

This research was funded by Chang Gung Memorial Hospital, grant number BMRPA64 and grand number CMRPD2H0321.

Acknowledgments

This work was supported by the grants from the Ministry of Science and Technology and Chang Gung Memorial Hospital (BMRPA64 and CMRPD2H0321).

Conflicts of Interest

The authors declare no conflict of interest.

References

  1. Rashid, M.H.; Koel, A.; Rang, T. Simulations of Graphene Nanoribbon Field Effect Transistor for the Detection of Propane and Butane Gases: A First Principles Study. Nanomaterials 2020, 10, 98. [Google Scholar] [CrossRef] [PubMed] [Green Version]
  2. Damasceno, D.A.; Rajapakse, R.K.N.D.N.; Mesquita, E. Atomistic Modelling of Size-Dependent Mechanical Properties and Fracture of Pristine and Defective Cove-Edged Graphene Nanoribbons. Nanomaterials 2020, 10, 1422. [Google Scholar] [CrossRef]
  3. Lin, S.-Y.; Tran, N.T.T.; Lin, M.-F. Diversified Phenomena in Metal- and Transition-Metal-Adsorbed Graphene Nanoribbons. Nanomaterials 2021, 11, 630. [Google Scholar] [CrossRef] [PubMed]
  4. Li, P.; Liu, J.; Her, S.; Zal Nezhad, E.; Lim, S.; Bae, S. Synthesis of Highly-Dispersed Graphene Oxide Nanoribbons–Functionalized Carbon Nanotubes–Graphene Oxide (GNFG) Complex and Its Application in Enhancing the Mechanical Properties of Cementitious Composites. Nanomaterials 2021, 11, 1669. [Google Scholar] [CrossRef]
  5. Suzuki, K.; Nakagawa, R.; Zhang, Q.; Miura, H. Development of Highly Sensitive Strain Sensor Using Area-Arrayed Graphene Nanoribbons. Nanomaterials 2021, 11, 1701. [Google Scholar] [CrossRef] [PubMed]
  6. Sivula, K.; van de Krol, R. Semiconducting materials for photoelectrochemical energy conversion. Nat. Rev. Mater. 2016, 1, 15010. [Google Scholar] [CrossRef]
  7. Yu, H.; Shi, R.; Zhao, Y.; Waterhouse, G.I.; Wu, L.Z.; Tung, C.H.; Zhang, T. Smart Utilization of Carbon Dots in Semiconductor Photocatalysis. Adv. Mater. 2016, 28, 9454–9477. [Google Scholar] [CrossRef]
  8. Roger, I.; Shipman, M.A.; Symes, M.D. Earth-abundant catalysts for electrochemical and photoelectrochemical water splitting. Nat. Rev. Chem. 2017, 1, 0003. [Google Scholar] [CrossRef]
  9. Li, X.; Zhu, L.; Zhou, Y.; Yin, H.; Ai, S. Enhanced Photoelectrochemical Method for Sensitive Detection of Protein Kinase A Activity Using TiO2/g-C3N4, PAMAM Dendrimer, and Alkaline Phosphatase. Anal. Chem. 2017, 89, 2369–2376. [Google Scholar] [CrossRef]
  10. Lin, Y.; Zhou, Q.; Tang, D.; Niessner, R.; Knopp, D. Signal-On Photoelectrochemical Immunoassay for Aflatoxin B1 Based on Enzymatic Product-Etching MnO2 Nanosheets for Dissociation of Carbon Dots. Anal. Chem. 2017, 89, 5637–5645. [Google Scholar] [CrossRef]
  11. Shu, J.; Qiu, Z.; Lv, S.; Zhang, K.; Tang, D. Plasmonic Enhancement Coupling with Defect-Engineered TiO2-x: A Mode for Sensitive Photoelectrochemical Biosensing. Anal. Chem. 2018, 90, 2425–2429. [Google Scholar] [CrossRef]
  12. Zhou, Q.; Lin, Y.; Zhang, K.; Li, M.; Tang, D. Reduced graphene oxide/BiFeO3 nanohybrids-based signal-on photoelectrochemical sensing system for prostate-specific antigen detection coupling with magnetic microfluidic device. Biosens. Bioelectron. 2018, 101, 146–152. [Google Scholar] [CrossRef]
  13. Sun, M.; Zhu, Y.; Yan, K.; Zhang, J. Dual-mode visible light-induced aptasensing platforms for bleomycin detection based on CdS-In2S3 heterojunction. Biosens. Bioelectron. 2019, 145, 111712. [Google Scholar] [CrossRef]
  14. Qian, Y.; Feng, J.; Wang, H.; Fan, D.; Jiang, N.; Wei, Q.; Ju, H. Sandwich-type signal-off photoelectrochemical immunosensor based on dual suppression effect of PbS quantum dots/Co3O4 polyhedron as signal amplification for procalcitonin detection. Sens. Actuators B Chem. 2019, 300, 127001. [Google Scholar] [CrossRef]
  15. Zhu, X.; Gao, L.; Tang, L.; Peng, B.; Huang, H.; Wang, J.; Yu, J.; Ouyang, X.; Tan, J. Ultrathin PtNi nanozyme based self-powered photoelectrochemical aptasensor for ultrasensitive chloramphenicol detection. Biosens. Bioelectron. 2019, 146, 111756. [Google Scholar] [CrossRef]
  16. Deng, K.; Wang, H.; Xiao, J.; Li, C.; Zhang, S.; Huang, H. Polydopamine nanospheres loaded with l-cysteine-coated cadmium sulfide quantum dots as photoelectrochemical signal amplifier for PSA detection. Anal. Chim. Acta 2019, 1090, 143–150. [Google Scholar] [CrossRef]
  17. Zhu, Y.; Xu, Z.; Gao, J.; Ji, W.; Zhang, J. An antibody-aptamer sandwich cathodic photoelectrochemical biosensor for the detection of progesterone. Biosens. Bioelectron. 2020, 160, 112210. [Google Scholar] [CrossRef] [PubMed]
  18. Liu, Q.; Kim, J.; Cui, T. A highly sensitive photoelectrochemical sensor with polarity-switchable photocurrent for detection of trace hexavalent chromium. Sens. Actuators B Chem. 2020, 317, 128181. [Google Scholar] [CrossRef]
  19. Zhang, Z.; Zhang, M.; Xu, Y.; Wen, Z.; Ding, C.; Guo, Y.; Hao, N.; Wang, K. Bi3+ engineered black anatase titania coupled with graphene for effective tobramycin photoelectrochemical detection. Sens. Actuators B Chem. 2020, 321, 128464. [Google Scholar] [CrossRef]
  20. Ma, S.; Yang, Q.; Zhang, W.; Xiao, G.; Wang, M.; Cheng, L.; Zhou, X.; Zhao, M.; Ji, J.; Zhang, J.; et al. Silver nanoclusters and carbon dots based light-addressable sensors for multichannel detections of dopamine and glutathione and its applications in probing of parkinson’s diseases. Talanta 2020, 219, 121290. [Google Scholar] [CrossRef] [PubMed]
  21. Kawai, S.; Benassi, A.; Gnecco, E.; Söde, H.; Pawlak, R.; Feng, X.; Müllen, K.; Passerone, D.; Pignedoli, C.A.; Ruffieux, P.; et al. Superlubricity of graphene nanoribbons on gold surfaces. Science 2016, 351, 957–961. [Google Scholar] [CrossRef] [Green Version]
  22. Ruffieux, P.; Wang, S.; Yang, B.; Sanchez-Sanchez, C.; Liu, J.; Dienel, T.; Talirz, L.; Shinde, P.; Pignedoli, C.A.; Passerone, D.; et al. On-surface synthesis of graphene nanoribbons with zigzag edge topology. Nature 2016, 531, 489–492. [Google Scholar] [CrossRef] [Green Version]
  23. Yu, X.; Wang, B.; Gong, D.; Xu, Z.; Lu, B. Graphene Nanoribbons on Highly Porous 3D Graphene for High-Capacity and Ultrastable Al-Ion Batteries. Adv. Mater. 2017, 29, 1604118. [Google Scholar] [CrossRef]
  24. Rizzo, D.J.; Veber, G.; Cao, T.; Bronner, C.; Chen, T.; Zhao, F.; Rodriguez, H.; Louie, S.G.; Crommie, M.F.; Fischer, F.R. Topological band engineering of graphene nanoribbons. Nature 2018, 560, 204–208. [Google Scholar] [CrossRef] [PubMed]
  25. Vukojevic, V.; Djurdjic, S.; Ognjanovic, M.; Antic, B.; Kalcher, K.; Mutic, J.; Stankovic, D.M. RuO2/graphene nanoribbon composite supported on screen printed electrode with enhanced electrocatalytic performances toward ethanol and NADH biosensing. Biosens. Bioelectron. 2018, 117, 392–397. [Google Scholar] [CrossRef]
  26. Tang, Z.; He, J.; Chen, J.; Niu, Y.; Zhao, Y.; Zhang, Y.; Yu, C. A sensitive sandwich-type immunosensor for the detection of galectin-3 based on N-GNRs-Fe-MOFs@AuNPs nanocomposites and a novel AuPt-methylene blue nanorod. Biosens. Bioelectron. 2018, 101, 253–259. [Google Scholar] [CrossRef] [PubMed]
  27. Li, Y.; He, J.; Chen, J.; Niu, Y.; Zhao, Y.; Zhang, Y.; Yu, C. A dual-type responsive electrochemical immunosensor for quantitative detection of PCSK9 based on n-C60-PdPt/N-GNRs and Pt-poly(methylene blue) nanocomposites. Biosens. Bioelectron. 2018, 101, 7–13. [Google Scholar] [CrossRef]
  28. Feng, Q.; Zhao, X.; Guo, Y.; Liu, M.; Wang, P. Stochastic DNA walker for electrochemical biosensing sensitized with gold nanocages@graphene nanoribbons. Biosens. Bioelectron. 2018, 108, 97–102. [Google Scholar] [CrossRef]
  29. Liu, Q.; Bao, J.; Yang, M.; Wang, X.; Lan, S.; Hou, C.; Wang, Y.; Fa, H. A core-shell MWCNT@rGONR heterostructure modified glassy carbon electrode for ultrasensitive electrochemical detection of glutathione. Sens. Actuators B Chem. 2018, 274, 433–440. [Google Scholar] [CrossRef]
  30. Pajooheshpour, N.; Rezaei, M.; Hajian, A.; Afkhami, A.; Sillanpää, M.; Arduini, F.; Bagheri, H. Protein templated Au-Pt nanoclusters-graphene nanoribbons as a high performance sensing layer for the electrochemical determination of diazinon. Sens. Actuators B Chem. 2018, 275, 180–189. [Google Scholar] [CrossRef]
  31. Sun, C.-L.; Chang, C.-T.; Lee, H.-H.; Zhou, J.; Wang, J.; Sham, T.-K.; Pong, W.-F. Microwave-Assisted Synthesis of a Core-Shell MWCNT-GONR Heterostructure for the Electrochemical Detection of Ascorbic Acid, Dopamine, and Uric Acid. ACS Nano 2011, 5, 7788–7795. [Google Scholar] [CrossRef]
  32. Sun, C.L.; Su, C.H.; Wu, J.J. Synthesis of short graphene oxide nanoribbons for improved biomarker detection of Parkinson’s disease. Biosens. Bioelectron. 2015, 67, 327–333. [Google Scholar] [CrossRef]
  33. Lan, Y.-W.; Torres, C.M., Jr.; Zhu, X.; Sun, C.-L.; Zhu, S.; Chen, C.-D.; Wang, K.-L. Self-aligned graphene oxide nanoribbon stack with gradient bandgap for visible-light photodetection. Nano Energy 2016, 27, 114–120. [Google Scholar] [CrossRef] [Green Version]
  34. Lin, T.E.; Lu, Y.J.; Sun, C.L.; Pick, H.; Chen, J.P.; Lesch, A.; Girault, H.H. Soft Electrochemical Probes for Mapping the Distribution of Biomarkers and Injected Nanomaterials in Animal and Human Tissues. Angew. Chem. Int. Ed. Engl. 2017, 56, 16498–16502. [Google Scholar] [CrossRef] [PubMed]
  35. Zhang, R.; Zhang, C.; Zheng, F.; Li, X.; Sun, C.-L.; Chen, W. Nitrogen and sulfur co-doped graphene nanoribbons: A novel metal-free catalyst for high performance electrochemical detection of 2,4,6-trinitrotoluene (TNT). Carbon 2018, 126, 328–337. [Google Scholar] [CrossRef]
  36. Liu, Y.-C.; Hung, Y.-H.; Liu, S.-F.; Guo, C.-H.; Liu, T.-Y.; Sun, C.-L.; Chen, H.-Y. Core–shell structured multiwall carbon nanotube–graphene oxide nanoribbon and its N-doped variant as anodes for high-power microbial fuel cells. Sustain. Energy Fuels 2020, 4, 5339–5351. [Google Scholar] [CrossRef]
  37. Wang, T.; Wang, Z.; Salvatierra, R.V.; McHugh, E.; Tour, J.M. Top-down synthesis of graphene nanoribbons using different sources of carbon nanotubes. Carbon 2020, 158, 615–623. [Google Scholar] [CrossRef]
  38. Silver, A.; Kitadai, H.; Liu, H.; Granzier-Nakajima, T.; Terrones, M.; Ling, X.; Huang, S. Chemical and Bio Sensing Using Graphene-Enhanced Raman Spectroscopy. Nanomaterials 2019, 9, 516. [Google Scholar] [CrossRef] [Green Version]
  39. Jakubowski, W.; Atraszkiewicz, R.; Nowak, D.; Batory, D.; Szymański, W.; Sobczyk-Guzenda, A.; Kaczmarek, Ł.; Kula, P.; Cłapa, M.; Warga, T.; et al. Optimization of Glutathione Adhesion Process to Modified Graphene Surfaces. Nanomaterials 2021, 11, 756. [Google Scholar] [CrossRef]
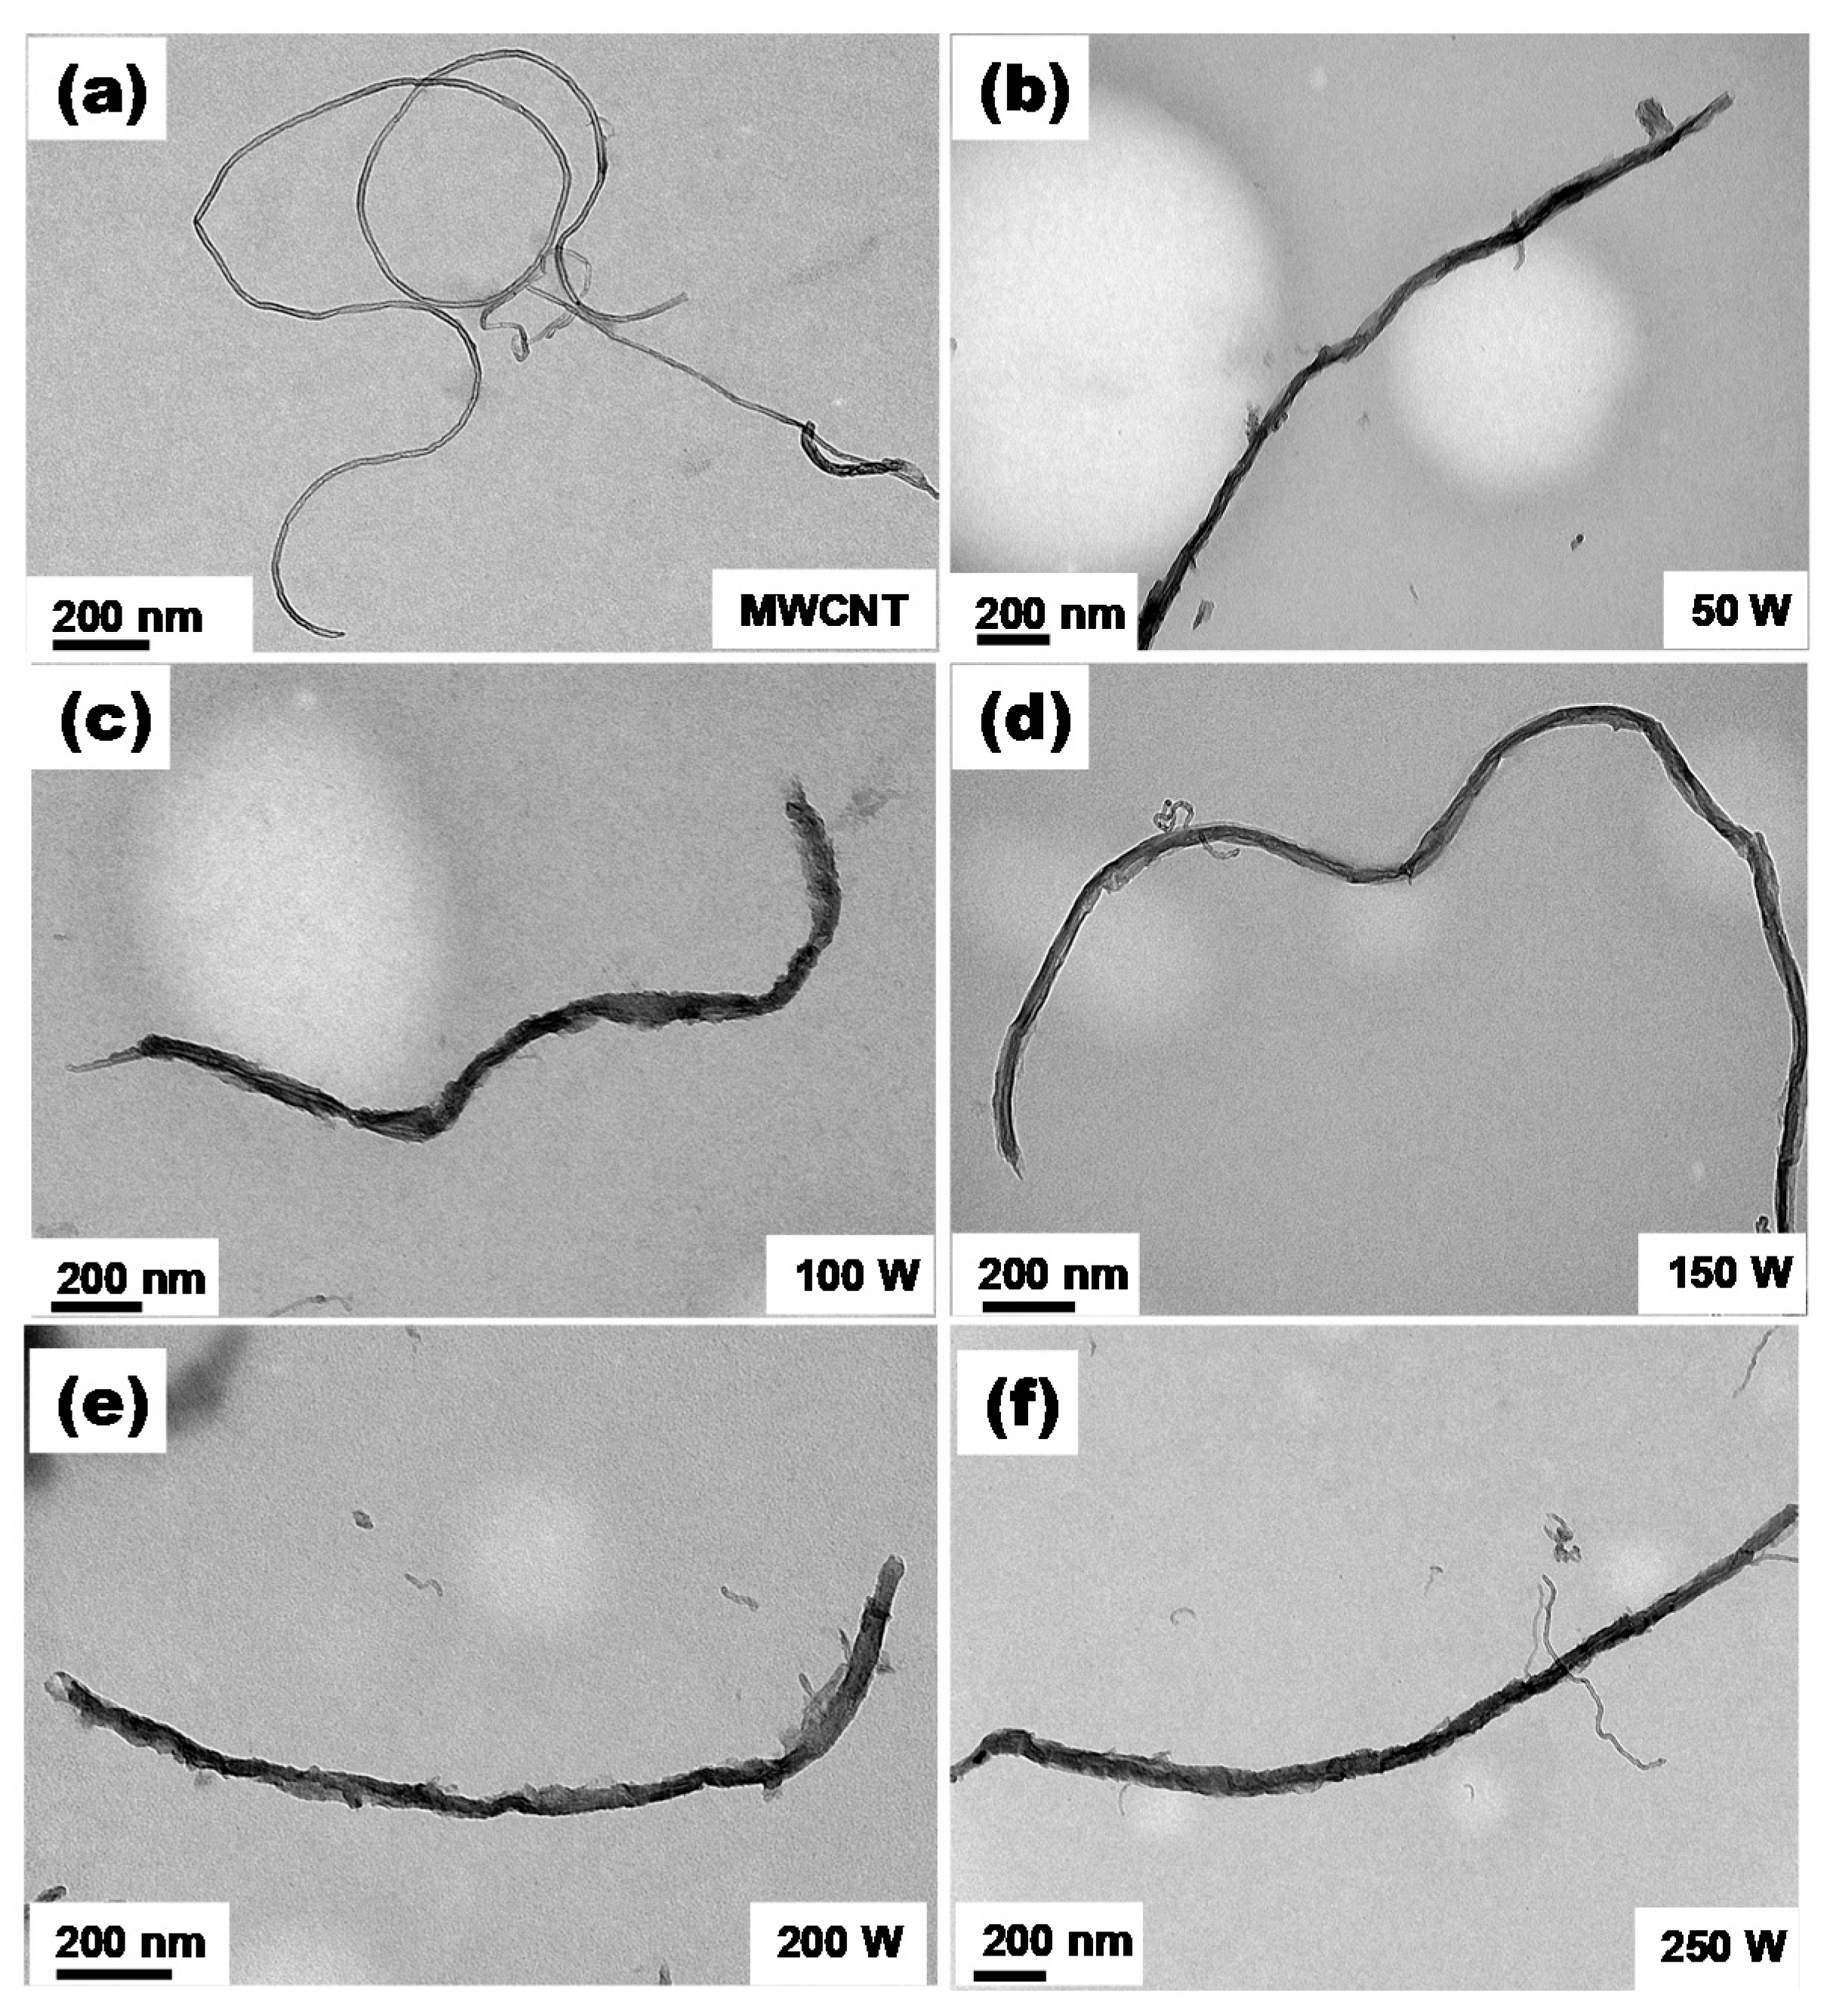
Figure 1. TEM images of (a) MWCNT, (b) GONR(50 W), (c) GONR(100 W), (d) GONR(150 W), (e) GONR(200 W), and (f) GONR(250 W) before and after the microwave-assisted unzipping process at different microwave powers.
Nanomaterials 11 02693 g001
Figure 2. XPS spectra of (a) MWCNT, (b) GONR(50 W), (c) GONR(100 W), (d) GONR(150 W), (e) GONR(200 W), and (f) GONR(250 W) before and after the microwave-assisted unzipping process at different microwave powers.
Nanomaterials 11 02693 g002
Figure 3. Cyclic voltammograms of (a) GONR(50 W), (b) GONR(100 W), (c) GONR(150 W), (d) GONR(200 W), and (e) GONR(250 W) with or without light (AM 1.5) illumination. (electrolyte: 0.3 mM UA + 0.1 M PBS, scan rate: 50 mV/s) (f) The corresponding summary figure of Faradaic currents from Figure 3a to Figure 3e. The screen-printed carbon electrode was used for preparing the working electrode in Figure 3.
Nanomaterials 11 02693 g003
Figure 4. Cyclic voltammograms of GONR(200 W) with or without light (LED) illumination using the wavelength of (a) 420 nm and (b) 656 nm. (Electrolyte: 0.3 mM UA + 0.1 M PBS, scan rate: 50 mV/s). The light intensity of LED increases from 5 mW/cm2 to 80 mW/cm2. The glassy carbon electrode was used for preparing the working electrode in Figure 4.
Nanomaterials 11 02693 g004
Figure 5. The summary figures of Faradaic currents in cyclic voltammograms of GONR(200 W) with light (LED) illumination using (a,c) different wavelengths and (b,c) light intensities. (a,b) The sequences of wavelength selections switch from 420 nm to 656 nm. (c,d) The sequences switch from 656 nm to 420 nm.
Nanomaterials 11 02693 g005
Figure 6. The summary figure of average conversion efficiencies in cyclic voltammograms of GONR(200 W) with light (LED) illumination using different wavelengths and light intensities derived from Figure 5.
Nanomaterials 11 02693 g006
Table 1. Summary of PEC biosensors that use a variety of materials and light sources.
MaterialElectrodeAnalyteLight SourceMethodRef.
TiO2/g-C3N4 w dendrimer, and
alkaline phosphatase
ITOProtein Kinase AN/AI-t[9]
CQDs a-functionalized MnO2 NSs b with GOx-labeled AFB1-bovine serum albuminFTOAflatoxin B1500 W Xe lamp with a 420 nm cutoff filterI-t[10]
rGO c/BiFeO3FTOProstate-specific antigenLED light (10 W)I-t[12]
CdS–In2S3ITOBleomycinXe lamp (λ > 420 nm)I-t[13]
PbS QDs d/Co3O4/Au NPs e
/BiOI NSs c/B-TiO2 NPs e
ITOProcalcitoninN/AI-t[14]
PtNi NWs f/BR-CN gFTOChloramphenicol300 W Xe lamp (λ > 420 nm)I-t[15]
PDANS h-CdS QDs d/Ag
//ERGOi-TiO2
ITOProstate specific antigenLED
(20 mW/cm2)
I-t[16]
CDs j-GO k/Au–CuO–Cu2OGCEProgesteroneXe lamp (λ > 420 nm)I-t[17]
PDDA l/graphene/TiO2Gold on SiO2/SiHexavalent chromium150 W Xe lampI-t, CV[18]
Bi3+/B-TiO2/rGO bITOTobramycin250 W Xe lamp (λ > 400 nm)I-t[19]
Ag NCs m/Ag NPs e/GOGoldDopamine and glutathioneLED (365 nm, 190 mW)I-v, CV[20]
GONR nGCEUric acidLED
(6 intensities as well as 6 wavelengths)
CV, DPVThis work
a CQDs: carbon quantum dots. b rGO: reduced graphene oxide. c NSs: nanosheets. d QDs: quantum dots. e NPs: nanoparticles. f NWs: nanowires. g BR-CN: benzene-ring doped g-C3N4. h PDANS: quinone-rich polydopamine nanospheres. i ERGO: electrochemically reduced graphene oxide. j CDs: carbon dots. k GO: graphene oxide. l PDDA: poly(diallyldiamine chloride). m NCs: nanoclusters. n GONR: graphene oxide nanoribbon.
Publisher’s Note: MDPI stays neutral with regard to jurisdictional claims in published maps and institutional affiliations.