1. Introduction
It is generally accepted that the remarkable mechanical performance of spider silk dragline originates from a hierarchical organization of proteins into a hydrogen bonded structure of ordered crystalline β-sheets, embedded in a disordered amorphous matrix [
1,
2,
3,
4,
5,
6]. However, at the mesoscale, it has also been shown that silk assembles into nanofibrils with diameters ranging from ~30 nm [
3] to more than 100 nm [
2,
5] and that a fibre has structurally and functionally distinct regions; a load bearing core (consisting of inner (1800–2300 nm), and outer (300–400 nm) sections [
2,
7,
8]) surrounded by protective lipid (10–20 nm), glycol (40–100 nm), and skin (50–100 nm) layers [
2].
From a biomimetic perspective, the mechanical properties of spider silk are often held as a gold standard for industrial fibre production (see the recent review paper [
9]). The review studies presented in [
10,
11] report values of spider dragline silk tensile strength and toughness that range in the intervals 1.1–1.8 GPa and 100–400 MJ/m
3, respectively (
Table 1). In dry conditions, spider silk dragline is instead generally assumed to conserve its volume under stretching, which implies the presence of a Poisson’s effect associated with the lateral contraction of the fibre [
12,
13]. An investigation into the elastic response of different types of spider silk has shown that the Poisson’s ratio of the cross-section area during stretching can vary from 0 up to 1.52 [
14]. This suggests that the Poisson’s ratios of silk fibres may range well outside the interval [−1.0, 0.5], making them hyperelastic isotropic materials [
15]. This is most likely a consequence of the composite nature of the fibre, which induces a strongly anisotropic response of the material during deformation [
16]. Of particular interest though is the link between the Poisson’s ratio of the whole silk fibre and that of the individual fibrils, since it has been reported in literature that the latter maybe significantly greater than the former [
5]. Uncovering this relationship is important, as unusual, positive, or negative Poisson’s ratios are actively being used to design mechanical metamaterials exhibiting unconventional mechanical behaviours (refer, e.g., to [
17] and references therein).
Whilst there have been several concerted modelling efforts to relate silk’s structures to its mechanical properties [
3,
4,
5,
6,
7,
8,
18,
19], accounting for the precise contributions of each of these structural elements on a fibre’s mechanical response has been inconclusive. Consider, e.g., the role played by the interfaces between the fibrils, which some studies define as mechanically weak and responsible for easy slippage of adjacent fibrils [
6], while other studies observe the presence of heterogeneous protrusions along such surfaces determining a non-slip kinematics and energy dissipation due to interlocking effects [
20]. In addition, while the literature to-date is populated by a number of multiscale and hierarchical approaches to the mechanics of the dragline silk [
1,
2,
3,
4,
5,
6,
18], and there is experimental evidence of the partitioning of the spider silk fibres into layers with different mechanical behaviours [
7,
8], one observes that the grading of the mechanical properties along the radial coordinate of silk fibres has not been extensively investigated.
Experimentally, a granular-type, hierarchical model of spider dragline has been proposed in [
5], on the basis of microstructural atomic force microscopy (AFM) and scanning electron microscopy (SEM) characterization [
7]. Such a model effectively explains the formation of spider silk fibrils in the form of chains of crystalline granules, whose geometry appreciably changes during the synthesis of the material as it moves through the gland, silk duct, and finally as the fibre. However, the model presented in [
5] does not attempt to characterize the experimentally observed anisotropic response of the material [
14].
Insights into these critical challenges may be provided through the window of tensegrity modelling. Most of the available mechanical models of silk adopt either particle-type models and coarse-graining approaches, or finite element models (see, e.g., the review paper [
18]). The tensegrity paradigm leads to an alternative type of modelling, which describes a spider fi as a 3D continuum composed of lower-order continua. The latter consist of 1D rods carrying tensile and compressive forces, hereafter respectively named tendons and struts. Skelton and Nagase [
19] have observed that a tensegrity model of a spider silk fibre that accounts for the transverse stiffening effect played by the crystalline granules leads to an increase of the overall tensile stiffness, as compared to a tendon-only model.
The present work introduces, for the first time, graded tensegrity modelling of the spider dragline fibre informed by the results of plasma etching and low-voltage SEM microstructure identification tests [
7]. The proposed model describes the generic silk fibril as a chain of tensegrity units composed of axial and oblique tendons, and transverse struts. The size of the tensegrity granules varies along the radial coordinate, and matches the nanostructures revealed by SEM imaging after exposure of the fibre to plasma etching, which have shown to be related to fibre mechanical properties [
7].
Our proposed tensegrity model not only replicates Poisson’s effect under longitudinal stretching [
12,
13,
14], but also accurately reproduces the experimental stress vs. strain response of the fibre under tensile loading and captures the enhanced toughness of the material through crack-deflection [
6] and crack-stopper [
21] mechanisms. The given model relates such mechanisms to regional-dependent deformation modes of the fibrils, and scale effects for the fibrils’ ductility [
22,
23]. In particular, such a model explains the mismatches occurring between the Poisson’s ratios of the individual fibrils and the overall fibre [
5]. It makes a first step towards the modelling of the three-dimensional anisotropic response of silk fibres [
14] through simple, uniaxial (tension/compression) force mechanisms at the nanoscale [
24].
2. Microstructural Characterization of the Nephila Dragline Silk through Plasma Etching
An earlier study on plasma etching tests (40 kHz, 100 W, and 0.3 mbar pressure) and low voltage (LV) SEM Secondary Electron Hyperspectral Imaging (SEHI) of silk fibres spun by a single mature
Nephila inaurata female has been presented in Ref. [
7] revealing important links between ordered nanostructures and mechanical properties in fibres reeled under different conditions. Here, a reduction of the power to 66 W permitted gradual plasma etching and imaging to be performed on the same fibre, revealing nanostructural changes within the fibre cross-section.
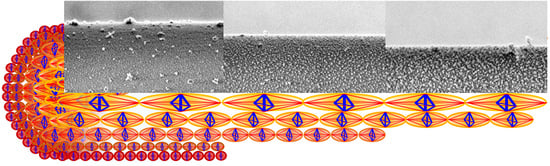
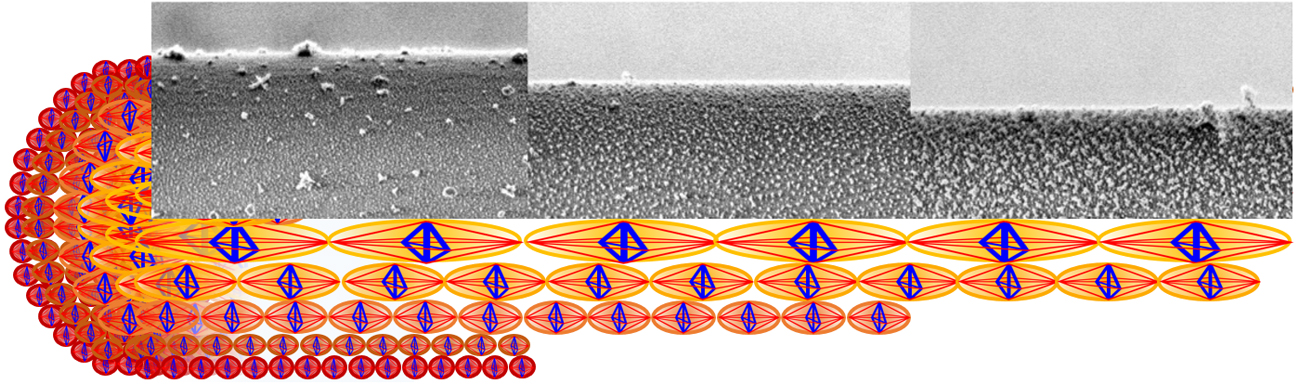
Figure 1A–C illustrates LV-SEM micrographs (see experimental details in
Supporting Information (SI), p.1) of the lateral surface of the plasma etched fibre at different etching times and the current diameter of the fibre, while
Figure 1B–F shows the particle analysis of the nanostructures observed in the etched fibre. One recognizes the white regions in the
Figure 1A–C, corresponding to granules consisting of ordered microcrystalline domains assumed to contain both, β-sheet structures and glycine residues [
25] forming a microcrystalline area also described as a nonperiodic lattice (npl) crystallite structure [
26] or a collection of small staggered sections of β-sheet [
27]. These crystallite domain structures are seen to align in chains to form nanofibrils; see
SI, Figure S1. For quantitative image analysis, the images are converted into binary images in which the black regions represent the granules of microcrystalline domains (
Figure 1D–F).
According to the studies on the multilayer organization of the spider dragline of
Nephila clavipes [
2,
7], the image shown in
Figure 1A belongs to the core region of the fibre, with the layer visible after 1.5 min treatment (layer #1) most probably representing the structure present in the outer core. The layers etched for 6 min (
Figure 1B) and 10 min (
Figure 1C) exemplify the inner core (layers #2 and #3, respectively, the selection of representative etching times and images is described in the
page 2 of supplementary information).
Figure 1G shows an analysis of the size and distribution of the crystalline granules observed in the microstructures of
Figure 1, which has been performed through the image processing software Fiji:ImageJ (v. 1.52t, National Institutes of Health, 9000 Rockville Pike, Bethesda, Maryland 20892, USA). This data reveals that the maximum correlation repeat distance between the microcrystalline granules
a and their average diameter
b monotonically increase with the treatment time. The percentage area of such granules instead also markedly increases when passing from layer #1 to layer #3, and slightly decreases when passing from layer #1 to layer #2.
3. Tensegrity Modelling
We now formulate a mechanical model of a spider dragline silk fibre. This combines a hierarchical organization of the material with tensegrity architectures [
3] (
Figure 1). The applicability of tensegrity concepts to the mechanical modelling of the spider dragline silk has been recognised previously [
19,
24]. This applicability is based on the observation that as silk is formed under tension by a wet spinning process and in the web the fibre dries in a stressed state, it can be assumed that the molecules are effectively locked into an oriented state by their intermolecular hydrogen bonds [
28]. In the present study, we model the composite structure forming the core of the fibre as a collection of fibrils running parallel to the fibre axis [
2,
19], which are described as chains of tensegrity units. Given that the outer lipid, glycol, and skin layers contribute minimally to the overall mechanical response of the spider silk fibre, they are ignored here [
2,
7,
8].
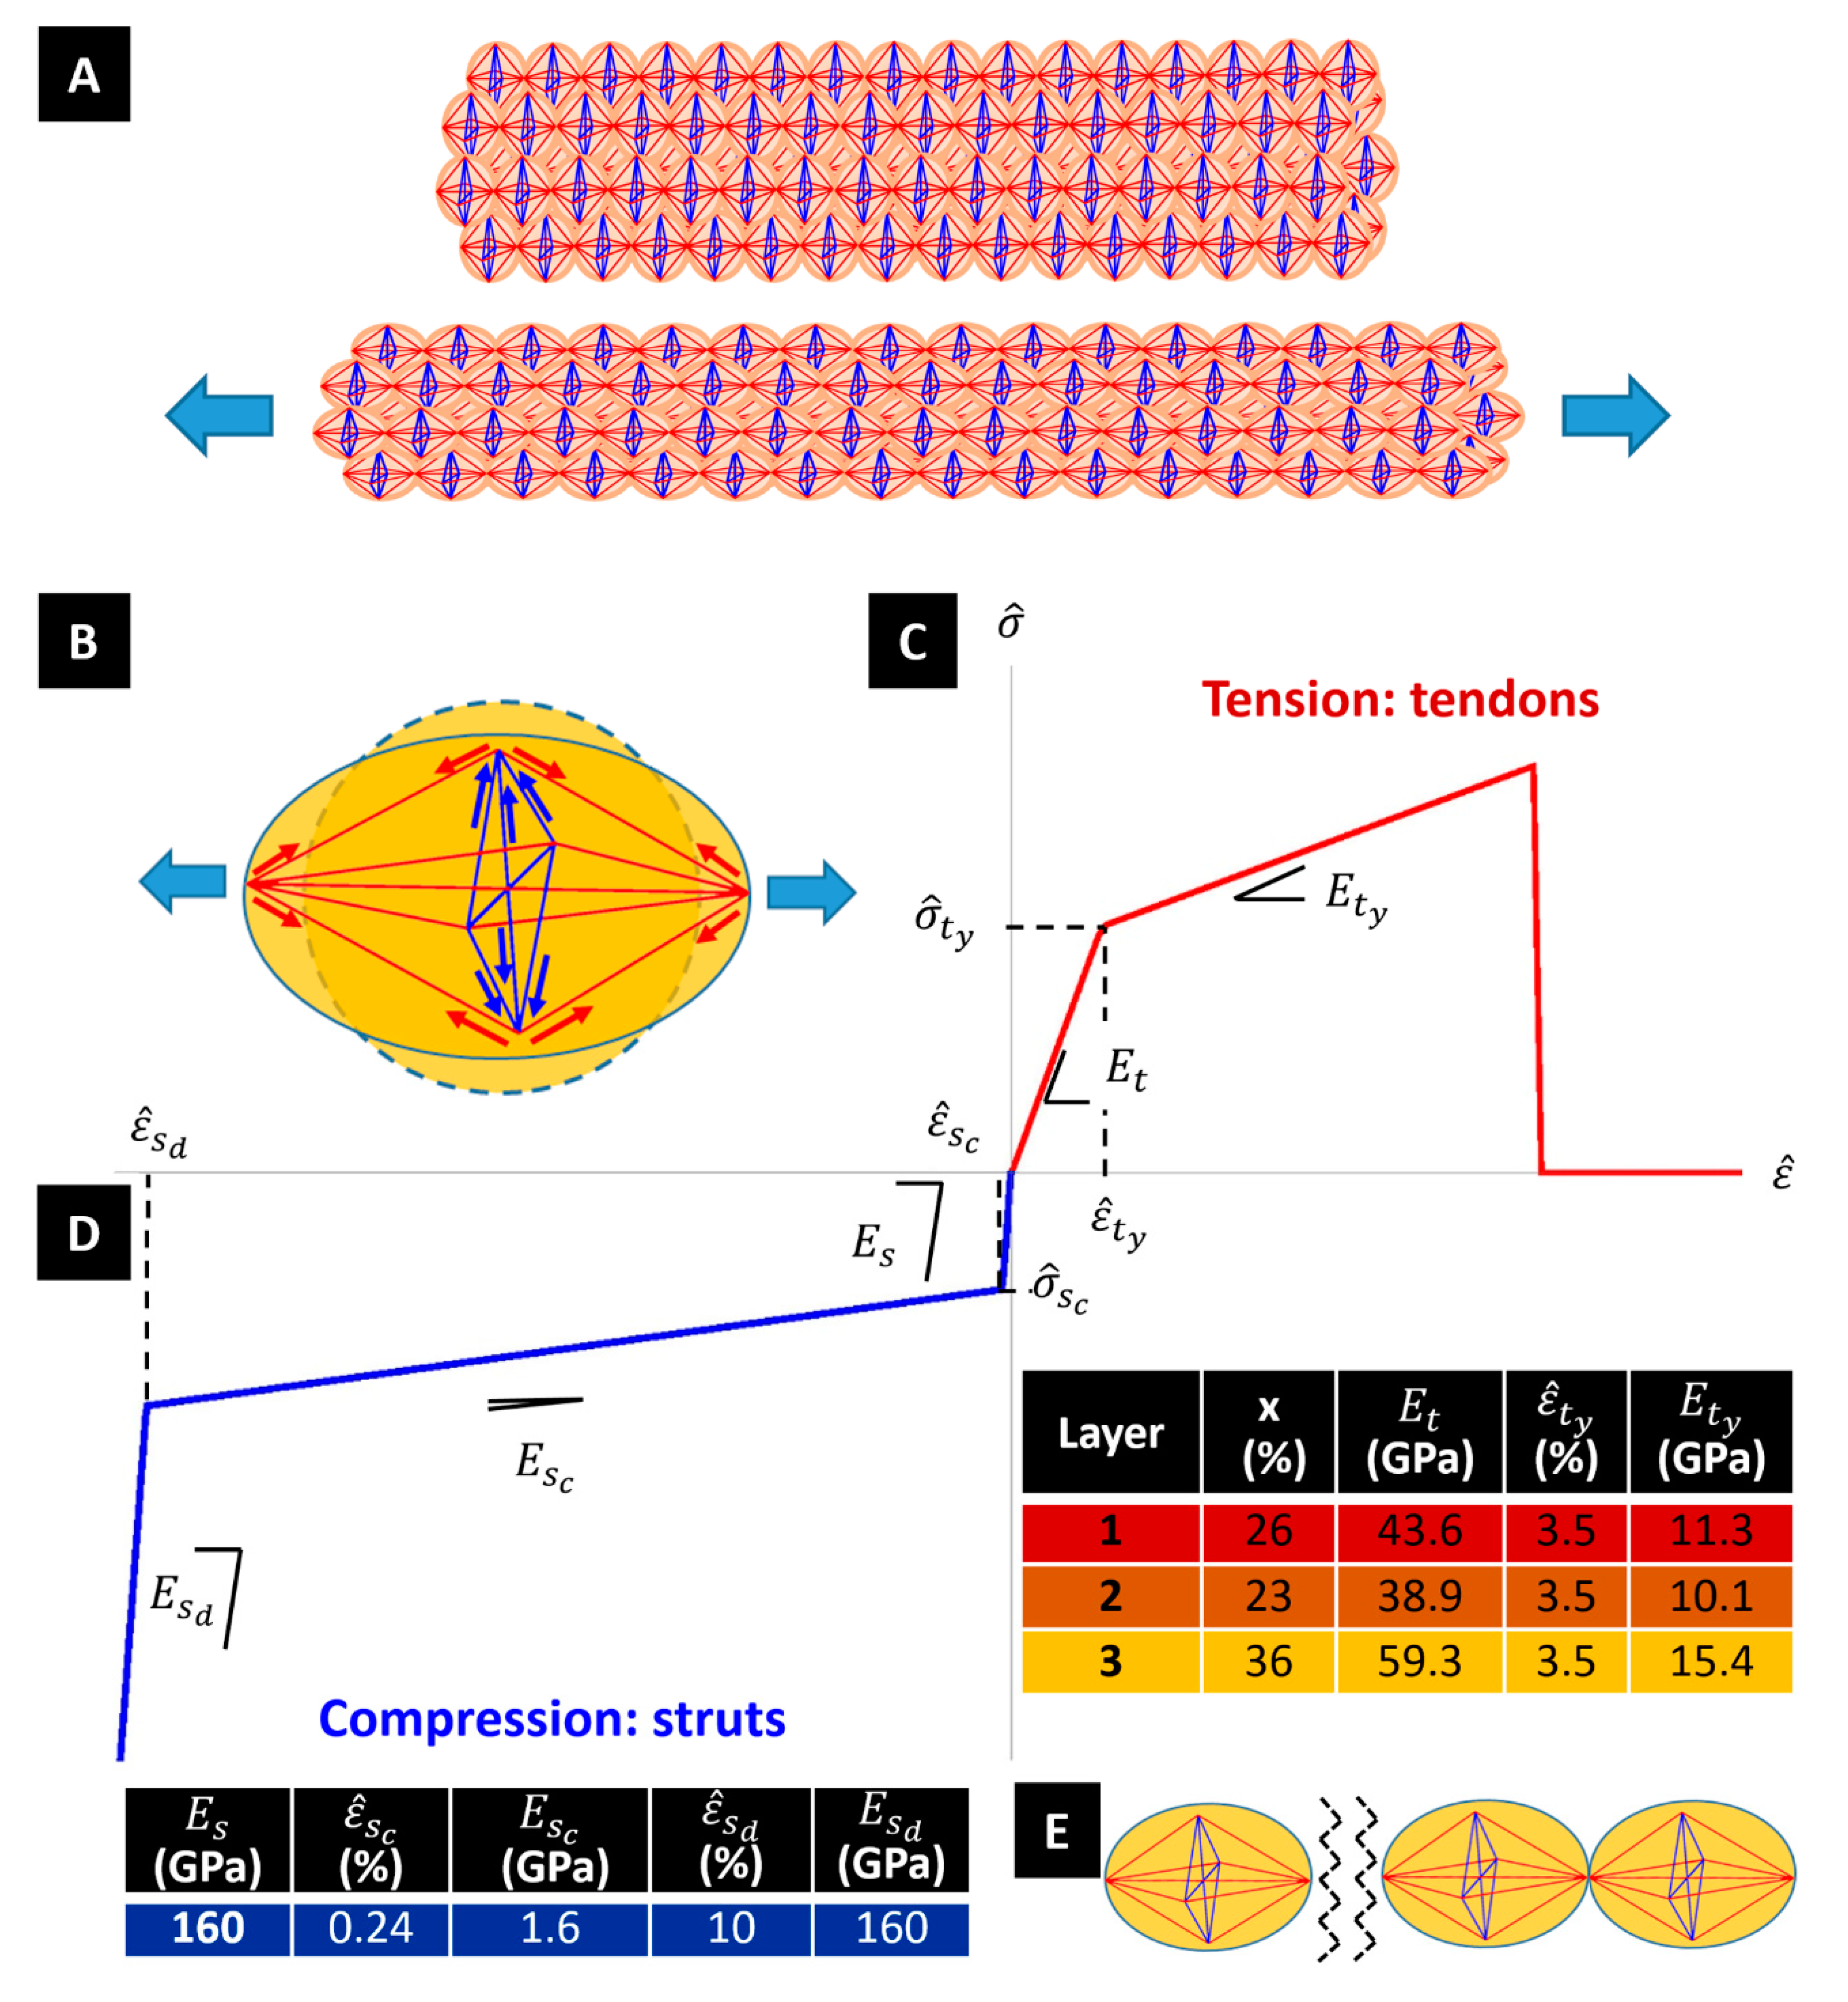
The generic tensegrity unit is formed by longitudinal and diagonal tensile elements hereafter referred to as
tendons (or strings), marked in red in
Figure 1H, and by transverse compressive struts (or bars) marked in blue. The tendons correspond to composite rods formed by amorphous chains that are attached to crystalline domains at their extremities. The struts reproduce the compressive stiffening effect that is played by β-sheet plated crystals in the circumferential direction [
19]. The geometry of the units changes when moving along the radial coordinate of the fibre, in agreement with the nanostructures revealed by the SEM images illustrated in the previous section.
Figure 1D–F (insets) illustrates that the tensegrity units forming layers #1, #2, and #3 are inscribed in spheres with diameters equal to 65, 98 and 150 nm based on
a values in
Figure 1G. It is worth observing that the β-sheet domains contribute significantly to both the transverse compressive stiffness and the longitudinal tensile stiffness in the fibre. Since the diameter of the longitudinal tendons range between 40–100 nm (see
Figure 1) and the minimum transverse dimension of the β-crystallites is in the order of a few nm [
3], the result is that at the extremities of the tendons there are clusters of ordered regions of β-sheets. Such clusters form hinged joints linking the tendons each other.
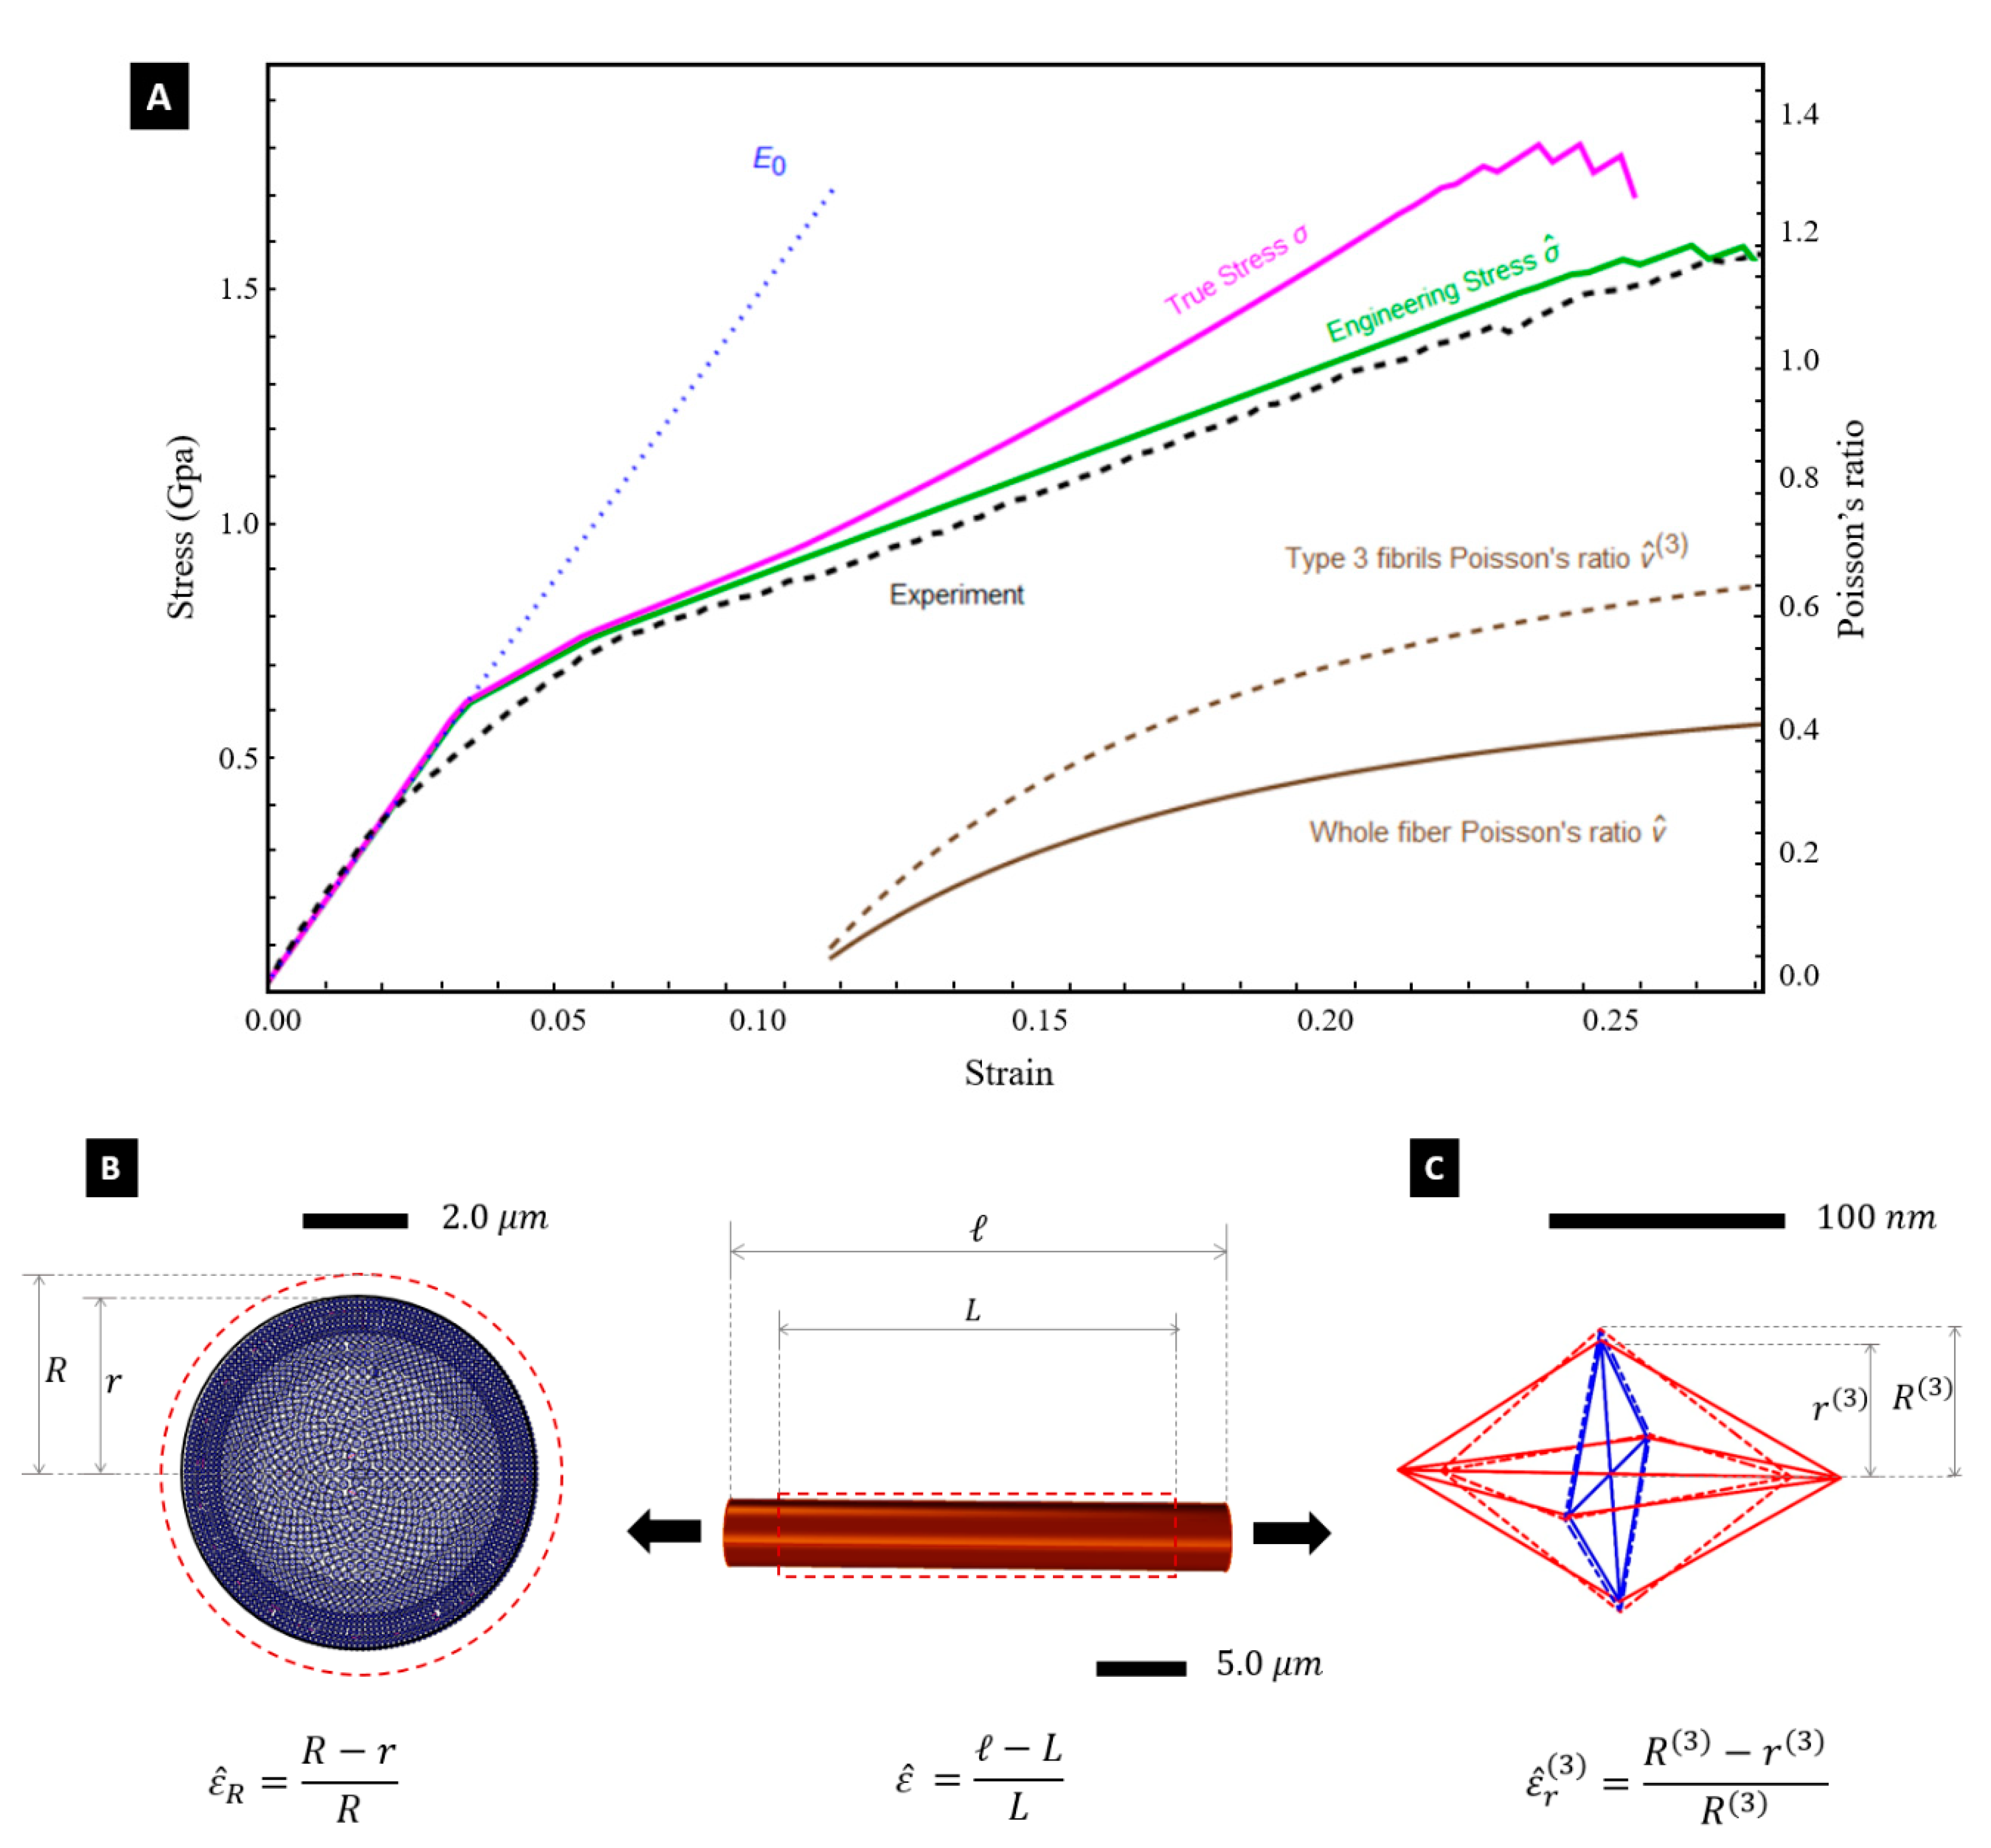
Let us now describe the response of the fibre to a longitudinal stretching deformation through the engineering strain
(positive in extension). Here,
denotes the unstretched length of the fibril, and
denotes the stretched length of the fibre. Under such a loading condition, the tendons forming the tensegrity units of the fibrils are loaded in tension, while the struts are loaded in compression (
Figure 2). The transverse contraction of the struts produces a radial (engineering) strain
, (positive in contraction) where
and
, respectively, denote the undeformed and the contracted (deformed) diameters of the fibre, respectively (Poisson’s effect) [
12,
13,
14].
A peculiar phenomenon that affects the tensile response of dragline silk fibres is the yielding effect produced by the breaking of the (weak) hydrogen bonds forming the matrix of the fibre under stretching, which appreciably reduces the axial stiffness of the fibre [
29,
30]. To explain these phenomena, the current model makes use of the stress-strain responses of tendons and struts that are illustrated in
Figure 2. Let us denote the elastic modulus of β-sheet crystal domains by
, and the pre-yielding elastic modulus of the noncrystalline domains by
.
The stress-strain response of the struts is characterised by an elastic phase with Young modulus
, since these members are supposed to be fully crystalline. The initial elastic response extends up to a buckling event occurring when the local engineering strain reaches the critical value
. The buckling phase is assumed to be elastic, and is associated with a marked decrease in the axial stiffness of the member, as compared to the initial elastic phase (refer, e.g., to [
31]). The post-buckling phase features an initial “soft” branch, with tangent elastic modulus
, and next a “hard” branch with tangent elastic modulus
. The latter describes the combined effects of the densification of the material under moderately large axial strains, and the progressive stiffening of the members in the post-buckling regime [
31]. We assume that such a phase initiates when the strut’s strain reaches a given threshold value
(
Figure 2D). For what concerns the tendons, we characterise the initial (pre-yielding) response of such members, which are formed by a blend of crystalline and noncrystalline domains, through the following composite Young modulus,
:
Here,
is the volume fraction of β-sheet crystals. The yielding of the tendons is assumed to occur when the local engineering strain reaches a threshold value
The incremental response the post-yielding regime, up to tensile failure, is described by a reduced tangent elastic modulus
<
[
32] (
Figure 2C).
On assuming
[
30,
33], and
[
34], hereafter we make use of the material properties listed in
Figure 2D. The assumed value of
, which whilst significantly higher than the experimental Young’s moduli of β-sheet nanocrystals reported in the literature [
33,
35], is imported from the theoretical study presented in [
30]. It refers to the rigid response of the β-crystalline domains in the pre-yield and pre-buckling regimes in tension and compression, respectively. It is worth observing that the fraction of crystalline domains reported in
Figure 1 matches the percentages the crystalline granules observed in the microstructures of
Figure 2.
The tendons and the struts are assumed to have a cylindrical shape. The diameters of such members change with the microstructure parameters
and
, as shown in
Figure 1H. In particular, the diameter
of the struts is let to coincide with the average diameter
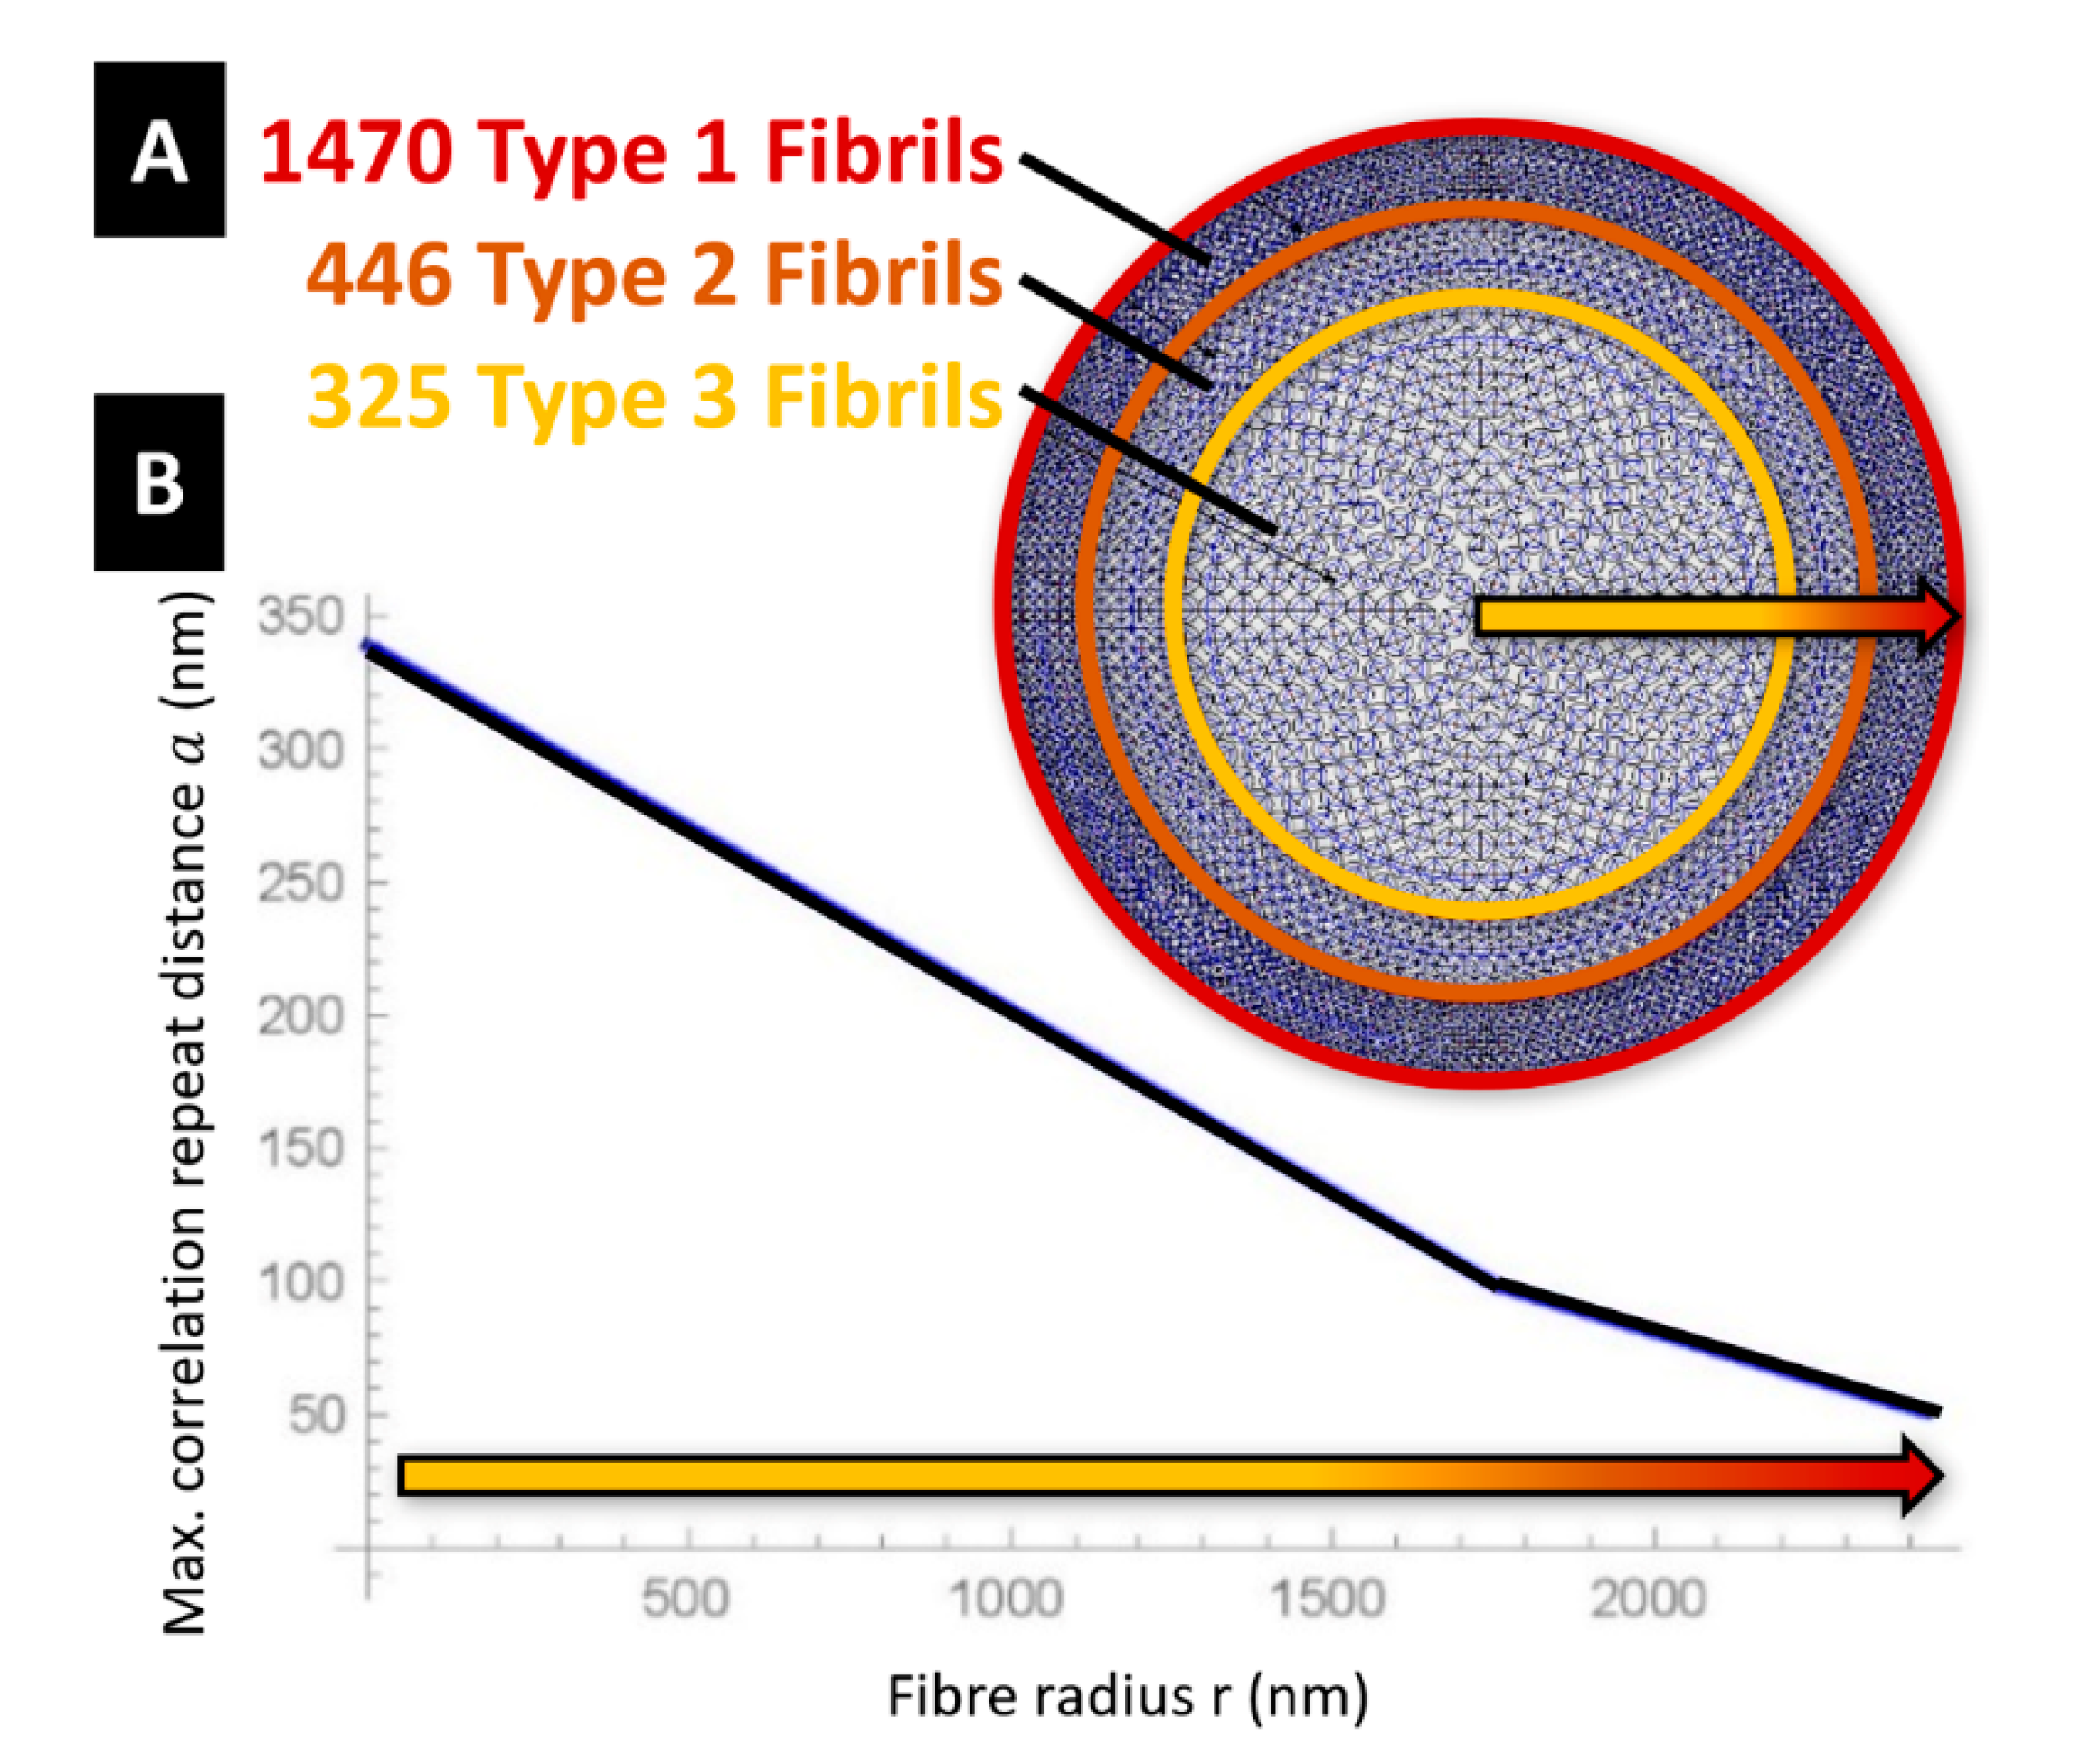
. of the microcrystalline granules. Let us now denote fibrils of Type 1, 2, and 3 the fibrils that exhibit
and
respectively. The fibril distribution depicted in
Figure 3 assumes that the cross-section of dragline silk fibre is composed of a packing of 1470 fibrils of Type 1 in the annulus bounded by the circle with radius 2422 nm and the circle with radius 1967 nm (layer 1: outer core of the fibre); a packing of 446 fibrils of Type 2 in the annulus bounded by the circles with radii 1967 nm and 1570 nm (layer 2: intermediate core); and a packing of 325 fibrils of Type 3 in the remaining inner core of the fibre (
Figure 3A). All such packings are polar-symmetric.
The microstructure parameter
defines the longitudinal spacing of the tensegrity units in the generic fibril, as shown in
Figure 1G. We model the variation of this parameter with the radial coordinate by interpolating the values taken in correspondence with the layers #1,2,3, where we assume
. The interpolating function plotted in
Figure 3B shows
on the vertical axis and the radial coordinate
with origin at the centre of the fibre on the horizontal axis. One observes that it results in
at the centre of the fibre (
, and
at the boundary of the fibre’s core
). The assumption of a piecewise constant distribution of
with the radial coordinate allows us to simplify the packing of the fibrils across the fibre; while the assumed piecewise linear variation of
with
leads us to capture the crack deflection effect between adjacent grains [
6]. We also neglect the load carrying capacity of the matrix in between the fibrils material [
6,
36].
It is known that the ductility of a material, as well as other key mechanical parameters, increases when the scale of the microstructure gets finer [
22,
23]. The SEM characterization presented in
Figure 1 shows that the microstructure parameters
and
appreciably increase moving towards the centre of the fibre. This implies the presence of larger crystalline domains at the inner core than at the outer core of the fibre (see also
Figure 1 and
Figure 3B) [
7,
37,
38]. We hereafter introduce a scale effect on the amplitude of the failure strain (or strain at break) of the fibrils
. The ductility of the material is measured by the ratio between
and the yield strain of the fibril
. The strain parameters
and
refer to the tensile response of the overall fibril, and mark the first bending point of the stress-stain response, and the break strain of the fibril, respectively. Due to the geometry of the tensegrity unit shown in
Figure 1H, it is clear that
coincides with the yield strain
of the tendons aligned with the fibrils axis, while
coincides with the strain that determines the rupture of the fibril at the interface between adjacent units (
Figure 2E). Characteristic values of
are found in the interval 0.20–0.30 for dry spider silk fibres tested in air in the literature [
10,
11,
39]. These estimates account for marked interspecific and intraspecific variabilities [
40], which are also related to mechanical alignment parameters [
29], the reeling speed [
7] and testing procedures [
13]. With reference to the
Nephila inaurata silk fibres analysed in the present work, we assume that
varies linearly with the radial coordinate
in the interval
Here, it results in
, and the microstructure parameter
varies in between
(
and
(
). Specifically, we assume
at
, and
at
. We keep
constantly equal to 0.265 for
.
4. Predicting Tensile Stress-Strain Response
Let us employ the tensegrity model illustrated in the previous section to predict the response of the Nephila silk fibres under stretching to large deformations. We make use of the path-following algorithm in strain control presented in [
41], which numerically approaches quasi-static deformations of tensegrity structures in the large deformation regime. Our predictions of the engineering and true stress-strain curves of the fibre are illustrated in
Figure 4A. The engineering stress
is obtained by dividing the summation of the pulling forces acting on the individual fibrils by the initial cross section area of the fibre
. The true stress
is instead obtained by dividing the total pulling force by the deformed cross section area
. Finally, the true strain
is linked to
through the equation:
[
32].
Figure 4A shows that the engineering stress-strain curve
predicted by the tensegrity model is in good agreement with the experimental curve obtained through the experimental setup illustrated in [
7]. Such a setup consists of a testing machine equipped with a 5 N loading cell, which stretches a fibre sample with 5 mm gauge length at the controlled strain rate of
. The predicted yield strain of the fibre coincides with that of the axial tendons, i.e., it results
. The experimentally observed value of the fibre breaking strain is
, and this justifies the assumptions made about the distribution of
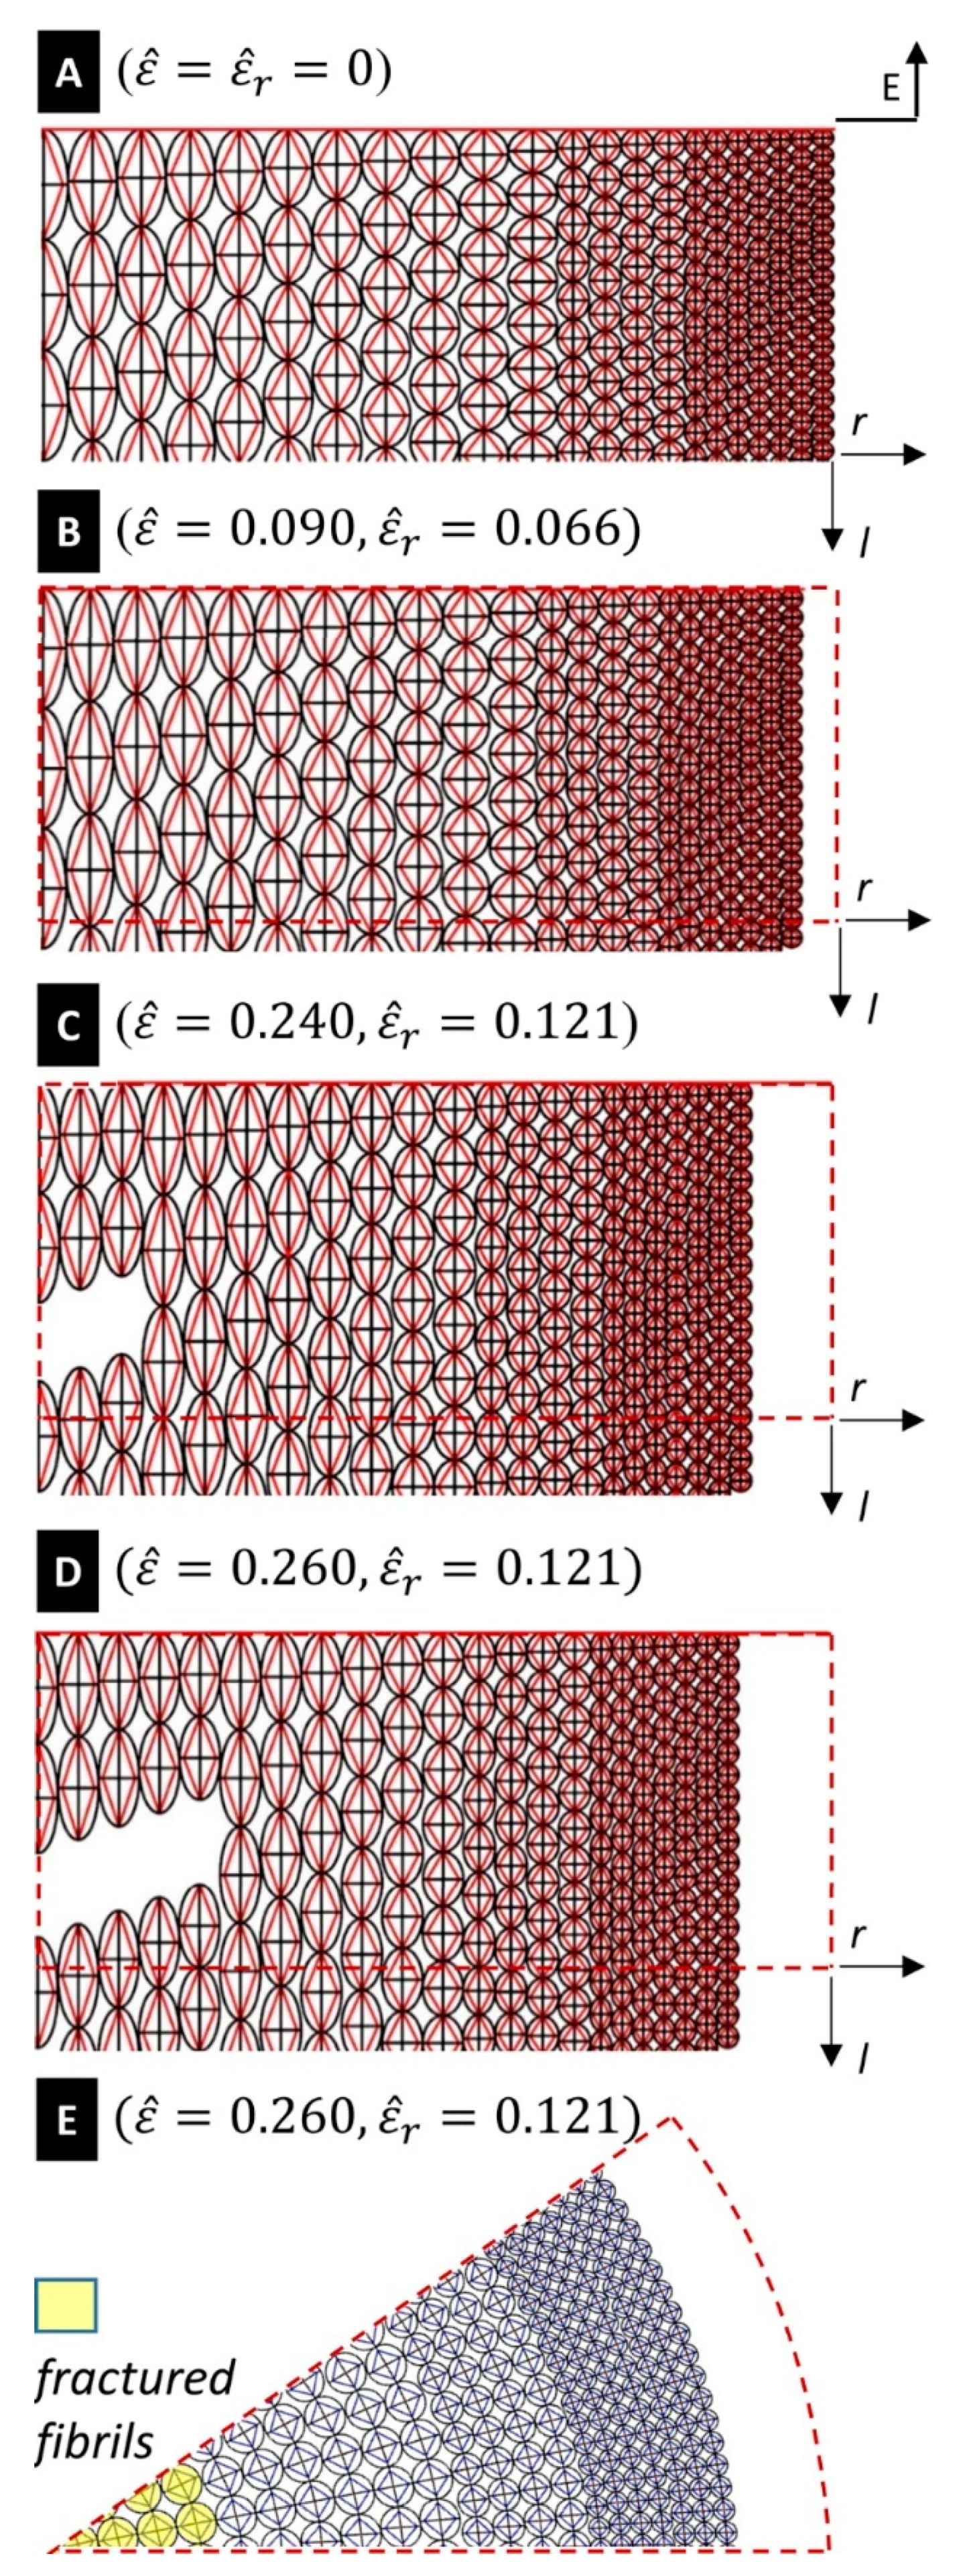
across the core of the fibre at the end of the previous section. Selected snapshots of the deformation of the silk fibre predicted by the tensegrity model are given in
Figure 5, for different values of the engineering strain
. A finer matching between the experimental and predicted yield points of the stress-strain curves in
Figure 4A can be obtained by suitably grading the value of the yield strain of the tendons across the radial coordinate. We do not account for such a refinement in the present work in order to keep the tensegrity model as simple as possible.
Figure 4A also shows the predicted variation of the Poisson’s ratio
with the engineering strain
. Here, we assume
, which corresponds to the initial (undeformed) diameter of the core of the fibre (see
Section 4). The deformed diameter
was computed by summing up the deformed diameters
of the individual fibrils (
Figure 3A). An
vs.
plot is experimentally hard to obtain, resulting in experimental fluctuations [
12,
42], but
Figure 4A highlights that the tensegrity model is actually able to predict a deformation-dependent behaviour of the Poisson’s ratio. Such a behaviour was to be expected since we are accounting for large strains [
43]. One observes that
increases under growing axial strains, by approaching the value
= 0.426 at
. In parallel, we observe small and oscillating (positive/negative) values of the volumetric strain
(
denoting the initial volume, and
denoting the strained volume), i.e.,:
+0.005 for
and
0.006 for
. The current model predicts nonuniform radial strains, the different fibrils that form the fibre. The largest radial strains are observed in the Type-3 fibrils occupying the inner core of the fibre (
Figure 3A), which grow up to
0.172 for
. Type-1 and Type-2 fibrils instead experience very small radial strains remaining always lower than 0.5%, up to fibre rupture. The current model indeed confines the radial deformation mechanism to the inner core formed by the type 3 fibrils, whose radius is equal to 65% of the overall fibre radius (see
Figure 3). The larger dimensions of the members composing the type 3 fibrils, as compared to those characterizing the struts and tendons of type 1 and type 2 fibrils (
Figure 1G,H), determines indeed the achievement of more relevant axial forces in such members. This results in a Poisson’s ratio
of the Type-3 fibrils that is actually larger than the global (or average) Poissons’s ratio
(
Figure 4B,C), since this quantity reaches the value
for
. (
= 0.426).
The deformation mode predicted by the current model qualitatively matches the experimental results presented in [
5] for
Nephila clavata fibres, which report microfibrils Poisson’s ratios greater than 0.5, against an average Poisson’s ratio lower than 0.5. It is an easy task to prove that the following geometric relation relates the strain measures
:
. By solving the equation
for
, one gets
0.111 for
). The tensegrity model approximatively reproduces such a result, by returning
for
, that is,
. Guinea et al. [
12] report a mean value of 0.993 and a standard deviation
for the volume ratio
of
Argiope trifasciata fibres obtained through forced silking at different spinning speeds, under longitudinal strains
. The corresponding mean volumetric strain
is equal to −0.007. The experiments conducted by such authors highlight alternance of positive and negative values of the volume ratio
in proximity of the condition with zero volumetric strain. We are led to conclude that the present model accurately predicts the fibre volume conservation in the large strain regime, being also able to reproduce the small fluctuations of the volumetric strain experimentally observed in [
12].
5. Predicting Fracture and Toughness
We have already observed that several available predictions of fibre fracture/failure in dragline silk account for the hierarchical organization of the material into microfibrils [
1,
2,
3,
4,
5,
6,
18]. However, the link between such a phenomenon and the variation of the size and density of the crystalline domains has only been investigated qualitatively to-date [
7]. Examining the fracture response of our tensegrity model, we observe that it predicts a progressive breakage of the microfibrils, starting within the inner core of the fibre. The first fibril breaks under an engineering strain
(see the values of
given at the end of
Section 3). The results in
Figure 5E highlight that the portion of the core of the fibre bounded by the circle with radius
is composed of all broken (fractured) fibrils, for
. The fractured region of the fibre extends to the region bounded by the circle with radius
at
. As we have already noted, the current model predicts complete failure of the fibre at
, which corresponds to the experimentally observed breaking strain.
The progressive fibril ruptures give rise to the fluctuations of the predicted stress-strain curves in
Figure 4, which is a common feature in experimental silk tensile testing [
29,
44]. Studies dealing with
Argiope trifasciata fibres report fracture surfaces that do not show voids and cracks at the skin-core interface [
36,
39]. The fractographic analyses presented in [
36,
39] observe a “globular” (or “mosaic”) structure of the cross-section of the fractured fibre. The morphology of the fracture surface is also influenced by the applied strain rate and the presence of structural defects. Yazawa et al. observe in a recent study [
45] that spider dragline silk fibres of
Nephila clavata tend to break at macroscopic structural defects at low strain rates, and at microfibrils at faster strain rates. They also observe that during stretching, the longitudinal alignment of crystalline regions is prevalent in dry conditions, while the amorphous chains tend to appreciably align with the longitudinal axis under stretching at high relative humidity (RH) conditions. The morphologies of the fracture surfaces given in [
45] highlight fibre’s rupture due breaking of microfibrils under strain rates greater or equal to
at 43% RH.
The current model predicts a mosaic-like configuration of the fractured fibre for
(
Figure 5E). It reproduces a fibril-breaking fracture mode initiating at the core of the fibre and propagates outwards. It is worth observing the tendons forming the tensegrity model formulated in the present work are made of a composite material that mixes amorphous and crystalline domains (cf.
Section 3). Such members tend to align with the longitudinal axis under stretching, as shown in
Figure 4C. The current assumption of graded distributions of the diameters and the failure strains of the fibrils leads us to predict a ductile tensile response of the fibre, and effectively explains its enhanced toughness [
7,
10,
11]. This is due to the progressive deflection of the crack front along the interfaces separating fibrils with different breaking strains [
6,
36]. The toughness predicted by the tensegrity model up to
amounts to 268.79 MJ/m
3, which is just slightly greater than the experimental value of 261.97 MJ/m
3 [
7]. We refer the reader to
Videos S1 and S2 of Supplementary Materials for an illustration of the stretching deformation of the fibrils of Type 3, and the whole fibre, respectively, with the latter synced with the engineering stress-strain curve of
Figure 4A.

 ,
, 


