Article

New Electrospun ZnO:MoO3 Nanostructures: Preparation, Characterization and Photocatalytic Performance

1
“Petru Poni” Institute of Macromolecular Chemistry, 41A Grigore Ghica Voda Alley, 700487 Iasi, Romania
2
National Institute for Research and Development in Microtechnologies-IMT Bucharest, 126A, Erou Iancu 8 Nicolae Street, 077190 Bucharest, Romania
*
Authors to whom correspondence should be addressed.
Nanomaterials 2020, 10(8), 1476; https://doi.org/10.3390/nano10081476
Submission received: 30 June 2020 / Revised: 21 July 2020 / Accepted: 22 July 2020 / Published: 28 July 2020

Abstract

:
New molybdenum trioxide-incorporated ZnO materials were prepared through the electrospinning method and then calcination at 500 °C, for 2 h. The obtained electrospun ZnO:MoO3 hybrid materials were characterized by X-ray diffraction, scanning and transmission electron microscopies, ultraviolet (UV)-diffuse reflectance, UV–visible (UV–vis) absorption, and photoluminescence techniques. It was observed that the presence of MoO3 as loading material in pure ZnO matrix induces a small blue shift in the absorption band maxima (from 382 to 371 nm) and the emission peaks are shifted to shorter wavelengths, as compared to pure ZnO. Also, a slight decrease in the optical band gap energy of ZnO:MoO3 was registered after MoO3 incorporation. The photocatalytic performance of pure ZnO and ZnO:MoO3 was assessed in the degradation of rhodamine B (RhB) dye with an initial concentration of 5 mg/L, under visible light irradiation. A doubling of the degradation efficiency of the ZnO:MoO3 sample (3.26% of the atomic molar ratio of Mo/Zn) as compared to pure ZnO was obtained. The values of the reaction rate constants were found to be 0.0480 h−1 for ZnO, and 0.1072 h−1 for ZnO:MoO3, respectively.

1. Introduction

Currently, many efforts are being made worldwide to develop new high-performance photocatalytic materials for energy and environmental applications. Metal oxide semiconductor materials in various shapes and structures, including ZnO, TiO2, CuO, and MgO, have proven to be a good alternative for the degradation of various organic dyes. It is known that ZnO is an oxide semiconductor having a broad direct band gap (3.37 eV), high excitation binding energy (60 meV), and good electrical, mechanical, and optical and photocatalytic properties, comparable to those of TiO2. Metal doping of ZnO can significantly improve the photocatalytic activity, it is thought by (i) generation of trapping site which will decrease the recombination rate of photoinduced electron-hole pairs; (ii) decrease of band gap energy of photocatalysts; and (iii) structural defects in the crystalline phase of ZnO. Many studies have been based on the development of new photocatalysts based on ZnO doped with different metals (Ag, La, Er, Sm, Cu, Au, Ce, Ni, Fe, etc.) to improve the photocatalytic activity for the degradation of different organic dyes and to extend the degradation domain using visible light [1,2]. For example, Pascariu et al. reported good photocatalytic responses of ZnO-SnO2 nanostructures used for rhodamine B dye degradation with an initial dye concentration of 0.01 mM and a catalyst dosage of 0.5 g/L [3]. Likewise, the same authors obtained an improvement of the photocatalytic activity after doping ZnO with Ni or Co [4]. Molybdenum trioxide (MoO3) is a very interesting transition metal oxide having a wide band gap energy of about 3 eV, distinctive optical properties, and highly visible-light photocatalytic activity [5,6]. But the synthesis of ZnO-MoO3 nanostructures (especially by the electrospinning method) and their detailed properties after being incorporated into the ZnO matrix are less reported compared to other semiconductor oxides, such as SnO2, ZnO, TiO2 and In2O3 [7,8]. Moreover, it is known that the properties of molybdenum trioxide are strongly dependent on the synthesis methods and can be greatly modulated by doping it with other metal oxides [9]. There are many methods to develop new materials of different shapes and sizes, including hydrothermal, sol-gel, precipitation, microemulsion, solvothermal, the electrochemical deposition process, microwave, polyol, wet chemical method, flux methods and electrospinning [10]. The electrospinning method is one of the simplest, cheapest, and most efficient for obtaining nanostructured materials. Also, this method offers the possibility of obtaining materials with controllable diameters of the fibers, very high surface-to-volume ratio, and specific surface and excellent functional properties [1]. Also, the electrospinning technique is intensively used in obtaining ceramic materials. One study based on Mo-doped ZnO materials obtained by the electrospinning method has been reported by Kim et al. [11], and their investigation regarding gas-sensing properties in ethanol, trimethylamine (TMA), CO and H2 medium. To the best of our knowledge, the development of ZnO:MoO3 nanostructures by the electrospinning-calcination method and then their testing for dye degradation have not been reported in the literature so far. Similar systems have been obtained by other methods, such as coating of MoO3 altered ZnO, by surface metal impregnation [12], ZnO@MoO3 core/shell nanocables by the electrodeposited method [13], and 1D/1D ZnO@h-MoO3 synthesized via the solid state impregnation-calcination method [14].
Therefore, in this paper, we proposed the preparation of new pure ZnO and ZnO:MoO3 nanostructures by the electrospinning method and then calcination at 500 °C for 2 h. The polymer solutions were prepared from polyvinyl alcohol (PVA) dissolved in water. The details of the structural and optical properties of the obtained MoO3 incorporated-ZnO nanostructures were comparatively analyzed and discussed. Moreover, the photocatalytic performance of these materials was evaluated by photodegradation of RhB dye in aqueous solution under simulated sunlight irradiation.

2. Materials and Methods

2.1. Materials

Polyvinyl alcohol (PVA) (Mn = 80.000), zinc acetate [Zn(CH3COO)2·2H2O], and ammonium molybdate ((NH4)6Mo7O24·4H2O) were purchased from Sigma-Aldrich (Merck KGaA, Darmstadt, Germany). Deionized water was used as a solvent.

2.2. Preparation of ZnO:MoO3 Nanostructures

We dissolved 0.55 g PVA powder in 5 mL of deionized water and then heated at 100 °C under vigorous magnetic stirring for 8 h and thus the solution for electrospinning was obtained. This solution was cooled to room temperature and then 0.4 g of zinc acetate was added to it. Finally, ammonium molybdate in various concentrations was added to the above electrospun solution. This prepared viscous solution was stirred for another 3 h and then transferred into a needle syringe with a diameter of 0.5 mm. All new nanostructures were obtained using a home-made electrospinning device [15,16]. The optimal conditions for the production of these fibers before calcination were as follows: high voltage source (25 kV), the distance between the needle tip and the collector (stainless steel foil) was 15 cm at a flow-rate of about 0.75 mL/h. The ZnO:MoO3 nanostructures were obtained after calcination in an oven (in air) at 500 °C for 2 h. In this study, a series of four materials (with different concentrations of MoO3) were prepared and are presented. More details regarding growth and sample names correlation with the specific growth conditions can be found in Table 1.

2.3. Structural Characterization

X-ray diffraction (XRD) patterns of ZnO:MoO3 nanostructures were recorded using a Rigaku SmartLab-9kW X-ray diffractometer (Rigaku Corporation, Japan). SEM (scanning electron microscopy)/energy-dispersive X-ray spectroscopy (EDX) measurements were performed using a JEOL JSM 6362LV (Japan) electron microscope coupled with an EDAX INCA X-act Oxford Instrument detector (Oxford, UK). Transmission electron microscopy (TEM) studies were performed using a Hitachi HT7700 Dual Mode STEM (Japan) in TEM mode. To perform the TEM studies, a small quantity of material was fixed onto Cu mesh grids after dispersion in ethanol and sonication.

2.4. Steady-State Spectral Measurements

The optical measurements of the samples were evaluated by ultraviolet–visible (UV–vis) reflectance spectra recorded with a SPECORD 210Plus Analytik Jena (Jena, Germany) spectrophotometer equipped with an integrating sphere. The band gap energy values were found from the optical data solution. Steady state absorption and fluorescence spectra were recorded with a spectrophotometer SPECORD 210Plus Analytik Jena (Jena, Germany) and on an Edinburgh FLS980 spectrometer (Edinburgh, UK), respectively.

2.5. Time-Resolved Fluorescence

The time-resolved fluorescence spectra were collected on an Edinburgh FLS980 spectrometer using a time correlated single photon counting method. The emission decay profiles for all nanostructures dispersed in 1-propanol solution were determined in a 10 × 10 mm quartz cell, excited by a nanosecond diode laser (EPL-375) (Edinburgh Instruments Ltd., Livingston, UK) operating at 375 nm as light source. The fluorescence decays were evaluated using the nF9000 software attached to the equipment (Edinburgh Instruments Ltd., Livingston, UK) and the best fitted parameters were obtained for the reduced chi-squared values close to 1, and the weighted residuals were uniformly distributed around the zero line.

2.6. Nanosecond Transient Absorption Spectroscopy

Nanosecond transient absorption experiments were performed using a nanosecond laser flash photolysis technique (LP980, Edinburgh Instruments, (Livingston, UK)). The spectrometer was connected to a laser source (Ekspla NT342), which allows us to generate a high concentration of excited state species, laser pulses at 372 nm, and a frequency of 1 Hz. The absorption lifetime values of excited state species were evaluated with the L900 software attached to the equipment ((Edinburgh Instruments Ltd., Livingston, UK).

2.7. Photocatalysis Tests

The photocatalytic activity of the MoO3-incorporated ZnO nanostructures was tested by photodegradation of rhodamine B (RhB) dye in aqueous solution under visible light irradiation using the same experimental degradation procedure as reported in previous work [3]. Briefly, 5 mg of the catalyst was dispersed in a vial containing 10 mL of RhB dye solution (5 mg/L), having a controlled temperature at 25 °C. A 100 W tungsten lamp was served as the light source. The power of light source was 102.74 kJ·m−2·h−1, and measured by a PMA 2100 apparatus, prod by Solar Light Co. (Glenside, PA, USA). The wavelength range of the tungsten bulb varies between 350 and 850 nm. The initial concentrations of RhB dye and after irradiation at different times were determined using a UV–vis spectrometer SPECORD 210Plus, Analytik Jena (Jena, Germany).

3. Results and Discussion

3.1. Morphological Characterization

Some examples of SEM micrographs of ZnO:MoO3 materials obtained after calcination at 500 °C for 2 h are shown in Figure 1. Figure 1a,b depict the morphology of pure ZnO and MoO3 metal oxides. The as-grown ZnO exhibits a cylindrical microrods structure with a rough surface. The SEM image (Figure 1b) corresponding to the MoO3 sample reveals a morphology composed of microparticles, with a platelet structure and diameters between 4–5 µm. This different structure of the two types of materials (ZnO and MoO3) leads to a morphology composed of different types of crystals interconnected between them in the ZnO:MoO3 nanostructures. TEM studies were performed to confirm the intimate structure of the ZnO:MoO3 materials. TEM observation proved the formation of two kinds of well-shaped nanosized crystallites: one with dimensions of about 20–30 nm and the second, with larger size of ~40–45 nm. An example of TEM micrographs of nanocrystalline building blocks on sample S5 is presented in Figure 2.
EDX analysis was used to report the elemental composition of all samples. The EDX spectra (Figure 3) confirm the presence of Zn and O in a ratio of about 1:1, corresponding to the ZnO sample and the presence of Mo and O in a ratio of 1:3 corresponding to the MoO3 sample. The atomic percentages of Mo in composite nanostructures were: 0.92% (S3), 1.51% (S4), 2.30% (S5), and 4.82% (S6), respectively (Table 1). Also, the EDX measurements have predicted the expected values for Mo according to the prepared samples.

3.2. X-ray Diffraction (XRD) Analysis

The crystalline structure of pure ZnO, MoO3 and ZnO:MoO3 composites were confirmed using XRD measurements, and the XRD patterns are illustrated in Figure 4. The diffraction peaks of ZnO are indexed as hexagonal wurtzite-type structure (JCPDS No. 00-230-0112, space group: P63mc, No. 186) having as main peaks of diffractions at 2θ = 31.84°, 34.51°, 36.32°, 47.62°, 56.66°, 62.92°, 66.43°, 67.98° and 69.13°, attributed to diffraction planes (110), (002), (101), (102), (110), (103), (200), (112), (201), respectively. The diffraction pattern of α-MoO3 confirms the orthorhombic crystalline structure Joint Committee on Powder Diffraction Standards (JCPDS No. 00-900-9670, space group: Pbnm, No. 62) with the main diffraction peaks at 23.36°, 25.65°, 27.23°, 29.59°, indexed by (110), (040), (021) and (130). The XRD data corresponding to the ZnO:MoO3 composites show a mixed crystalline structure formed from ZnO with hexagonal wurtzite structure and MoO3 with orthorhombic structure. The average crystallite size was calculated according to the Scherrer relation D = 0.8λ/βcosθ, were λ is the X-ray wavelength corresponding to CuKα radiation, β is the full width at half maximum of the peak and θ is the Bragg angle. The average crystallite size was found to be D = 21.77 nm for pure ZnO and D = 14.93 nm is corresponding to ZnO:MoO3 nanostructures, respectively. The presence of reflections corresponding to ZnO and MoO3 in ZnO-MoO3 nanostructures shows the successful formation of the nanocomposite. This decrease in the crystallite size of ZnO:MoO3 (S5) may be attributed to the formation of Mo–O–Zn bands on the surface of the doped materials, which inhibits the growth of the crystallite, as reported by many authors for similar systems [17,18]. The decrease in the crystallite size of ZnO:MoO3 nanostructures can be determined by the lattice distortion by Mo incorporation due to the difference between the ionic radius of Mo6+ (0.065 nm) smaller them that of Zn2+ (0.074 nm). The lattice constants a and b were 3.252 Å, 5.209 Å for ZnO and 3.249 Å, 5.207 Å obtained for ZnO:MoO3 (S5), values that are in good agreement with the standard ones (a = 3.253 Å, c = 5.213 Å for ZnO → JCPDS 34-1451) [19].

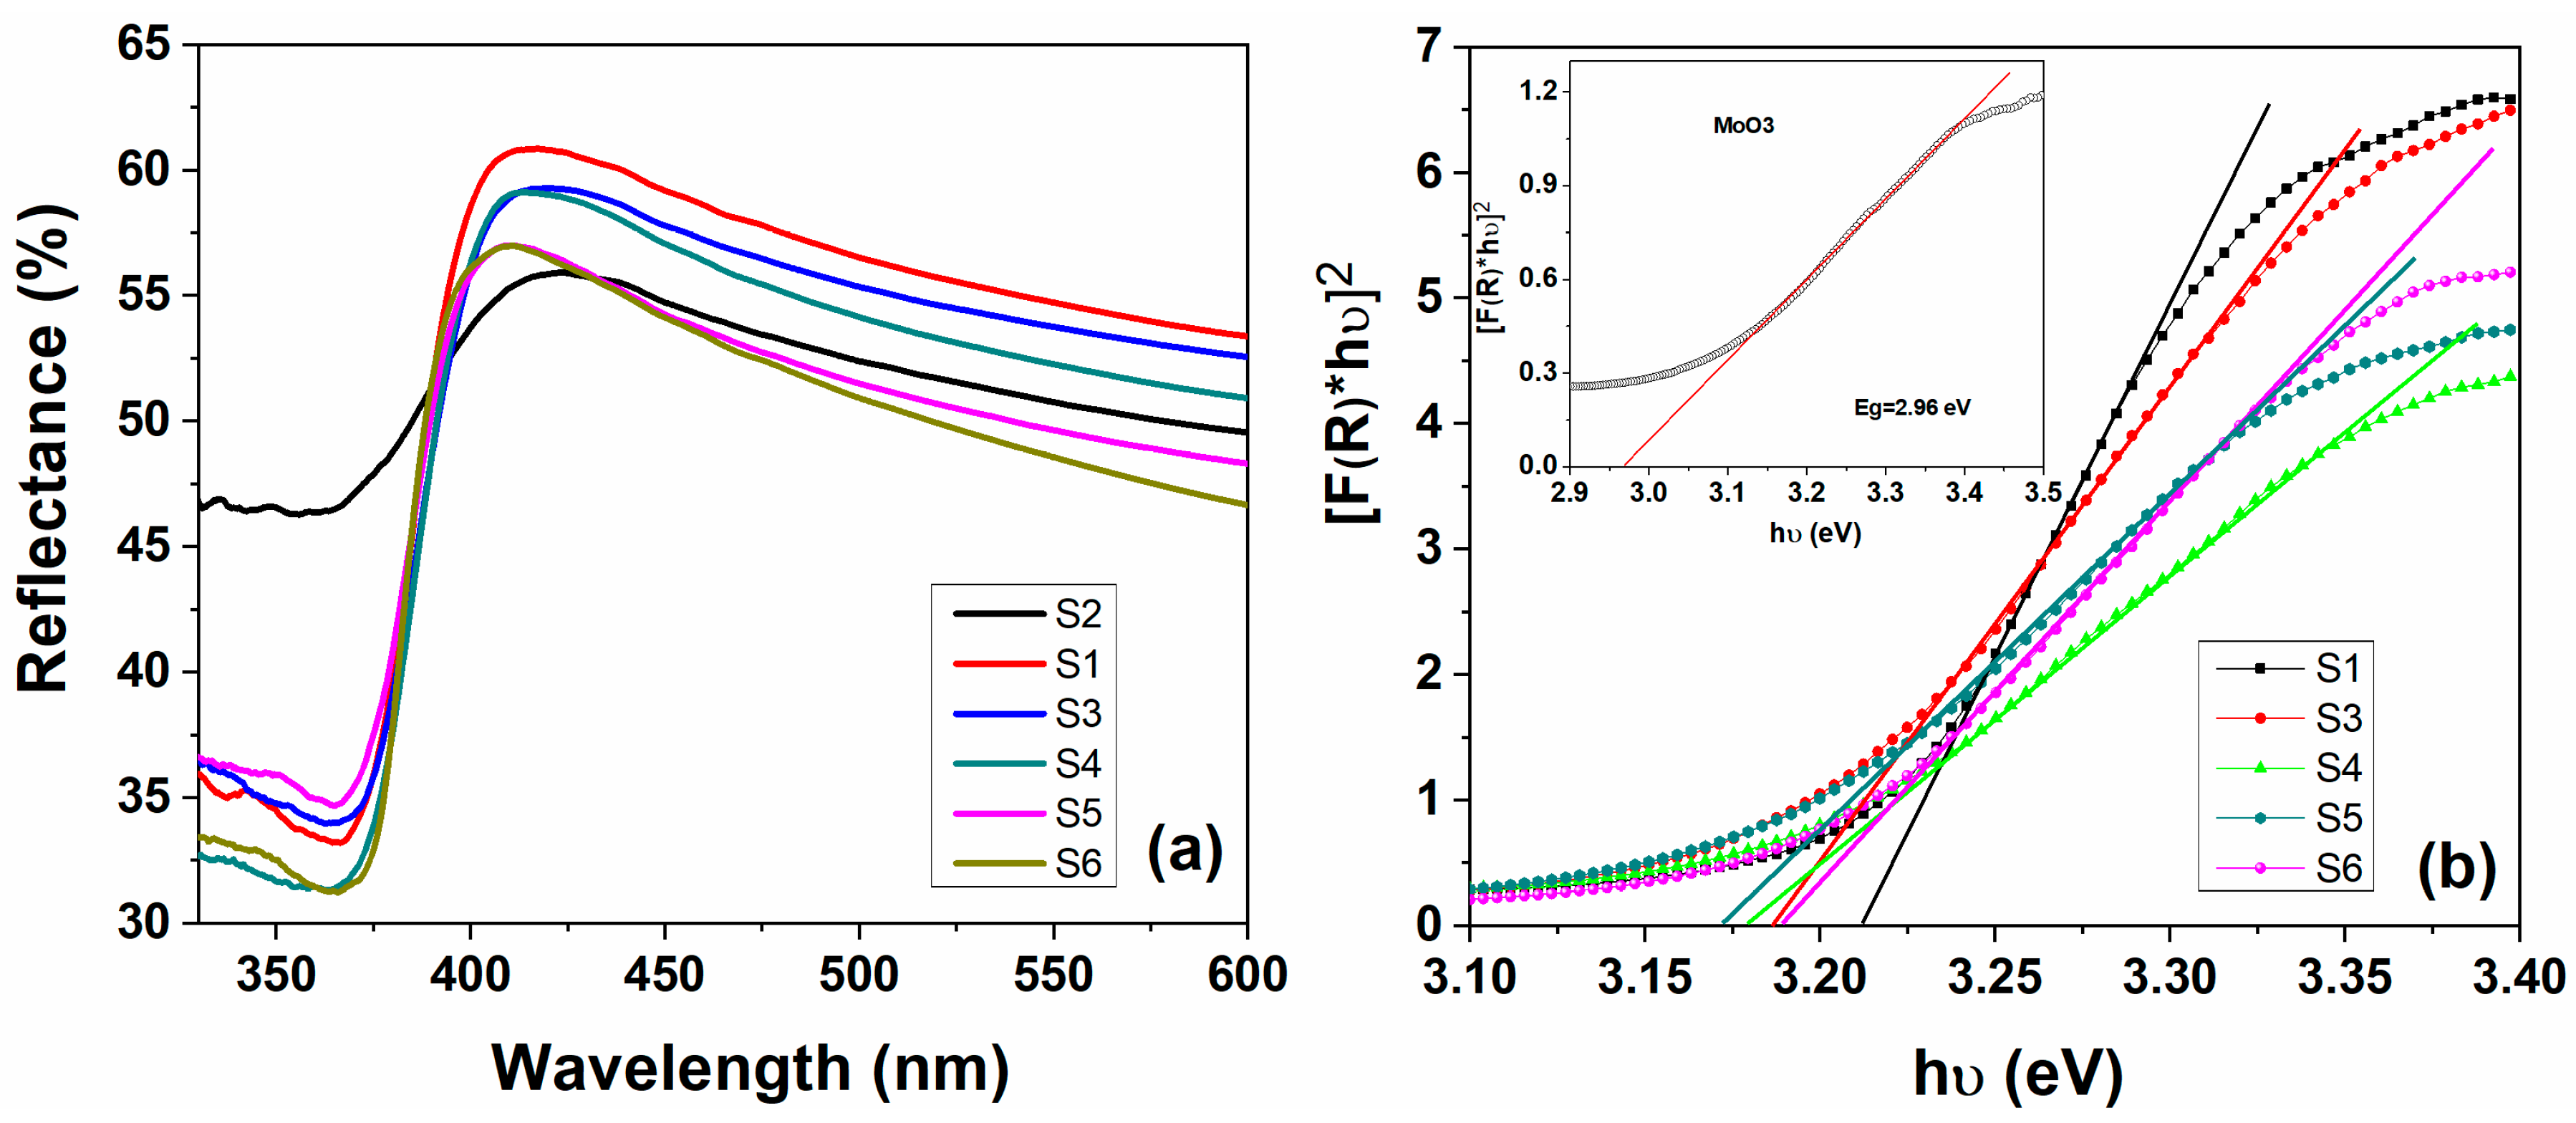
3.3. Optical Properties

Evaluation of optical properties of materials is a very important factor for the study of their photocatalytic activity. UV–vis absorption and emission spectra of MoO3-incorporated ZnO nanostructures dispersed in 1-propanol solution were investigated at room temperature. The incorporation of MoO3 into the ZnO matrix modify the optical properties of the obtained nanostructures. Figure 5. showed the absorption spectra of the pure ZnO- and MoO3-incorporated ZnO samples with various MoO3 weight percentages (S1 → S5). It can be observed that the absorption of all the MoO3-incorporated ZnO samples did not show a large difference in the UV region (only small variations (1–2 nm) in the absorption band position in the spectra). In contrast, the absorption maxima of all MoO3-incorporated ZnO samples shift towards blue (from 382 to 371 nm) are observed, compared with the absorption maximum of the pure ZnO samples. These shifts are due to the incorporation of the MoO3 materials in the pure ZnO matrix. From Figure 5, it can be remarked that the absorption of ZnO:MoO3 nanocomposites was enhanced when the MoO3 doping level did not exceed 1.66% molar ratio Mo/Zn, while for nanostructures with a higher content of MoO3 the absorption shows a small decrease (Figure 5).
One of the important effects of the MoO3 oxide incorporation into the ZnO matrix is the reduction of the direct band gap energy value from 3.211 eV (corresponding to ZnO) to 3.170 eV for ZnO:MoO3 composite materials (Table 2). The band gap energy values of the pure ZnO, MoO3, and for the ZnO:MoO3 composite materials were determined by UV–vis measurements using reflectance spectra, registered between 300–600 nm. Figure 6a showed the reflectance spectra corresponding to pure materials (ZnO, MoO3) and composite systems ZnO:MoO3 (S3 → S6). Thus, the optical band gap energy values, Eg, for all materials were calculated using the Kubelka–Munk equation presented below:
F ( R ) = ( 1 R ) 2 2 R
where F(R) is the Kubelka–Munk function and R is the diffuse reflectance of materials, respectively. Additionally, using [ F ( R ) h ϑ ] = c ( h ϑ E g ) n equation: where h ϑ is photon energy, n is a constant giving the type of optical transition, c is a constant and Eg denotes the band gap energy.
The plots of [ F ( R ) h ϑ ] 2 as a function of the photon energy ( h ϑ ) of all the materials are presented in Figure 6b and by extrapolating the linear part of each curve, the values of the direct optical band gap (Eg) were obtained. The pure ZnO material has an Eg value of 3.21 eV, this value is in good agreement with the reported literature for ZnO [20]. Instead, for pure MoO3 material, a lower Eg value of 2.96 eV (closer to the literature data) [9] was obtained. The band gap energies of the composite materials based on ZnO:MoO3 were calculated to be: 3.186 eV (S3), 3.177 eV (S4), 3.170 eV (S5), and 3.189 eV (S6), respectively. The presence of MoO3 dopant in the ZnO matrix induces a small shift of the absorption edge of ZnO (see Figure 6) in the long wavelength direction and thus decreases the band gap energy (Eg) values. Based on the values of Eg one can calculate the positions of the valence band (VB) and the conduction band (CB) (redox abilities) of new ZnO:MoO3 nanostructures, which directly influence their photocatalytic activity. The conduction band (CB) and valence band (VB) potentials of ZnO:MoO3 were calculated using the following equations [21].
EVB = χ − Ee + 0.5Eg
ECB = EVB − Eg
where χ and Ee, are the electronegativity (for ZnO, the value is approximately 5.79 eV) [22] and the free electron energy on the hydrogen scale (approximately 4.5 eV), respectively. The calculated values of EVB and ECB are listed in Table 2. The values of ECB for MoO3-incorporated ZnO nanostructures shifted to lower energy compared to the pure ZnO, which caused a narrower band gap.
To explore the charge carrier trapping, migration, and charge transfer transitions in the ZnO:MoO3 hybrid nanostructures, the emission spectra of these new materials were recorded under 375 nm wavelength excitation (see Figure 7).
The emission spectra of MoO3-incorporated ZnO nanostructures show a sharp and intense blue emission band around 412–416 nm, ascribed to the near band edge (NBE) emission due to free exciton recombination [23] and a broader and lower green emission band in the visible region at ≈ 450–550 nm (with maxima around 506 nm). This green emission band is due to the formation of oxygen vacancies by the presence of MoO3 oxide in the structure of the target nanostructures and the presence of some intrinsic defects in the ZnO structure. Generally, the intrinsic defects in ZnO include oxygen vacancies (Vo), zinc vacancies (VZn) oxygen (Oi), zinc (Zni) interstitials, and defect states dominating the emission in the visible range [24]. It was observed from Figure 7 that the emission intensity is considerably enhanced with the addition of MoO3 as compared to the free ZnO sample. This remarkable improvement in the emission of MoO3 incorporated samples can be attributed to the energy transfer from ZnO to the MoO3 metal oxide and a higher recombination rate in these samples. Instead, in the photoluminescence spectrum of pure ZnO nanostructures, the wavelength of the maxima of the emission band is located at 431 nm, with low intensity, and the green emission band has disappeared (compared to the spectra of MoO3-incorporated ZnO samples). The undoped zinc oxide nanostructure displays only an emission band around 431 nm, with low intensity and the green emission band practically disappeared in comparison with MoO3-incorporated ZnO samples. Also, it can be seen that the intensity of the green emission band increases as the molybdenum trioxide level increases, excepting nanostructure ZnO:MoO3 (S5), where an emission band at about 478 nm has occurred (Figure 7), which have not been observed in the other samples due to the intense transitions determined by the oxygen vacancies. Moreover, the lower intensities of the green emission band in sample S5 can determine the creation of more electron trapping sites, which facilitates the transfer of photogenerated charge carriers increasing thus the electron-hole lifetime and the photocatalytic response was exchanged [25]. As seen from Table 3, the nanostructure ZnO:MoO3 (S5) has a larger decay time as compared to other samples. In fact, for this nanostructure the highest shift to shorter wavelengths of the absorption and emission bands was observed and at the same time, the lowest value of Eg was obtained (Table 2). The weak blue emission band at 478 nm can be assigned to the electron transitions between interstitial zinc (Zni) and Zn vacancies [26]. Thus, the sample ZnO:MoO3 (S5) practically exhibits a very weak green emission band because the MoO3 loading can increase distortion centers and some surface defects in the lattice leading to the decrease of the oxygen vacancies. Furthermore, the emission spectra of zinc oxide (ZnO) sample incorporating with molybdenum trioxide (MoO3) appear similar in shape to the emission peaks but show a small shift (19 nm) in wavelength toward the blue range as compared to that observed for pure ZnO nanostructures.

3.4. Time-Resolved Photoluminescence Data and International Commission on Illumination (CIE) Coordinates

For this purpose, the samples (S1 → S6) were exciting with a light source of 375 nm. Base on the maximum emission band at 406 nm, the lifetime decay curves were evaluated. As a representative example, in Figure 8 is displayed the lifetime decay profiles for the ZnO:MoO3 (S5) sample. The decay curves were fitted to a bi-exponential equation for all the studied ZnO:MoO3 nanostructures and the experimental emission lifetime values of these materials were calculated using the equations given below [23]:
I ( t ) = A 1 exp ( t τ 1 ) + A 2 e x p ( t τ 2 )
and the value of average decay time can be estimated by the following formula:
τ e f f *   ( n s ) = ( A 1 τ 1 2 + A 2 τ 2 2 ) / ( A 1 τ 1 + A 2 τ 2 )
where I(t) is the time dependent emission intensity (emission intensity at any time); A1 and A2 are the fitting constants and have values between [0, 1]; τ1 and τ2 are the decay times of the fast and slow decay components.
The obtained values of the fast and slow decay components, as well as average lifetime values for all samples, are listed in Table 3. In general, the fast decay component is related to the non-radiative recombination and the slow decay is connected with the radiative lifetime of the free exciton. It was stated that the non-radiative recombination process is featured in defects related to oxygen vacancies [27]. The emission decay for all investigated nanostructures was obtained by using a biexponential model to fit the experimental data and have resulted in two lifetimes τ1 and τ2. For all investigated nanostructures τ1 is lower than τ2, but the contributions of the two lifetime components (a1 and a2) are opposite (Table 3). Therefore, the highest lifetime τ1 was obtained for the ZnO:MoO3 (S5) sample (0.465 ns). Both fast and slow decay constants can be tuned by adding MoO3 to the ZnO matrix. The irregular variations of lifetime values as a function of the MoO3 content can be explained by the difference of dispersion of MoO3 in these samples, where the redundant MoO3 can act as recombination centers [28]. Since MoO3 has a lower band gap compared to ZnO will induce a shorter lifetime for the generated electron-hole pairs, decreasing the efficiency. For the pure ZnO sample, the average lifetime values are shorter than that of all ZnO:MoO3 nanostructures (Table 3). This increase in the average lifetime values may be attributed to the MoO3 doping-induced non-radiative recombination centers. Moreover, the average lifetime values (Table 3) decrease with increasing doping concentration (from S1 to S5), which indicates the existence of an energy transfer process between the two components.
Based on the emission spectra of the pure ZnO and MoO3-incorporated ZnO nanostructures was built their CIE (International Commission on Illumination)-1931 color chromaticity diagram, which is shown in Figure 9. The values obtained for the color CIE chromaticity coordinates for pure ZnO and all the hybrid composites are shown in Figure 9. Generally, the quality of any light emitted can be investigated in terms of correlated color temperature (CCT) which can be calculated using the McCamy’s relation as [29]:
CCT = 437n3 + 3601n2 + 6861n + 5517
where, n = (x − xe)/(ye − y) is the inverse slope line and the point at xe = 0.332, ye = 0.186 is the epicenter. The values obtained for calculated CCT were found to be: 82,868 K, 11,389 K, 187,053 K, and 16,098 K, for S3, S5, S5, and S6 nanostructures, respectively. These values are located inside of the range of clear blue poleward sky light [30]. However, based on the chromaticity diagram, it can be said that the samples exhibit some differences in color emission determined by the MoO3 loading. As seen, the nanostructures containing 0.84% and 3.26% molar ratio Mo/Zn presented emissions in the blue region, whereas the samples having 1.66% and 4.81% molar ratio Mo/Zn exhibited coordinates close greenish-blue color. This color shift to the green region can be connected to a higher level of defects due to the high intensity of the green emission band around 520 nm, leading to a higher electron-hole pair recombination rate, which is not favorable to the photocatalysis process.

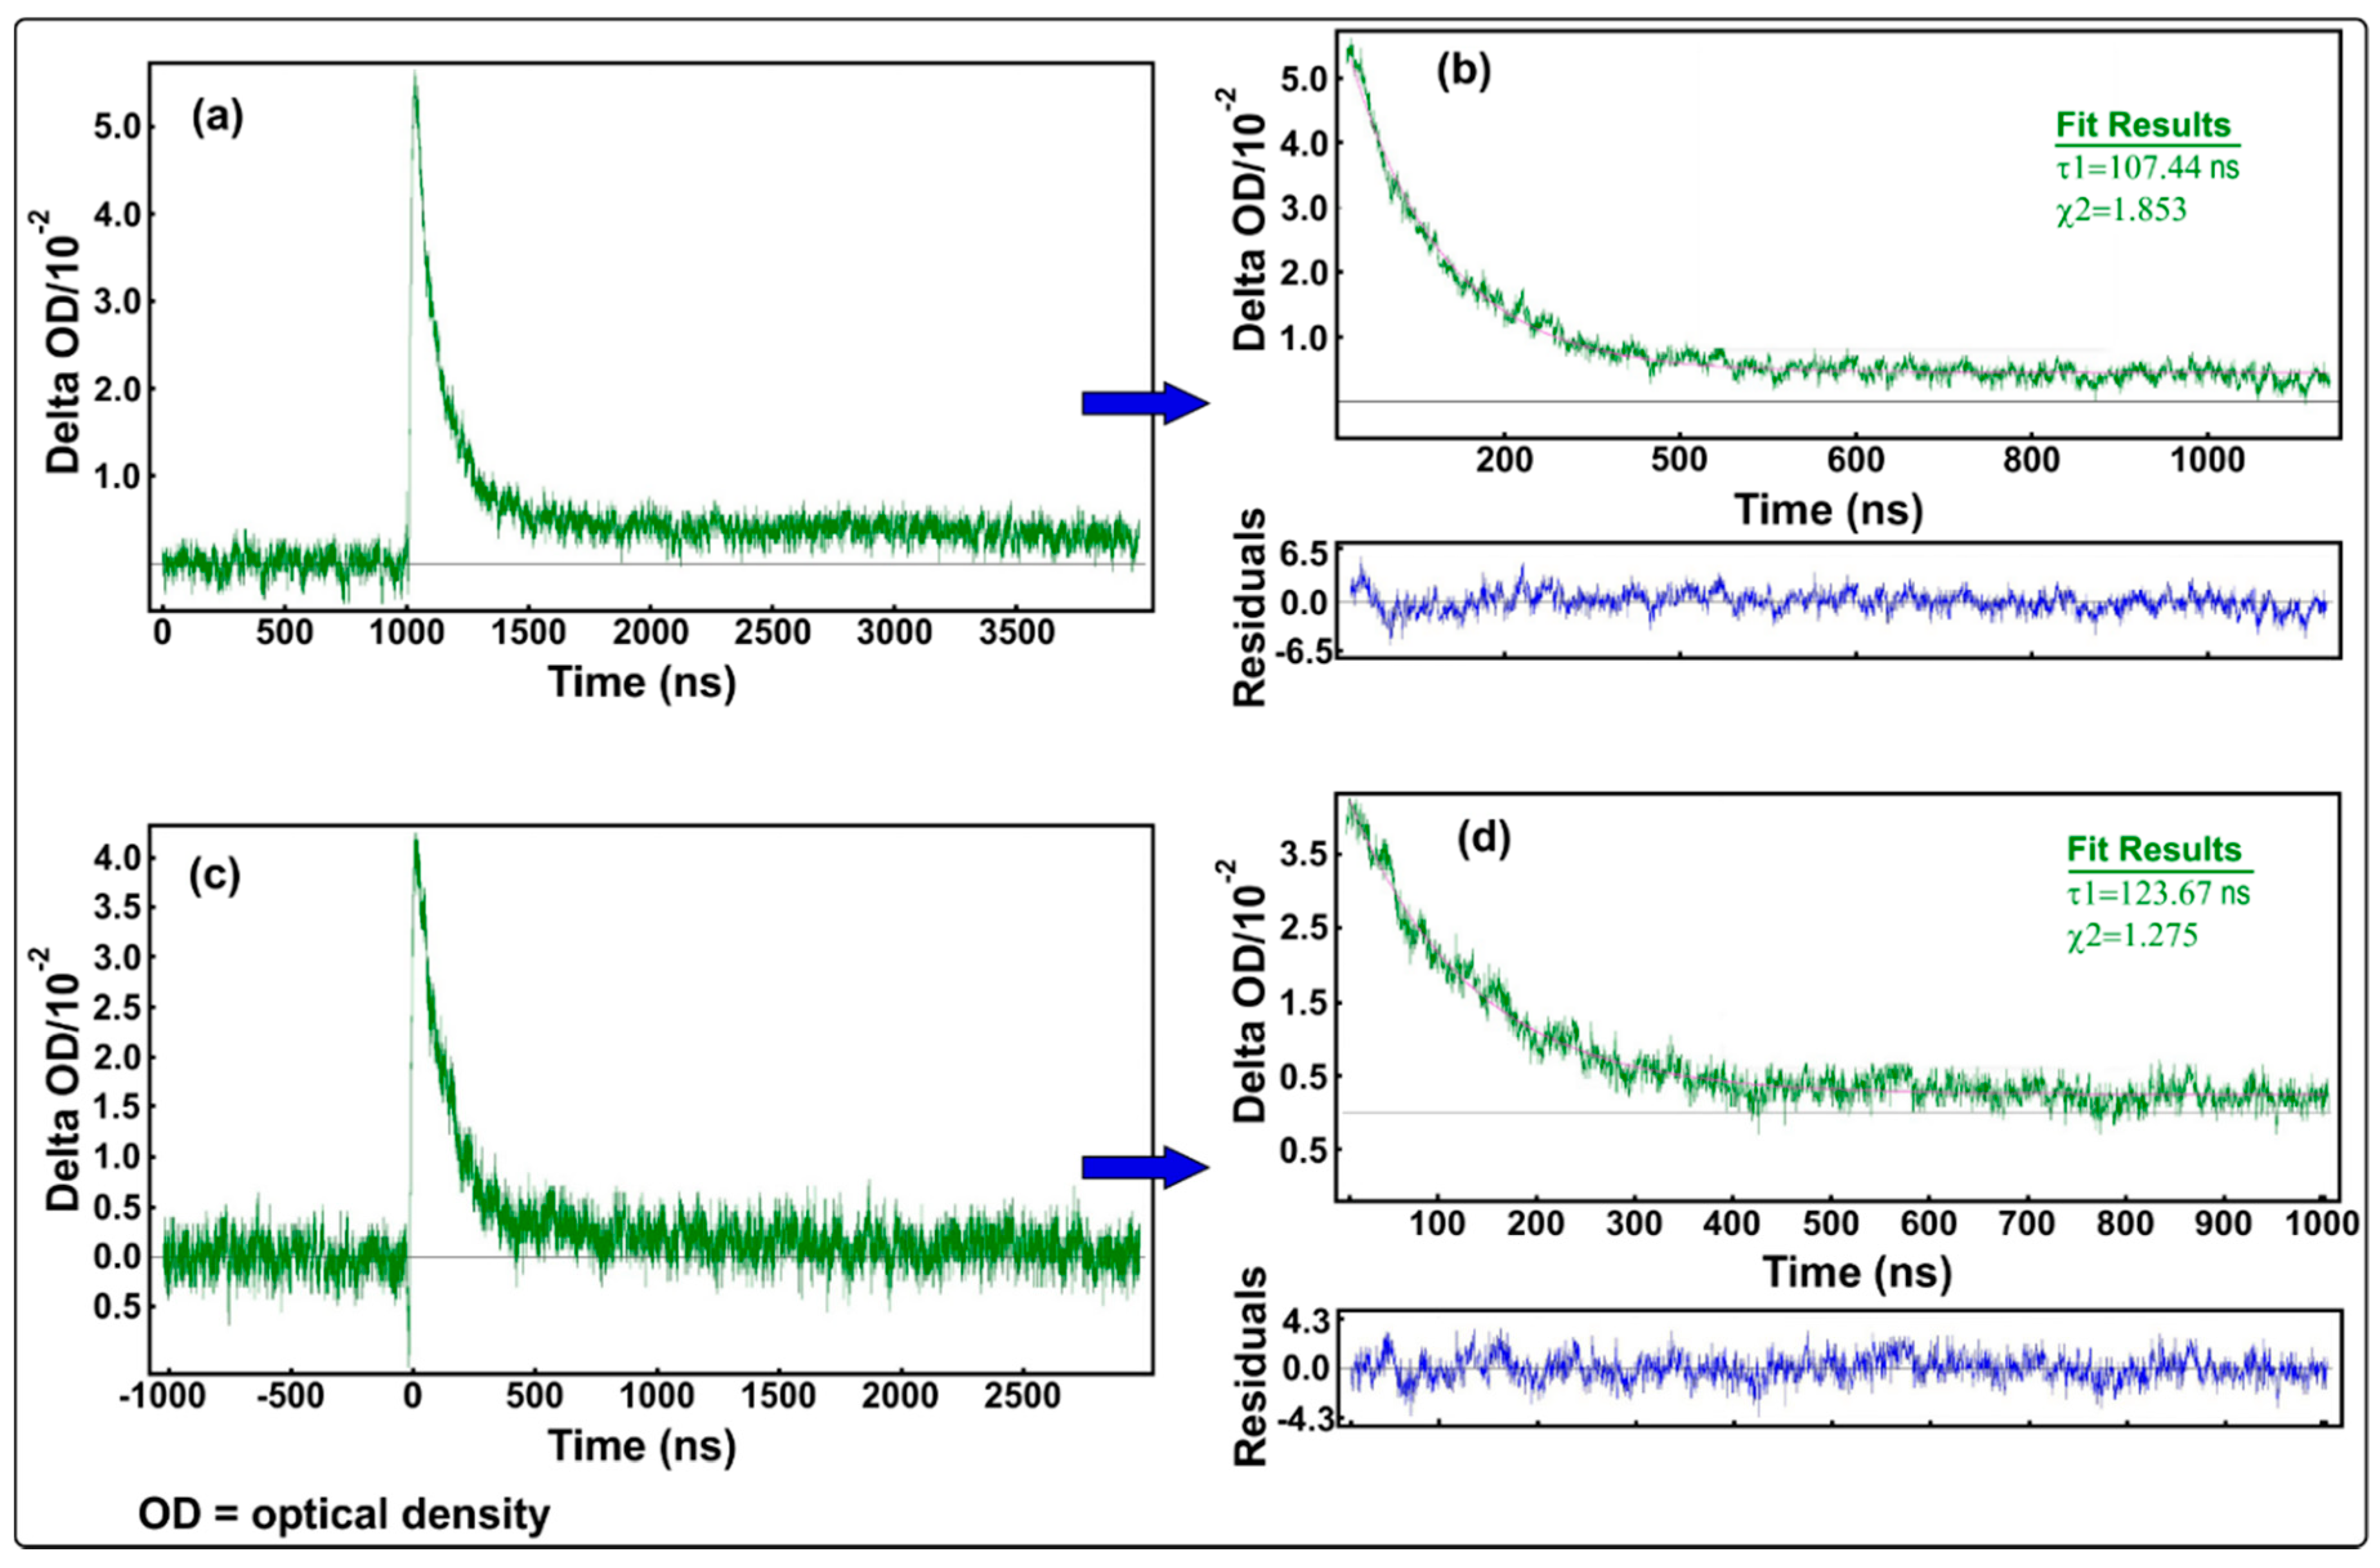
3.5. Nanosecond Time-Resolved Absorption Data

For two selected samples, (S3 and S5), the transient absorption data in 1-propanol solution were recorded at room temperature in order to monitor the optical absorption of photogenerated transient species (such as excited states, radicals and solvated electrons produced by the interaction between radiation and the substrate, more specifically, the kinetics of each transient species). Figure 10 shows the kinetics data, for S3 (Figure 10a,b) and S5 (Figure 10c,d) samples, which were fitted to exponential decay using Edinburgh Instruments software, after recording the decay rates of the transient species monitored at 372 nm (the wavelength at which these transient species absorb, see Figure 5). The decay rate for the S5 sample was found to be faster than the decay rate obtained for the sample having S3 (107.44 ns).

3.6. Photocatalytic Properties

The photocatalytic activity of the pure ZnO and synthesized ZnO:MoO3 nanocomposites was evaluated by photodegradation of rhodamine B (RhB) dye in aqueous solution, with an initial concentration of 5 mg/L, under visible light irradiation from a tungsten lamp (100 W)), at different times. The absorption spectra of the RhB dye (blank test) were analyzed at different exposure times (up to 20 h of irradiation), in the absence of the photocatalyst. The blank test showed that the intensity of the absorption bands of RhB decreases slightly reaching a degradation of about 5.8%. To get the most reliable results, the RhB dye degradation processes were analyzed in the presence of pure ZnO and compared with the ZnO:MoO3 (S3 → S6) hybrid materials. Figure 11 shows changes in the absorption spectra of RhB dye during irradiation under visible light in the presence of ZnO (Figure 11a) and ZnO:MoO3 (S5) (Figure 11b) nanostructures.
The intensity of the absorption bands in the absorption spectra of the RhB dye solution shown in Figure 11a,b decreases with increasing illumination time. It can be observed that the intensity of the absorption band at 556 nm decreased with increasing irradiation time, but with a maximum decrease observed for the S5 sample (RhB dye was highly degraded in this case). The removal efficiency (RE(%)) was calculated based on the following equation:
R E ( % ) = ( C 0 C e ) C 0 × 100 %
(where C0 is the initial RhB concentration (mg/L) and Ce is the RhB concentration at the time t (mg/L)) and the results obtained after the degradation of RhB dye for 6 h of irradiation in the presence of pure ZnO and ZnO:MoO3 are presented in Figure 11c. The removal efficiency of all samples obeys the followed order of S5 > S4 > S3 > S6 > pure ZnO (S1), that was very close to fluorescence data (fluorescence intensity). The higher photocatalytic efficiency of the ZnO:MoO3 (S5) nanostructures can be accounted for by decreasing Eg values compared to pure ZnO, a fact confirmed by other authors in differently doped ZnO-based systems [31,32]. Moreover, the increase in photocatalytic activity with the content of MoO3 may be due to the formation of MoO3/ZnO heterojunctions, as reported by Hirotaka et al. [33] for a similar system (TiO2/MoO3).
To estimate quantitatively the kinetics of RhB dye degradation, we used a pseudo-first order model expressed by the following equation: ln(C0/C) = kt, (where, C0 and C are the concentrations of dye in the solution at time 0 and t, respectively, and k is the pseudo-first-order rate constant). From the linear plots of ln(C/C0) versus the irradiation time (see Figure 11d), having a good correlation with the pseudo-first order reaction kinetics (R2 > 0.99), the values of the reaction rate constants were calculated and were found to be: k1 = 0.0480 h−1 (ZnO) and k2 = 0.1072 h−1 (ZnO:MoO3 (S5)), respectively. Likewise, these results show that after doping with 3.26% molar ratio Mo/Zn, the value of the reaction rate constant increases significantly, doubling its value (k2 = 2 × k1), as compared to that obtained for pure ZnO. The efficiency of photocatalytic degradation is found to be better in the presence of the MoO3-incorporated ZnO nanostructures than those of pure ZnO and/or MoO3 nanostructures [17], due to the reduction in band gap energy. The presence of structural defects due to the oxygen vacancies (VO), Zn-vacancy (VZn), oxygen interstitial (Oi), Zn-interstitial (Zni) and the extrinsic impurities, which have been confirmed by photoluminescence measurements, also leads to an increase of photocatalytic efficiency for ZnO:MoO3 (S5) sample. Similar behavior has been also reported by other authors for the Ce, Gd doped ZnO nanostructures [34,35,36]. In addition, the photocatalytic efficiency may also be due to the microstructural defects that arise in the nanostructures after doping/loading with other materials. Table 4 presents the main works on Mo-doped ZnO materials present in the literature regarding photocatalytic activity for the degradation of different dyes. These are compared to the materials (ZnO:MoO3) presented in this work. According to the data listed in Table 4 [14,27,36,37], ZnO:MoO3 (with 3.26% molar ratio Mo/Zn into ZnO matrix) showed a good value of the reaction rate constants (k = 0.1072 h−1 or 0.0018 min−1) related to other studies for similar materials. However, the advantages of these materials are degradation of dyes in visible light of low intensity, the use of a reasonable amount of catalyst (0.5 g/L), and testing the material in soft conditions without acidification of solutions, in the absence of H2O2, and degradation of dyes at room temperature, usually used to boost the photochemical reactions.

4. Conclusions

Pure ZnO, MoO3 and MoO3-incorporated ZnO nanostructures were prepared by electrospinning and calcination at 500 °C for 2 h. The XRD diffractograms confirmed the hexagonal wurtzite-type structure for pure ZnO, the orthorhombic crystalline structure obtained for MoO3, and a combination of these structures for the ZnO:MoO3 (S5) composite nanostructure. The optical properties of the prepared MoO3-incorporated ZnO samples were studied using UV–vis absorption spectroscopy, and steady-state/time-resolved fluorescence spectroscopy. The absorption and emission bands are blue-shifted as MoO3 concentrations increase. The fluorescence lifetime decay analysis exhibits a bi-exponential equation, indicating the existence of the energy transfer processes, and the values of the average emission lifetime decrease with increasing MoO3 concentration. Moreover, the excited-state dynamics of S3 and S5 were characterized by nanosecond transient absorption spectroscopy. The photocatalytic activity of the pure/MoO3-incorporated ZnO nanostructures obtained was tested for the use in photocatalytic degradation of the aqueous rhodamine B dye solution under visible light irradiation. The values of the reaction rate constant obtained for ZnO:MoO3 sample (S5) was higher as compared to that of pure ZnO (S1) and depends on the MoO3 concentration (upon the incorporation of 3.26% molar ratio Mo/Zn into ZnO matrix, the value of reaction rate constant doubled). The present contribution is the first report on synthesis of these materials by electrospinning followed by calcination as well as study of photocatalytic activity under visible light for rhodamine B dye degradation.

Author Contributions

Author Contributions: P.P., and O.I.; formal analysis, P.P. and O.I.; investigation, A.A., P.P., M.H. and N.O.; resources, O.I.; data curation, P.P. and O.I.; writing—original draft preparation, P.P. and O.I.; writing—review and editing, P.P. and O.I. All authors have read and agreed to the published version of the manuscript.

Funding

This research received no external funding.

Conflicts of Interest

The authors declare no conflict of interest.

References

  1. Pascariu, P.; Homocianu, M. ZnO-Based ceramic nanofibers: Preparation, properties and applications. Ceram. Int. 2019, 45, 11158–11173. [Google Scholar] [CrossRef]
  2. Türkyılmaz, Ş.Ş.; Güy, N.; Özacar, M. Photocatalytic efficiencies of Ni, Mn, Fe and Ag doped ZnO nanostructures synthesized by hydrothermal method: The synergistic/antagonistic effect between ZnO and metals. J. Photochem. Photobiol. A Chem. 2017, 341, 39–50. [Google Scholar] [CrossRef]
  3. Pascariu, P.; Airinei, A.; Olaru, N.; Olaru, L.; Nica, V. Photocatalytic degradation of Rhodamine B dye using ZnO–SnO2 electrospun ceramic nanofibers. Ceram. Int. 2016, 42, 6775–6781. [Google Scholar] [CrossRef]
  4. Pascariu, P.; Tudose, I.V.; Suchea, M.P.; Koudoumas, E.; Fifere, N.; Airinei, A. Preparation and characterization of Ni, Co doped ZnO nanoparticles for photocatalytic applications. Appl. Surf. Sci. 2018, 448, 481–488. [Google Scholar] [CrossRef]
  5. Chithambararaj, A.; Sanjini, N.S.; Velmathi, S.; Bose, A.C. Preparation of h-MoO3 and α-MoO3 nanocrystals: Comparative study on photocatalytic degradation of methylene blue under visible light irradiation. Phys. Chem. Chem. Phys. 2013, 15, 14761–14769. [Google Scholar] [CrossRef]
  6. Wei, W.; Zhang, Z.; You, G.; Shan, Y.; Xu, Z. Preparation of recyclable MoO3 nanosheets for visible-Light driven photocatalytic reduction of Cr(vi). RSC Adv. 2019, 9, 28768–28774. [Google Scholar] [CrossRef] [Green Version]
  7. Peña-Bahamonde, J.; Wu, C.; Fanourakis, S.K.; Louie, S.M.; Bao, J.; Rodrigues, D.F. Oxidation state of Mo affects dissolution and visible-Light photocatalytic activity of MoO3 nanostructures. J. Catal. 2020, 381, 508–519. [Google Scholar] [CrossRef]
  8. Bai, S.; Chen, S.; Chen, L.; Zhang, K.; Luo, R.; Li, D.; Liu, C.C. Ultrasonic synthesis of MoO3 nanorods and their gas sensing properties. Sens. Actuators B Chem. 2012, 174, 51–58. [Google Scholar] [CrossRef]
  9. Al-Otaibi, A.L.; Ghrib, T.; Alqahtani, M.; Alharbi, M.A.; Hamdi, R.; Massoudi, I. Structural, optical and photocatalytic studies of Zn doped MoO3 nanobelts. Chem. Phys. 2019, 525, 110410. [Google Scholar] [CrossRef]
  10. Ong, C.B.; Ng, L.Y.; Mohammad, A.W. A review of ZnO nanoparticles as solar photocatalysts: Synthesis, mechanisms and applications. Renew. Sustain. Energy Rev. 2018, 81, 536–551. [Google Scholar] [CrossRef]
  11. Kim, B.-Y.; Yoon, J.-W.; Lee, C.-S.; Park, J.-S.; Lee, J.-H. Trimethylamine Sensing Characteristics of Molybdenum doped ZnO Hollow Nanofibers Prepared by Electrospinning. J. Sens. Sci. Technol. 2015, 24, 419–422. [Google Scholar] [CrossRef] [Green Version]
  12. Qamar, M.T.; Aslam, M.; Rehan, Z.; Soomro, M.T.; Ahmad, I.; Ishaq, M.; Ismail, I.M.; Fornasiero, P.; Hameed, A. MoO3 altered ZnO: A suitable choice for the photocatalytic removal of chloro-Acetic acids in natural sunlight exposure. Chem. Eng. J. 2017, 330, 322–336. [Google Scholar] [CrossRef] [Green Version]
  13. Li, G.R.; Wang, Z.L.; Zheng, F.L.; Ou, Y.N.; Tong, Y.X. ZnO@MoO3 core/shell nanocables: Facile electrochemical synthesis and enhanced supercapacitor performances. J. Mater. Chem. 2011, 21, 4217–4221. [Google Scholar] [CrossRef]
  14. Saminathanab, D.; Deogratiasa, T.; Thirugnanasambandana, S.; Vengidusamyc, N.; Arumainathana, S.; Dhanavel, S.; Sivaranjani, T.; Narayanan, V.; Stephen, A. Facile synthesis of 1D/1D ZnO@h-MoO3 for enhanced visible light driven photo degradation of industrial textile effluent. Mater. Lett. 2020, 262, 127049. [Google Scholar] [CrossRef]
  15. Cojocaru, C.; Dorneanu, P.P.; Airinei, A.; Olaru, N.; Samoila, P.; Rotaru, A. Design and evaluation of electrospun polysulfone fibers and polysulfone/NiFe2O4 nanostructured composite as sorbents for oil spill cleanup. J. Taiwan Inst. Chem. Eng. 2017, 70, 267–281. [Google Scholar] [CrossRef]
  16. Dorneanu, P.P.; Cojocaru, C.; Samoila, P.; Olaru, N.; Airinei, A.; Rotaru, A. Novel fibrous composites based on electrospun PSF and PVDF ultrathin fibers reinforced with inorganic nanoparticles: Evaluation as oil spill sorbents. Polym. Adv. Technol. 2018, 29, 1435–1446. [Google Scholar] [CrossRef]
  17. Faraz, M.; Naqvi, F.K.; Shakir, M.; Khare, N. Synthesis of samarium-Doped zinc oxide nanoparticles with improved photocatalytic performance and recyclability under visible light irradiation. New J. Chem. 2018, 42, 2295–2305. [Google Scholar] [CrossRef]
  18. Jia, T.; Wang, W.; Long, F.; Zhengyi, F.; Wang, H.; Zhang, Q. Fabrication, characterization and photocatalytic activity of La-Doped ZnO nanowires. J. Alloys Compd. 2009, 484, 410–415. [Google Scholar] [CrossRef]
  19. Shaban, M.; Zayed, M.; Hamdy, H. Nanostructured ZnO thin films for self-Cleaning applications. RSC Adv. 2017, 7, 617–631. [Google Scholar] [CrossRef]
  20. Srikant, V.; Clarke, D.R. On the optical band gap of zinc oxide. J. Appl. Phys. 1998, 83, 5447–5451. [Google Scholar] [CrossRef]
  21. Tu, Y.F.; Huang, S.Y.; Sang, J.P.; Zou, X.W. Synthesis and photocatalytic properties of Sn-Doped TiO2 nanotube arrays. J. Alloys Compd. 2009, 482, 382–387. [Google Scholar] [CrossRef]
  22. Neena, D.; Kondamareddy, K.K.; Bin, H.; Lu, D.; Kumar, P.; Dwivedi, R.K.; Pelenovich, V.O.; Zhao, X.-Z.; Gao, W.; Fu, D. Enhanced visible light photodegradation activity of RhB/MB from aqueous solution using nanosized novel Fe-Cd co-Modified ZnO. Sci. Rep. 2018, 8, 10691. [Google Scholar]
  23. Xiao, F.; Chen, R.; Shen, Y.Q.; Dong, Z.L.; Wang, H.H.; Zhang, Q.Y.; Sun, H. Efficient Energy Transfer and Enhanced Infrared Emission in Er-Doped ZnO-SiO2 Composites. J. Phys. Chem. C 2012, 116, 13458–13462. [Google Scholar] [CrossRef]
  24. Pandey, P.; Kurchania, R.; Haque, F.Z.; Khan, F.Z. Structural, diffused reflectance and photoluminescence study of cerium doped ZnO nanoparticles synthesized through simple sol–Gel method. Optik 2015, 126, 3310–3315. [Google Scholar] [CrossRef]
  25. Fang, Y.; Lang, J.; Wang, J.; Han, Q.; Zhang, Z.; Zhang, Q.; Yang, J.; Zhong, B. Rare-Earth doping engineering in nanostructured ZnO: A new type of eco-Friendly photocatalyst with enhanced photocatalytic characteristics. Appl. Phys. A 2018, 124, 1–12. [Google Scholar] [CrossRef]
  26. Theyvaraju, D.; Muthukumaran, S. Preparation, structural, photoluminescence and magnetic studies of Cu doped ZnO nanoparticles co-Doped with Ni by sol–Gel method. Physica E 2015, 74, 93–100. [Google Scholar] [CrossRef]
  27. Mondal, P. Effect of Oxygen vacancy induced defect on the optical emission and excitonic lifetime of intrinsic ZnO. Opt. Mater. 2019, 98, 109476. [Google Scholar] [CrossRef]
  28. Yu, C.; Yang, K.; Shu, Q.; Yu, J.C.-M.; Cao, F.; Li, X.; Zhou, X. Preparation, characterization and photocatalytic performance of Mo-Doped ZnO photocatalysts. Sci. China Ser. B Chem. 2012, 55, 1802–1810. [Google Scholar] [CrossRef]
  29. McCamy, C.S. Correlated color temperature as an explicit function of chromaticity coordinates. Color Res. Appl. 1992, 17, 142–144. [Google Scholar] [CrossRef]
  30. Hernández-Andrés, J.; Lee, R.L.; Romero, J. Calculating correlated color temperatures across the entire gamut of daylight and skylight chromaticities. Appl. Opt. 1999, 38, 5703–5709. [Google Scholar] [CrossRef] [PubMed]
  31. Phuruangrat, A.; Yayapao, O.; Thongtem, T.; Thongtem, S. Preparation, characterization and photocatalytic properties of Ho doped ZnO nanostructures synthesized by sonochemical method. Superlattices Microstruct. 2014, 67, 118–126. [Google Scholar] [CrossRef]
  32. Franco, A., Jr.; Pessoni, H.V.S. Optical band-Gap and dielectric behavior in Ho-Doped ZnO nanoparticles. Mater. Lett. 2016, 180, 305–308. [Google Scholar] [CrossRef]
  33. Hirotaka, N.; Koichi, K.; Masashi, T. Fabrication and photocatalytic activity of TiO2/MoO3 particulate films. J. Oleo Sci. 2009, 58, 203–211. [Google Scholar]
  34. Lang, J.; Wang, J.; Zhang, Q.; Li, X.; Han, Q.; Wei, M.; Sui, Y.; Wang, D.; Yang, J. Chemical precipitation synthesis and significant enhancement in photocatalytic activity of Ce-Doped ZnO nanoparticles. Ceram. Int. 2016, 42, 14175–14181. [Google Scholar] [CrossRef]
  35. George, A.; Sharma, S.K.; Chawla, S.; Malik, M.M.; Qureshi, M. Detailed of X-Ray diffraction and photoluminescence studies of Ce doped ZnO nanocrystals. J. Alloys Compd. 2011, 509, 5942–5946. [Google Scholar] [CrossRef]
  36. Franco, A., Jr.; Pessoni, H.V.S. Effect of Gd doping on the structural, optical band-Gap, dielectric and magnetic properties of ZnO nanoparticles. Phys. B Condens. Matter 2017, 506, 145–151. [Google Scholar] [CrossRef]
  37. Umar, K.; Aris, A.; Parveen, T.; Jaafar, J.; Majid, Z.A.; Reddy, A.V.B.; Talib, J. Synthesis, characterization of Mo and Mn doped ZnO and their photocatalytic activity for the decolorization of two different chromophoric dyes. Appl. Catal. A Gen. 2015, 505, 507–514. [Google Scholar] [CrossRef]
Figure 1. Scanning electron microscope (SEM) images of the ZnO (S1) (a), MoO3 (S2) (b), ZnO:MoO3 (S4) (c) and ZnO:MoO3 (S5) (d) nanostructures.
Nanomaterials 10 01476 g001
Figure 2. Transmission electron microscope (TEM) micrographs of nanocrystalline building blocks on sample (a) S5 × 350 k; (b) × 1300 k.
Nanomaterials 10 01476 g002
Figure 3. EDX spectra of pure ZnO (a), MoO3 (b) and ZnO:MoO3 (S5) (c) nanostructures.
Nanomaterials 10 01476 g003
Figure 4. X-ray diffraction (XRD) patterns for pure ZnO (a), MoO3 (inset) and ZnO:MoO3 (S5) (b) composite material.
Nanomaterials 10 01476 g004
Figure 5. Absorption spectra of pure ZnO and ZnO-incorporated MoO3 nanostructures with different atomic weight percentages of MoO3 oxide.
Nanomaterials 10 01476 g005
Figure 6. Diffuse reflectance ultraviolet–visible (UV–vis) spectra (a) and plots of [ F ( R ) h ϑ ] 2 versus (b) for pure ZnO (S1), MoO3 (S2) (inset), and ZnO:MoO3 (S3 → S6) nanostructures.
Nanomaterials 10 01476 g006
Figure 7. Fluorescence spectra of pure ZnO and ZnO:MoO3 nanostructures, recorded in 1-propanol solution, at room temperature.
Nanomaterials 10 01476 g007
Figure 8. The lifetime decay profiles for the ZnO:MoO3 (S5) sample (λex = 406 nm); IRF, instrument response function.
Nanomaterials 10 01476 g008
Figure 9. The CIE color chromaticity diagram of pure ZnO and MoO3-incorporated ZnO nanostructures.
Nanomaterials 10 01476 g009
Figure 10. Kinetics transient absorption decay and exponential fitting for ZnO:MoO3 (S3) (a,b) and ZnO:MoO3 (S5) (c,d) samples, upon excitation at 372 nm.
Nanomaterials 10 01476 g010
Figure 11. The absorption spectra changes of the RhB dye in aqueous solution, at various times, upon exposure to visible light irradiation in the presence of pure ZnO (S1) (a) and ZnO:MoO3 (S5) (b) samples; Removal efficiency (%) of the degradation of RhB dye, after 6 h of visible light irradiation (c); Pseudo-first order kinetics for RhB dye degradation in the presence of S1 and S5 samples, respectively (d).
Nanomaterials 10 01476 g011
Table 1. Results of EDX (energy-dispersive X-ray spectroscopy) measurements for the pure ZnO, MoO3, and ZnO-incorporated MoO3 nanostructures.
Sample CodesComposition
of Precursor Salt
Atomic Molar Ratio Mo/Zn (%)Atomic Concentration (%) Obtained from EDX
Zn (%)O (%)Mo (%)
S10.4 g Zn(NO3)2·6H2O-53.0846.92-
S20.4 g (NH4)6Mo7O24·4H2O--72.2326.77
S30.4 g Zn(NO3)2·6H2O
0.002 g (NH4)6Mo7O24·4H2O
0.8451.2047.850.92
S40.4 g Zn(NO3)2·6H2O
0.004 g (NH4)6Mo7O24·4H2O
1.6653.8644.621.51
S50.4 g Zn(NO3)2·6H2O
0.008 g (NH4)6Mo7O24·4H2O
3.2653.2944.672.30
S60.4 g Zn(NO3)2·6H2O
0.012 g (NH4)6Mo7O24·4H2O
4.8150.5544.624.82
Table 2. Calculated band gap energies and band edge potentials for pure ZnO and ZnO-incorporated MoO3 nanostructures.
CodesEgEVB (eV)ECB (eV)
S13.2102.890−0.310
S33.1862.883−0.303
S43.1772.878−0.298
S53.1702.875−0.295
S63.1892.884−0.304
Table 3. Fitted decay times and average lifetimes ( τ e f f *   ( n s ) ) for all pure ZnO and ZnO:MoO3 nanostructures.
CodesFast Decay ComponentSlow Decay Componentχ2 τ e f f *   ( n s )
τ1 (ns)a1 (%)τ2 (ns)a2 (%)
S10.066474.064.105825.941.0043.93
S30.106851.955.341648.051.0345.23
S40.062476.764.608823.240.9954.42
S50.465472.685.060327.321.0074.17
S60.066274.054.069525.951.0863.89
Table 4. Comparison of photocatalytic activities of ZnO:Mo materials.
Photocatalyst
Type
Type and Concentration
of Dyes
Amount
Photocatalyst
(g/mL)
Light
Source
Reaction Rate Constant
k (min−1)
Ref.
ZnO@h-MoO3Methylene Blue0.5Vis-[14]
ZnO:Mo (2%)Orange II0.05/80UV0.0032[27]
ZnO:Mo (0.6%)Direct Yellow 271/1000Vis (500 W)0.0007[36]
Acid Blue 1291/10000.00085
MoO3/ZnOMethylene Blue-UV0.00138[37]
ZnO:MoO3Rhodamine B0.005/10Vis (100 W)0.0018This
work

