Non-Isothermal Crystallization Behavior and Thermal Properties of Polyethylene Tuned by Polypropylene and Reinforced with Reduced Graphene Oxide

 , , , ,
Abstract
:
1. Introduction
2. Materials and Methods
2.1. Materials
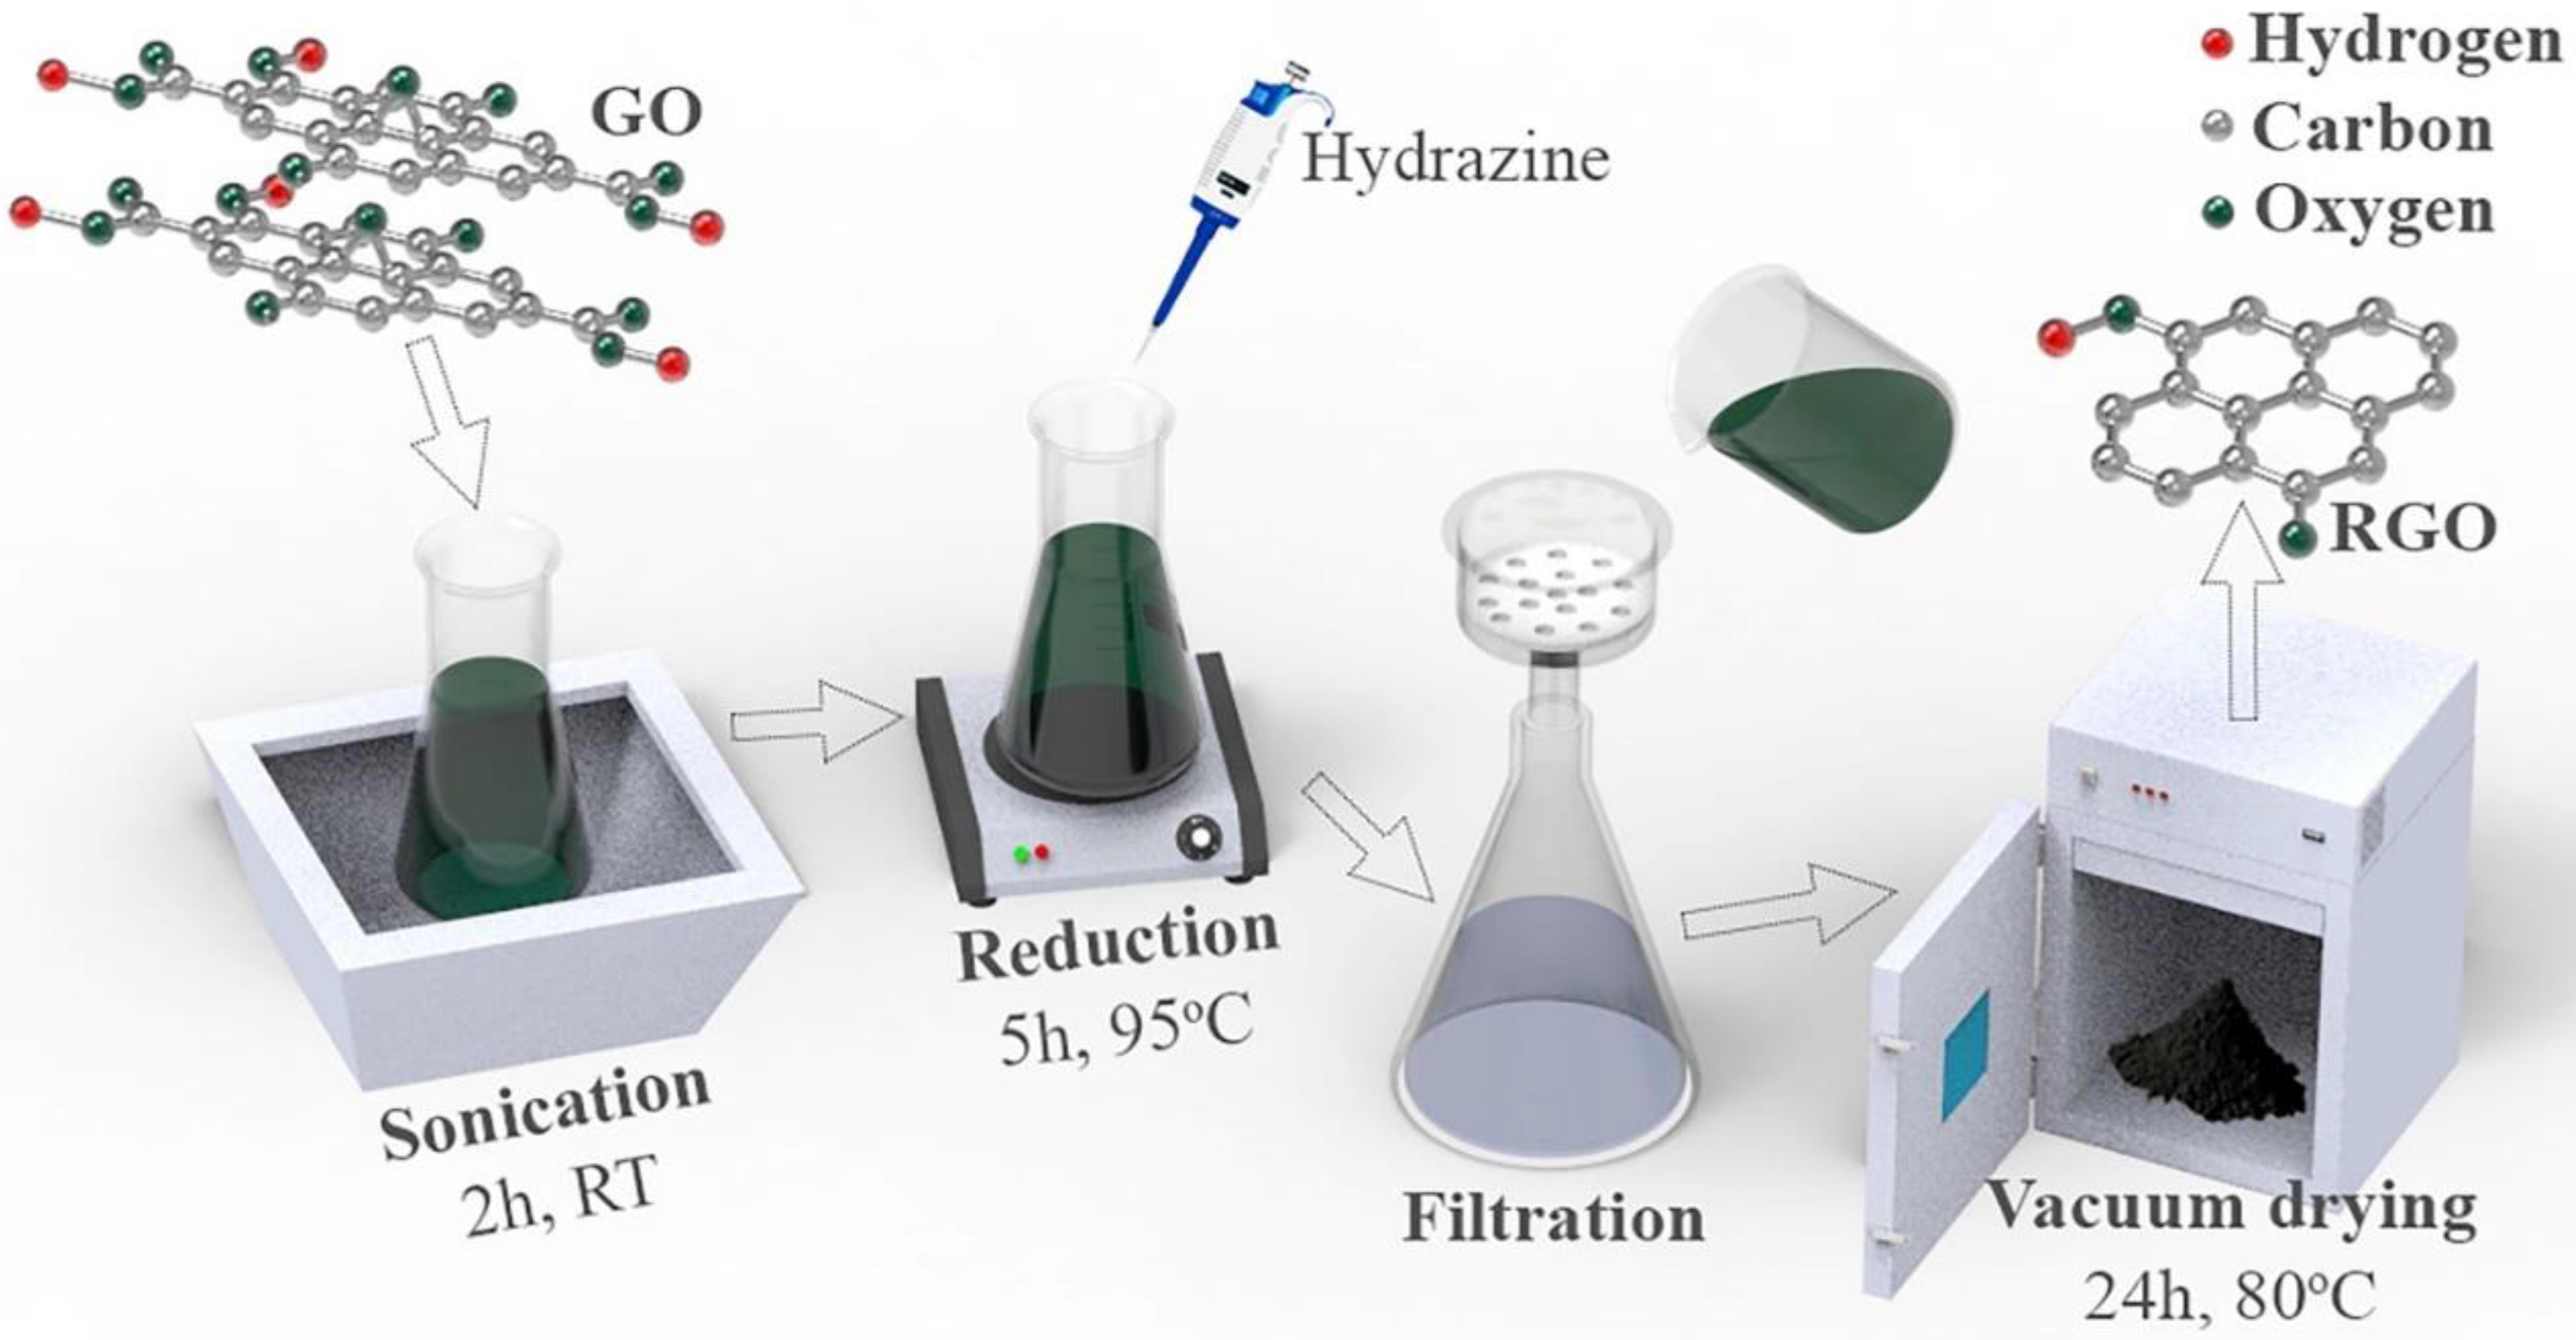
2.2. Preparation of RGO
2.3. Preparation of RGO Filled HDPE/iPP Biphasic Systems
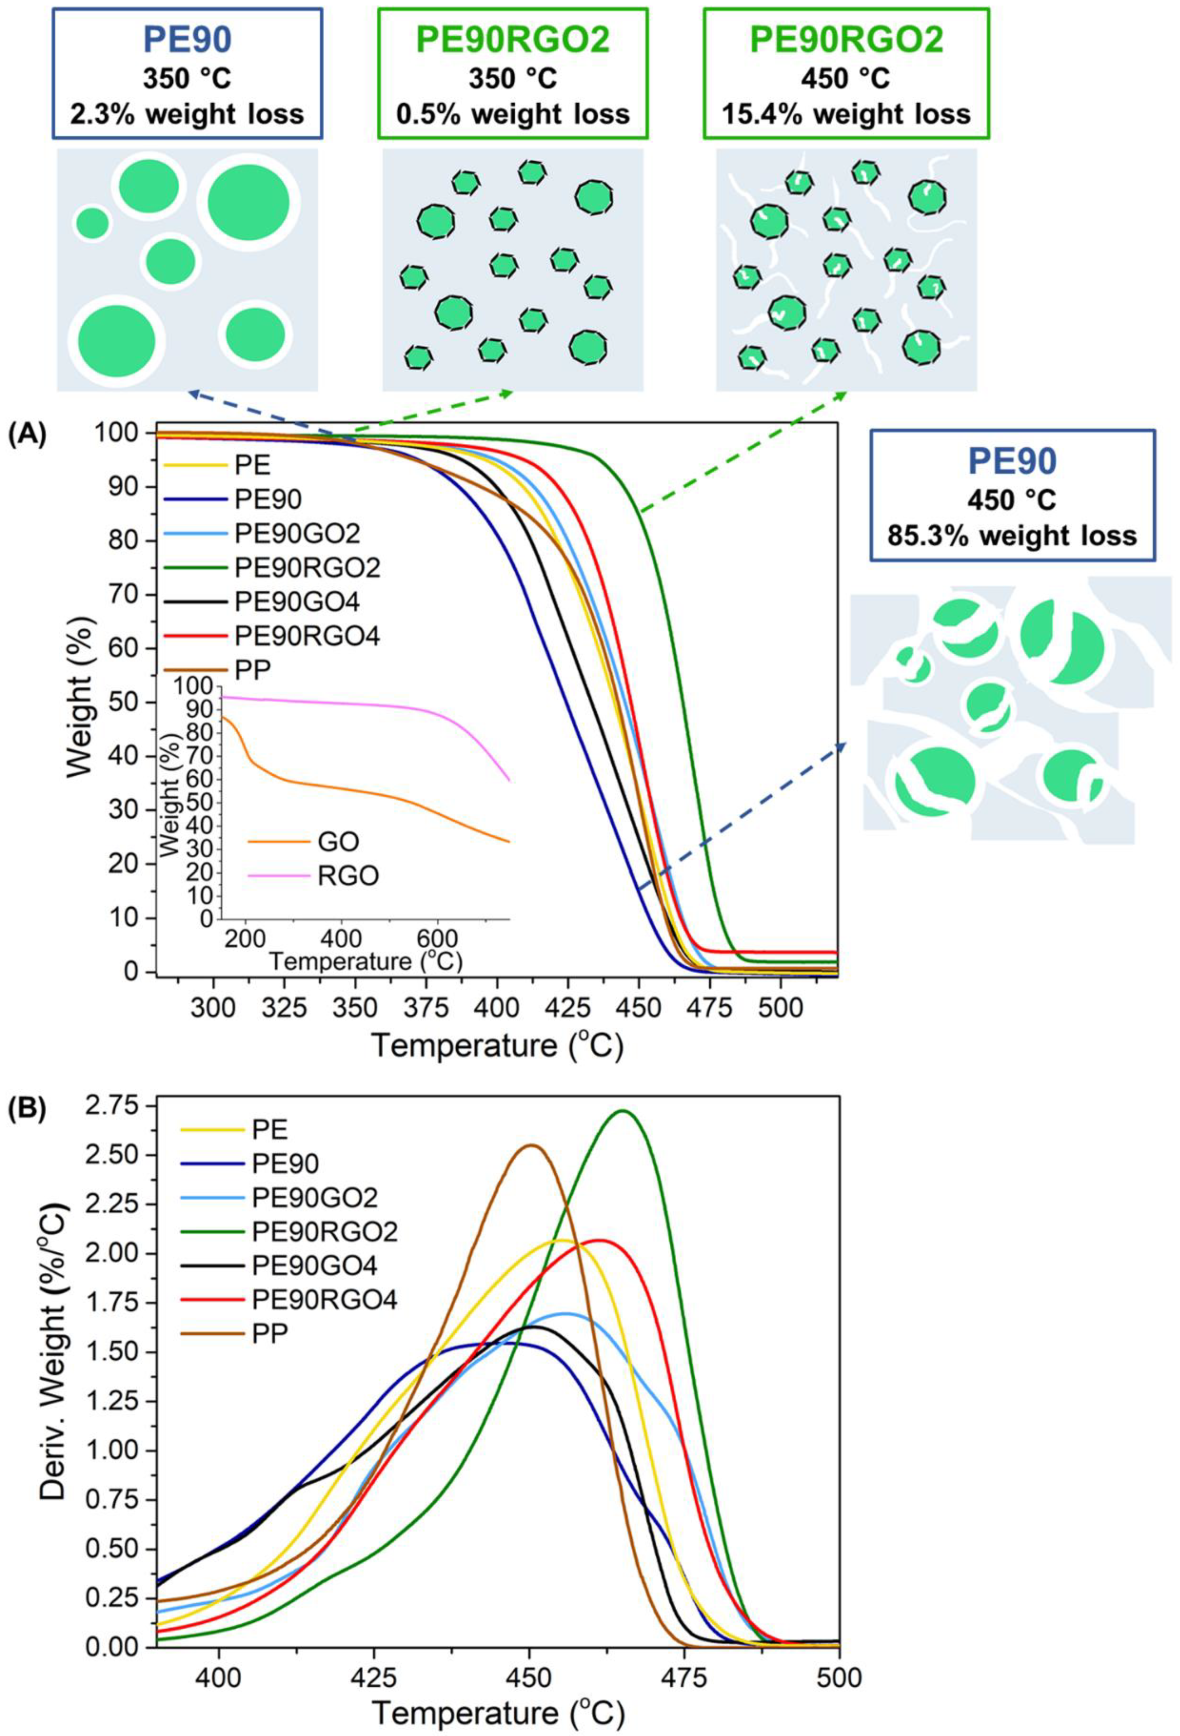
2.4. Thermal Gravimetric Analysis (TGA)
2.5. Heat Deformation Temperature (HDT) Characterization
2.6. Differential Scanning Calorimetry (DSC)
2.7. TEM
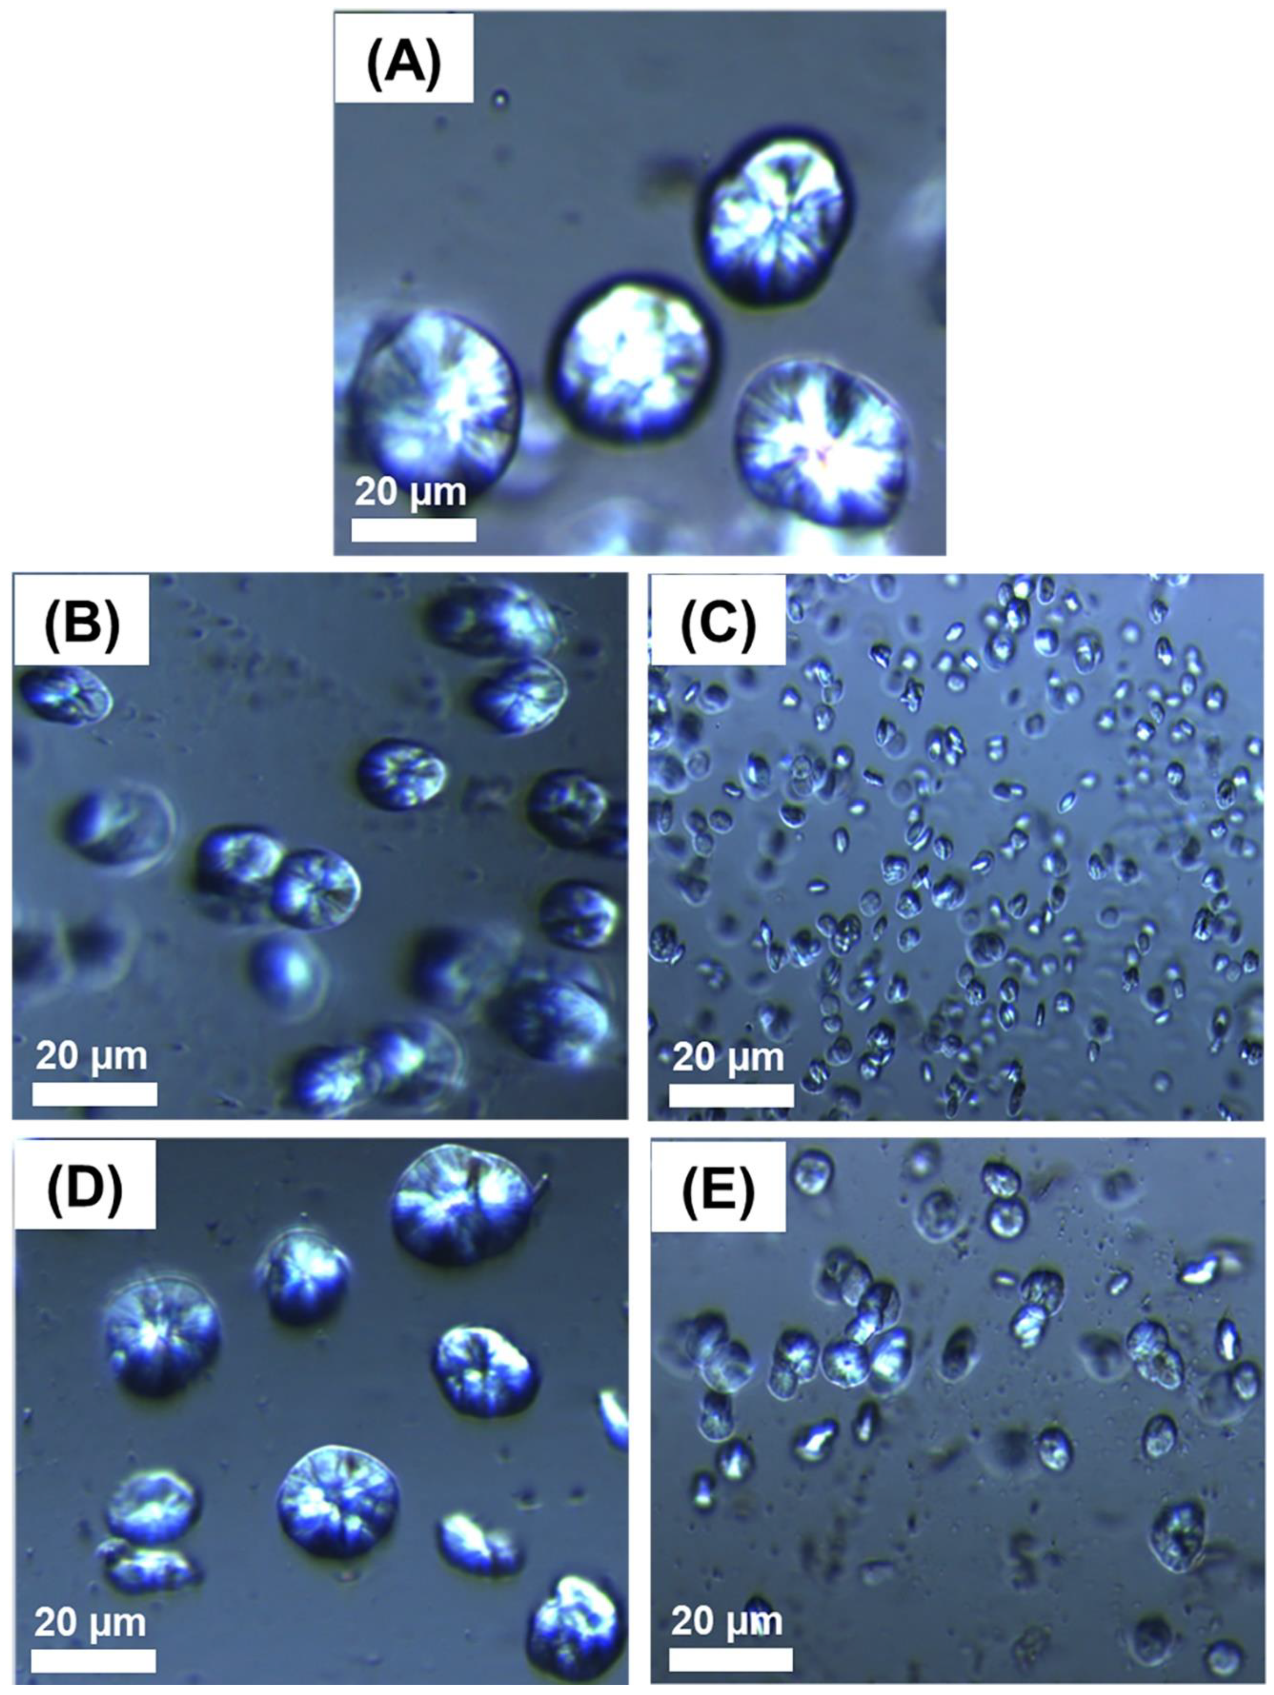
2.8. PLOM
3. Results and Discussion
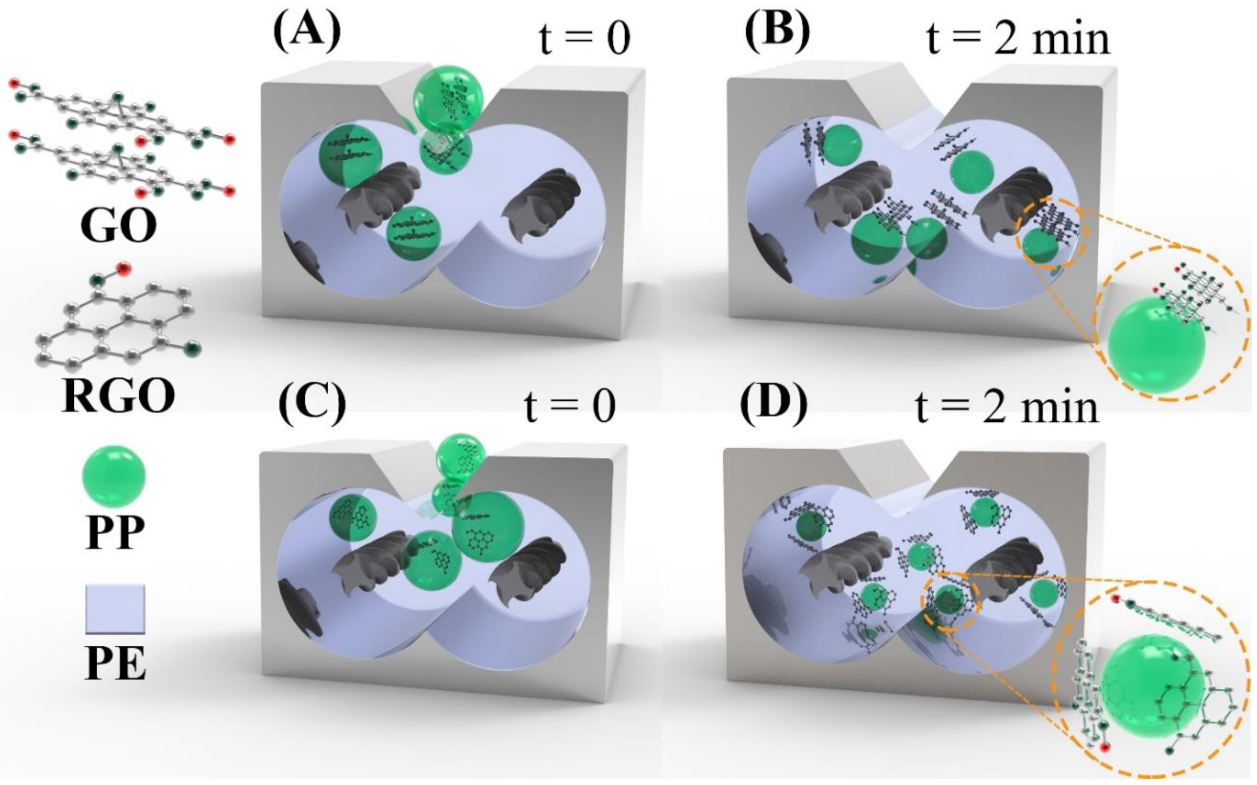
3.1. Schematic of RGO Synthesis and Morphological Configuration of Unfilled and Filled Binary Systems
3.2. Thermal Properties of Unfilled and Filled Binary Systems
3.3. PE Spherulitic Morphology
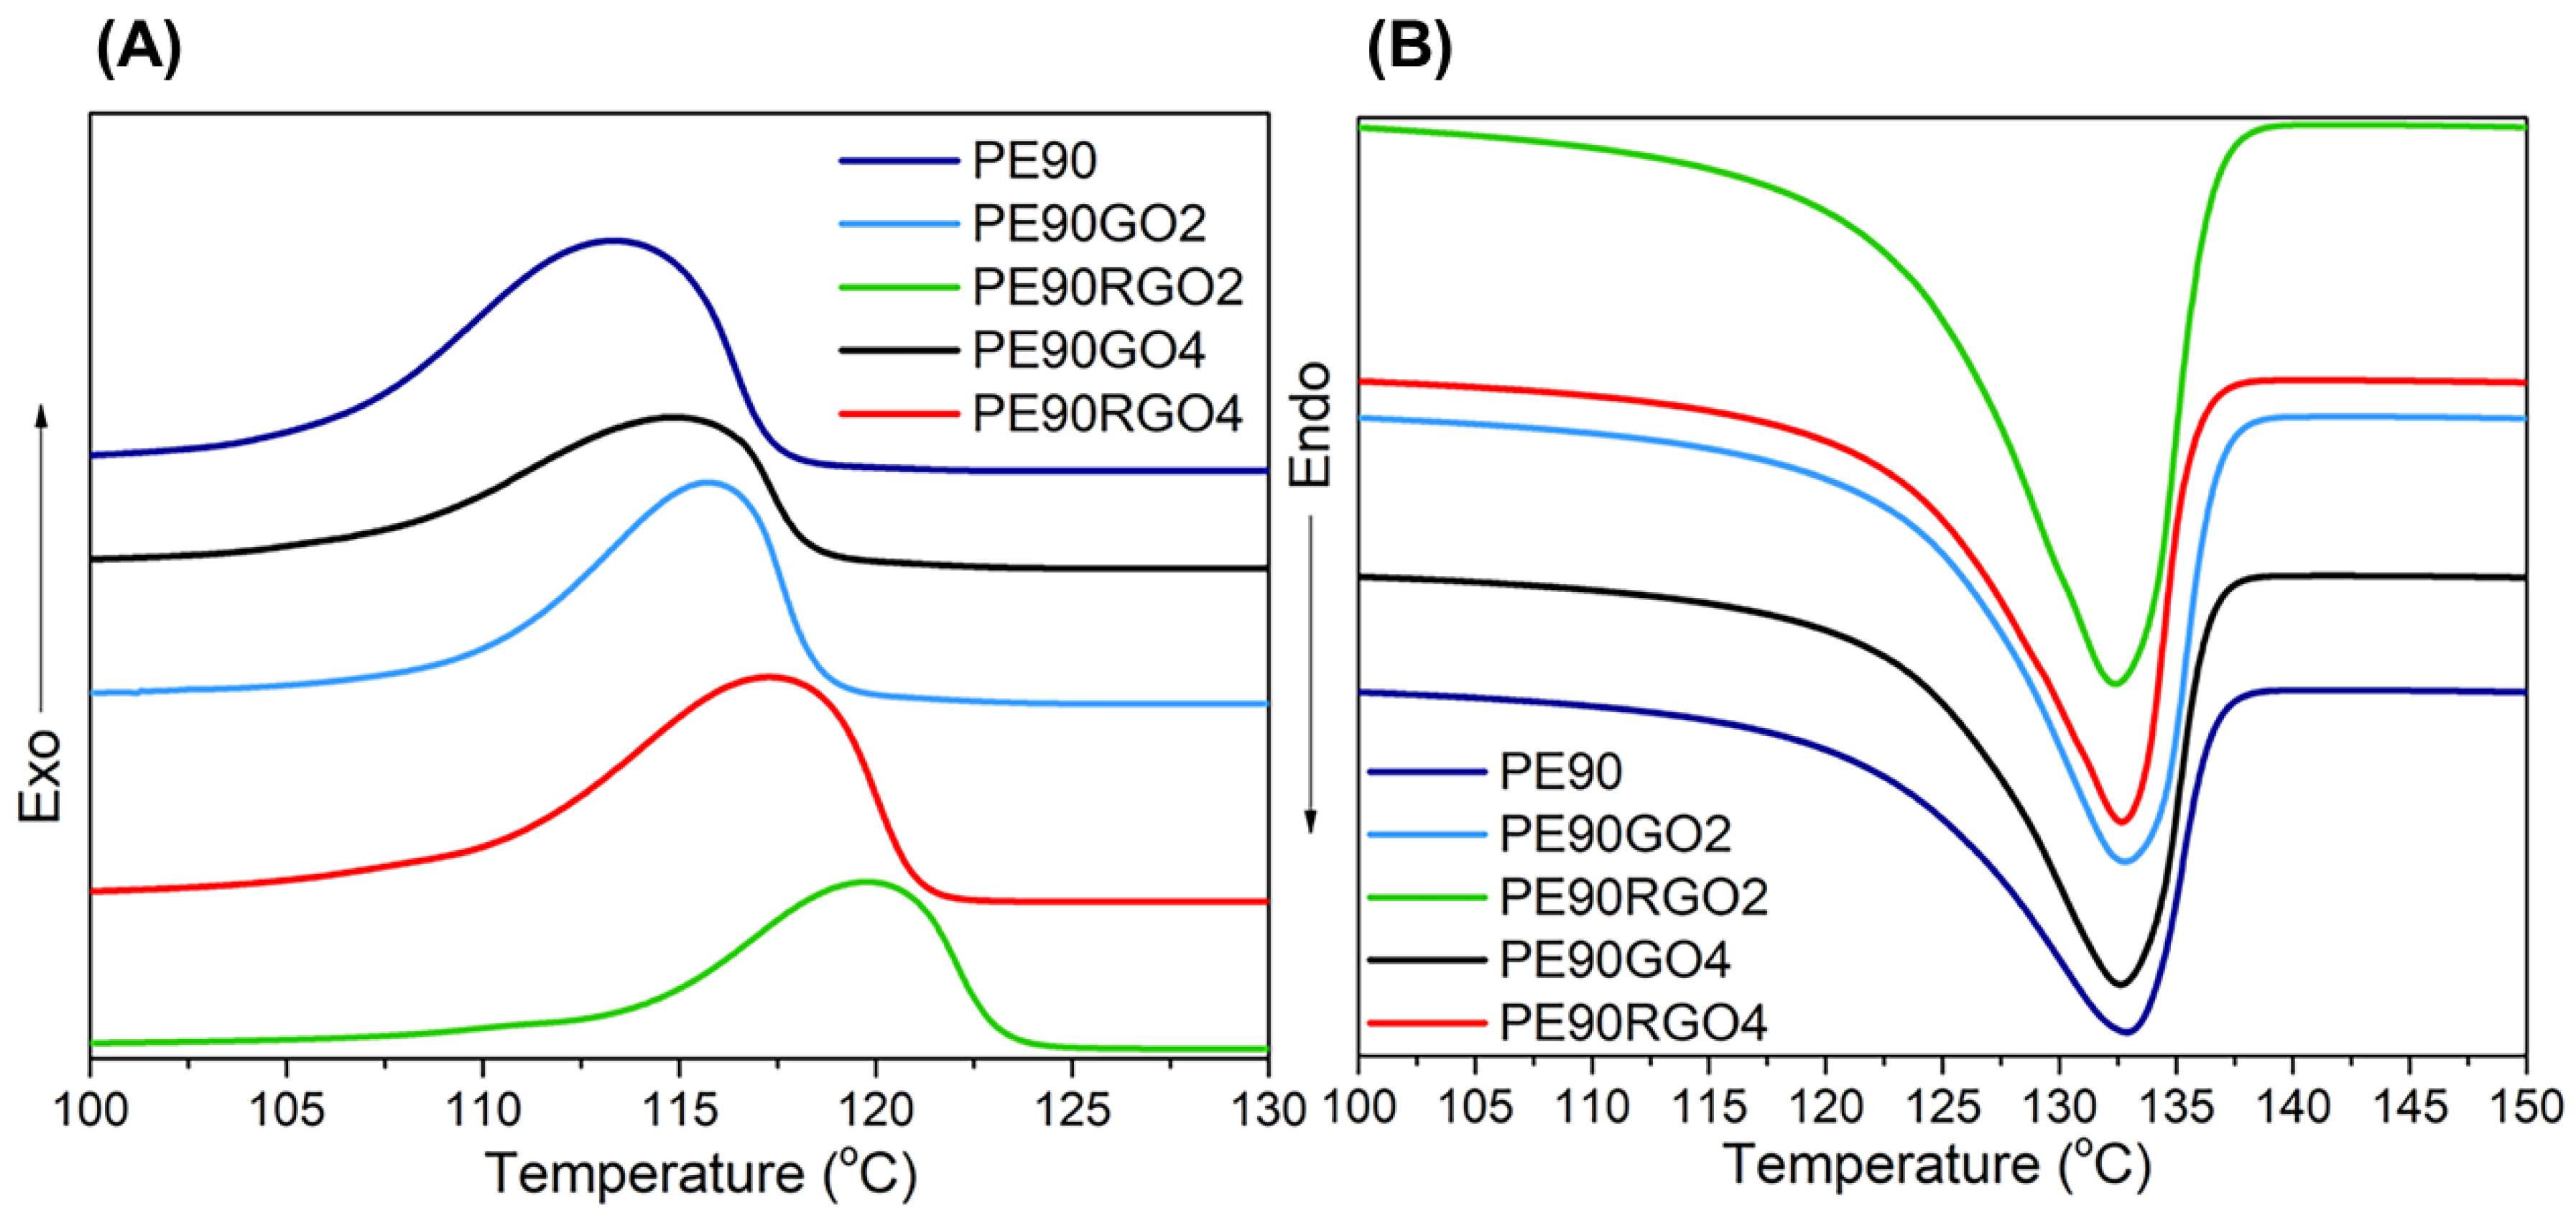
3.4. PE Thermal and Crystallization Behavior in Unfilled and Filled Binary Systems
4. Conclusions
Author Contributions
Funding
Acknowledgments
Conflicts of Interest
References
- Stuart, M.A.C.; Huck, W.T.S.; Genzer, J.; Müller, M.; Ober, C.; Stamm, M.; Sukhorukov, G.B.; Szleifer, I.; Tsukruk, V.V.; Urban, M.; et al. Emerging applications of stimuli-responsive polymer materials. Nat. Mater. 2010, 9, 101. [Google Scholar] [CrossRef] [PubMed]
- Utracki, L.A. History of commercial polymer alloys and blends (from a perspective of the patent literature). Polym. Eng. Sci. 1995, 35, 2–17. [Google Scholar] [CrossRef]
- Muthuraj, R.; Misra, M.; Mohanty, A.K. Biodegradable compatibilized polymer blends for packaging applications: A literature review. J. Appl. Polym. Sci. 2017, 135. [Google Scholar] [CrossRef] [Green Version]
- Jordan, A.M.; Kim, K.; Soetrisno, D.; Hannah, J.; Bates, F.S.; Ja, A.; Lhost, O.; Macosko, C.W. Role of crystallization on polyolefin interfaces: An improved outlook for polyolefin blends. Macromolecules 2014. [Google Scholar] [CrossRef]
- Kirchberger, A.; Münstedt, H. Droplet deformation under extensional flow in immiscible and partially miscible polymer blends based on poly(styrene-co-acrylonitrile). J. Rheol. 2010, 54, 687–704. [Google Scholar] [CrossRef]
- Graziano, A.; Processing, B. Review on Modification strategies of polyethylene/polypropylene immiscible thermoplastic polymer blends for enhancing their mechanical behavior. J. Elastomers Plastics 2018, 1–36. [Google Scholar] [CrossRef]
- Eagan, J.M.; Xu, J.; Di Girolamo, R.; Thurber, C.M.; Macosko, C.W.; LaPointe, A.M.; Bates, F.S.; Coates, G.W. Combining polyethylene and polypropylene: Enhanced performance with PE/ i PP multiblock polymers. Science (80-.) 2017, 355, 814–816. [Google Scholar] [CrossRef] [Green Version]
- Colbeaux, A.; Fenouillot, F.; Gerard, J.F.; Taha, M.; Wautier, H. Compatibilization of a polyolefin blend through covalent and ionic coupling of grafted polypropylene and polyethylene. II. Morphology. J. Appl. Polym. Sci. 2004, 93, 2237–2244. [Google Scholar] [CrossRef]
- Taguet, A.; Cassagnau, P.; Lopez-Cuesta, J.M. Structuration, selective dispersion and compatibilizing effect of (nano)fillers in polymer blends. Prog. Polym. Sci. 2014, 39, 1526–1563. [Google Scholar] [CrossRef]
- Al-Saleh, M.H. Carbon nanotube-filled polypropylene/polyethylene blends: compatibilization and electrical properties. Polym. Bull. 2016, 73, 975–987. [Google Scholar] [CrossRef]
- Hsieh, C.T.; Pan, Y.J.; Lin, J.H. Polypropylene/high-density polyethylene/carbon fiber composites: Manufacturing techniques, mechanical properties, and electromagnetic interference shielding effectiveness. Fibers Polym. 2017, 18, 155–161. [Google Scholar] [CrossRef]
- Ramanathan, T.; Abdala, A.A.; Stankovich, S.; Dikin, D.A.; Herrera-Alonso, M.; Piner, R.D.; Adamson, D.H.; Schniepp, H.C.; Chen, X.; Ruoff, R.S.; et al. Functionalized graphene sheets for polymer nanocomposites. Nat. Nanotechnol. 2008, 3, 327–331. [Google Scholar] [CrossRef] [PubMed]
- Hu, H.; Allan, C.C.K.; Li, J.; Kong, Y.; Wang, X.; Xin, J.H.; Hu, H. Multifunctional organically modified graphene with super-hydrophobicity. Nano Res. 2014, 7, 418–433. [Google Scholar] [CrossRef]
- Zhu, S.; Tang, S.; Zhang, J.; Yang, B. Control the size and surface chemistry of graphene for the rising fluorescent materials. Chem. Commun. 2012, 48, 4527–4539. [Google Scholar] [CrossRef] [PubMed]
- Tu, C.; Nagata, K.; Yan, S. Key factor of graphene localization on electrical conductive properties of graphene filled polyethylene/polypropylene composites during melt blending. J. Mater. Sci. Res. 2017, 6, 1–10. [Google Scholar] [CrossRef] [Green Version]
- Tu, C.; Nagata, K.; Yan, S. Influence of melt-mixing processing sequence on electrical conductivity of polyethylene/polypropylene blends filled with graphene. Polym. Bull. 2017, 74, 1237–1252. [Google Scholar] [CrossRef]
- Kissinger, H.E. Variation of peak temperature with heating rate in differential thermal analysis. J. Res. Natl. Bur. Stand. (1934) 2012, 57, 217. [Google Scholar] [CrossRef]
- Liu, T.; Mo, Z.; Wang, S. Nonisothermal melt and cold crystallization kinetics of poly ( Ary1 Ether Ether Ketone Ketone ). Polym. Eng. Sci. 1997, 37, 568–575. [Google Scholar] [CrossRef]
- Yao, F.; Wu, Q.; Lei, Y.; Guo, W.; Xu, Y. Thermal decomposition kinetics of natural fibers: Activation energy with dynamic thermogravimetric analysis. Polym. Degrad. Stab. 2008, 93, 90–98. [Google Scholar] [CrossRef]
- Clemons, C.M.; Sabo, R.C.; Kaland, M.L.; Hirth, K.C. Effects of silane on the properties of wood-plastic composites with polyethylene-polypropylene blends as matrices. J. Appl. Polym. Sci. 2011, 119, 1398–1409. [Google Scholar] [CrossRef] [Green Version]
- Kissinger, H.E. Reaction kinetics in differential thermal analysis. Anal. Chem. 1957, 29, 1702–1706. [Google Scholar] [CrossRef]
- Khanna, Y.P. A barometer of crystallization rates of polymeric materials. Polym. Eng. Sci. 1990, 30, 1615–1619. [Google Scholar] [CrossRef]
- Ren, P.G.; Yan, D.X.; Ji, X.; Chen, T.; Li, Z.M. Temperature dependence of grapheme oxide reduced by hydrazine hydrate. Nanotechnology 2011, 22. [Google Scholar] [CrossRef]
- Graziano, A.; Dias, O.A.T.; Garcia, C.; Jaffer, S.; Tjong, J.; Sain, M. Impact of Reduced Graphene Oxide on structure and properties of polyethylene rich binary systems for performance-based applications. Polymer (Guildf) 2020, 122622. [Google Scholar] [CrossRef]
- Haneef, M.; Saleem, H.; Habib, A. Use of graphene nanosheets and barium titanate as fillers in PMMA for dielectric applications. Synth. Met. 2017, 223, 101–106. [Google Scholar] [CrossRef]
- Inuwa, I.M.; Hassan, A.; Samsudin, S.A.; Mohamad Kassim, M.H.; Jawaid, M. Mechanical and thermal properties of exfoliated graphite nanoplatelets reinforced polyethylene terephthalate/polypropylene composites. Polym. Compos. 2014, 35, 2029–2035. [Google Scholar] [CrossRef]
- Fu, C.; Zhao, G.; Zhang, H.; Li, S. Evaluation and characterization of reduced graphene oxide nanosheets as anode materials for lithium-ion batteries. Int. J. Electrochem. Sci. 2013, 8, 6269–6280. [Google Scholar]
- Song, P.; Cao, Z.; Cai, Y.; Zhao, L.; Fang, Z.; Fu, S. Fabrication of exfoliated graphene-based polypropylene nanocomposites with enhanced mechanical and thermal properties. Polymer (Guildf) 2011, 52, 4001–4010. [Google Scholar] [CrossRef]
- Kim, H.S.; Lee, B.H.; Lee, S.; Kim, H.J.; Dorgan, J.R. Enhanced interfacial adhesion, mechanical, and thermal properties of natural flour-filled biodegradable polymer bio-composites. J. Therm. Anal. Calorim. 2011, 104, 331–338. [Google Scholar] [CrossRef]
- Li, M.; Jeong, Y.G. Poly(ethylene terephthalate)/exfoliated graphite nanocomposites with improved thermal stability, mechanical and electrical properties. Compos. Part A Appl. Sci. Manuf. 2011, 42, 560–566. [Google Scholar] [CrossRef]
- Laoutid, F.; Estrada, E.; Michell, R.M.; Bonnaud, L.; Müller, A.J.; Dubois, P. The influence of nanosilica on the nucleation, crystallization and tensile properties of PP-PC and PP-PA blends. Polymer (Guildf) 2013, 54, 3982–3993. [Google Scholar] [CrossRef]
- Chen, H.L. Miscibility and crystallization behavior of poly(ethylene terephthalate)/poly(ether imide) blends. Macromolecules 1995, 28, 2845–2851. [Google Scholar] [CrossRef]
- Gopakumar, T.G.; Lee, J.A.; Kontopoulou, M.; Parent, J.S. Influence of clay exfoliation on the physical properties of montmorillonite/polyethylene composites. Polymer (Guildf) 2002, 43, 5483–5491. [Google Scholar] [CrossRef]
- Kim, S.H.; Ahn, S.H.; Hirai, T. Crystallization kinetics and nucleation activity of silica nanoparticle-filled poly(ethylene 2,6-naphthalate). Polymer (Guildf) 2003, 44, 5625–5634. [Google Scholar] [CrossRef]
- Heeley, E.L.; Hughes, D.J.; El, Y.; Taylor, P.G.; Bassindale, A.R. Morphology and crystallization kinetics of polyethylene/long alkyl-chain substituted Polyhedral Oligomeric Silsesquioxanes ( POSS ) nanocomposite blends: A SAXS/WAXS study. Eur. Polym. J. 2014, 51, 45–56. [Google Scholar] [CrossRef] [Green Version]
- Amoroso, L.; Heeley, E.L.; Nishal, S.; Mcnally, T. Crystallisation behaviour of composites of HDPE and MWCNTs: The effect of nanotube dispersion, orientation and polymer deformation. Polymer (Guildf) 2020, 201, 122587. [Google Scholar] [CrossRef]
- Abareshi, M.; Zebarjad, S.M.; Goharshadi, E.K. Non-isothermal crystallization kinetics of polyethylene-clay nanocomposites prepared by high-energy ball milling. Bull. Mater. Sci. 2014, 37, 1113–1121. [Google Scholar] [CrossRef] [Green Version]
- Li, X.; Guo, W.; Zhou, Q.; Xu, S.; Wu, C. Non-isothermal crystallization kinetics of poly (ethylene terephthalate)/grafted carbon black composite. Polym. Bull. 2007, 59, 685–697. [Google Scholar] [CrossRef]
- Fan, Q.; Duan, F.; Guo, H.; Wu, T. Non-isothermal crystallization kinetics of polypropylene and hyperbranched polyester blends. Chin. J. Chem. Eng. 2015, 23, 441–445. [Google Scholar] [CrossRef]
- Chen, Y.; Zou, H.; Liang, M.; Cao, Y. Melting and crystallization behavior of partially miscible high density polyethylene/ethylene vinyl acetate copolymer (HDPE/EVA) blends. Thermochim. Acta 2014, 586, 1–8. [Google Scholar] [CrossRef]
- Lan, Y.; Liu, H.; Cao, X.; Zhao, S.; Dai, K.; Yan, X.; Zheng, G.; Liu, C.; Shen, C.; Guo, Z. Electrically conductive thermoplastic polyurethane/polypropylene nanocomposites with selectively distributed graphene. Polymer (United Kingdom) 2016, 97, 11–19. [Google Scholar] [CrossRef]


| Denotations | HDPE (wt %) | iPP (wt %) | GO (wt %) | RGO (wt %) |
|---|---|---|---|---|
| PE90 | 90 | 10 | 0 | 0 |
| PE90GO2 | 88.2 | 9.8 | 2 | 0 |
| PE90RGO2 | 88.2 | 9.8 | 0 | 2 |
| PE90GO4 | 86.4 | 9.6 | 4 | 0 |
| PE90RGO4 | 86.4 | 9.6 | 0 | 4 |
| Td99 (°C) | Td50 (°C) | Td10 (°C) | Tdmax (°C) | ET (KJ/mol) | HDT (°C) | |
|---|---|---|---|---|---|---|
| PE | 340 (±1.6) | 442 (±1.4) | 463 (±1.4) | 455 (±1.5) | 159.4 (±0.6) | 48.6 (±0.5) |
| PE90 | 301 (±1.4) | 422 (±1.7) | 456 (±1.1) | 443 (±1.2) | 124.2 (±0.9) | 47.2 (±0.4) |
| PE90GO2 | 334 (±1.1) | 451 (±1.3) | 465 (±1.2) | 457 (±1.4) | 162.1 (±1.1) | 57.3 (±0.5) |
| PE90RGO2 | 359 (±1.2) | 462 (±1.2) | 487 (±1.3) | 467 (±1.1) | 238.7 (±0.7) | 66.7 (±0.3) |
| PE90GO4 | 326 (±1.2) | 435 (±1.1) | 456 (±1.2) | 451 (±1.4) | 153.6 (±0.8) | 52.4 (±0.4) |
| PE90RGO4 | 335 (±1.4) | 456 (±1.1) | 466 (±1.1) | 462 (±1.3) | 196.8 (±0.6) | 59.9 (±0.4) |
| PP | 339 (±1.3) | 441 (±1.2) | 457 (±1.4) | 450 (±1.3) | 157.1 (±0.8) | 70.8 (±0.3) |
| Tc (°C) | Tm (°C) | ΔT (°C) | tc (min) | Xc (%) | |
|---|---|---|---|---|---|
| PE90 | 113.4 (±1.4) | 132.6 (±0.6) | 19.2 (±0.6) | 0.53 (±0.04) | 62.1 (±0.8) |
| PE90GO2 | 116.3 (±1.1) | 132.4 (±0.6) | 16.1 (±0.4) | 0.40 (±0.01) | 64.8 (±0.9) |
| PE90RGO2 | 120.6 (±2.6) | 132.2 (±0.8) | 11.6 (±0.4) | 0.29 (±0.06) | 74.3 (±1.1) |
| PE90GO4 | 114.9 (±1.1) | 132.5 (±0.5) | 17.6 (±0.5) | 0.45 (±0.02) | 62.9 (±0.9) |
| PE90RGO4 | 117.8 (±1.2) | 132.3 (±0.7) | 14.5 (±0.5) | 0.38 (±0.02) | 66.3 (±0.7) |
| Ec (KJ/mol) | F(T) | CRC (min−1) | |
|---|---|---|---|
| PE90 | 283.5 (±1.2) | 4.4 (±0.03) | 2.97 (±0.04) |
| PE90GO2 | 269.8 (±0.9) | 2.6 (±0.02) | 3.25 (±0.03) |
| PE90RGO2 | 201.7 (±1.1) | 1.3 (±0.02) | 3.74 (±0.04) |
| PE90GO4 | 276.4 (±1.2) | 3.1 (±0.04) | 3.12 (±0.02) |
| PE90RGO4 | 216.1 (±0.8) | 2.2 (±0.03) | 3.61 (±0.02) |
© 2020 by the authors. Licensee MDPI, Basel, Switzerland. This article is an open access article distributed under the terms and conditions of the Creative Commons Attribution (CC BY) license (http://creativecommons.org/licenses/by/4.0/).
Share and Cite
Graziano, A.; Titton Dias, O.A.; Garcia, C.; Jaffer, S.; Tjong, J.; Sain, M. Non-Isothermal Crystallization Behavior and Thermal Properties of Polyethylene Tuned by Polypropylene and Reinforced with Reduced Graphene Oxide. Nanomaterials 2020, 10, 1428. https://doi.org/10.3390/nano10081428
Graziano A, Titton Dias OA, Garcia C, Jaffer S, Tjong J, Sain M. Non-Isothermal Crystallization Behavior and Thermal Properties of Polyethylene Tuned by Polypropylene and Reinforced with Reduced Graphene Oxide. Nanomaterials. 2020; 10(8):1428. https://doi.org/10.3390/nano10081428
Chicago/Turabian StyleGraziano, Antimo, Otavio Augusto Titton Dias, Christian Garcia, Shaffiq Jaffer, Jimi Tjong, and Mohini Sain. 2020. "Non-Isothermal Crystallization Behavior and Thermal Properties of Polyethylene Tuned by Polypropylene and Reinforced with Reduced Graphene Oxide" Nanomaterials 10, no. 8: 1428. https://doi.org/10.3390/nano10081428
APA StyleGraziano, A., Titton Dias, O. A., Garcia, C., Jaffer, S., Tjong, J., & Sain, M. (2020). Non-Isothermal Crystallization Behavior and Thermal Properties of Polyethylene Tuned by Polypropylene and Reinforced with Reduced Graphene Oxide. Nanomaterials, 10(8), 1428. https://doi.org/10.3390/nano10081428