Lattice Rayleigh Anomaly Associated Enhancement of NH and CH Stretching Modes on Gold Metasurfaces for Overtone Detection


Abstract
1. Introduction
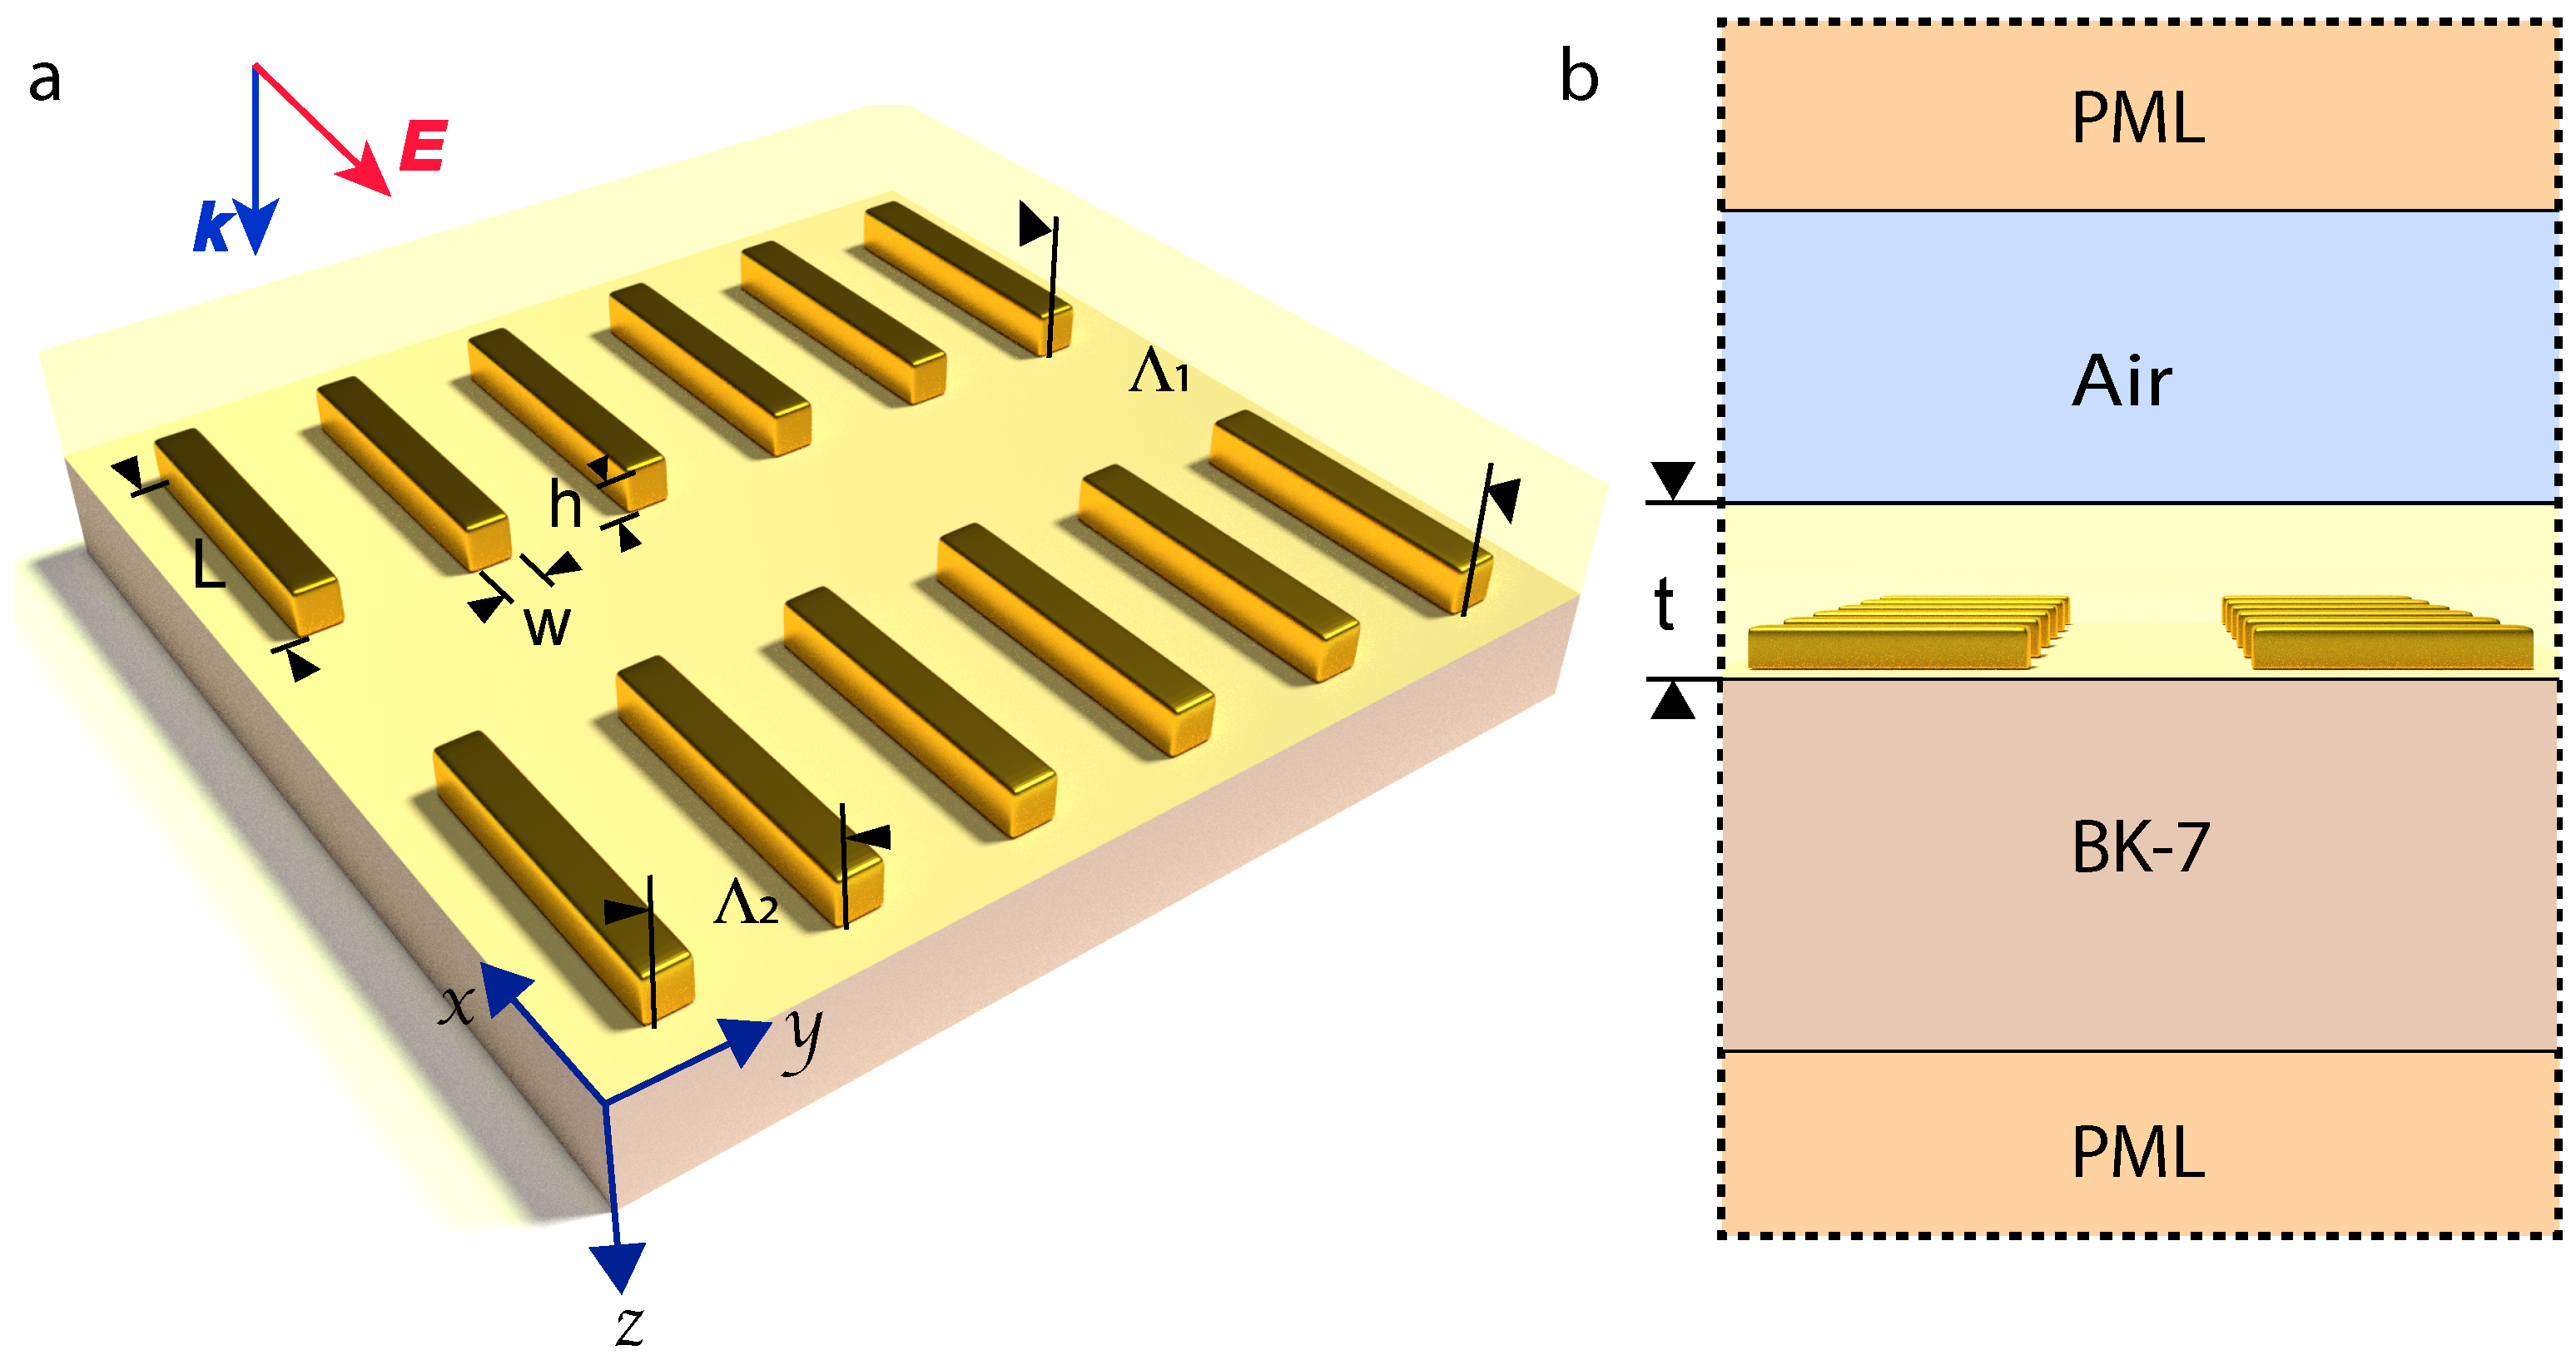
2. Numerical Model
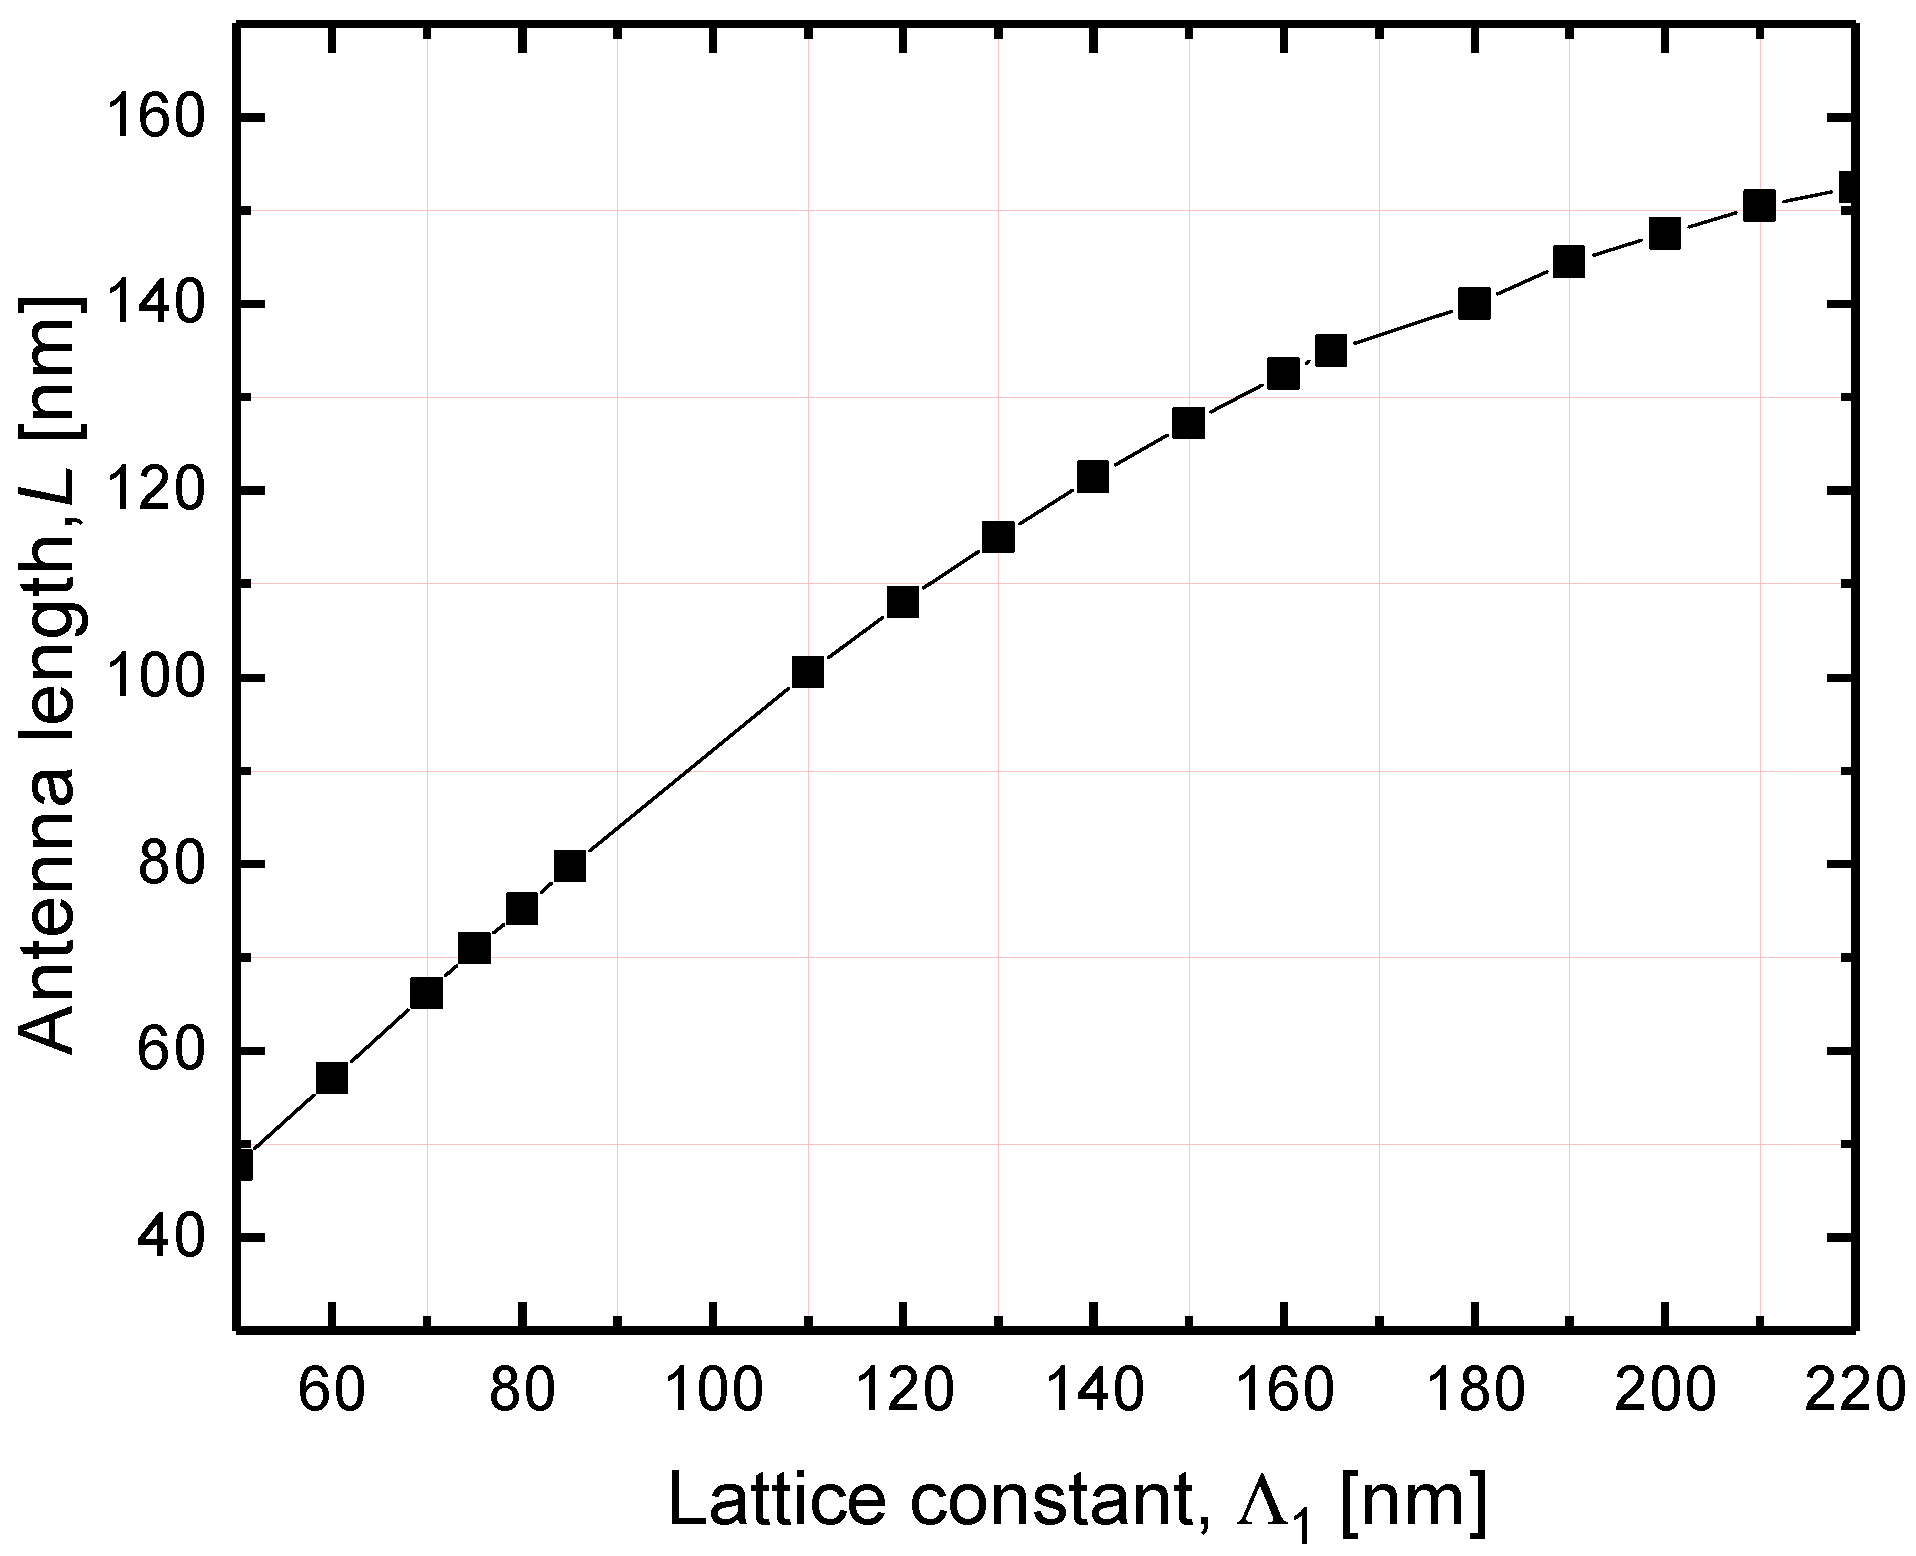
3. Optimization of the Metasurface
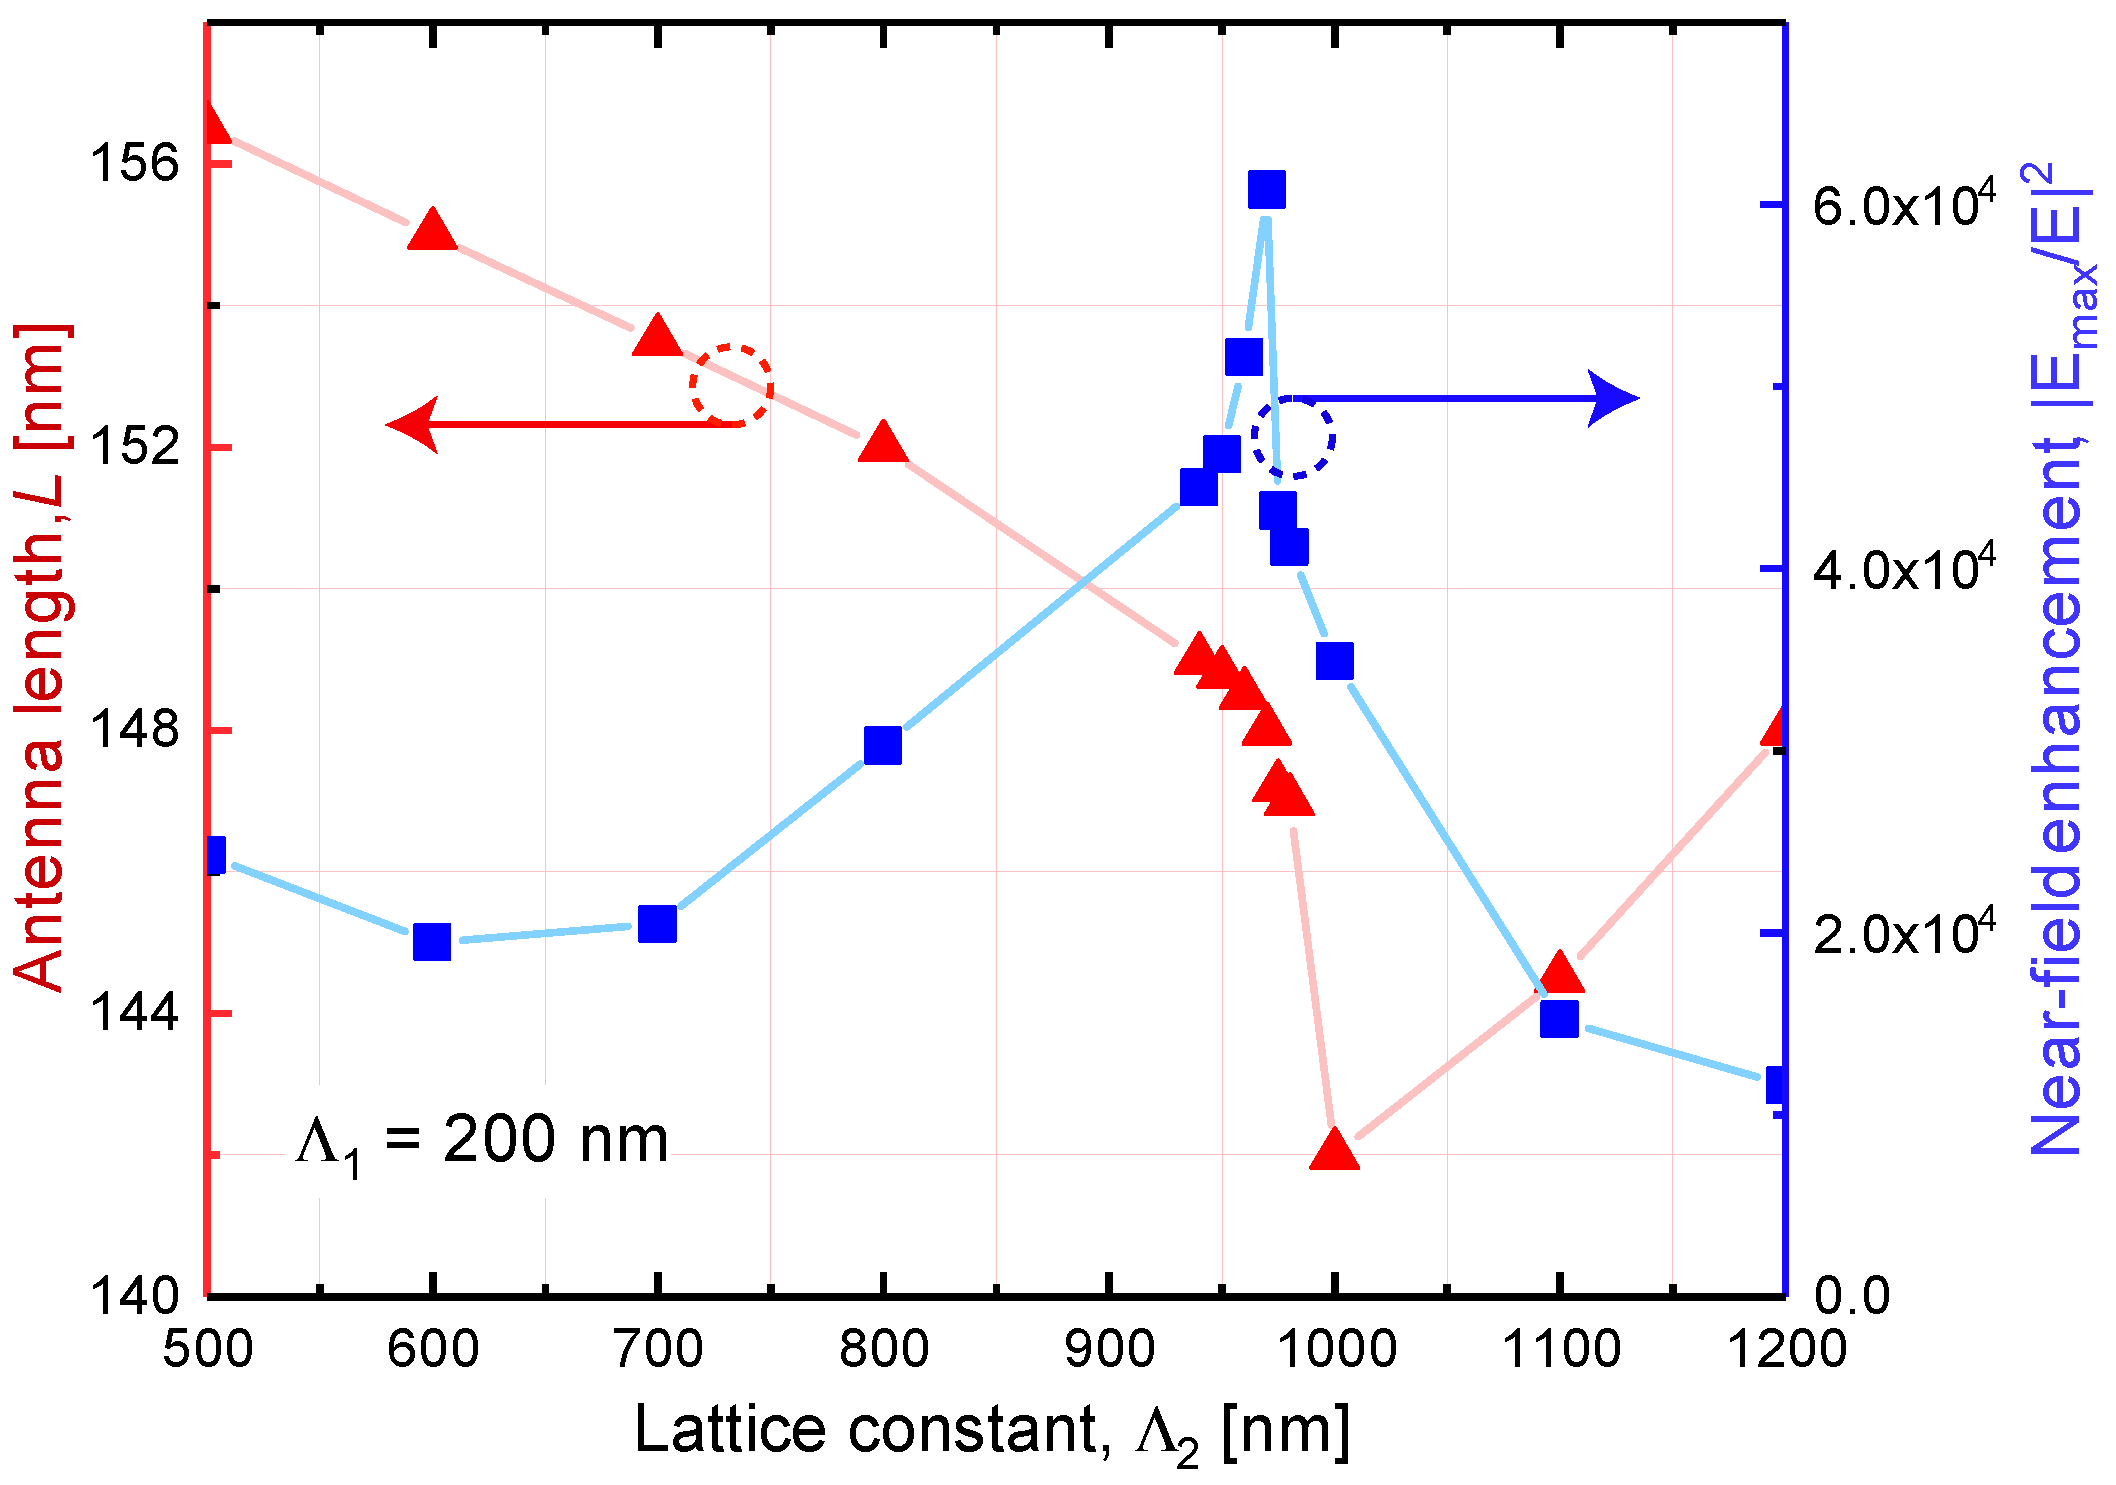
4. Dependence of the Collective LSPR Spectral Position on the Gold Metasurface Parameters
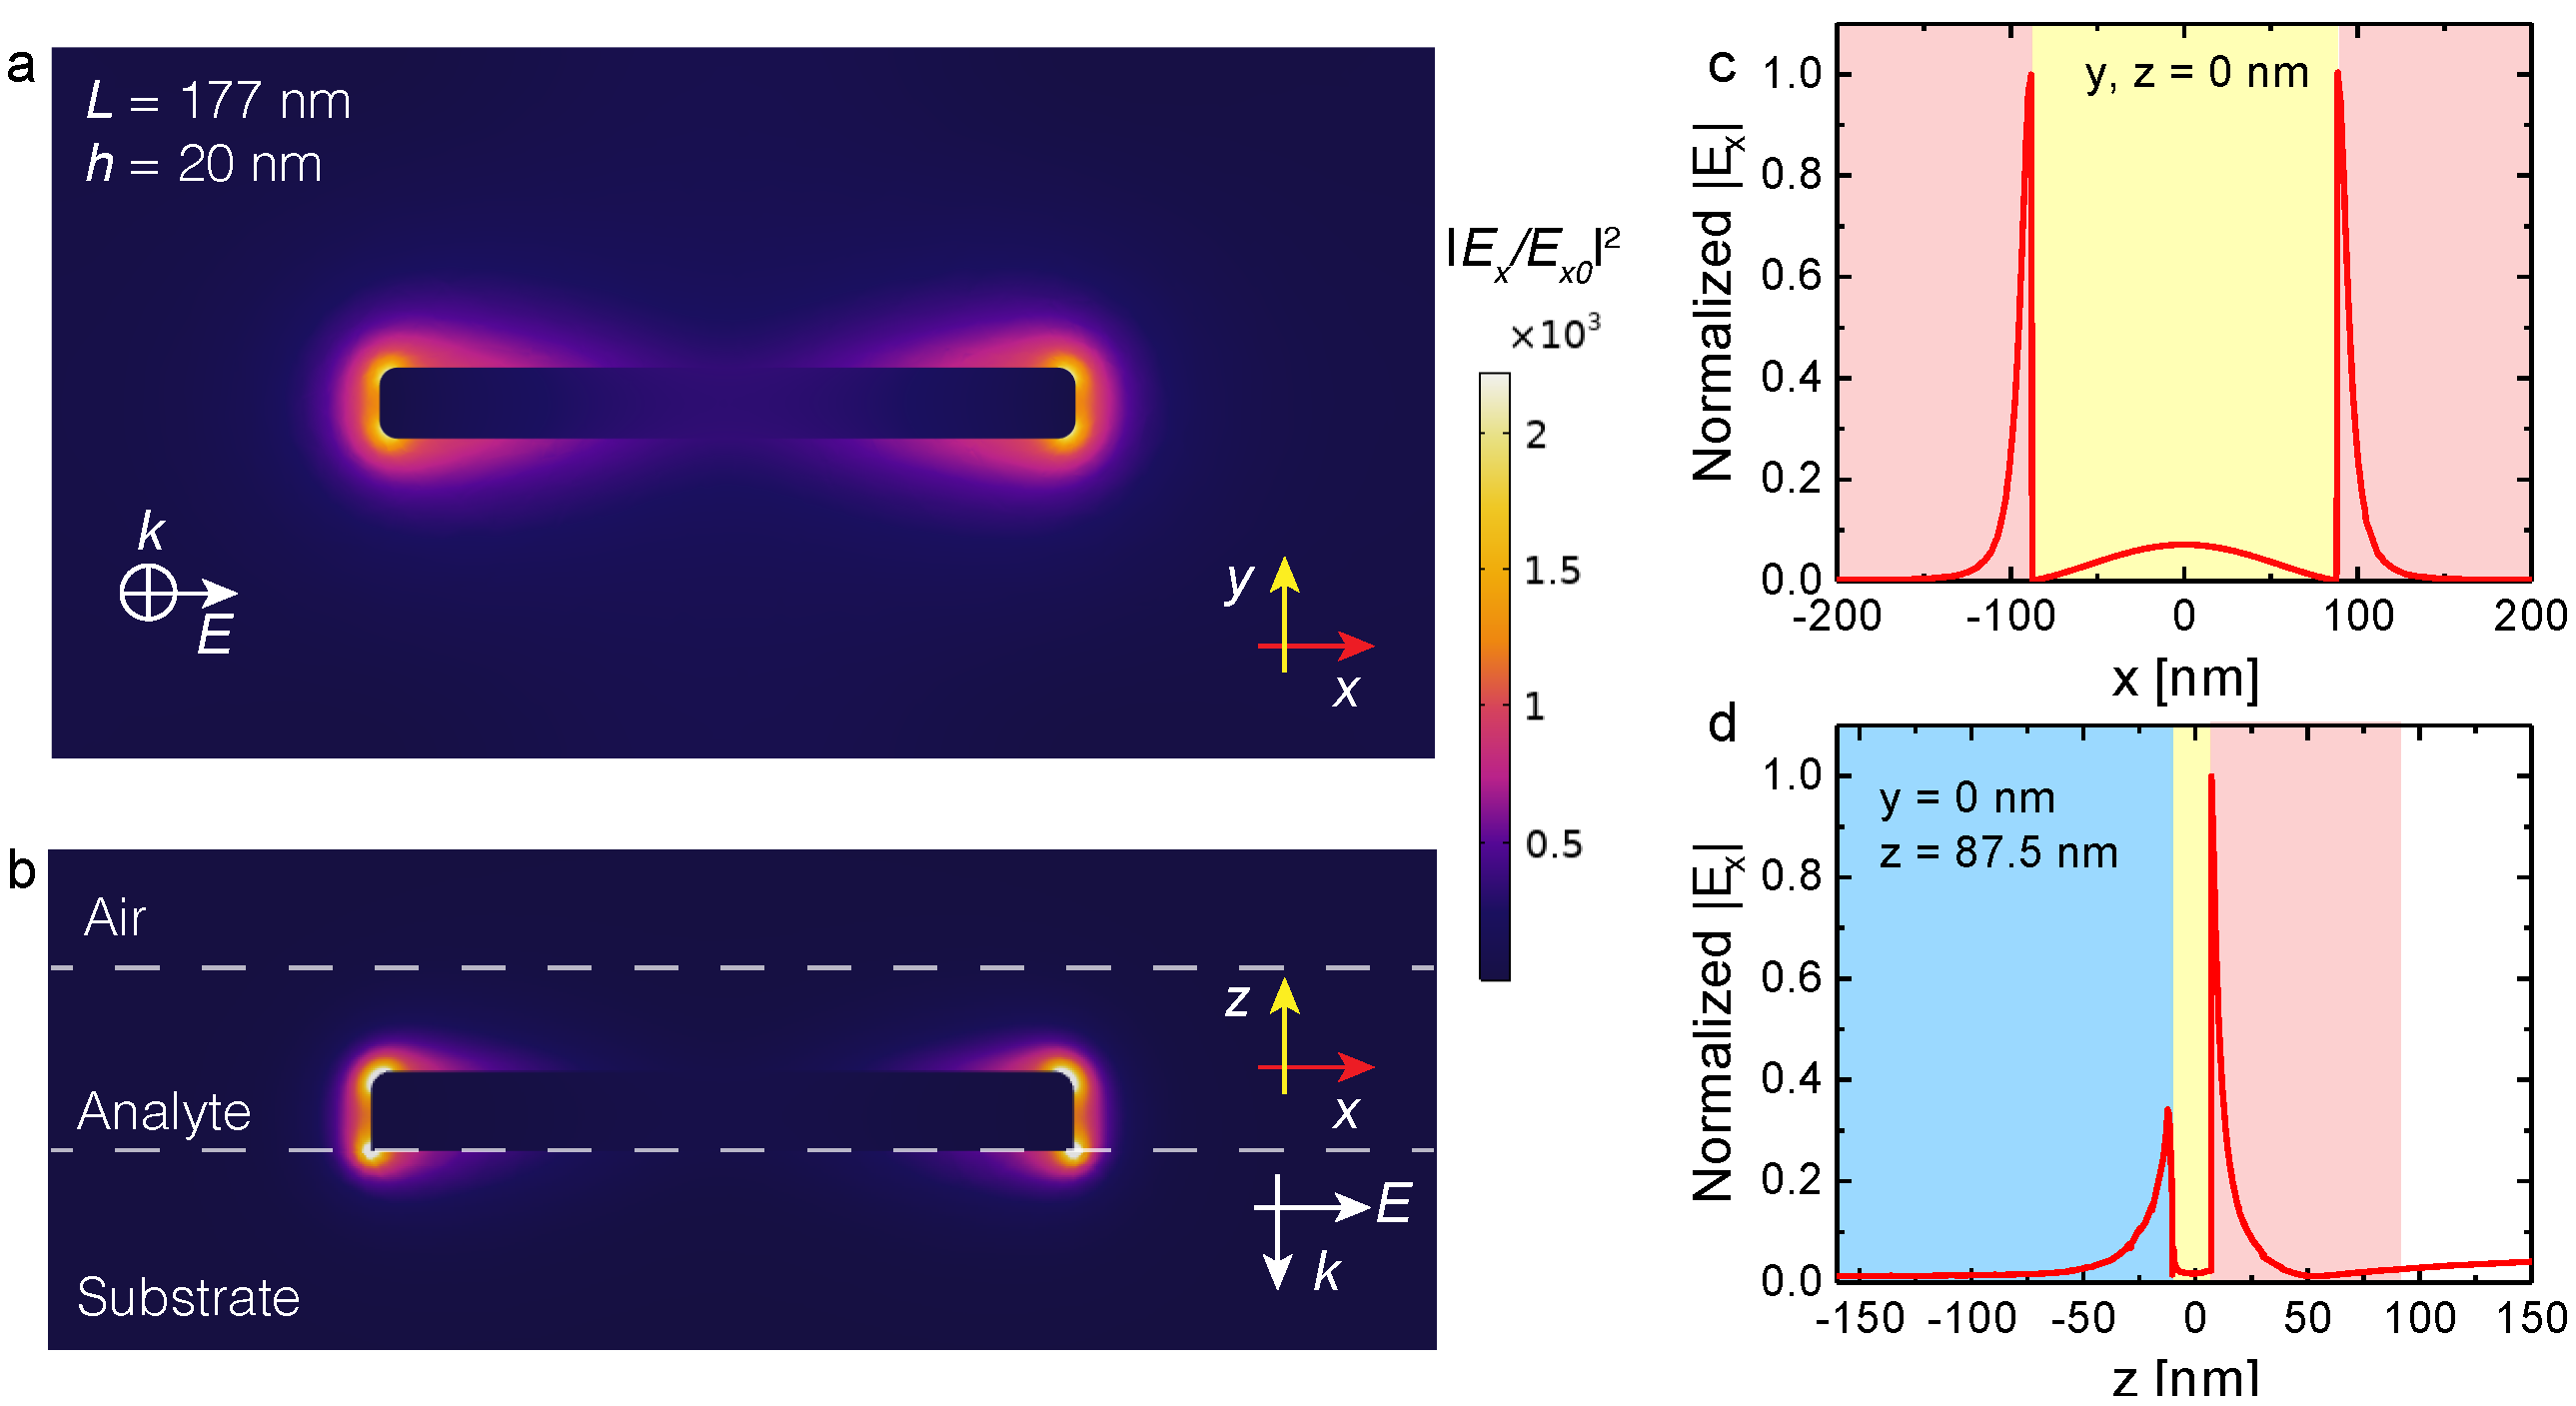
5. Near-Field Enhancement
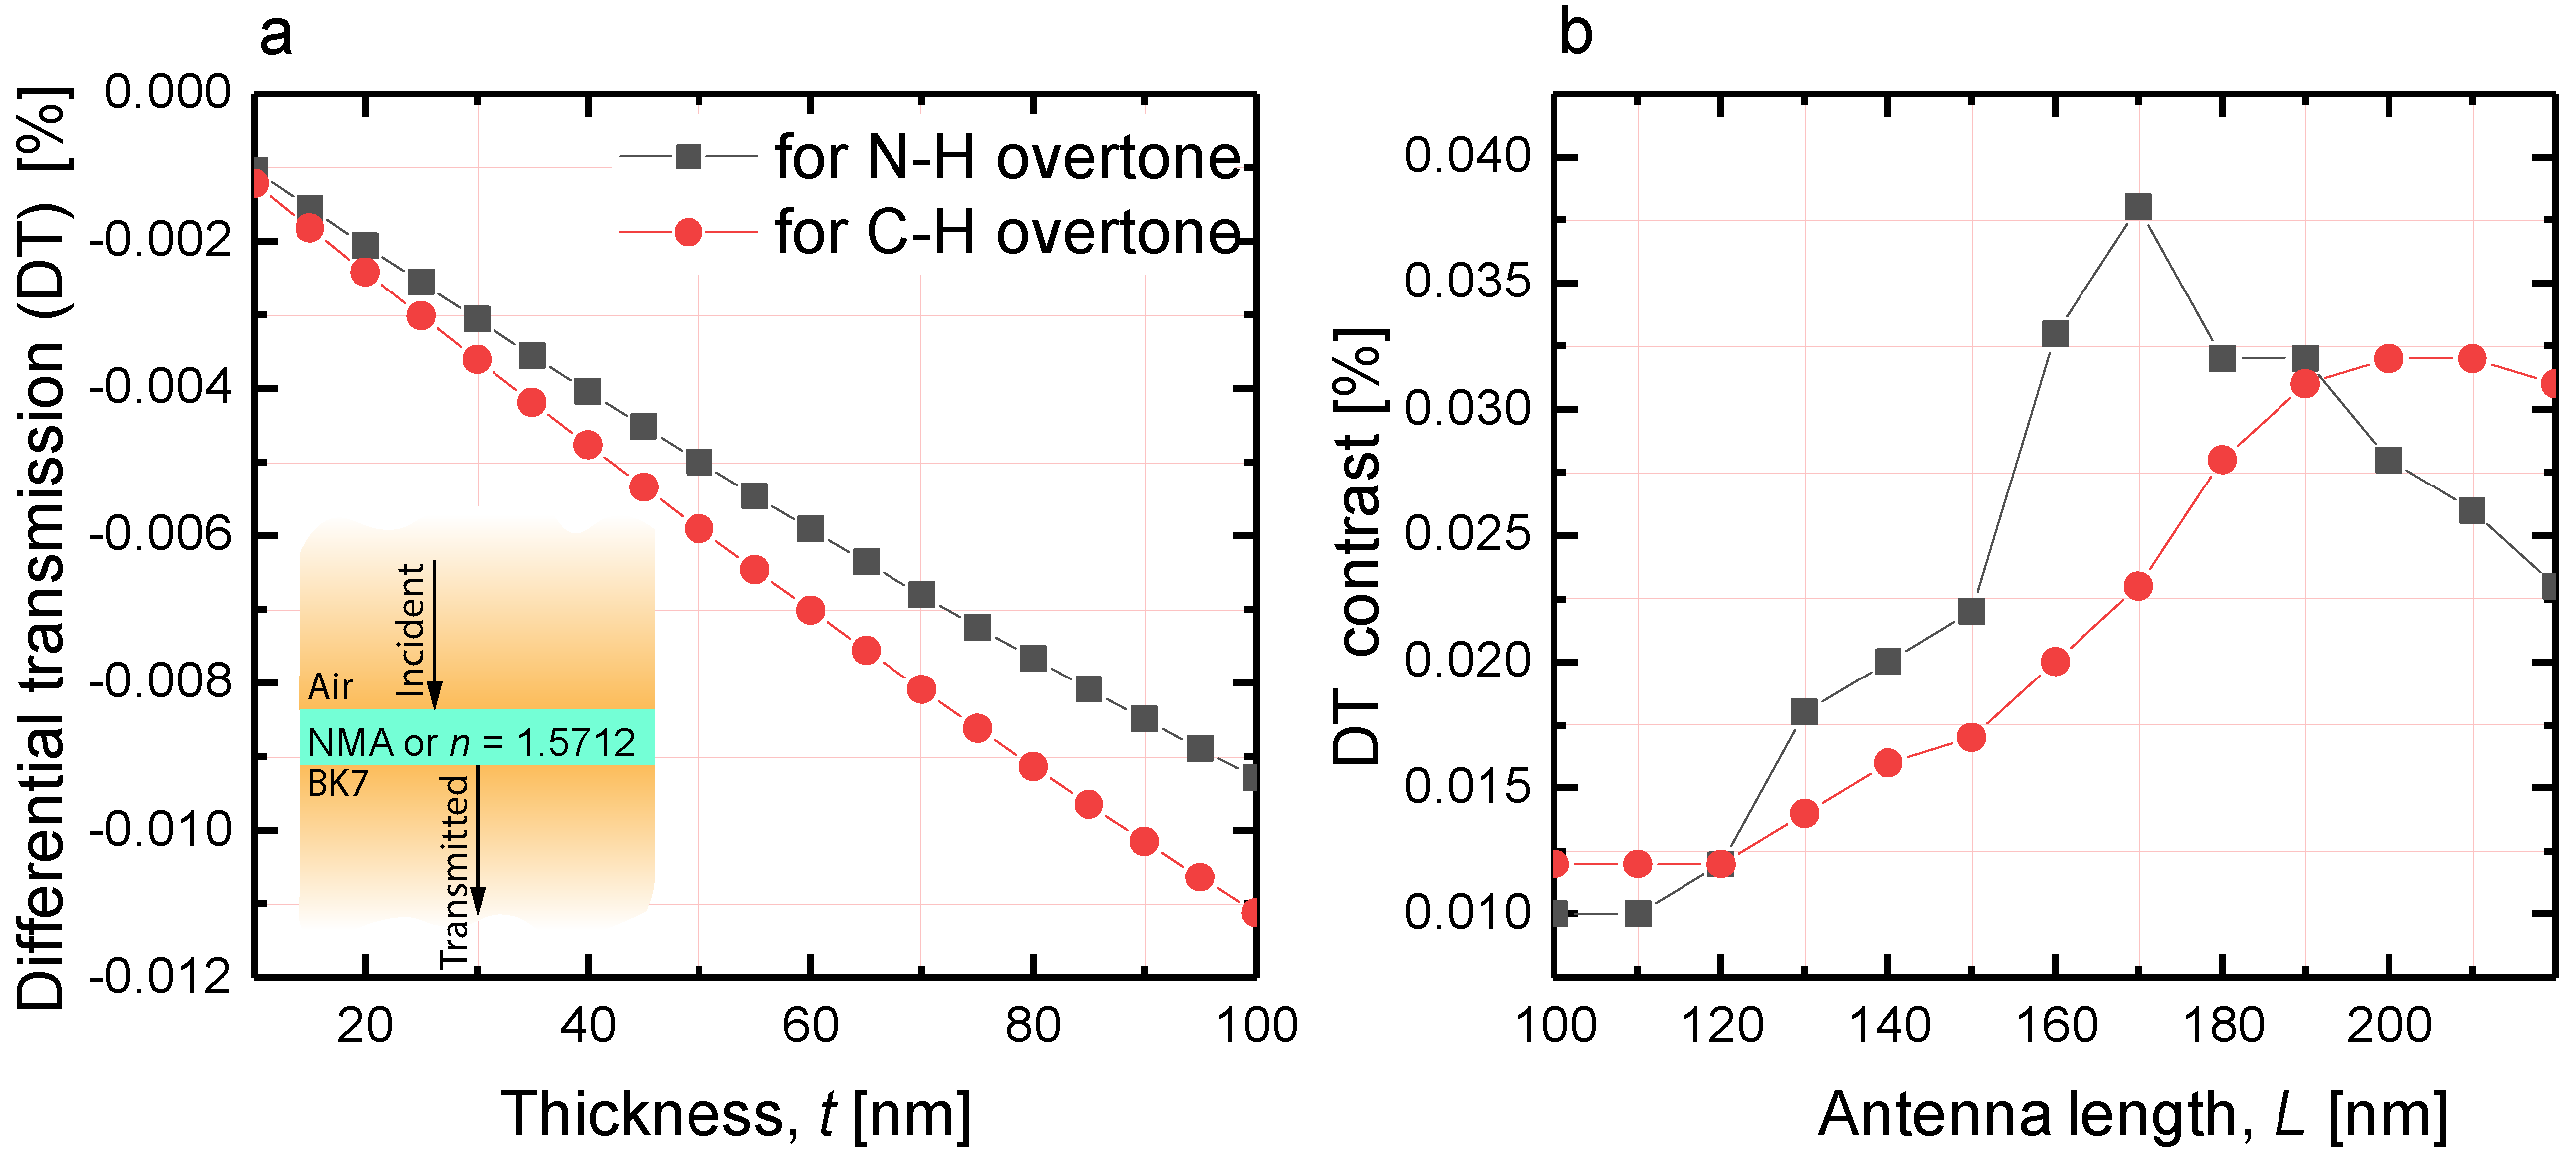
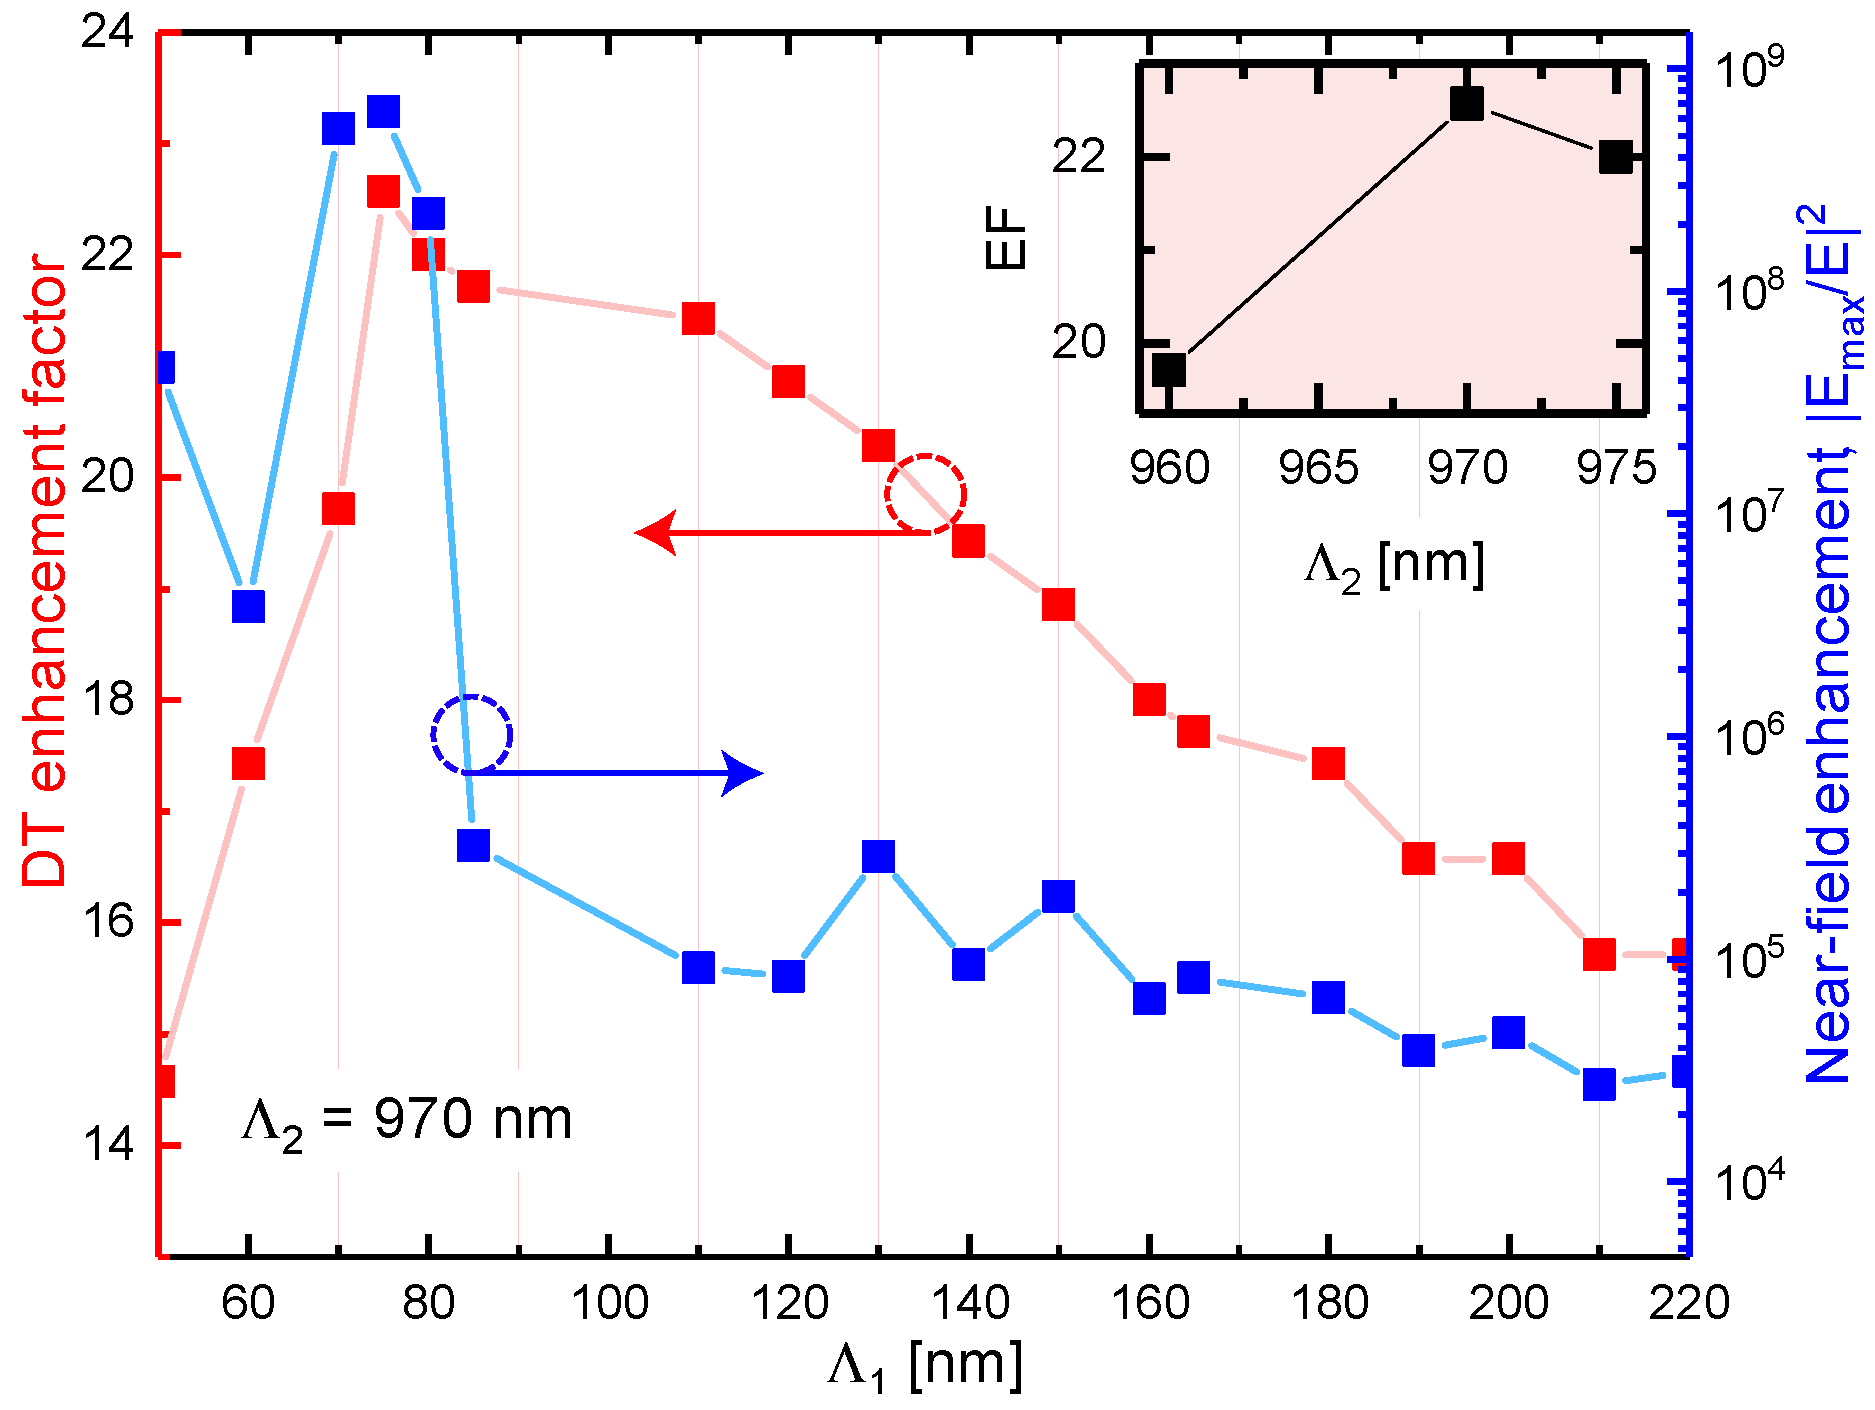
6. Differential Transmission Computations
7. Enhancement Factors of the Optimized Metasurfaces
8. Conclusions
Author Contributions
Funding
Acknowledgments
Conflicts of Interest
Abbreviations
| NIR | Near-infrared |
| LSPR | Localized surface plasmon resonance |
| EBL | Electron beam lithography |
| NPs | Nanoparallelepipeds |
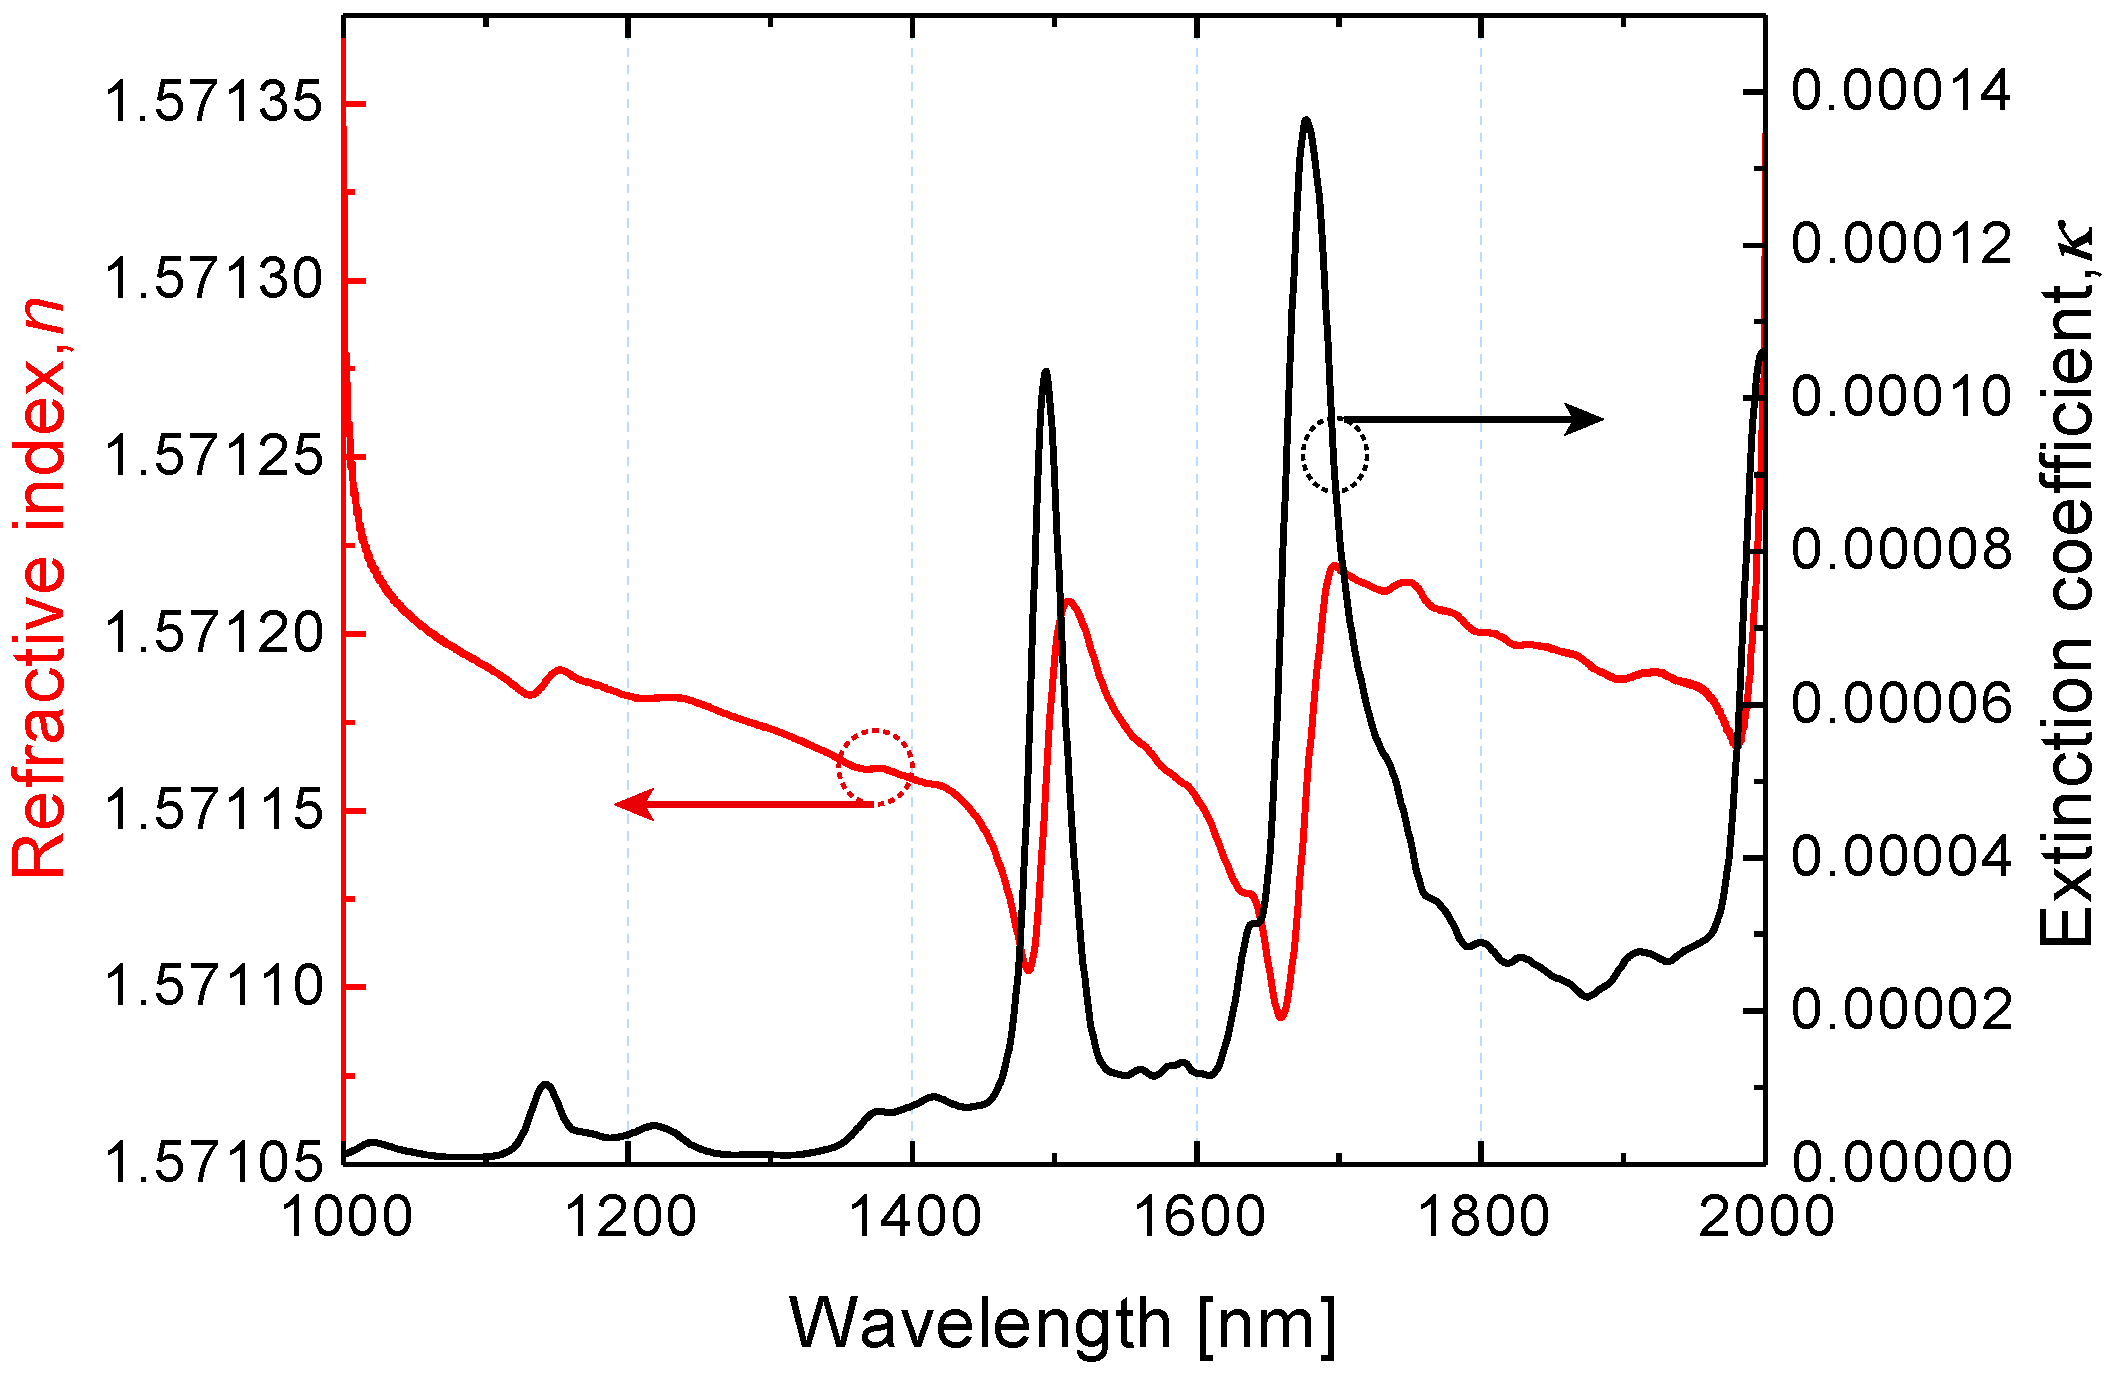
| NMA | N-Methylaniline |
| DT | Differential transmission |
| RI | Refractive index |
Appendix A


References
- Karbchevsky, A.; Katiyi, A.; Ang, A.S.; Hazan, A. On-chip nanophotonics and future challenges. Nanophotonics 2020. [Google Scholar] [CrossRef]
- Blanco, M.; Villarroya, I. NIR spectroscopy: A rapid-response analytical tool. TrAC Trends Anal. Chem. 2002, 21, 240–250. [Google Scholar] [CrossRef]
- Siesler, H.W.; Ozaki, Y.; Kawata, S.; Heise, H.M. Near-Infrared Spectroscopy: Principles, Instruments, Applications; John Wiley & Sons: Hoboken, NJ, USA, 2008. [Google Scholar]
- Katiyi, A.; Karabchevsky, A. Deflected Talbot mediated overtone spectroscopy in near-infrared as a label-free sensor on a chip. ACS Sens. 2020. [CrossRef]
- Ozaki, Y.; Genkawa, T.; Futami, Y. Near-Infrared Spectroscopy; John Wiley & Sons: Hoboken, NJ, USA, 2017. [Google Scholar]
- Türker-Kaya, S.; Huck, C.W. A review of mid-infrared and near-infrared imaging: principles, concepts and applications in plant tissue analysis. Molecules 2017, 22, 168. [Google Scholar] [CrossRef]
- Ozaki, Y. Near-infrared spectroscopy—Its versatility in analytical chemistry. Anal. Sci. 2012, 28, 545–563. [Google Scholar] [CrossRef]
- Atkins, P.W.; Friedman, R.S. Molecular Quantum Mechanics; Oxford University Press: Oxford, UK, 2011. [Google Scholar]
- Karabchevsky, A.; Kavokin, A. Giant absorption of light by molecular vibrations on a chip. Sci. Rep. 2016, 6, 21201. [Google Scholar] [CrossRef]
- Katiyi, A.; Karabchevsky, A. Figure of merit of all-dielectric waveguide structures for absorption overtone spectroscopy. J. Lightwave Technol. 2017, 35, 2902–2908. [Google Scholar] [CrossRef]
- Katiyi, A.; Zorea, J.; Halstuch, A.; Elkabets, M.; Karabchevsky, A. Surface roughness-induced absorption acts as an ovarian cancer cells growth sensor-monitor. Biosens. Bioelectron. 2020, 112240. [Google Scholar] [CrossRef] [PubMed]
- Katiyi, A.; Karabchevsky, A. Si nanostrip optical waveguide for on-chip broadband molecular overtone spectroscopy in near-infrared. ACS Sens. 2018, 3, 618–623. [Google Scholar] [CrossRef] [PubMed]
- Ray, G.J.; Anderson, T.N.; Caton, J.A.; Lucht, R.P.; Walther, T. OH sensor based on ultraviolet, continuous-wave absorption spectroscopy utilizing a frequency-quadrupled, fiber-amplified external-cavity diode laser. Opt. Lett. 2001, 26, 1870–1872. [Google Scholar] [CrossRef] [PubMed]
- Arsad, N.; Li, M.; Stewart, G.; Johnstone, W. Intra-cavity spectroscopy using amplified spontaneous emission in fiber lasers. J. Lightwave Technol. 2010, 29, 782–788. [Google Scholar] [CrossRef]
- Karabchevsky, A.; Katiyi, A.; Bin Abdul Khudus, M.I.M.; Kavokin, A.V. Tuning the Near-Infrared Absorption of Aromatic Amines on Tapered Fibers Sculptured with Gold Nanoparticles. ACS Photonics 2018, 5, 2200–2207. [Google Scholar] [CrossRef]
- Borovkova, O.; Ignatyeva, D.; Sekatskii, S.; Karabchevsky, A.; Belotelov, V. High-Q surface electromagnetic wave resonance excitation in magnetophotonic crystals for supersensitive detection of weak light absorption in the near-infrared. Photonics Res. 2020, 8, 57–64. [Google Scholar] [CrossRef]
- Klimov, V. Nanoplasmonics; CRC Press: Boca Raton, FL, USA, 2014. [Google Scholar]
- Chen, H.; Shao, L.; Li, Q.; Wang, J. Gold nanorods and their plasmonic properties. Chem. Soc. Rev. 2013, 42, 2679–2724. [Google Scholar] [CrossRef] [PubMed]
- Giannini, V.; Fernández-Domínguez, A.I.; Heck, S.C.; Maier, S.A. Plasmonic nanoantennas: fundamentals and their use in controlling the radiative properties of nanoemitters. Chem. Rev. 2011, 111, 3888–3912. [Google Scholar] [CrossRef] [PubMed]
- Dadadzhanov, D.R.; Vartanyan, T.A.; Karabchevsky, A. Vibrational overtones spectroscopy enabled by plasmonic nanoantennas. In Plasmonics: Design, Materials, Fabrication, Characterization, and Applications XVI; International Society for Optics and Photonics: Bellingham, WA, USA, 2018; Volume 10722, p. 107222E. [Google Scholar]
- Dadadzhanov, D.R.; Vartanyan, T.A.; Karabchevsky, A. Differential extinction of vibrational molecular overtone transitions with gold nanorods and its role in surface enhanced near-IR absorption (SENIRA). Opt. Express 2019, 27, 29471–29478. [Google Scholar] [CrossRef] [PubMed]
- Dadadzhanov, D.R.; Vartanyan, T.A.; Dadadzhanova, A.I.; Karabchevsky, A. Surface-enhanced near-infrared absorption (SENIRA) of CH and NH groups with gold nanoarray. In Quantum Sensing and Nano Electronics and Photonics XVII; International Society for Optics and Photonics: Bellingham, WA, USA, 2020; Volume 11288, p. 1128816. [Google Scholar]
- Humphrey, A.; Barnes, W. Plasmonic surface lattice resonances in arrays of metallic nanoparticle dimers. J. Optics 2016, 18, 035005. [Google Scholar] [CrossRef]
- Kravets, V.G.; Kabashin, A.V.; Barnes, W.L.; Grigorenko, A.N. Plasmonic surface lattice resonances: A review of properties and applications. Chem. Rev. 2018, 118, 5912–5951. [Google Scholar] [CrossRef]
- Kravets, V.; Schedin, F.; Kabashin, A.; Grigorenko, A. Sensitivity of collective plasmon modes of gold nanoresonators to local environment. Opt. Lett. 2010, 35, 956–958. [Google Scholar] [CrossRef]
- Auguié, B.; Barnes, W.L. Collective resonances in gold nanoparticle arrays. Phys. Rev. Lett. 2008, 101, 143902. [Google Scholar] [CrossRef]
- Chen, P.Y.; Muljarov, E.A.; Sivan, Y. Lightning-fast solution of scattering problems in nanophotonics: An effortless modal approach (Conference Presentation). In Nanophotonics VIII; International Society for Optics and Photonics: Bellingham, WA, USA, 2020; Volume 11345, p. 113450T. [Google Scholar]
- Norman, J.C.; DeJarnette, D.F.; Roper, D.K. Polylogarithm-based computation of Fano resonance in arrayed dipole scatterers. J. Phys. Chem. C 2014, 118, 627–634. [Google Scholar] [CrossRef]
- Kanipe, K.N.; Chidester, P.P.; Stucky, G.D.; Meinhart, C.D.; Moskovits, M. Properly structured, any metal can produce intense surface enhanced Raman spectra. J. Phys. Chem. C 2017, 121, 14269–14273. [Google Scholar] [CrossRef]
- Wang, D.; Guan, J.; Hu, J.; Bourgeois, M.R.; Odom, T.W. Manipulating light–matter interactions in plasmonic nanoparticle lattices. Acc. Chem. Res. 2019, 52, 2997–3007. [Google Scholar] [CrossRef]
- Cherqui, C.; Bourgeois, M.R.; Wang, D.; Schatz, G.C. Plasmonic Surface Lattice Resonances: Theory and Computation. Acc. Chem. Res. 2019, 52, 2548–2558. [Google Scholar] [CrossRef] [PubMed]
- Manjavacas, A.; Zundel, L.; Sanders, S. Analysis of the Limits of the Near-Field Produced by Nanoparticle Arrays. ACS Nano 2019, 13, 10682–10693. [Google Scholar] [CrossRef] [PubMed]
- Yokota, Y.; Ueno, K.; Mizeikis, V.; Juodkazis, S.; Sasaki, K.; Misawa, H. Optical characterization of plasmonic metallic nanostructures fabricated by high-resolution lithography. J. Nanophotonics 2007, 1, 011594. [Google Scholar]
- Grand, J.; Adam, P.M.; Grimault, A.S.; Vial, A.; De La Chapelle, M.L.; Bijeon, J.L.; Kostcheev, S.; Royer, P. Optical extinction spectroscopy of oblate, prolate and ellipsoid shaped gold nanoparticles: experiments and theory. Plasmonics 2006, 1, 135–140. [Google Scholar] [CrossRef]
- Luypaert, J.; Massart, D.; Vander Heyden, Y. Near-infrared spectroscopy applications in pharmaceutical analysis. Talanta 2007, 72, 865–883. [Google Scholar] [CrossRef]
- Nicolai, B.M.; Beullens, K.; Bobelyn, E.; Peirs, A.; Saeys, W.; Theron, K.I.; Lammertyn, J. Nondestructive measurement of fruit and vegetable quality by means of NIR spectroscopy: A review. Postharvest Biol. Technol. 2007, 46, 99–118. [Google Scholar] [CrossRef]
- Prieto, N.; Pawluczyk, O.; Dugan, M.E.R.; Aalhus, J.L. A review of the principles and applications of near-infrared spectroscopy to characterize meat, fat, and meat products. Appl. Spectrosc. 2017, 71, 1403–1426. [Google Scholar] [CrossRef]
- Dos Santos, C.A.T.; Lopo, M.; Páscoa, R.N.; Lopes, J.A. A review on the applications of portable near-infrared spectrometers in the agro-food industry. Appl. Spectrosc. 2013, 67, 1215–1233. [Google Scholar] [CrossRef] [PubMed]
- Xia, Y.; Xu, Y.; Li, J.; Zhang, C.; Fan, S. Recent advances in emerging techniques for non-destructive detection of seed viability: A review. Artif. Intell. Agric. 2019, 1, 35–47. [Google Scholar] [CrossRef]
- Shaji, S.; Eappen, S.M.; Rasheed, T.; Nair, K. NIR vibrational overtone spectra of N-methylaniline, N, N-dimethylaniline and N, N-diethylaniline—A conformational structural analysis using local mode model. Spectrochim. Acta Part A Mol. Biomol. Spectrosc. 2004, 60, 351–355. [Google Scholar] [CrossRef]
- Karabchevsky, A.; Shalabney, A. Strong interaction of molecular vibrational overtones with near-guided surface plasmon polariton. In Optical Sensing and Detection IV; International Society for Optics and Photonics: Bellingham, WA, USA, 2016. [Google Scholar]
- Johnson, P.B.; Christy, R.W. Optical constants of the noble metals. Phys. Rev. B 1972, 6, 4370–4379. [Google Scholar] [CrossRef]
- Stietz, F.; Bosbach, J.; Wenzel, T.; Vartanyan, T.; Goldmann, A.; Träger, F. Decay times of surface plasmon excitation in metal nanoparticles by persistent spectral hole burning. Phys. Rev. Lett. 2000, 84, 5644. [Google Scholar] [CrossRef] [PubMed]
- Bosbach, J.; Hendrich, C.; Stietz, F.; Vartanyan, T.; Träger, F. Ultrafast dephasing of surface plasmon excitation in silver nanoparticles: influence of particle size, shape, and chemical surrounding. Phys. Rev. Lett. 2002, 89, 257404. [Google Scholar] [CrossRef]
- SCHOTT Glass Database. Number 517642.251. Available online: https://www.schott.com/d/advanced_optics/ac85c64c-60a0-4113-a9df-23ee1be20428/1.17/schott-optical-glass-collection-datasheets-english-may-2019.pdf (accessed on 1 February 2014).
- Zundel, L.; Manjavacas, A. Finite-size effects on periodic arrays of nanostructures. J. Phys. Photonics 2018, 1, 015004. [Google Scholar] [CrossRef]
- Sung, J.; Hicks, E.M.; Van Duyne, R.P.; Spears, K.G. Nanoparticle spectroscopy: Plasmon coupling in finite-sized two-dimensional arrays of cylindrical silver nanoparticles. J. Phys. Chem. C 2008, 112, 4091–4096. [Google Scholar] [CrossRef]
- Matsushima, A. Effect of periodicity in the light scattering from infinite and finite arrays of silver nanospheres. In Proceedings of the 2017 IEEE International Conference on Computational Electromagnetics (ICCEM), Kumamoto, Japan, 8–10 March 2017; pp. 236–237. [Google Scholar]
- Born, M.; Wolf, E. Principles of Optics: Electromagnetic Theory of Propagation, Interference and Diffraction of Light; Elsevier: Amsterdam, The Netherlands, 2013. [Google Scholar]
- Shen, H.; Bienstman, P.; Maes, B. Plasmonic absorption enhancement in organic solar cells with thin active layers. J. Appl. Phys. 2009, 106, 073109. [Google Scholar] [CrossRef]
- Starovoytov, A.A.; Nabiullina, R.D.; Gladskikh, I.A.; Polischuk, V.A.; Parfenov, P.S.; Kamalieva, A.N. Plasmon-exciton interaction in the thin film of inhomogeneous ensemble of silver nanoparticles and cyanine J-aggregates. In Nanophotonics VII; International Society for Optics and Photonics: Bellingham, WA, USA, 2018; Volume 10672, p. 106723O. [Google Scholar]


© 2020 by the authors. Licensee MDPI, Basel, Switzerland. This article is an open access article distributed under the terms and conditions of the Creative Commons Attribution (CC BY) license (http://creativecommons.org/licenses/by/4.0/).
Share and Cite
R. Dadadzhanov, D.; A. Vartanyan, T.; Karabchevsky, A. Lattice Rayleigh Anomaly Associated Enhancement of NH and CH Stretching Modes on Gold Metasurfaces for Overtone Detection. Nanomaterials 2020, 10, 1265. https://doi.org/10.3390/nano10071265
R. Dadadzhanov D, A. Vartanyan T, Karabchevsky A. Lattice Rayleigh Anomaly Associated Enhancement of NH and CH Stretching Modes on Gold Metasurfaces for Overtone Detection. Nanomaterials. 2020; 10(7):1265. https://doi.org/10.3390/nano10071265
Chicago/Turabian StyleR. Dadadzhanov, Daler, Tigran A. Vartanyan, and Alina Karabchevsky. 2020. "Lattice Rayleigh Anomaly Associated Enhancement of NH and CH Stretching Modes on Gold Metasurfaces for Overtone Detection" Nanomaterials 10, no. 7: 1265. https://doi.org/10.3390/nano10071265
APA StyleR. Dadadzhanov, D., A. Vartanyan, T., & Karabchevsky, A. (2020). Lattice Rayleigh Anomaly Associated Enhancement of NH and CH Stretching Modes on Gold Metasurfaces for Overtone Detection. Nanomaterials, 10(7), 1265. https://doi.org/10.3390/nano10071265