Sulfonated Pentablock Copolymer Membranes and Graphene Oxide Addition for Efficient Removal of Metal Ions from Water


 , ,
, ,  ,
, 
Abstract
1. Introduction
2. Materials and Methods
2.1. Materials
2.2. Membrane Preparation
2.3. Characterization
3. Results and Discussion
3.1. Membrane Characterization
3.2. Heavy Metals Removal
3.2.1. Adsorption of Heavy Metals by s-PBC and s-PBC/GO
3.2.2. Heavy Metals Removal: A Kinetic Study
4. Conclusions
Supplementary Materials
Author Contributions
Funding
Acknowledgments
Conflicts of Interest
References
- Zularisam, A.W.; Ismail, A.F.; Salim, R. Behaviours of natural organic matter in membrane filtration for surface water treatment—a review. Desalination 2006, 194, 211–231. [Google Scholar] [CrossRef]
- Buccheri, M.A.; D’Angelo, D.; Scalese, S.; Spanò, S.F.; Filice, S.; Fazio, E.; Compagnini, G.; Zimbone, M.; Brundo, M.V.; Pecoraro, R.; et al. Modification of graphene oxide by laser irradiation: A new route to enhance antibacterial activity. Nanotechnology 2016, 27, 245704. [Google Scholar] [CrossRef] [PubMed]
- Lü, M.J.; Li, J.; Yang, X.Y. Applications of graphene-based materials in environmental protection and detection. Chin. Sci. Bull. 2013, 58, 2698–2710. [Google Scholar] [CrossRef]
- Hoaghia, M.A.; Cadar, O.; Hognogi, G.G.; Levei, E.; Moisa, C.; Roman, C. Quality and Human Health Risk Assessment of Metals and Nitrogen Compounds in Drinking Water from an Urban Area Near a Former Non-Ferrous Ore Smelter. Anal. Lett. 2019, 52, 1268–1281. [Google Scholar] [CrossRef]
- Borba, C.E.; Guirardello, R.; Silva, E.A.; Veit, M.T.; Tavares, C.R.G. Removal of Ni(II) ions from aqueous solution by biosorption in a fixed bed column: Experimental and theoretical breakthrough curves. Biochem. Eng. J. 2006, 30, 184–191. [Google Scholar] [CrossRef]
- Wan, R.; Mo, Y.; Zhang, Z. Co nanoparticles induce lung injury, DNA damage and mutations in mice. Part. Fibre Toxicol. 2017, 14, 1–15. [Google Scholar] [CrossRef] [PubMed]
- Wang, Y.; Su, H.; Gu, Y.; Song, X.; Zhao, J. Carcinogenicity of Cr and chemoprevention: A brief update. OncoTargets Ther. 2017, 10, 4065–4079. [Google Scholar] [CrossRef]
- Wani, A.L.; Ara, A.; Usmani, J.A. Pb toxicity: A review. Interdiscip Toxicol. 2015, 8, 55–64. [Google Scholar] [CrossRef]
- Fu, F.; Wang, Q. Removal of heavy metal ions from wastewaters: A review. J. Environ. Manage. 2011, 92, 407–418. [Google Scholar] [CrossRef]
- Filice, S.; D’Angelo, D.; Libertino, S.; Nicotera, I.; Kosma, V.; Privitera, V.; Scalese, S. Graphene oxide and titania hybrid Nafion membranes for efficient removal of methyl orange dye from water. Carbon 2015, 82, 489–499. [Google Scholar] [CrossRef]
- D’Angelo, D.; Filice, S.; Libertino, S.; Nicotera, I.; Kosma, V.; Privitera, V.; Scalese, S. Photocatalytic properties of Nafion membranes containing graphene oxide/titania nanocomposites. In Proceedings of the 2014 IEEE 9th Nanotechnology Materials and Devices Conference (NMDC), Aci Castello, Italy, 12–15 October 2014; pp. 54–57. [Google Scholar]
- Ghaffari Khaligh, N.; Johan, M.R. Recent Advances in Water Treatment Using Graphene-based Materials. Mini-Rev. Organic Chem. 2020, 17, 74–90. [Google Scholar] [CrossRef]
- Zhao, G.; Li, J.; Ren, X.; Chen, C.; Wang, X. Few-layered Graphene Oxide nanosheets as superior sorbents for heavy metal ion pollution management. Environ. Sci. Technol. 2011, 45, 10454–10462. [Google Scholar] [CrossRef] [PubMed]
- Scalese, S.; Nicotera, I.; D’Angelo, D.; Filice, S.; Libertino, S.; Simari, C.; Dimos, K.; Privitera, V. Cationic and anionic azo-dye removal from water by sulfonated graphene oxide nanosheets in Nafion membranes. New J. Chem. 2016, 40, 3654–3663. [Google Scholar] [CrossRef]
- Zheng, H.; Huang, X.Y.; Zheng, W. Adsorption of Pb(II) ions from aqueous solution on low-temperature exfoliated graphene nanosheets. Langmuir 2011, 27, 7558–7562. [Google Scholar]
- Yang, K.J.; Chen, B.L.; Zhu, X.Y.; Xing, B.S. Aggregation, Adsorption, and Morphological Transformation of Graphene Oxide in Aqueous Solutions Containing Different Metal Cations. Environ. Sci. Technol. 2016, 50, 11066–11075. [Google Scholar] [CrossRef]
- Zhang, Y.; Zhang, S.; Gao, J.; Chun, T.S. Nanometric Graphene Oxide framework membranes with enhanced heavy metal removal via nanofiltration. J. Membr. Sci. 2016, 515, 230–237. [Google Scholar] [CrossRef]
- Filice, S.; D’Angelo, D.; Scarangella, A.; Iannazzo, D.; Compagnini, G.; Scalese, S. Highly effective and reusable sulfonated pentablock copolymer nanocomposites for water purification applications. RSC Adv. 2017, 7, 45521–45534. [Google Scholar] [CrossRef]
- Khulbe, K.C.; Matsuura, T. Removal of heavy metals and pollutants by membrane adsorption techniques. Appl. Water Sci. 2018, 19, 1–30. [Google Scholar] [CrossRef]
- Nasef, M.M.; Yahaya, A.H. Adsorption of some heavy metal ions from aqueous solutions on Nafion 117 membrane. Desalination 2009, 249, 677–681. [Google Scholar] [CrossRef]
- D’Angelo, D.; Filice, S.; Scarangella, A.; Iannazzo, D.; Compagnini, G.; Scalese, S. Bi2O3/Nexar® polymer nanocomposite membranes for azo dyes removal by UV–vis or visible light irradiation. Catal. Today 2019, 321, 158–163. [Google Scholar] [CrossRef]
- Geise, G.M.; Freeman, B.D.; Paul, D.R. Characterization of a Sulfonated Pentablock Copolymer for Desalination Applications. Polymer 2010, 51, 5815–5822. [Google Scholar] [CrossRef]
- Filice, S.; Urzì, G.; Milazzo, R.G.; Privitera, S.M.S.; Lombardo, S.A.; Compagnini, G.; Scalese, S. Applicability of a New Sulfonated Pentablock Copolymer Membrane and Modified Gas Diffusion Layers for Low-Cost Water Splitting Processes. Energies 2019, 12, 2064. [Google Scholar] [CrossRef]
- Mazurkiewicz-Pawlicka, M.; Nowak, M.; Malolepszy, A.; Witowski, A.; Wasik, D.; Hu, Y.; Stobinski, L. Graphene Oxide with Controlled Content of Oxygen Groups as a Filler for Polymer Composites Used for Infrared Radiation Shielding. Nanomaterials 2020, 10, 32. [Google Scholar] [CrossRef] [PubMed]
- Stobinski, L.; Lesiak, B.; Malolepszy, A.; Mazurkiewicz, M.; Mierzwa, B.; Zemek, J.; Jiricek, P.; Bieloshapka, I. Graphene oxide and reduced graphene oxide studied by the XRD, TEM and electron spectroscopy methods. J. Electron. Spectrosc. Relat. Phenom. 2014, 195, 145–154. [Google Scholar] [CrossRef]
- Truong, P.V.; Shingleton, S.; Kammoun, M.; Black, R.L.; Charendoff, M.; Willis, C.; Ardebili, H.; Stein, G.E. Structure and Properties of Sulfonated Pentablock Terpolymer Films as a Function of Wet-Dry Cycles. Macromolecules 2018, 51, 2203–2215. [Google Scholar] [CrossRef]
- Fan, Y.; Cornelius, C. Raman Spectroscopic and Gas Transport Study of a Pentablock Ionomer Complexed with Metal Ions and its Relationship to Physical Properties. J. Mater. Sci. 2013, 48, 1153–1161. [Google Scholar] [CrossRef]
- Ludvigsson, M.; Lindgren, J.; Tegenfeldt, J. FTIR Study of Water in Cast Nafion Films. Electrochim. Acta 2000, 45, 2267–2271. [Google Scholar] [CrossRef]
- Jaworski, S.; Wierzbicki, M.; Sawosz, E.; Jung, A.; Gielerak, G.; Biernat, J.; Jaremek, H.; Łojkowski, W.; Woźniak, B.; Wojnarowicz, J.; et al. Graphene Oxide-Based Nanocomposites Decorated with Silver Nanoparticles as an Antibacterial Agent. Nanoscale Res. Lett. 2018, 13, 116. [Google Scholar] [CrossRef]
- Scalese, S.; Baldo, S.; D’Angelo, D.; Filice, S.; Bongiorno, C.; Reitano, R.; Fazio, E.; Conoci, S.; La Magna, A. Electrical properties and oxygen functionalities in ethanol-treated and thermally modified graphene oxide. J. Appl. Phys. 2017, 121, 155105. [Google Scholar] [CrossRef]
- Fan, Y.; Zhang, M.; Moore, R.B.; Cornelius, C.J. Structure, physical properties, and molecule transport of gas, liquid, and ions within a pentablock copolymer. J. Membr. Sci. 2014, 464, 179–187. [Google Scholar] [CrossRef]
- Mineart, K.P.; Jiang, X.; Jinnai, H.; Takahara, A.; Spontak, R.J. Morphological Investigation of Midblock-Sulfonated Ionomers Prepared from Solvents Differing in Polarity. Macromol. Rapid Commun. 2015, 36, 432–438. [Google Scholar] [CrossRef] [PubMed]
- Tan, K.L.; Hameed, B.H. Insight into the adsorption kinetics models for the removal of contaminants from aqueous solutions. J. Taiwan Inst. Chem. Eng. 2017, 74, 25–48. [Google Scholar] [CrossRef]
- Largittea, L.; Pasquierb, R. A review of the kinetics adsorption models and their application to the adsorptionof Pb by an activated carbon. Chem. Eng. Res. Des. 2016, 109, 495–504. [Google Scholar] [CrossRef]
- Qiu, H.; Lu, L.V.; Pan, B.; Zhang, Q.; Zhang, W.; Zhang, Q. Critical review in adsorption kinetic models. J. Zhejiang Univ. Sci. A 2009, 10, 716–724. [Google Scholar] [CrossRef]
- Kajjumba, G.W.; Serkan, E.; Öngen, A.; Özcan, H.K.; Aydın, S. Modelling of Adsorption Kinetic Processes—Errors, Theory and Application. Intechopen 2018, 1–19. [Google Scholar]
- Plazinski, W.; Rudzinski, W.; Plazinska, A. Theoretical models of sorption kinetics including a surface reaction mechanism: A review. Adv. Colloid Interface Sci. 2009, 152, 2–13. [Google Scholar] [CrossRef]
- Ho, Y.S.; Ofomaja, A.E. Kinetics and thermodynamics of Pb ion sorption on palm kernel fibre from aqueous solution. Process Biochem. 2005, 40, 40–3455. [Google Scholar] [CrossRef]
- Weber, W.J.; Morris, J.C. Kinetics of Adsorption on Carbon from Solutions. J. Sanit. Eng. Division Am. Soc. Civ. Eng. 1963, 89, 31–60. [Google Scholar]
- McKay, G.; Otterburn, M.S.; Sweeney, A.G. The removal of colour from effluent using various adsorbents—III. Silica: Rate processes. Water Res. 1980, 14, 15–20. [Google Scholar] [CrossRef]
- Muthukrishnaraj, A.; Manokaran, J.; Vanitha, M.; Thiruvengadaravi, K.V.; Baskaralingam, P.; Balasubramanian, N. Equilibrium, kinetic and thermodynamic studies for the removal of Zn(II) and Ni(II) ions using magnetically recoverable graphene/Fe3O4 composite. Desalin. Water Treat. 2014, 56, 2485–2501. [Google Scholar] [CrossRef]
- Fan, L.; Luo, C.; Sun, M.; Li, X.; Qiu, H. Highly selective adsorption of Pb ions by water-dispersible magnetic chitosan/graphene oxide composites. Colloid Surf. B 2013, 103, 523–529. [Google Scholar] [CrossRef] [PubMed]
- Chella, S.; Kollu, P.; Komarala, E.V.P.R.; Doshi, S.; Saranya, M.; Felix, S.; Ramachandran, R.; Saravanan, P.; Koneru, V.L.; Venugopal, V.; et al. Solvothermal synthesis of MnFe2O4-graphene composite—investigation of its adsorption and antimicrobialproperties. Appl. Surf. Sci. 2015, 327, 27–36. [Google Scholar] [CrossRef]
- Mamun, A.A.; Ahmed, Y.M.; AlKhatib, M.F.R.; Jameel, A.T.; Mahar, A. Lead sorption by carbon nanofibers grown on powdered activated carbon—kinetics and equilibrium. NANO 2015, 10, 1550017. [Google Scholar] [CrossRef]


| Membranes | sm [nm−1] | dB [nm] | |
|---|---|---|---|
| s-PBC | 0.0245 | 0.0478 | 40.8 |
| s-PBC/GO | 0.0196 | 0.0382 | 51.0 |
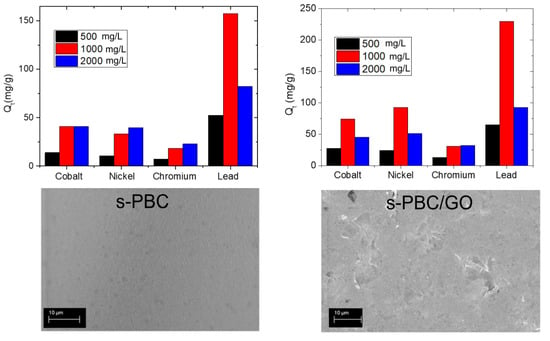
| Metal ion | Qt @ 500 mg/L | Qt @ 1000 mg/L | Qt @ 2000 mg/L |
|---|---|---|---|
| Co2+ | 13.8 | 41.1 | 40.8 |
| Ni2+ | 10.5 | 33.0 | 39.5 |
| Cr3+ | 7.4 | 18.3 | 22.8 |
| Pb2+ | 52.4 | 157.7 | 82.4 |
| Metal ion | Qt @ 500 mg/L | Qt @ 1000 mg/L | Qt @ 2000 mg/L |
|---|---|---|---|
| Co2+ | 27.8 | 74.2 | 45.2 |
| Ni2+ | 24.2 | 93.0 | 51.6 |
| Cr3+ | 13.0 | 30.9 | 32.5 |
| Pb2+ | 65.2 | 229.4 | 92.7 |
| Metal | Pseudo Second Order t/Qt = (1/Qe)t + (1/kQe2) | Intraparticle Diffusion Model Qt = kdt0.5 + C | ||
|---|---|---|---|---|
| s-PBC | s-PBC/GO | s-PBC | s-PBC/GO | |
| Co2+ | 0.93234 | 0.9478 | 0.998 | 0.9851 |
| Ni2+ | 0.44909 | 0.55041 | 0.98042 | 0.95149 |
| Cr3+ | 0.75785 | 0.94692 | 0.97122 | 0.98622 |
| Pb2+ | 0.99878 | -0.51716 | 0.99983 | 0.90144 |
| s-PBC | s-PBC/GO | |||
|---|---|---|---|---|
| Metal | Qt (mg/g) After 180 min | kd (mg/(g×min0.5)) | Qt (mg/g) After 180 min | kd (mg/(g×min0.5)) |
| Co2+ | 41.1 | 4.5 ± 0.1 | 74.2 | 5.7 ± 0.4 |
| Ni2+ | 33.0 | 3.8 ± 0.4 | 93.0 | 7.0 ± 0.9 |
| Cr3+ | 18.3 | 1.7 ± 0.2 | 30.9 | 2.4 ± 0.2 |
| Pb2+ | 157.7 | 16.4 ± 0.1 | 229.4 | 17.9 ± 3.3 |
© 2020 by the authors. Licensee MDPI, Basel, Switzerland. This article is an open access article distributed under the terms and conditions of the Creative Commons Attribution (CC BY) license (http://creativecommons.org/licenses/by/4.0/).
Share and Cite
Filice, S.; Mazurkiewicz-Pawlicka, M.; Malolepszy, A.; Stobinski, L.; Kwiatkowski, R.; Boczkowska, A.; Gradon, L.; Scalese, S. Sulfonated Pentablock Copolymer Membranes and Graphene Oxide Addition for Efficient Removal of Metal Ions from Water. Nanomaterials 2020, 10, 1157. https://doi.org/10.3390/nano10061157
Filice S, Mazurkiewicz-Pawlicka M, Malolepszy A, Stobinski L, Kwiatkowski R, Boczkowska A, Gradon L, Scalese S. Sulfonated Pentablock Copolymer Membranes and Graphene Oxide Addition for Efficient Removal of Metal Ions from Water. Nanomaterials. 2020; 10(6):1157. https://doi.org/10.3390/nano10061157
Chicago/Turabian StyleFilice, Simona, Marta Mazurkiewicz-Pawlicka, Artur Malolepszy, Leszek Stobinski, Ryszard Kwiatkowski, Anna Boczkowska, Leon Gradon, and Silvia Scalese. 2020. "Sulfonated Pentablock Copolymer Membranes and Graphene Oxide Addition for Efficient Removal of Metal Ions from Water" Nanomaterials 10, no. 6: 1157. https://doi.org/10.3390/nano10061157
APA StyleFilice, S., Mazurkiewicz-Pawlicka, M., Malolepszy, A., Stobinski, L., Kwiatkowski, R., Boczkowska, A., Gradon, L., & Scalese, S. (2020). Sulfonated Pentablock Copolymer Membranes and Graphene Oxide Addition for Efficient Removal of Metal Ions from Water. Nanomaterials, 10(6), 1157. https://doi.org/10.3390/nano10061157