Article

Effects of Particle Size on the Structure and Photocatalytic Performance by Alkali-Treated TiO2

1
State Key Laboratory of Biobased Material and Green Papermaking, School of Environmental Science and Engineering, Qilu University of Technology (Shandong Academy of Sciences), Jinan 250353, China
2
College of Environmental Science and Engineering, Shandong Agriculture and Engineering University, Jinan 251100, China
*
Authors to whom correspondence should be addressed.
These authors contributed equally to the work.
Nanomaterials 2020, 10(3), 546; https://doi.org/10.3390/nano10030546
Submission received: 19 February 2020 / Revised: 6 March 2020 / Accepted: 13 March 2020 / Published: 18 March 2020

Abstract

:
Particle size of nanomaterials has significant impact on their photocatalyst properties. In this paper, TiO2 nanoparticles with different crystalline sizes were prepared by adjusting the alkali-hydrothermal time (0–48 h). An annealing in N2 atmosphere after hydrothermal treatment caused TiO2 reduction and created defects, resulting in the visible light photocatalytic activity. The evolution of physicochemical properties along with the increase of hydrothermal time at a low alkali concentration has been revealed. Compared with other TiO2 samples, TiO2-24 showed higher photocatalytic activity toward degrading Rhodamine B and Sulfadiazine under visible light. The radical trapping and ESR experiments revealed that O2•- is the main reactive specie in TiO2-24. Large specific surface areas and rapid transfer of photogenerated electrons are responsible for enhancing photocatalytic activity. The above findings clearly demonstrate that particle size and surface oxygen defects can be regulated by alkali-hydrothermal method. This research will deepen the understanding of particle size on the nanomaterials performance and provide new ideas for designing efficient photocatalysts.

Graphical Abstract

1. Introduction

Titanium dioxide (TiO2) has been the most widely used multifunctional material due to its low cost, non-toxicity, wide source, acid-base resistance and high catalytic activity [1]. The outstanding features of TiO2 greatly extends its application from traditional areas to recent promising fields such as photocatalysis, water splitting, lithium batteries and recently emerging perovskite solar cells [2,3]. However, large band gap of TiO2 and high electron hole recombination limit its photocatalytic performance [4]. To modify these intrinsic drawbacks, tremendous efforts have been devoted to broadening the active spectrum and promoting the charge transport [5,6].
Particle size is a crucial factor affecting the performance of nano-photocatalytic materials. The size and shape of the catalyst influence its surface structure and then resulting in various catalytic performance [7,8]. Compared with bulk TiO2, granular TiO2 nanoparticles have a large surface area and a broadened band gap. They contain more active sites and display improved photocatalytic activity, photoelectrochemical properties and gas sensitivity [9,10]. Lin et al. successfully synthesized TiO2 nanoparticles of different particle sizes (12–29 nm) and found the band gap of the TiO2 nanoparticles was a function of the primary particle size. The results also showed that the primary particle size is closely related to the electro-optical properties of photocatalysts. As the primary particle size increases, the photocatalytic rate constant decreases exponentially [11]. Cheng et al. found that the AgI/BiOI photocatalysts display size-dependent photocatalytic activity, which increases with the smaller size of the AgI NPs. This is believed to be related to the larger number of surface active sites and faster spatial charge transfer [12]. Kocı et al. have proved that as the particle size changed, the specific surface area, charge-carrier dynamics and light absorption efficiency of TiO2 nanoparticles also changed, and then the yield changed accordingly [13]. Qi et al. summarized that the antimicrobial activity of ZnO NPs exhibits size dependency, that is, small ZnO NPs yield high antibacterial activities [14]. These researches have confirmed that the particle size has an important effect on the catalyst properties.
There are many methods that have been developed to prepare TiO2 nanostructures with various morphology types and sizes, including the hydrothermal method, the sol-gel method, the vapor deposition method and the electrospinning method [9,15]. Nowadays the hydrothermal synthesis of TiO2 nanostructures is a well-established technique and typically yields a large amount of TiO2 nanostructures from solution [16,17]. Most of the current researches focus on the alkali-hydrothermal approaches with high alkali concentration (8–12 M), which usually produces different morphology types of 1D TiO2 nanostructures (nanotube, nanorod, nanowire, nanofiber or nanobelt) [18,19]. Although the properties and applications of TiO2 and nanostructures has been studied, the effect of alkali on TiO2 morphology types, sizes and photocatalytic performance is still unavailable. The effect of low alkali concentration on TiO2 is less studied.
In this study, we aimed to provide a comprehensive understanding of the effects of low alkali-hydrothermal treatment on the TiO2 structure and photocatalytic performance. TiO2 nanoparticles with different particle sizes were prepared by adjusting hydrothermal time by the same preparation method. The effects of particle size on photocatalytic activity and photocarriers migration rate were systematically compared. This research emphasizes the important role of particle size in regulating the photocatalyst structure and performance.

2. Materials and Methods

2.1. Chemicals

Anatase titanium oxide (CAS: 13463-67-7) was purchased from Sigma Aldrich (St Louis, MO, USA) and Sulfadiazine (SD) was purchased from Aladdin (Shanghai, China). All other chemicals were analytical reagent grade and used as received.

2.2. Preparation of TiO2 Samples

The preparation of TiO2-X photocatalysts was performed by a modified alkali-hydrothermal method [20]. Alkali ions penetrate into the TiO2 lattice, or combine with oxygen to form alkali metal oxides on the TiO2 surface, which limit the growth of TiO2 nanocrystals. Therefore, the alkali-hydrothermal method is used to adjust the size of titanium dioxide particles. Generally, 0.6 g Anatase TiO2, 60 mL D.I. water and 12 g NaOH were added into a beaker with stirring for 30 min. The mixture was transferred to a 100 mL Teflon-lined stainless steel autoclave and heated to 180 °C with different time. The obtained sediment was washed several times with D.I. water and HCl solution (0.6 M) to adjust the pH to remain neutral. The samples were freeze-dried and then calcined at 400 °C for 2 hours under N2 atmosphere. For the sake of distinction, we define the sample obtained by hydrothermal treatment for X hours as TiO2-X.

2.3. Characterization

The crystalline structure of the prepared TiO2 nanomaterial was characterized by X-ray diffraction (XRD, D8 ADVANCE, Bruker AXS, Karlsruhe, Germany) with the scan range from 2° to 80°. The morphology of photocatalysts was observed by transmission electron microscope (TEM, JEM-2100F, JEOL, Tokyo, Japan). Elemental analysis in the material was characterized by X-ray photoelectron spectroscopy (XPS, ESCALAB Xi+, Thermo Fisher Scientific, Waltham, MA, USA) and Raman spectra (Raman, Senterra R200-L, Bruker Optics, Karlsruhe, Germany) with a 532 nm laser beam as the excitation source. N2 adsorption-desorption isotherms were obtained using the Micromeritics (Gemini V2380, Micromeritics, Norcross, GA, USA). The optical absorption properties of photocatalysts were tested by the ultraviolet-visible diffuse reflectance spectroscopy (DRS, Hitachi U-300, Hitachi, Tokyo, Japan) with a scanning range of 200–800 nm. The electron spin resonance (ESR, A300, Bruker, Karlsruhe, Germany) spin-trap technique was employed to monitor the reactive oxygen radical species generated during the irradiation with spin-trap reagent 5,5-dimethyl-1-pirroline-N-oxide (DMPO). Photoluminescence (PL, Hitachi F-4500, Hitachi, Tokyo, Japan) spectra were measured with a continuous wave laser (325 nm) as the exciting source. The main oxidative species in the photocatalytic process could be detected through the free radical trapping experiment by using t-BuOH (hydroxyl radical scavenger), EDTA-2Na (hole scavenger) and circulating N2 (superoxide radical scavenger).

2.4. Photocatalytic Experiments

The photocatalysis was carried out using a 300 W Xe arc lamp (PLS-SXE 300, Perfectlight Co. Ltd., Beijing, China) equipped with a UV-cutoff filter (λ > 400 nm). RhB (Rhodamine B) and SD (Sulfadiazine) were selected as organic contaminants. 0.15 g photocatalyst was placed in 150 mL 20 ppm RhB or 150 mL 10 ppm SD aqueous solution and stirred in the dark to reach an adsorption-desorption equilibrium before illumination. During the period of visible light illumination, the temperature was kept at 20 °C by recirculating cooling water. A 5 mL aliquot was taken at 15 min intervals and filtered through a 0.45 micron filter. The residual concentration of RhB was estimated by visible spectrophotometer (722N, Shanghai Precision & Scientific Instrument Co. Ltd., Beijing, China). The concentration of SD was measured by high performance liquid chromatography (LC-20AT, Shimadzu, Kyoto, Japan) with a C18 (4.6 × 250) reversed phase column. The wavelength of photodiode array detector was 269 nm for SD. The mobile phase was selected as acetonitrile and water (V:V = 1:3) at a flow rate of 0.6 mL/min.

3. Results

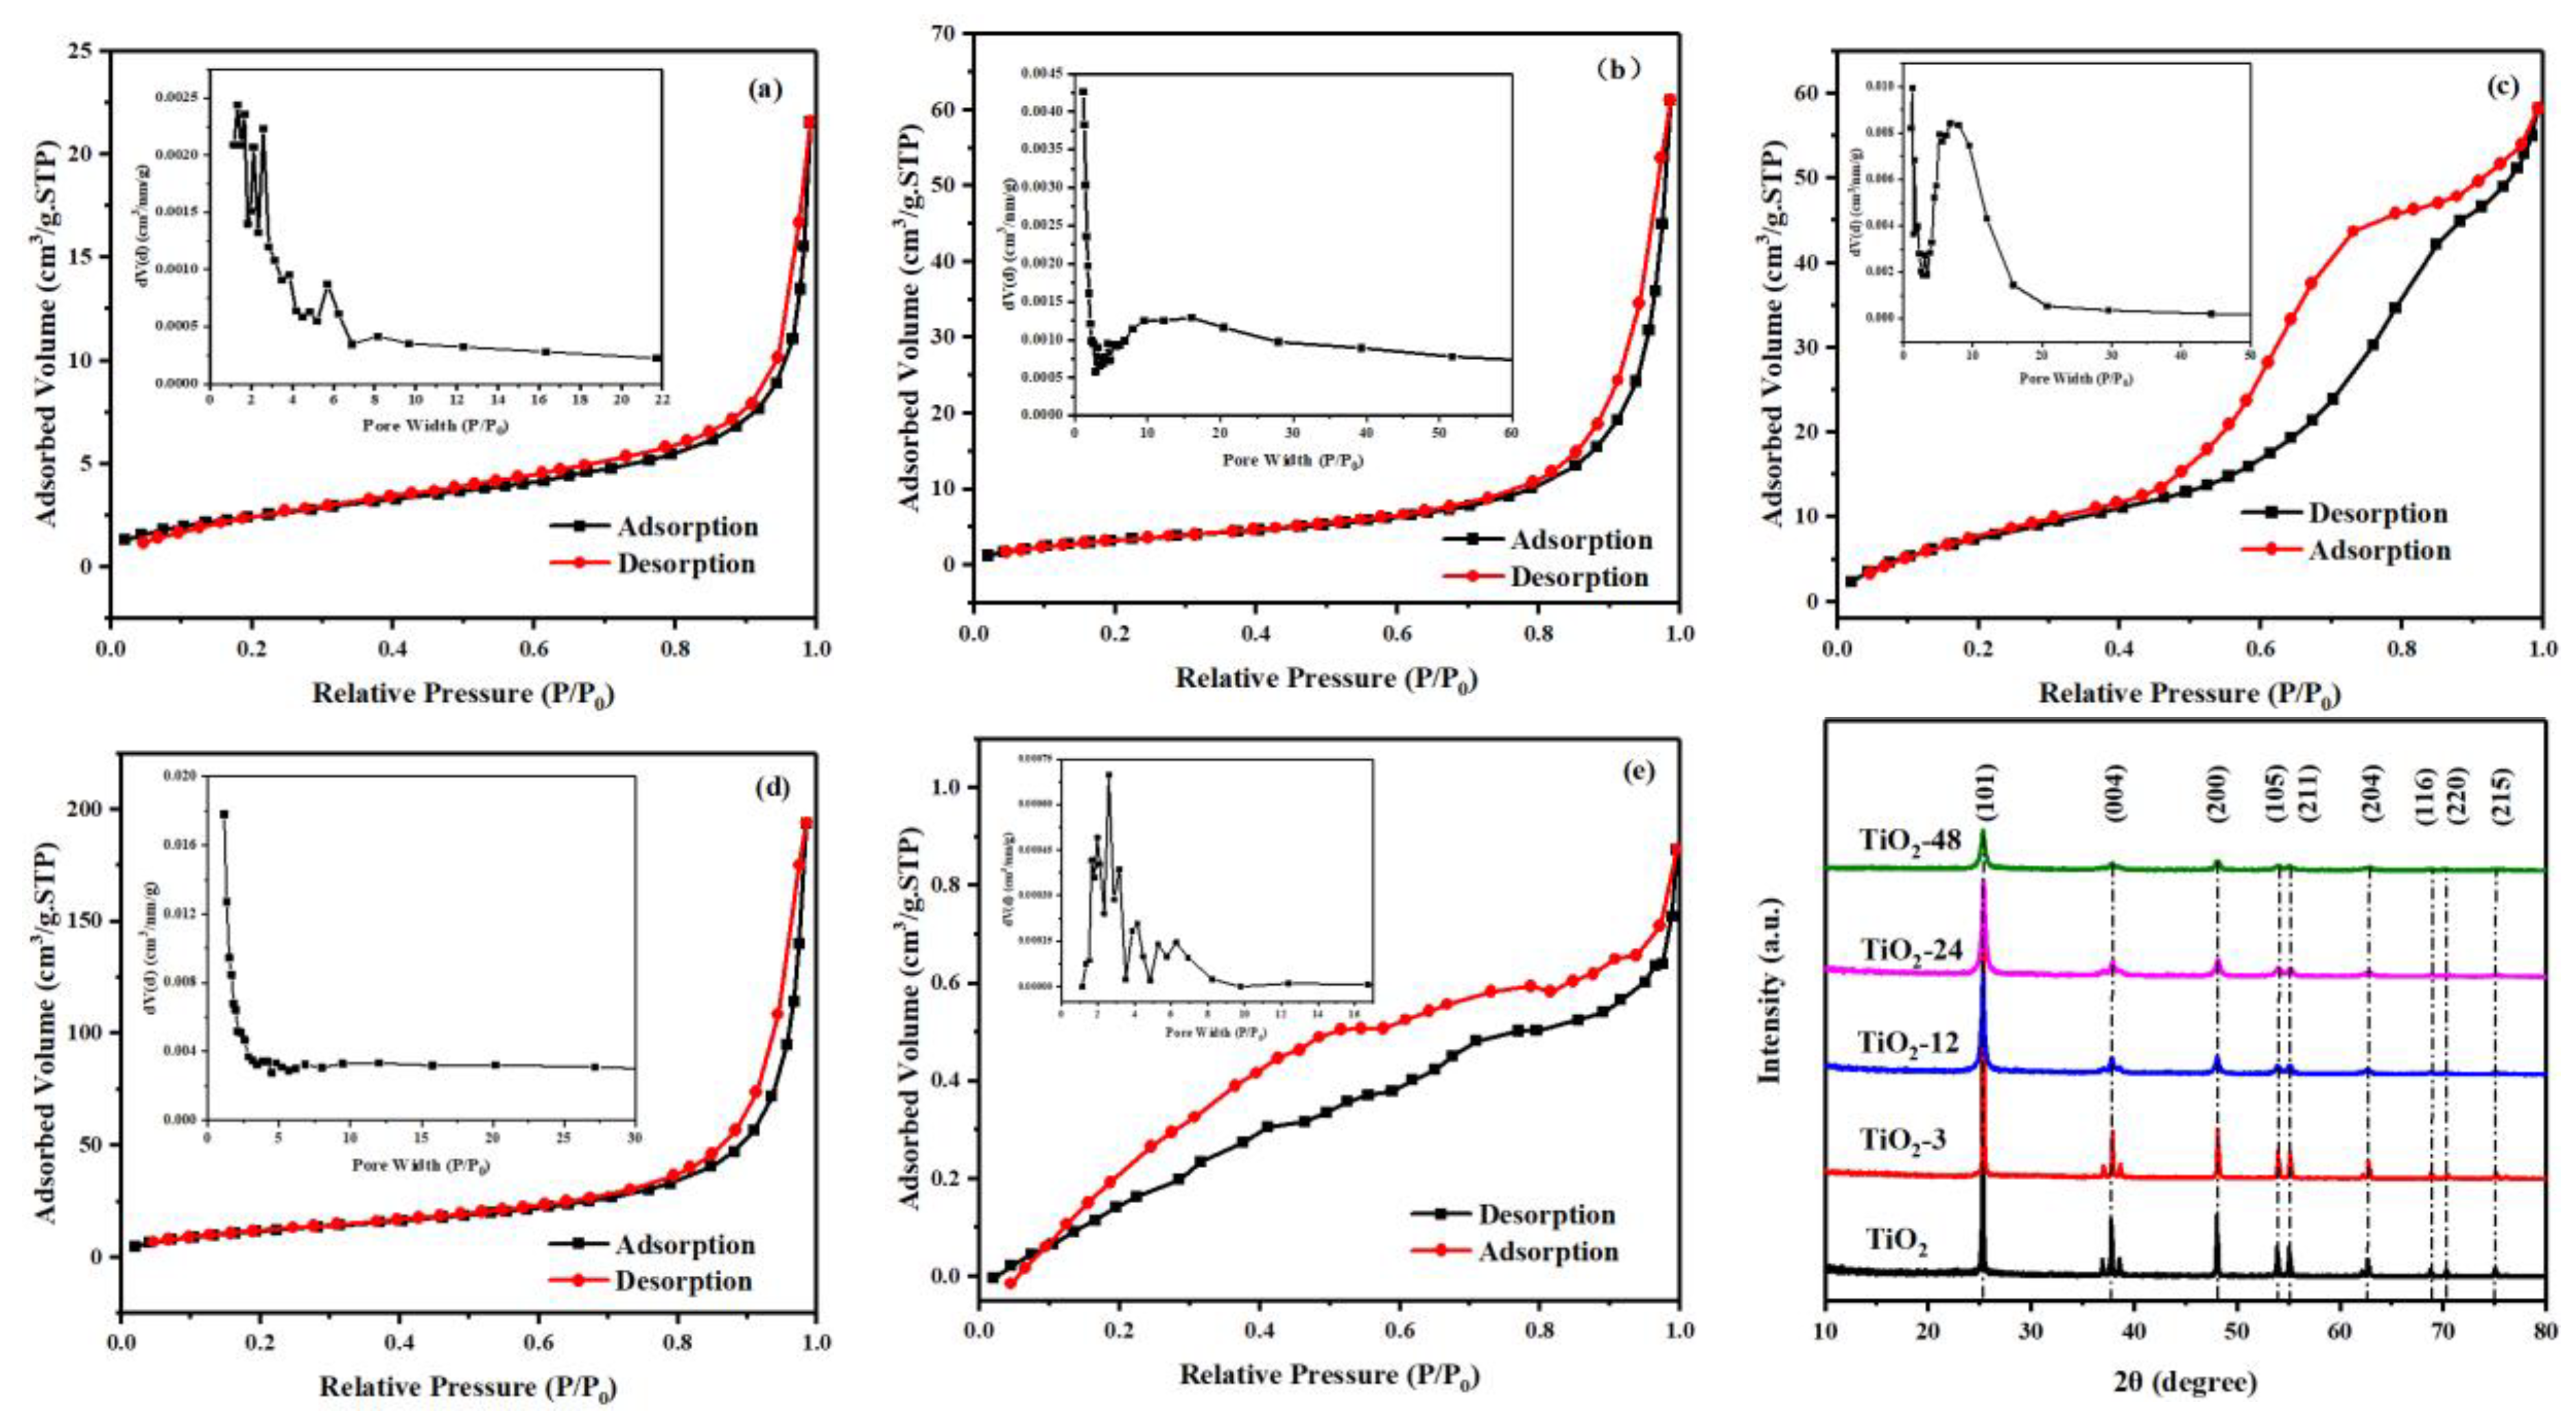
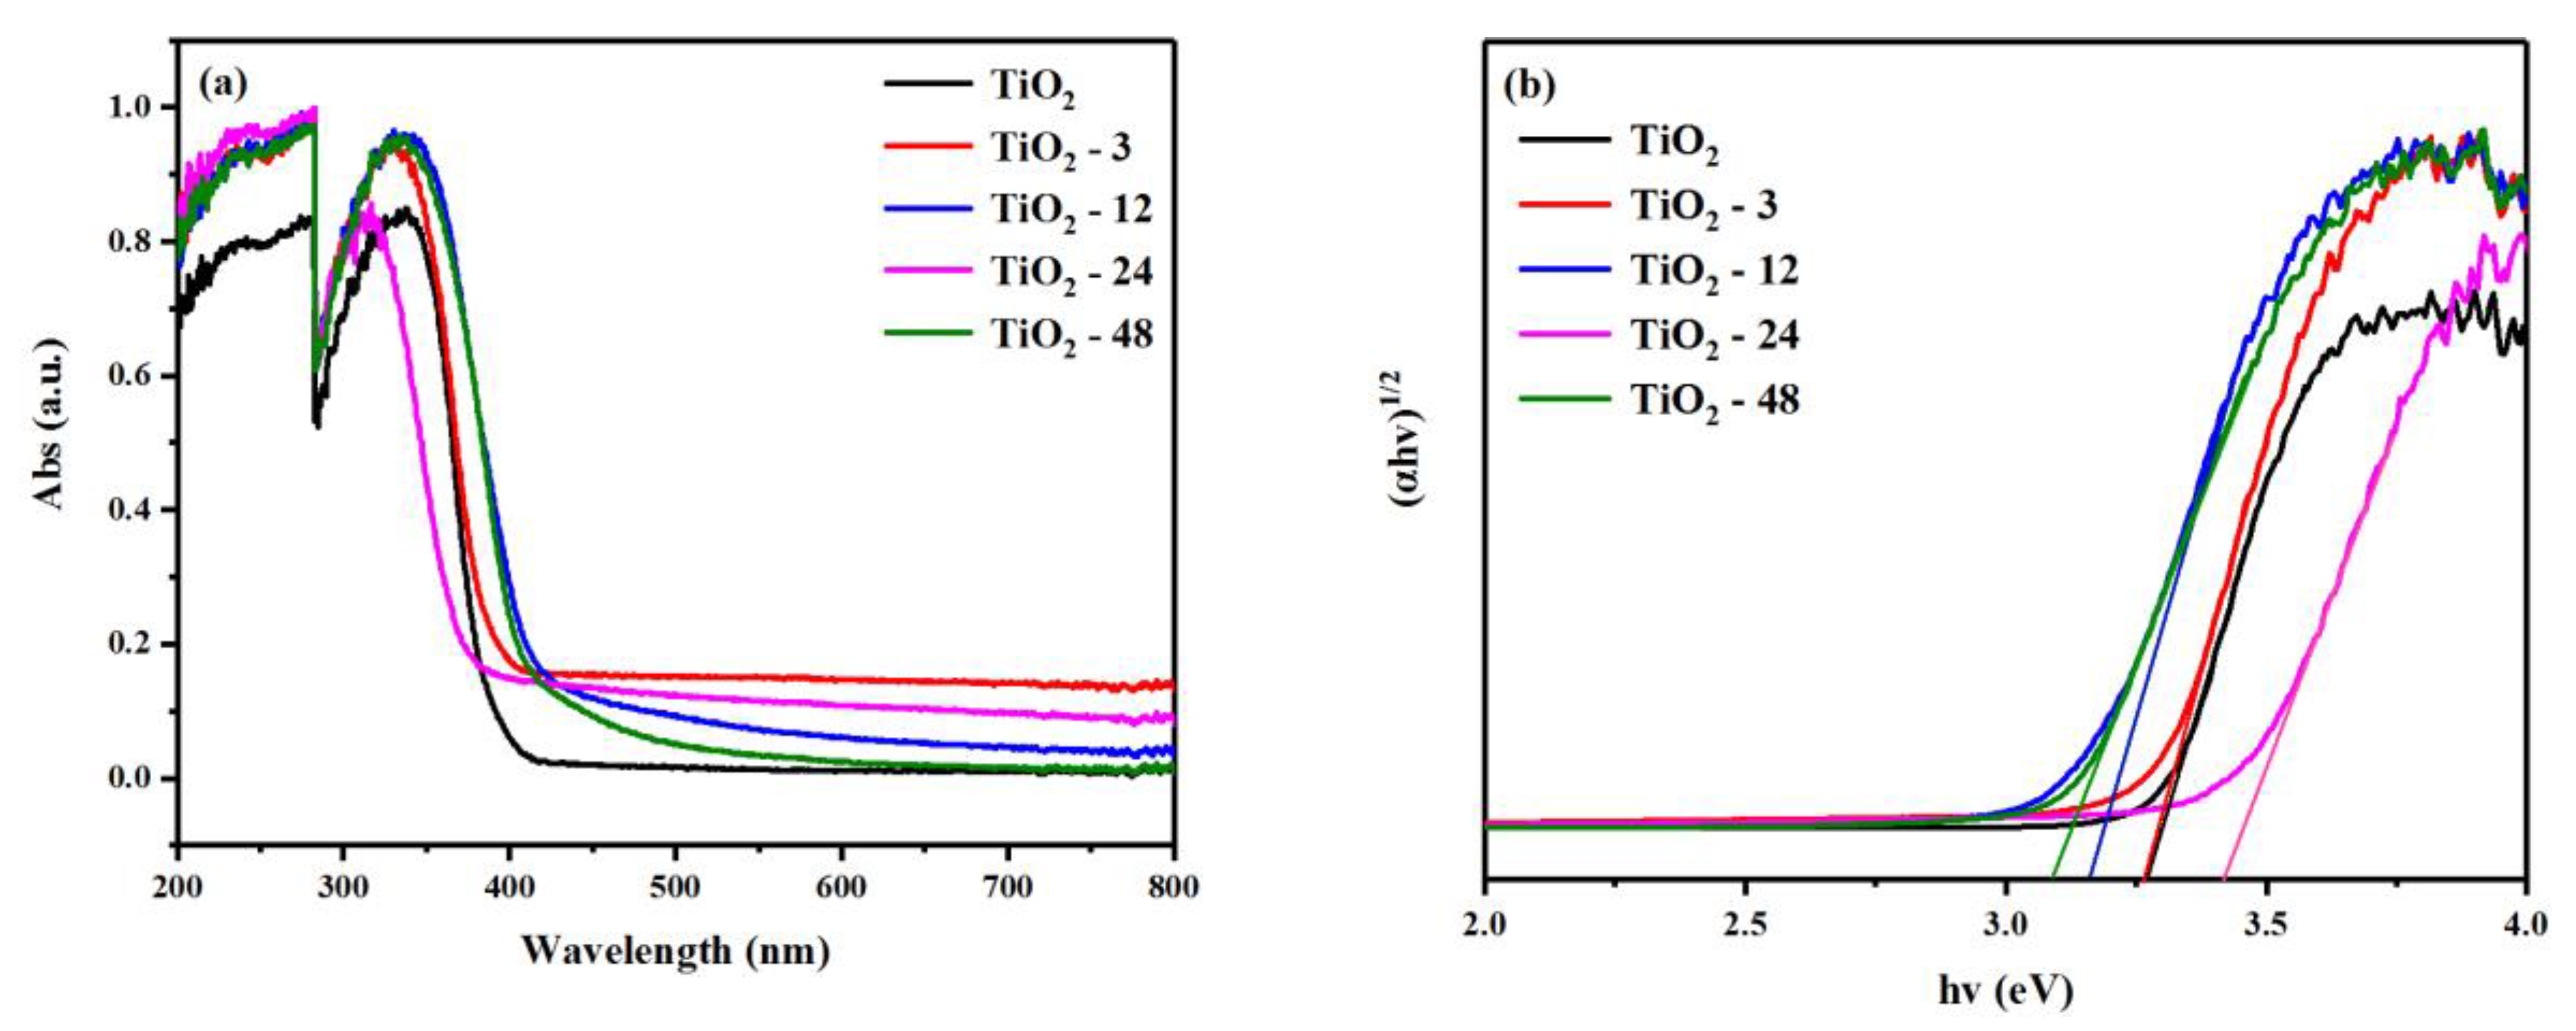
3.1. Characterization of Prepared TiO2-X

Figure 1 shows the TEM images of pristine TiO2 and prepared TiO2 with different hydrothermal times (TiO2-X). The particle diameters of pristine TiO2 are distributed in the range from 50 to 250 nm. After hydrothermal treatment for 3 h (Figure 1b), the TiO2 particles show clear grain boundaries and agglomerations. The particle size decreases obviously to an average of 100 nm and a small amount of particles about 20 nm can be seen. TiO2-12 (Figure 1c) exhibits an irregular morphology. Most of the crystal decreased to 10–40 nm and stacked together, which might indicate the raw materials begin to dissolve, decompose and nucleate. TiO2-24 is composed of 10–20 nm nanoparticles. As for TiO2-48, TiO2 nanocrystals experience a growth process along a certain crystallographic orientation to form a rod-like structure.
The porous structure and specific surface areas of TiO2-X were characterized by nitrogen adsorption-desorption isotherms as well as the pore size distributions in Figure 2. All samples exhibit type IV nitrogen isotherm with a hysteresis loop, indicating the mesopores features [21]. The hysteresis loops of pristine TiO2, TiO2-3, TiO2-24 pertain to H3-type, that is caused by the unsaturated adsorption of nitrogen in relatively high P/P0 [22,23]. For TiO2-12, a hysteresis loop is observed with distinct saturated adsorption platform in a wide relative pressure region. That belongs to the H2-type and reflects a relatively complex pore structure, which is related to its irregular morphology and stacking between layers in figure TEM [24,25]. TiO2-48 shows H2-type hysteresis loops distributed in the whole relative pressure region, mainly due to the irregular morphology and uneven pore size distribution caused by the gradual transformation of nanoparticles into nanorods [26]. The specific surface area, pore size and pore volume data are listed in Table 1 It is indicated that the specific surface area and pore volume increases with decreasing particle size. In Table 1, TiO2-24 possessed the largest surface areas (78.888 m2/g) and pore volume (0.312 cm3/g) nearly six times and 10 times larger compared to the pristine TiO2 (13.060 m2/g and 0.035 cm3/g), respectively. For long treatment, particles get more and more aggregated, leading to reduction in surface area and pore volume (growth also inside the pores).
The X-ray diffraction patterns recorded from TiO2 with different hydrothermal treatment time are shown in Figure 2f. All the relatively sharp peaks could be indexed as anatase TiO2 which are basically in agreement with the anatase phase (JCPDS No. 84-1285). Firstly, the intensity of the diffraction peaks decreased with the increasing hydrothermal time, implying the decreased crystallinity of samples. Secondly, the broadening of the diffraction peaks also be observed, which may be due to the combined effect of decreasing grain size and increasing microstrains [27,28,29]. Table 1 displays the crystallite sizes (dXRD) estimated from the half-band width of the corresponding X-ray spectral peak by the Scherrer Formula [30]. As the hydrothermal time increases, the grain size of TiO2 gradually decreases. This may be due to the alkali ions penetrated into TiO2 lattice, or they probably are bonded with oxygen onto TiO2 surface to form alkali metal oxides, both of which restricted the growth of TiO2 nanocrystals [31]. TiO2-48 possesses the smallest crystallite size calculated by Scherrer Formula, however, the specific surface area of TiO2-48 is not the largest. The contradiction arises because the morphology of TiO2-48 has changed and the calculation results of XRD only represent the size of the (101) crystal plane instead of the true size of TiO2-48 [32,33].
The anatase phase of the TiO2 samples before and after hydrothermal process is further confirmed by the typical Raman bands at 138 cm−1 (Eg), 191 cm−1 (Eg), 391 cm−1 (B1g), 510 cm−1 (A1g) and 634 cm−1 (Eg) in Figure S1 [34]. Notably, the intensity of the peaks become weaker after hydrothermal treatment, possibly due to the poorer crystallinity [35]. It is reported that the higher the crystallinity, the fewer defects in the crystal. Therefore, defects (oxygen vacancies) may exist in TiO2-X samples after hydrothermal treatment [36]. Moreover, compared with the pristine the TiO2, low frequency peak at 138 cm −1 (Eg) of the TiO2-X samples after hydrothermal treatment exhibits slight blue shift and significant broadening. And the Eg peak of TiO2-24 is particularly prominent. It shifts from 137.82 cm−1 to 140.07 cm−1 and the full width at half maximum (FWHM) increases from 8.29 to 12.65. Generally, the quantum size limitation effect (that is to say decreased crystalline size) causes red shift and broadened peak while the presence of defects cause blue shift [37,38]. This result shows the effect of defects are dominant compared to crystalline size. To sum up, the variations of Raman shift and FWHM are the combined effect of crystalline size and defects.
The surface component and chemical valence state of TiO2-X are further investigated by XPS spectra. The high-resolution Ti 2p XPS spectrum of pristine TiO2 and TiO2-24 are compared. In Figure S2a, the fitting result of pristine TiO2 shows two peaks at 457.2 eV and 463.0 eV, this corresponds to the Ti3+ 2p3/2 and Ti3+ 2p1/2, indicating that Ti3+ already exists in pristine TiO2. Similarly, Ti3+ 2p3/2 and Ti3+ 2p1/2 peaks can also been detected in Figure 3c, certifying the existence of Ti3+ in addition to the Ti4+ oxidation state for TiO2-24 samples [39].
According to the peak areas, the Ti3+/Ti4+ ratio of TiO2-24 was calculated to be 85.9%, while the Ti3+/Ti4+ ratio of pristine TiO2 was 67.2% (Table S2). Usually, Ti4+ could be reduced to Ti3+ via trapping electron from oxygen vacancy, so the increased Ti3+/Ti4+ ratio was able to verify indirectly the existence of surface oxygen vacancies [40,41]. The high-resolution O 1s XPS spectrum of pristine TiO2 and TiO2-24 both be fitted into three peaks of around 529 eV, 531 eV and 533 eV, which are ascribed to lattice oxygen (Ti-O), surface hydroxyl groups (-OH) and the oxygen vacancies (Ov) in the vicinity of Ti3+ [42]. Compared with the pristine TiO2, the high-resolution O 1s XPS spectrum of TiO2-X shifted to a lower energy because of the band bending effect caused by extra electrons from oxygen vacancies on TiO2 crystal lattice or to satisfy the requirement of charge equilibrium [34,43]. Ti3+ and oxygen vacancies can serve as photoinduced charge traps as well as adsorption sites to prevent the electron-hole recombination, which are conducive to the improving photocatalytic activity [44,45].
Ultraviolet-visible diffuse reflectance spectroscopy (DRS) is a common method to characterize the optical absorption properties of materials. As displayed in Figure 4a, the pristine TiO2 shows a strong absorption in ultraviolet region and the absorption edge is located at 400 nm, which is consistent with the light absorption characteristics of anatase TiO2 [46]. For TiO2-X, it exhibits increased absorption in the region of 200–800 nm after hydrothermal treatment, which can be attributed to surface oxygen vacancies and Ti3+ [44,47]. According to the Kubelka-Munk function, the band gap energies can be calculated from the plots of (αhv)1/2 versus photon energy [43]. The band gap energies of pristine TiO2, TiO2-3, TiO2-12, TiO2-24 and TiO2-48 are 3.27 eV, 3.26 eV, 3.16 eV, 3.42 eV and 3.09 eV, respectively (Table 1). The wider the band gap, the stronger the redox capability of the photocatalysts. The enhanced visible light absorption is attributed to the presence of surface oxygen vacancies and Ti3+, which could form a shallow donor lever just below the conduction band, thus narrowing the band gap and response to visible light [32].

3.2. Evaluation of the Photocatalytic Efficiency

Photocatalytic performance of TiO2-X samples was evaluated by degradation of RhB and SD under visible light. Pristine TiO2, P25 and the pollutants without photocatalyst were used as control samples. P25 is a commercially produced titanium dioxide material with high photocatalytic activity and is often used as a benchmark photocatalyst [48]. The control experiment in Figure S3 showed that all SD samples reach the adsorption/desorption equilibrium in the dark already after 1 hour. In Figure 5a,b, All TiO2-X samples exhibited better photocatalytic performance under visible light than pristine TiO2 for RhB and SD degradation. The TiO2-24 showed the best performance, approximately 72.7% of RhB was degraded within 120 min and 59.5% of SD was degraded within 6 hours. For pristine TiO2, TiO2-3, TiO2-12 and TiO2-48, the degradation efficiency of RhB exhibited 6.2%, 16.5%, 20.4%, 23.9% within 120 min and the degradation efficiency of SD was 21.7%, 12.2%, 24.3%, 28.3% within 6 hours, respectively. The photodegradation curves of RhB and SD were fitted by pseudo-first-order reaction kinetics. The rate constant (k) of degrading RhB (Figure S4) was calculated to be 0.0088 min−1 for the TiO2-24 and 0.00258 min−1 for P25, and the k of degrading SD was calculated to be 0.13931 h−1 for the TiO2-24 and 0.03303 h−1 for P25. Whether degrading RhB or SD, the degradation rate constant of TiO2-24 is much higher than P25, and the degradation rate constant of TiO2-24 is about 4 times that of P25. The degradation performance of SD is consistent with the degradation trend of RhB. This indicates that TiO2 samples treated by alkaline hydrothermal method can be used as a useful photocatalyst for both dyes and likely also for other organic pollutants. This also demonstrates that the morphology of the nanomaterial has a certain influence on its photocatalytic effect.
In addition to the high photocatalytic activity of catalysts, stable recyclability is also essential for their practical application. In Figure 5c, the photocatalytic stability of TiO2-24 was investigated by cyclic photocatalytic degradation of RhB solution. No obvious reduction was observed after three cycles. It is indicated that TiO2-24 exhibited relatively high photodegradation performance after a long time irradiation.

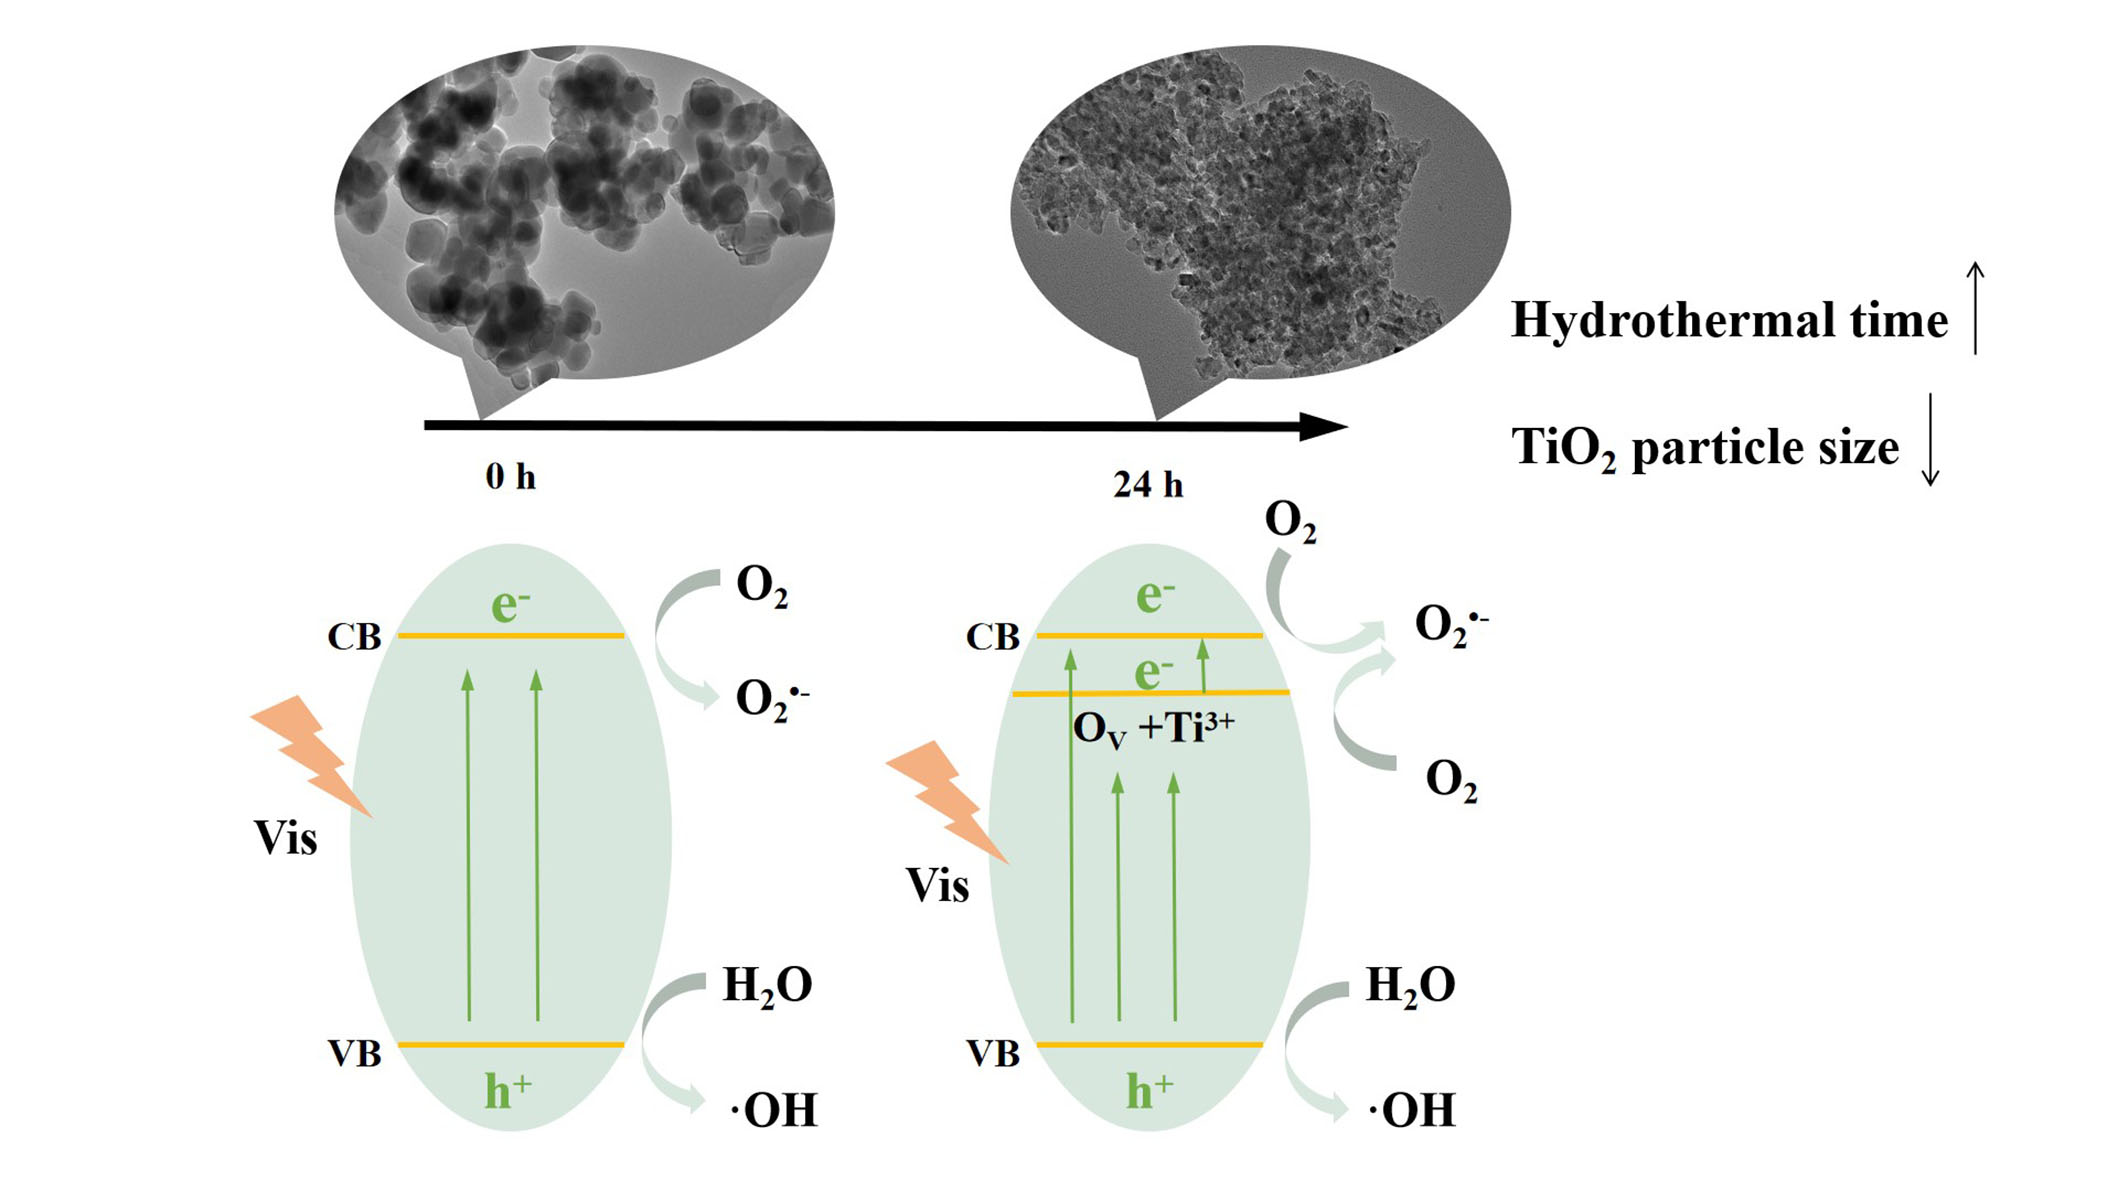
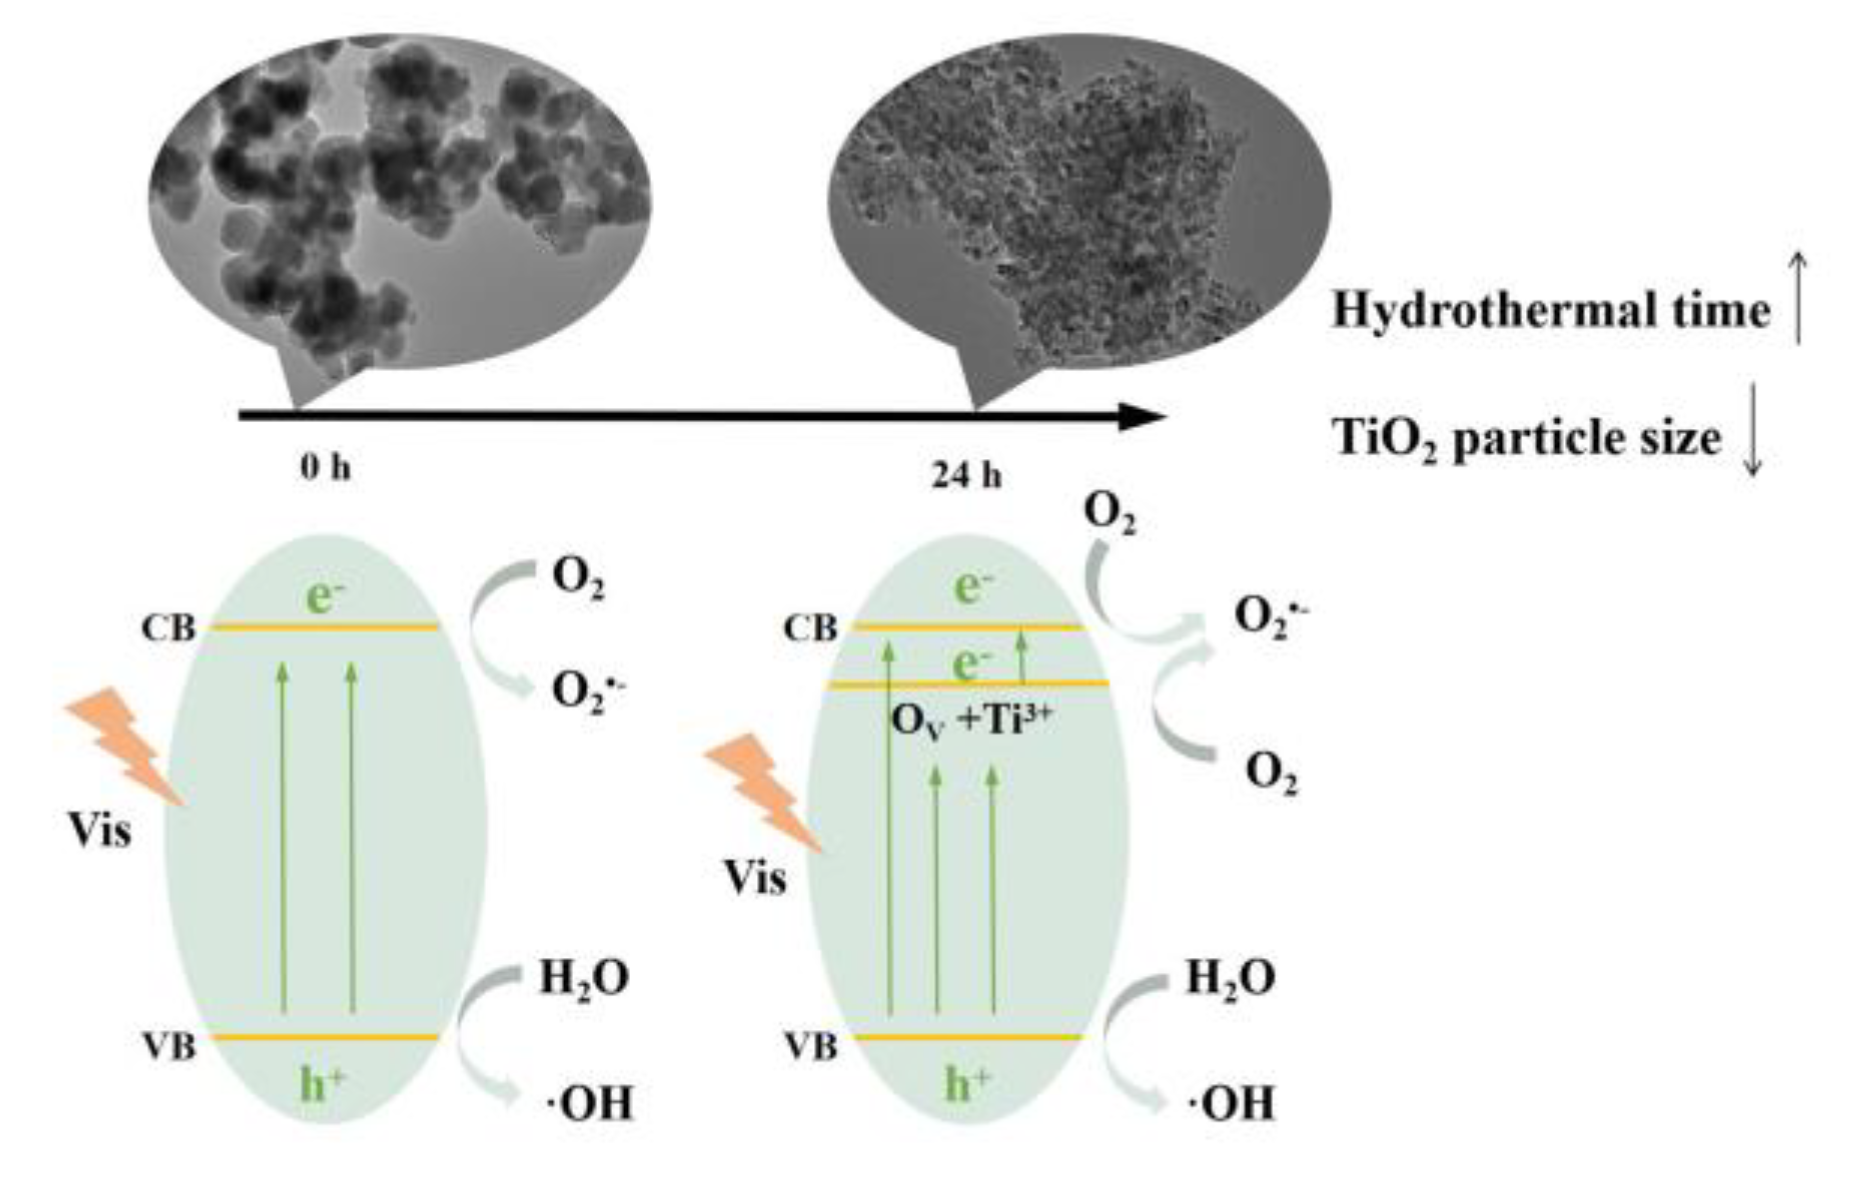
3.3. The mechanism of Photocatalytic Performance Improvement of the TiO2-X.

The trapping experiments were carried out to investigate the main reactive oxygen species (ROS) generated in the photocatalytic degradation process. EDTA-2Na, tert-butyl alcohol (t-BuOH) and N2 were used as holes (h+) scavenger, hydroxyl radicals (·OH) scavenger and superoxide radicals (O2•-) scavenger, respectively [49]. Figure 6a suggests the degradation of RhB over TiO2-24 was suppressed by the addition of the three scavenger, indicating that h+, ·OH and O2•- might be the active species on the RhB degradation process, especially O2•-. This phenomenon may be caused by the efficient photogenerated electron transfer in the TiO2-24 nanoparticles, which facilitates more O2•- participation in the photodegradation of RhB.
To further confirm the radicals generated in the reaction process of TiO2-24, ESR analysis was also performed using DMPO as the radical spin-trapping probe [50,51]. After illuminating with visible light for 10 min, TiO2-24 exhibits the strongest intensity of DMPO-O2•− signals, indicating that the amounts of O2•− produced in TiO2-24 is much larger than that for pristine TiO2 and TiO2-48, which is consistent with the photodegradation performance.
ESR can also be used to confirm the presence of oxygen vacancies. As shown in Figure 6d, there is a sharp signal at g = 2.004, which is identified as the electrons trapped on surface oxygen vacancies. Pristine TiO2, TiO2-24 and TiO2-48 exhibited the enhanced signal intensity of oxygen vacancies after illuminating 10 min under visible light, indicating that the oxygen vacancies were also involved in the degradation process under visible irradiation [52,53]. The single intensity increased from TiO2 to TiO2-48, indicating the surface oxygen vacancies concentrations of TiO2 increased with extending hydrothermal time [54]. However, when the surface oxygen vacancies concentration is too high, bulk oxygen vacancies can easily be generated [9]. The crystalline performance decreases, the bulk defects increases, the results of XRD also verified the existence of bulk defects in TiO2-48. Surface oxygen defects can serve as photoinduced charge traps as well as adsorption sites where the charge transfer to adsorbed species can prevent the electron-hole recombination, which is important for improving of photocatalytic activity; whereas bulk oxygen vacancies only act as charge traps where electron-hole recombines, resulting in the decrease of photoactivity [43,55].

3.4. Photoinduced Electron Transfer Properties in the TiO2-X.

Photoluminescence (PL) spectra is a useful technique to investigate the oxygen vacancies through the measurement of the charge carrier trapping, immigration and recombination [56]. In Figure 7, the highest intensity emission peak around 433 nm corresponds to the emission of self-trapped excitons located on TiO6, which is consistent with the position of absorption edge band in DRS [57,58]. The peaks in the range of 450–500 nm are originated from surface oxygen vacancies and Ti3+ [59,60]. The peaks at around 530 nm are derived from the oxygen vacancies buried in the bulk of materials [61]. The surface defects can form the exciton energy level near the bottom of the conduction band, which allows them to act as trapping sites and hinders the recombination of photogenerated chargers [36,62]. In Figure 7, the signals of TiO2-X are similar, but the peak intensity changed obviously. According to XRD, XPS and ESR results, the pristine TiO2 possesses good crystallinity as well as little defects. After alkali-hydrothermal treatment, the decreased crystallinity of TiO2-X is accompanied by the increased defects, which is beneficial to hinder the recombination of photogenerated chargers, thus the emission peak intensity of TiO2-X is weakened [35,63]. However, TiO2-48 possesses an excess of surface defects and forms bulk defects, thus the peak intensity was higher than TiO2-24.
On the basis of the above results, the surface defects and crystalline sizes played a dominating role on photocatalytic performance. Scheme 1 is the photocatalytic process of TiO2-24 with Ti3+ and oxygen vacancies (Ov). For pristine TiO2, the electrons are injected from its valence band to the conduction band under visible light irradiation. For TiO2-24, the Ti3+ and Ov form local state below the conduction band, and the electrons are promoted from the valance band to Ti3+ and Ov state under visible light irradiation. The electrons on Ti3+ and Ov state cannot recombine easily with photogenerated holes as the Ti3+ and Ov are electron traps. Then the electrons react with the surface-absorbed O2 to generate active oxygen radicals O2•-. The larger specific surface areas creates more basic sites benefit for the increased adsorption of the pollutant molecules. The existence of Ti3+ and Ov accelerate the electron transfer rate, and suppress the photogenerated e--h+ recombination. As a consequence, TiO2-24 showed the enhanced photocatalytic performance.

4. Conclusions

The TiO2 samples were modified at different hydrothermal times (0–48 h) with a low alkali-hydrothermal method. The physicochemical properties and photocatalytic performance of the prepared TiO2-X nanoparticles with different crystalline sizes were explored. With the increased time of hydrothermal treatment, the crystalline size of TiO2-X decreased first and then increased, and the crystallinity decreased. An annealing in N2 atmosphere after hydrothermal treatment caused TiO2 reduction and created defect. The appropriate concentration of surface oxygen vacancies is beneficial to separate photogenerated charges. Due to the combined effects of crystalline size and surfaces defects, the efficiency of photocatalytic degradation of SD and RhB by TiO2-24 nanoparticle under visible light was obviously improved. This study highlights the effects of particle size and surface oxygen defects on the structure and performance of photocatalysts. It opens a new window for the purification of water environmental pollution.

Supplementary Materials

The following are available online at https://www.mdpi.com/2079-4991/10/3/546/s1, Figure S1: Raman spectra of TiO2-X, inset is an enlarged view of TiO2-X in the 300–700 cm−1 region. Figure S2: XPS spectra of the (a) Ti 2p band of pristine TiO2, (b) O 1s band of pristine TiO2. Table S2: Ratio of peak areas of Ti3+ and Ti4+ (Ti3+/Ti4+) according to the quantitative analyses of the fitted Ti 2p XPS peaks. Figure S3: The adsorption test of Sulfadiazine. Figure S4. (a) Rhodamine B photodegradation kinetics of P25 and TiO2-X, (b) Sulfadiazine photodegradation kinetics of P25 and TiO2-X, (c) RhB photodegradation rate constants k of P25 and TiO2-X and (d) SD photodegradation rate constants k of P25 and TiO2-X.

Author Contributions

Conceptualization, J.S. and X.W.; methodology, D.L.; software, H.S.; validation, T.S. and X.M.; formal analysis, H.S.; investigation, W.H.; resources, X.M.; data curation, H.S.; writing—original draft preparation, D.L.; writing—review and editing, J.S. and X.W.; visualization, D.L.; supervision, T.S.; project administration, X.M.; funding acquisition, X.M and W.H. All authors have read and agreed to the published version of the manuscript.

Funding

This research was supported by the National Nature Science Foundation of China (No. 21507067), the International Cooperation Research Special Funds Project of Qilu University of Technology (Shandong Academy of Sciences) (No. QLUTGJHZ2018004) and the Foundation of State Key Laboratory of Biobased Material and Green Papermaking, Qilu University of Technology, Shandong Academy of Sciences (No. ZZ20190106).

Conflicts of Interest

The authors declare no conflict of interest.

References

  1. Ong, W.-J.; Tan, L.-L.; Chai, S.-P.; Yong, S.-T.; Mohamed, A.R. Highly reactive {001} facets of TiO2-based composites: Synthesis, formation mechanism and characterization. Nanoscale 2014, 6, 1946–2008. [Google Scholar] [CrossRef] [PubMed]
  2. Chen, X.; Liu, L.; Huang, F. Black titanium dioxide (TiO2) nanomaterials. Chem. Soc. Rev. 2015, 44, 1861–1885. [Google Scholar] [CrossRef] [PubMed]
  3. Ge, M.; Cao, C.; Huang, J.; Li, S.; Chen, Z.; Zhang, K.-Q.; Al-Deyab, S.; Lai, Y. A review of one-dimensional TiO2 nanostructured materials for environmental and energy applications. J. Mater. Chem. A 2016, 4, 6772–6801. [Google Scholar] [CrossRef]
  4. Guo, Q.; Zhou, C.; Ma, Z.; Ren, Z.; Fan, H.; Yang, X. Elementary photocatalytic chemistry on TiO2 surfaces. Chem. Soc. Rev. 2016, 45, 3701–3730. [Google Scholar] [CrossRef] [Green Version]
  5. Li, W.; Elzatahry, A.; Aldhayan, D.; Zhao, D. Core–shell structured titanium dioxide nanomaterials for solar energy utilization. Chem. Soc. Rev. 2018, 47, 8203–8237. [Google Scholar] [CrossRef]
  6. Shayegan, Z.; Lee, C.-S.; Haghighat, F. TiO2 photocatalyst for removal of volatile organic compounds in gas phase—A review. Chem. Eng. J. 2018, 334, 2408–2439. [Google Scholar] [CrossRef]
  7. Cao, S.; Tao, F.F.; Tang, Y.; Li, Y.; Yu, J. Size-and shape-dependent catalytic performances of oxidation and reduction reactions on nanocatalysts. Chem. Soc. Rev. 2016, 45, 4747–4765. [Google Scholar] [CrossRef]
  8. Hwang, Y.J.; Yang, S.; Lee, H. Surface analysis of N-doped TiO2 nanorods and their enhanced photocatalytic oxidation activity. Appl. Catal. B Environ. 2017, 204, 209–215. [Google Scholar] [CrossRef]
  9. Tian, J.; Zhao, Z.; Kumar, A.; Boughton, R.I.; Liu, H. Recent progress in design, synthesis, and applications of one-dimensional TiO2 nanostructured surface heterostructures: A review. Chem. Soc. Rev. 2014, 43, 6920–6937. [Google Scholar] [CrossRef]
  10. Bianchi, C.; Gatto, S.; Pirola, C.; Naldoni, A.; Di Michele, A.; Cerrato, G.; Crocellà, V.; Capucci, V. Photocatalytic degradation of acetone, acetaldehyde and toluene in gas-phase: Comparison between nano and micro-sized TiO2. Appl. Catal. B Environ. 2014, 146, 123–130. [Google Scholar] [CrossRef]
  11. Lin, H.; Huang, C.; Li, W.; Ni, C.; Shah, S.I.; Tseng, Y.-H. Size dependency of nanocrystalline TiO2 on its optical property and photocatalytic reactivity exemplified by 2-chlorophenol. Appl. Catal. B Environ. 2006, 68, 1–11. [Google Scholar] [CrossRef]
  12. Cheng, H.; Wang, W.; Huang, B.; Wang, Z.; Zhan, J.; Qin, X.; Zhang, X.; Dai, Y. Tailoring AgI nanoparticles for the assembly of AgI/BiOI hierarchical hybrids with size-dependent photocatalytic activities. J. Mater. Chem. A 2013, 1, 7131–7136. [Google Scholar] [CrossRef]
  13. Kočí, K.; Obalová, L.; Matějová, L.; Plachá, D.; Lacný, Z.; Jirkovský, J.; Šolcová, O. Effect of TiO2 particle size on the photocatalytic reduction of CO2. Appl. Catal. B Environ. 2009, 89, 494–502. [Google Scholar] [CrossRef]
  14. Qi, K.; Cheng, B.; Yu, J.; Ho, W. Review on the improvement of the photocatalytic and antibacterial activities of ZnO. J. Alloys Compd. 2017, 727, 792–820. [Google Scholar] [CrossRef]
  15. Mamaghani, A.H.; Haghighat, F.; Lee, C.-S. Hydrothermal/solvothermal synthesis and treatment of TiO2 for photocatalytic degradation of air pollutants: Preparation, characterization, properties, and performance. Chemosphere 2019, 219, 804–825. [Google Scholar] [CrossRef]
  16. Huang, C.-Y.; Guo, R.-T.; Pan, W.-G.; Tang, J.-Y.; Zhou, W.-G.; Liu, X.-Y.; Qin, H.; Jia, P.-Y. One-dimension TiO2 nanostructures with enhanced activity for CO2 photocatalytic reduction. Appl. Surf. Sci. 2019, 464, 534–543. [Google Scholar] [CrossRef]
  17. Liu, N.; Chen, X.; Zhang, J.; Schwank, J.W. A review on TiO2-based nanotubes synthesized via hydrothermal method: Formation mechanism, structure modification, and photocatalytic applications. Catal. Today 2014, 225, 34–51. [Google Scholar] [CrossRef]
  18. Arruda, L.B.; Santos, C.M.; Orlandi, M.O.; Schreiner, W.H.; Lisboa-Filho, P.N. Formation and evolution of TiO2 nanotubes in alkaline synthesis. Ceram. Int. 2015, 41, 2884–2891. [Google Scholar] [CrossRef]
  19. Camposeco, R.; Castillo, S.; Navarrete, J.; Gomez, R. Synthesis, characterization and photocatalytic activity of TiO2 nanostructures: Nanotubes, nanofibers, nanowires and nanoparticles. Catal. Today 2016, 266, 90–101. [Google Scholar] [CrossRef]
  20. Sun, J.; Zhang, H.; Guo, L.-H.; Zhao, L. Two-dimensional interface engineering of a titania–graphene nanosheet composite for improved photocatalytic activity. ACS Appl. Mater. Interfaces 2013, 5, 13035–13041. [Google Scholar] [CrossRef]
  21. Lee, J.; Li, Z.; Zhu, L.; Xie, S.; Cui, X. Ti3+ self-doped TiO2 via facile catalytic reduction over Al (acac)3 with enhanced photoelectrochemical and photocatalytic activities. Appl. Catal. B Environ. 2018, 224, 715–724. [Google Scholar] [CrossRef]
  22. Li, X.; Wan, T.; Qiu, J.; Wei, H.; Qin, F.; Wang, Y.; Liao, Y.; Huang, Z.; Tan, X. In-situ photocalorimetry-fluorescence spectroscopy studies of RhB photocatalysis over Z-scheme g-C3N4@ Ag@ Ag3PO4 nanocomposites: A pseudo-zero-order rather than a first-order process. Appl. Catal. B Environ. 2017, 217, 591–602. [Google Scholar] [CrossRef]
  23. Yu, J.; Zhang, L.; Cheng, B.; Su, Y. Hydrothermal preparation and photocatalytic activity of hierarchically sponge-like macro-/mesoporous titania. J. Phys. Chem. C 2007, 111, 10582–10589. [Google Scholar] [CrossRef]
  24. Zheng, X.; Kuang, Q.; Yan, K.; Qiu, Y.; Qiu, J.; Yang, S. Mesoporous TiO2 single crystals: Facile shape-, size-, and phase-controlled growth and efficient photocatalytic performance. ACS Appl. Mater. Interfaces 2013, 5, 11249–11257. [Google Scholar] [CrossRef]
  25. Li, X.; Zheng, W.; He, G.; Zhao, R.; Liu, D. Morphology control of TiO2 nanoparticle in microemulsion and its photocatalytic property. ACS Sustain. Chem. Eng. 2014, 2, 288–295. [Google Scholar] [CrossRef]
  26. Dong, W.; Yao, Y.; Li, L.; Sun, Y.; Hua, W.; Zhuang, G.; Zhao, D.; Yan, S.; Song, W. Three-dimensional interconnected mesoporous anatase TiO2 exhibiting unique photocatalytic performances. Appl. Catal. B Environ. 2017, 217, 293–302. [Google Scholar] [CrossRef]
  27. Zhang, D.; Ma, X.; Zhang, H.; Liao, Y.; Xiang, Q. Enhanced photocatalytic hydrogen evolution activity of carbon and nitrogen self-doped TiO2 hollow sphere with the creation of oxygen vacancy and Ti3+. Mater. Today Energy 2018, 10, 132–140. [Google Scholar] [CrossRef]
  28. Liu, D.; Cai, W.; Wang, Y.; Zhu, Y. Constructing a novel Bi2SiO5/BiPO4 heterostructure with extended light response range and enhanced photocatalytic performance. Appl. Catal. B Environ. 2018, 236, 205–211. [Google Scholar] [CrossRef]
  29. Likodimos, V.; Chrysi, A.; Calamiotou, M.; Fernández-Rodríguez, C.; Doña-Rodríguez, J.M.; Dionysiou, D.; Falaras, P. Microstructure and charge trapping assessment in highly reactive mixed phase TiO2 photocatalysts. Appl. Catal. B Environ. 2016, 192, 242–252. [Google Scholar] [CrossRef]
  30. Kong, M.; Li, Y.; Chen, X.; Tian, T.; Fang, P.; Zheng, F.; Zhao, X. Tuning the relative concentration ratio of bulk defects to surface defects in TiO2 nanocrystals leads to high photocatalytic efficiency. J. Am. Chem. Soc. 2011, 133, 16414–16417. [Google Scholar] [CrossRef]
  31. Yang, G.; Yan, Z.; Xiao, T.; Yang, B. Low-temperature synthesis of alkalis doped TiO2 photocatalysts and their photocatalytic performance for degradation of methyl orange. J. Alloys Compd. 2013, 580, 15–22. [Google Scholar] [CrossRef]
  32. Tan, B.; Zhang, X.; Li, Y.; Chen, H.; Ye, X.; Wang, Y.; Ye, J. Anatase TiO2 Mesocrystals: Green Synthesis, In Situ Conversion to Porous Single Crystals, and Self-Doping Ti3+ for Enhanced Visible Light Driven Photocatalytic Removal of NO. Chem. Eur. J. 2017, 23, 5478–5487. [Google Scholar] [CrossRef] [PubMed]
  33. Liu, Z.; Xu, W.; Fang, J.; Xu, X.; Wu, S.; Zhu, X.; Chen, Z. Decoration of BiOI quantum size nanoparticles with reduced graphene oxide in enhanced visible-light-driven photocatalytic studies. Appl. Surf. Sci. 2012, 259, 441–447. [Google Scholar] [CrossRef]
  34. Jiang, Y.; Ning, H.; Tian, C.; Jiang, B.; Li, Q.; Yan, H.; Zhang, X.; Wang, J.; Jing, L.; Fu, H. Single-crystal TiO2 nanorods assembly for efficient and stable cocatalyst-free photocatalytic hydrogen evolution. Appl. Catal. B Environ. 2018, 229, 1–7. [Google Scholar] [CrossRef]
  35. Chen, D.; Hao, Q.; Wang, Z.; Ding, H.; Zhu, Y. Influence of phase structure and morphology on the photocatalytic activity of bismuth molybdates. Cryst. Eng. Comm. 2016, 18, 1976–1986. [Google Scholar] [CrossRef]
  36. Ziarati, A.; Badiei, A.; Luque, R. Black hollow TiO2 nanocubes: Advanced nanoarchitectures for efficient visible light photocatalytic applications. Appl. Catal. B Environ. 2018, 238, 177–183. [Google Scholar] [CrossRef]
  37. Zhang, H.; Cai, J.; Wang, Y.; Wu, M.; Meng, M.; Tian, Y.; Li, X.; Zhang, J.; Zheng, L.; Jiang, Z. Insights into the effects of surface/bulk defects on photocatalytic hydrogen evolution over TiO2 with exposed {001} facets. Appl. Catal. B Environ. 2018, 220, 126–136. [Google Scholar] [CrossRef]
  38. Wang, J.; Yang, P.; Huang, B. Self-doped TiO2- x nanowires with enhanced photocatalytic activity: Facile synthesis and effects of the Ti3+. Appl. Surf. Sci. 2015, 356, 391–398. [Google Scholar] [CrossRef]
  39. Moradi, V.; Jun, M.B.; Blackburn, A.; Herring, R.A. Significant improvement in visible light photocatalytic activity of Fe doped TiO2 using an acid treatment process. Appl. Surf. Sci. 2018, 427, 791–799. [Google Scholar] [CrossRef]
  40. Hou, L.; Zhang, M.; Guan, Z.; Li, Q.; Yang, J. Effect of annealing ambience on the formation of surface/bulk oxygen vacancies in TiO2 for photocatalytic hydrogen evolution. Appl. Surf. Sci. 2018, 428, 640–647. [Google Scholar] [CrossRef]
  41. Wang, K.; Yao, W.; Teng, F.; Zhu, Y. Photocatalytic activity enhancement of LaPO4 via surface oxygen vacancies. RSC Adv. 2015, 5, 56711–56716. [Google Scholar] [CrossRef]
  42. Pan, J.; Dong, Z.; Wang, B.; Jiang, Z.; Zhao, C.; Wang, J.; Song, C.; Zheng, Y.; Li, C. The enhancement of photocatalytic hydrogen production via Ti3+ self-doping black TiO2/g-C3N4 hollow core-shell nano-heterojunction. Appl. Catal. B Environ. 2019, 242, 92–99. [Google Scholar] [CrossRef]
  43. Li, K.; Huang, Z.; Zeng, X.; Huang, B.; Gao, S.; Lu, J. Synergetic effect of Ti3+ and oxygen doping on enhancing photoelectrochemical and photocatalytic properties of TiO2/g-C3N4 heterojunctions. ACS Appl. Mater. Interfaces 2017, 9, 11577–11586. [Google Scholar] [CrossRef]
  44. Lv, Y.; Yao, W.; Ma, X.; Pan, C.; Zong, R.; Zhu, Y. The surface oxygen vacancy induced visible activity and enhanced UV activity of a ZnO1−x photocatalyst. Catal. Sci. Technol. 2013, 3, 3136–3146. [Google Scholar] [CrossRef]
  45. Lu, D.; Zhang, G.; Wan, Z. Visible-light-driven g-C3N4/Ti3+-TiO2 photocatalyst co-exposed {0 0 1} and {1 0 1} facets and its enhanced photocatalytic activities for organic pollutant degradation and Cr (VI) reduction. Appl. Surf. Sci. 2015, 358, 223–230. [Google Scholar] [CrossRef]
  46. Zhang, X.; Hu, W.; Zhang, K.; Wang, J.; Sun, B.; Li, H.; Qiao, P.; Wang, L.; Zhou, W. Ti3+ self-doped black TiO2 nanotubes with mesoporous nanosheet architecture as efficient solar-driven hydrogen evolution photocatalysts. ACS Sustain. Chem. Eng. 2017, 5, 6894–6901. [Google Scholar] [CrossRef]
  47. Kumar, R.; Govindarajan, S.; Siri Kiran Janardhana, R.K.; Rao, T.N.; Joshi, S.V.; Anandan, S. Facile one-step route for the development of in situ cocatalyst-modified Ti3+ self-doped TiO2 for improved visible-light photocatalytic activity. ACS Appl. Mater. Interfaces 2016, 8, 27642–27653. [Google Scholar] [CrossRef]
  48. Zhang, W.; He, H.; Tian, Y.; Lan, K.; Liu, Q.; Wang, C.; Liu, Y.; Elzatahry, A.; Che, R.; Li, W. Synthesis of uniform ordered mesoporous TiO2 microspheres with controllable phase junctions for efficient solar water splitting. Chem. Sci. 2019, 10, 1664–1670. [Google Scholar] [CrossRef] [Green Version]
  49. Zhu, Y.; Wang, Y.; Yao, W.; Zong, R.; Zhu, Y. New insights into the relationship between photocatalytic activity and TiO2-GR composites. RSC Adv. 2015, 5, 29201–29208. [Google Scholar] [CrossRef]
  50. Zhang, Y.; Cui, W.; An, W.; Liu, L.; Liang, Y.; Zhu, Y. Combination of photoelectrocatalysis and adsorption for removal of bisphenol A over TiO2-graphene hydrogel with 3D network structure. Appl. Catal. B Environ. 2018, 221, 36–46. [Google Scholar] [CrossRef]
  51. Zhang, A.-Y.; Lin, T.; He, Y.-Y.; Mou, Y.-X. Heterogeneous activation of H2O2 by defect-engineered TiO2-x single crystals for refractory pollutants degradation: A Fenton-like mechanism. J. Hazard. Mater. 2016, 311, 81–90. [Google Scholar] [CrossRef] [Green Version]
  52. Cushing, S.K.; Meng, F.; Zhang, J.; Ding, B.; Chen, C.K.; Chen, C.-J.; Liu, R.-S.; Bristow, A.D.; Bright, J.; Zheng, P. Effects of defects on photocatalytic activity of hydrogen-treated titanium oxide nanobelts. ACS Catal. 2017, 7, 1742–1748. [Google Scholar] [CrossRef]
  53. Wan, J.; Chen, W.; Jia, C.; Zheng, L.; Dong, J.; Zheng, X.; Wang, Y.; Yan, W.; Chen, C.; Peng, Q. Defect effects on TiO2 nanosheets: Stabilizing single atomic site Au and promoting catalytic properties. Adv. Mater. 2018, 30, 1705369. [Google Scholar] [CrossRef]
  54. Liu, Q.; Wang, F.; Lin, H.; Xie, Y.; Tong, N.; Lin, J.; Zhang, X.; Zhang, Z.; Wang, X. Surface oxygen vacancy and defect engineering of WO3 for improved visible light photocatalytic performance. Catal. Sci. Technol. 2018, 8, 4399–4406. [Google Scholar] [CrossRef]
  55. Liu, D.; Lv, Y.; Zhang, M.; Liu, Y.; Zhu, Y.; Zong, R.; Zhu, Y. Defect-related photoluminescence and photocatalytic properties of porous ZnO nanosheets. J. Mater. Chem. A 2014, 2, 15377–15388. [Google Scholar] [CrossRef]
  56. Liqiang, J.; Yichun, Q.; Baiqi, W.; Shudan, L.; Baojiang, J.; Libin, Y.; Wei, F.; Honggang, F.; Jiazhong, S. Review of photoluminescence performance of nano-sized semiconductor materials and its relationships with photocatalytic activity. Sol. Energy Mater. Sol. Cell. 2006, 90, 1773–1787. [Google Scholar] [CrossRef]
  57. Perera, S.D.; Mariano, R.G.; Vu, K.; Nour, N.; Seitz, O.; Chabal, Y.; Balkus, K.J., Jr. Hydrothermal synthesis of graphene-TiO2 nanotube composites with enhanced photocatalytic activity. ACS Catal. 2012, 2, 949–956. [Google Scholar] [CrossRef]
  58. Li, X.; Gao, C.; Wang, J.; Lu, B.; Chen, W.; Song, J.; Zhang, S.; Zhang, Z.; Pan, X.; Xie, E. TiO2 films with rich bulk oxygen vacancies prepared by electrospinning for dye-sensitized solar cells. J. Power Sources. 2012, 214, 244–250. [Google Scholar] [CrossRef]
  59. Jiang, X.; Zhang, Y.; Jiang, J.; Rong, Y.; Wang, Y.; Wu, Y.; Pan, C. Characterization of oxygen vacancy associates within hydrogenated TiO2: A positron annihilation study. J. Phys. Chem. C 2012, 116, 22619–22624. [Google Scholar] [CrossRef]
  60. Hamandi, M.; Berhault, G.; Guillard, C.; Kochkar, H. Reduced graphene oxide/TiO2 nanotube composites for formic acid photodegradation. Appl. Catal. B Environ. 2017, 209, 203–213. [Google Scholar] [CrossRef]
  61. Gao, H.; Hu, G.; Sui, J.; Mu, C.; Shangguan, W.; Kong, M.; Shentu, W. Scalable preparation of defect-rich free-standing TiO2 sheets with visible-light photocatalytic activity. Appl. Catal. B Environ. 2018, 226, 337–345. [Google Scholar] [CrossRef]
  62. Liqiang, J.; Xiaojun, S.; Baifu, X.; Baiqi, W.; Weimin, C.; Honggang, F. The preparation and characterization of La doped TiO2 nanoparticles and their photocatalytic activity. J. Solid State Chem. 2004, 177, 3375–3382. [Google Scholar] [CrossRef]
  63. Zhang, X.; Xiao, J.; Peng, C.; Xiang, Y.; Chen, H. Enhanced photocatalytic hydrogen production over conjugated polymer/black TiO2 hybrid: The impact of constructing active defect states. Appl. Surf. Sci. 2019, 465, 288–296. [Google Scholar] [CrossRef]
Figure 1. Transmission electron microscopy images of (a) TiO2, (b) TiO2-3, (c) TiO2-12, (d) TiO2-24, (e) TiO2-48.
Nanomaterials 10 00546 g001
Figure 2. N2 adsorption-desorption isotherm of (a) pristine TiO2, (b) TiO2-3, (c) TiO2-12, (d) TiO2-24, (e) TiO2-48. Inset figures are the corresponding pore size distribution. (f) XRD patterns of TiO2, TiO2-3, TiO2-12, TiO2-24, TiO2-48.
Nanomaterials 10 00546 g002
Figure 3. XPS spectra of the (a) Ti 2p band of TiO2, TiO2-3, TiO2-12, TiO2-24, TiO2-48, (b) O 1s band of TiO2, TiO2-3, TiO2-12, TiO2-24, TiO2-48, (c) Ti 2p band of TiO2-24 and (d) O 1s band of TiO2-24.
Nanomaterials 10 00546 g003
Figure 4. UV-Vis diffuse reflectance spectra (a) and bandgap energy (b) of TiO2-X.
Nanomaterials 10 00546 g004
Figure 5. Photocatalytic degradation of Rhodamine B (a) and Sulfadiazine (b) over different photocatalysts under visible light irradiation; (c) three-cycle photocatalytic degradation of Rhodamine B over TiO2-24.
Nanomaterials 10 00546 g005
Figure 6. (a) Free radical trapping test of hydroxyl radicals, superoxide radicals and holes over TiO2-24; Electron spin resonance spectra of radical in TiO2-24 under visible light: (b) DMPO-·OH and (c) DMPO-O2•− (d) h+.
Nanomaterials 10 00546 g006
Figure 7. Photoluminescence spectra of TiO2-X.
Nanomaterials 10 00546 g007
Scheme 1. Schematic image of different sized TiO2 nanoparticles.
Nanomaterials 10 00546 sch001
Table 1. The specific surface area (SBET), pore size and pore volume, band gap (Eg) and crystalline size (dXRD) of TiO2-X.
SampleSBET 1 (m2/g)Pore Volume 2 (cm3/g)Pore Diameter 2 (nm)Eg 3 (eV)dXRD 4 (nm)
TiO213.0600.0351.3353.2712.96
TiO2-323.1640.0991.1493.267.92
TiO2-1259.7420.1021.3363.163.94
TiO2-2478.8880.3121.1453.423.44
TiO2-481.5920.0022.5923.093.04
1 The specific surface area (SBET) was calculated by a Brunauer-Emmett-Teller (BET) method using the adsorption data in relative pressure (P/P0) range from 0.04 to 0.3. 2 Pore volume and pore diameter were calculated by nitrogen adsorption volume at P/P0 = 0.99 using Barrett-Joyner-Halenda (BJH) method. 3 The band gap energies (Eg) can be calculated from the plots of (αhv)1/2 versus photon energy. 4 Average crystalline size (dXRD) of TiO2 was calculated by the anatase (101) plane of XRD using the Scherrer equation.

