Effect of Carbon Support, Capping Agent Amount, and Pd NPs Size for Bio-Adipic Acid Production from Muconic Acid and Sodium Muconate

 ,
, 
 ,
,  ,
,  ,
,  and
and 
Abstract
1. Introduction
2. Materials and Methods
2.1. Catalyst Synthesis
2.2. Hydrogenation Reaction
2.3. Catalyst Characterization
3. Results
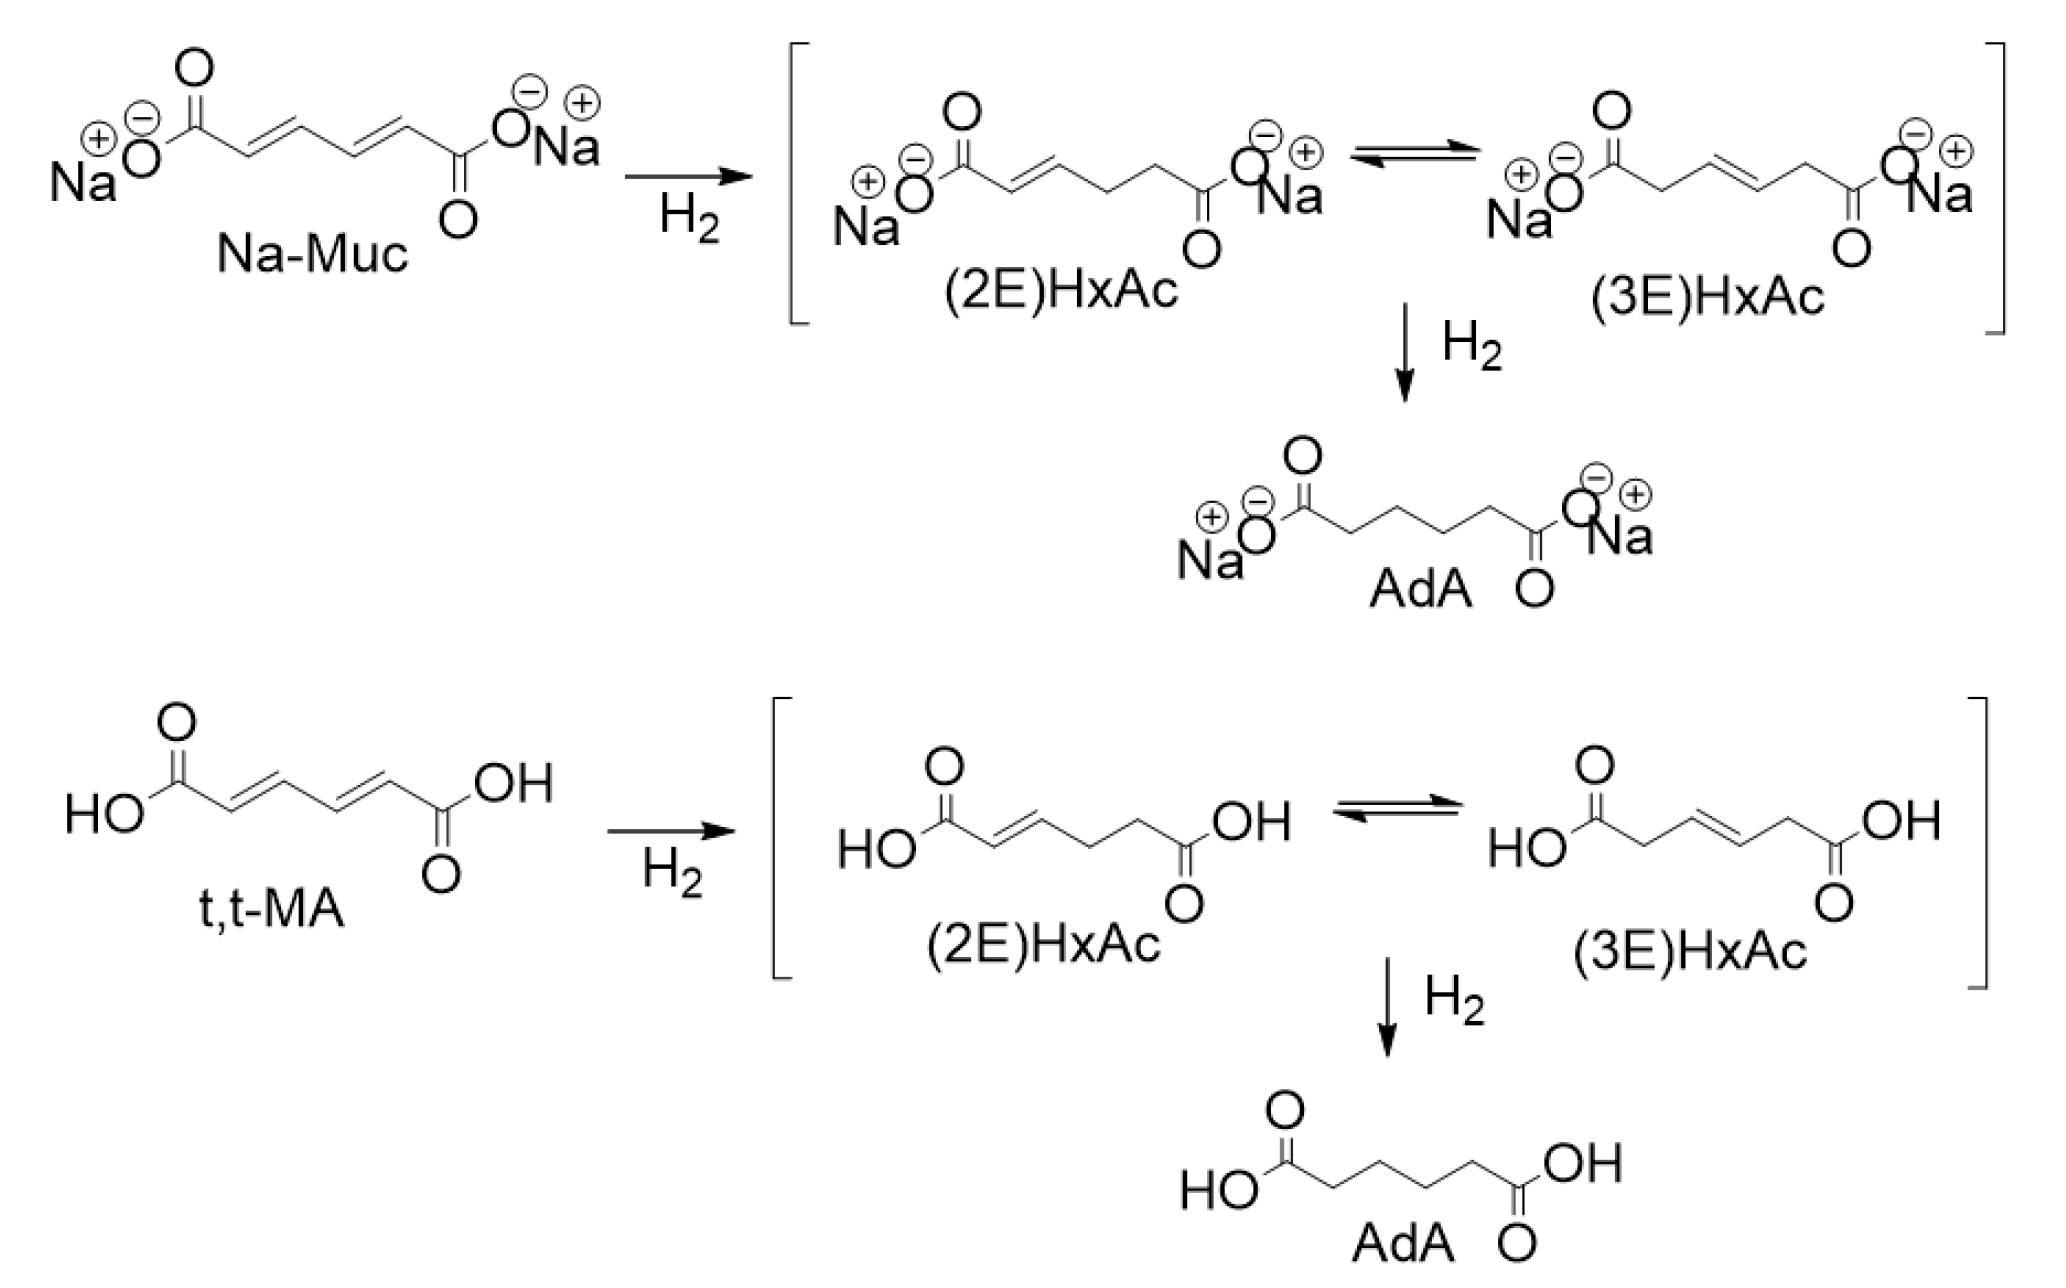
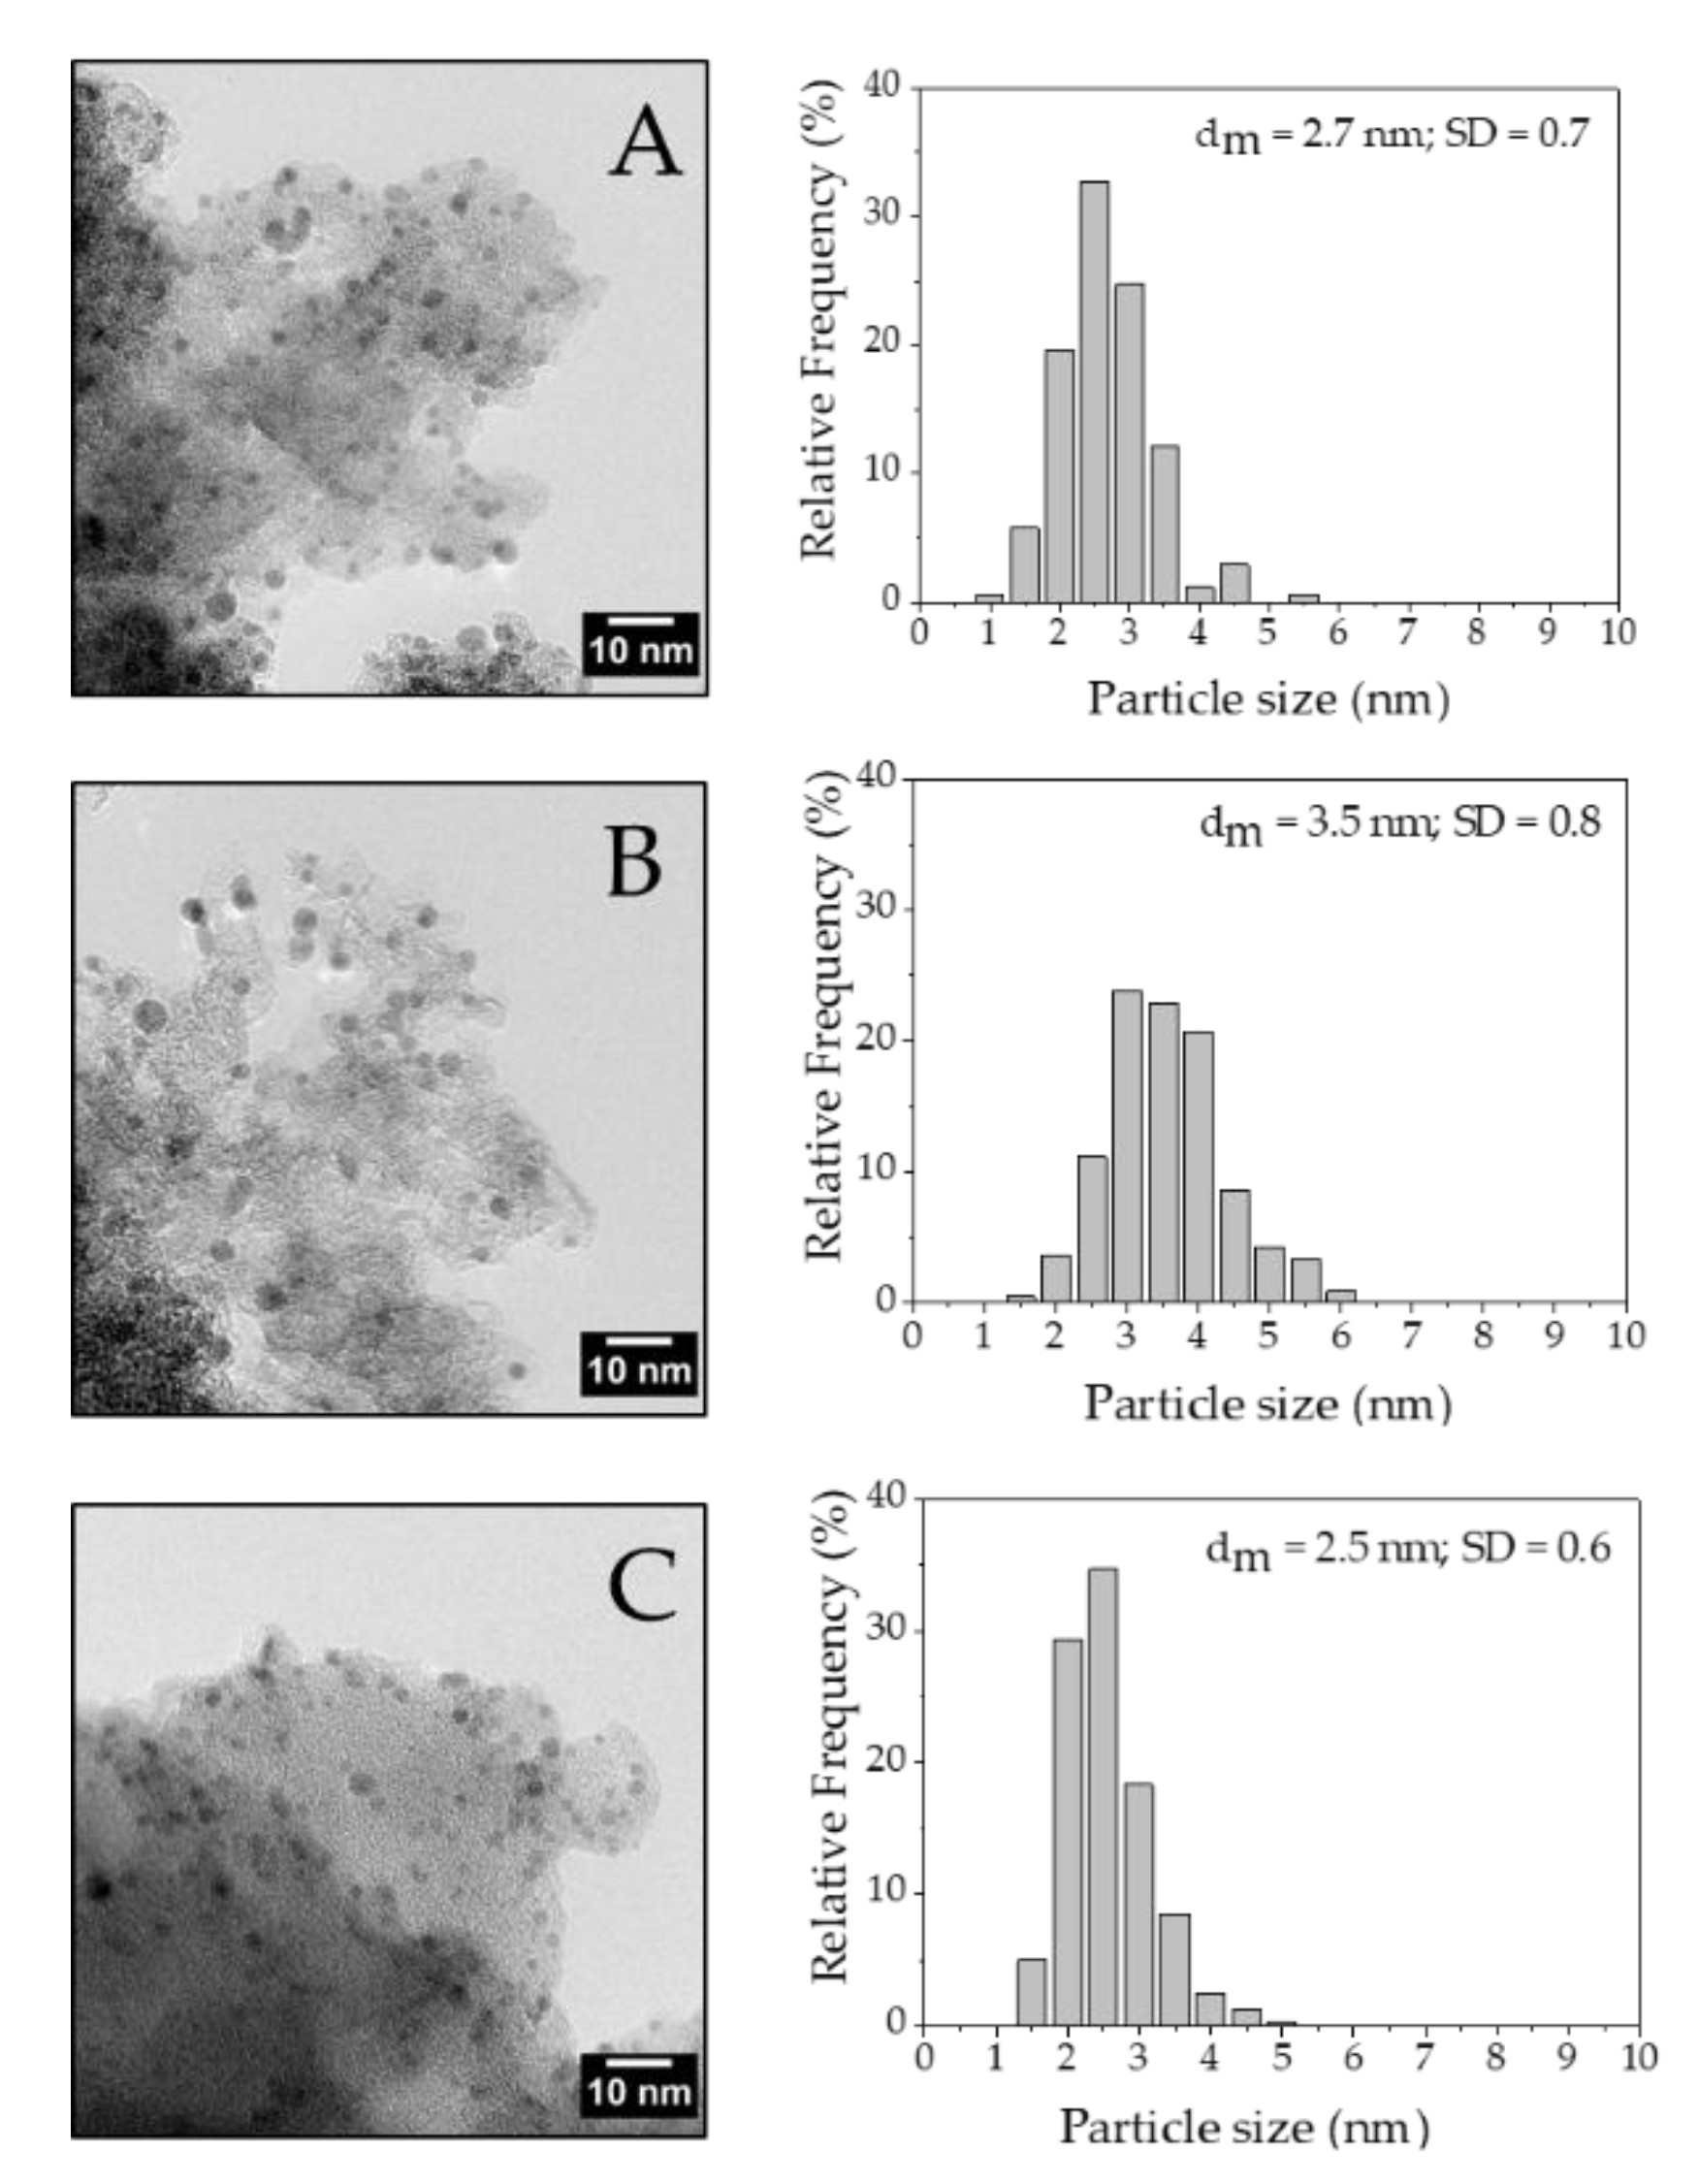
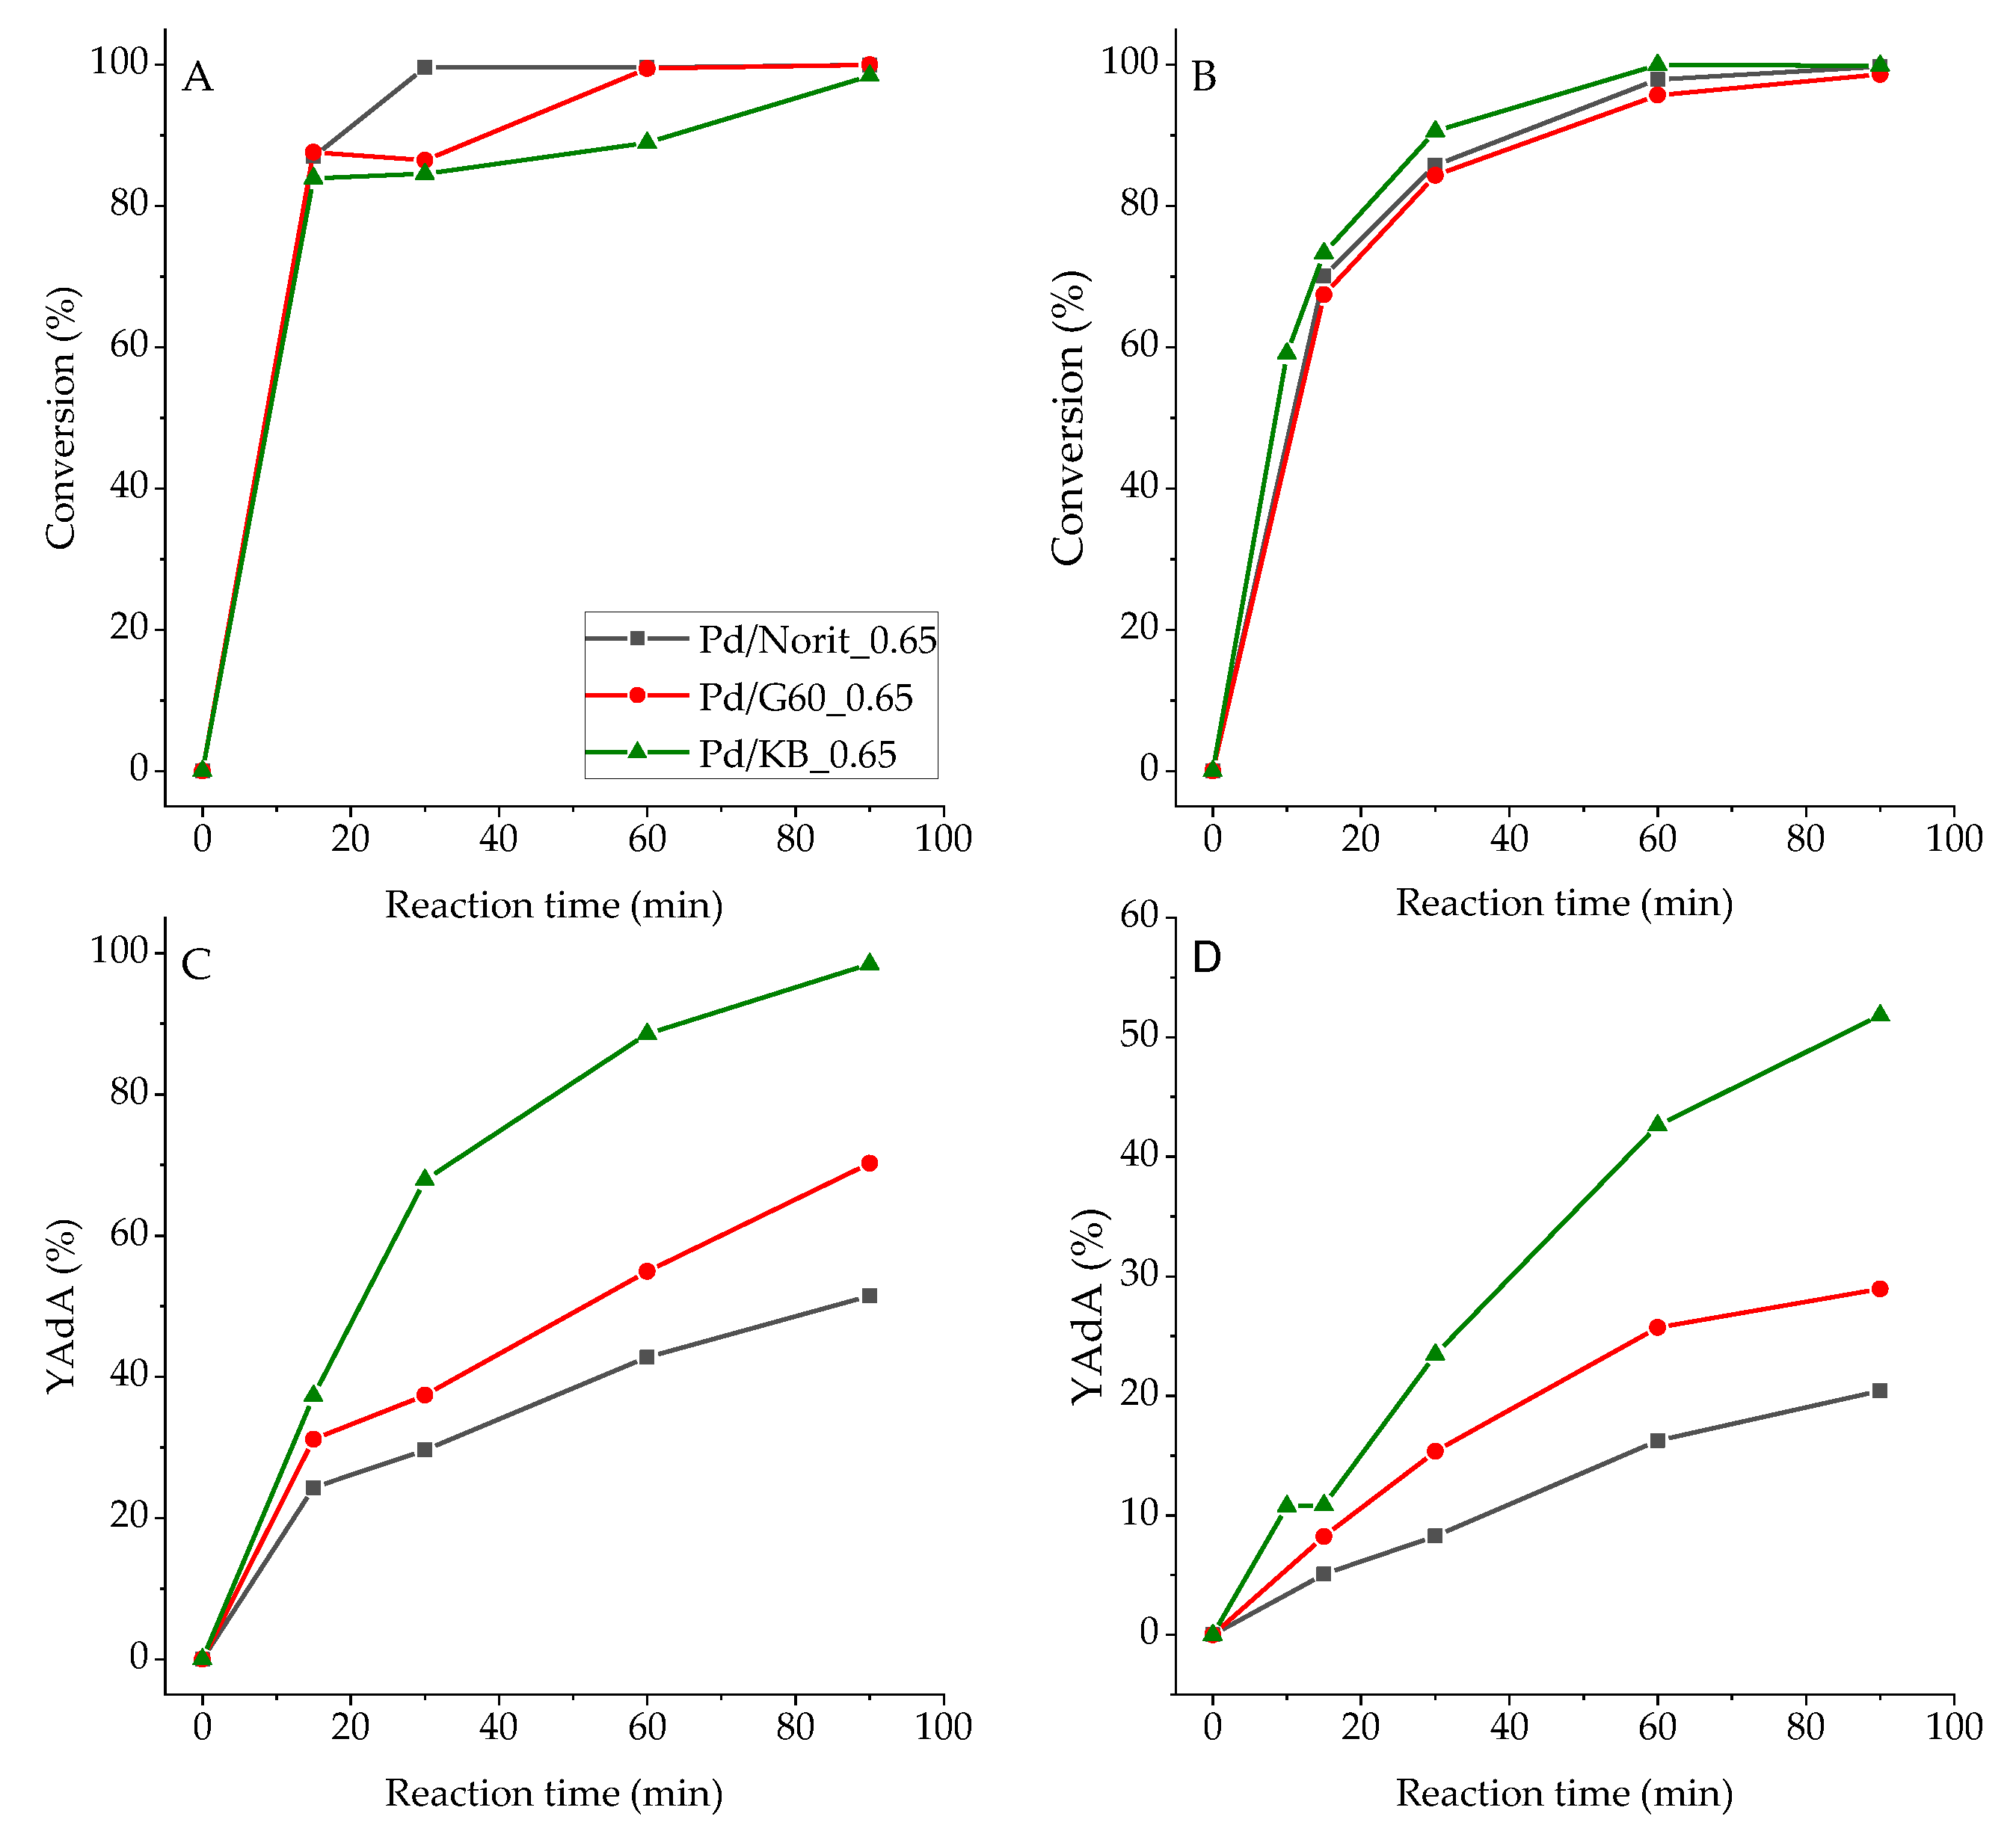
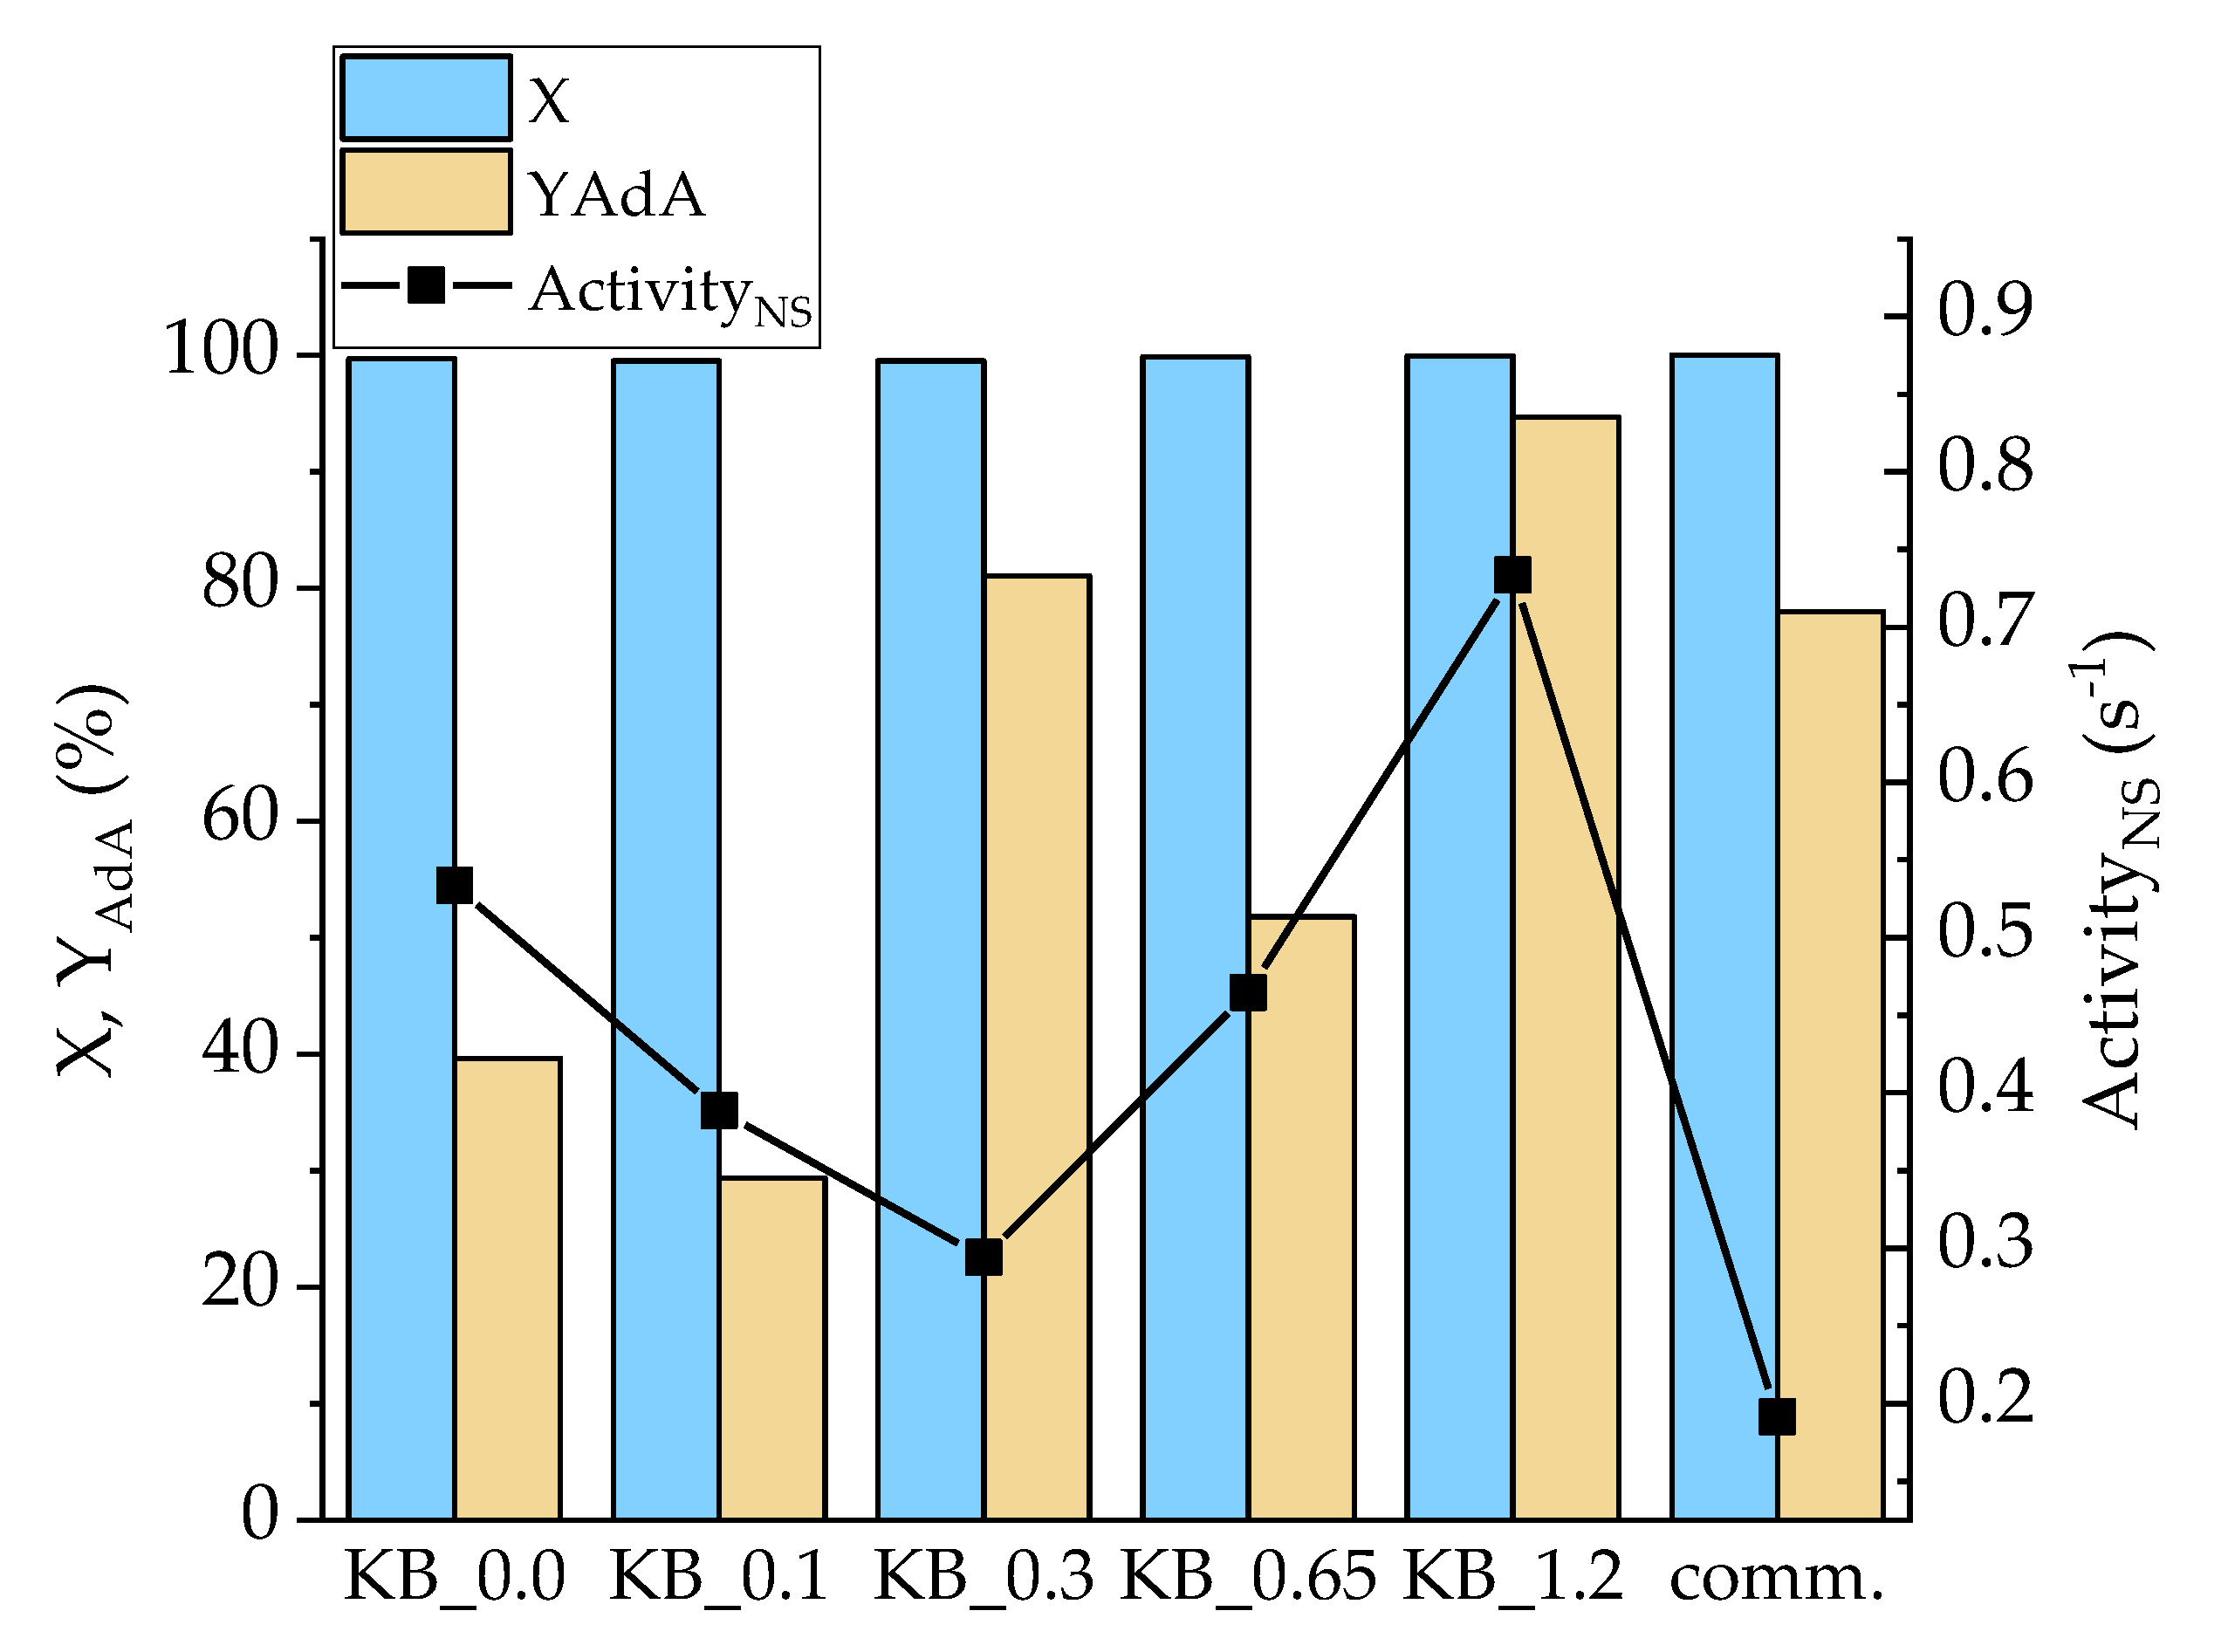
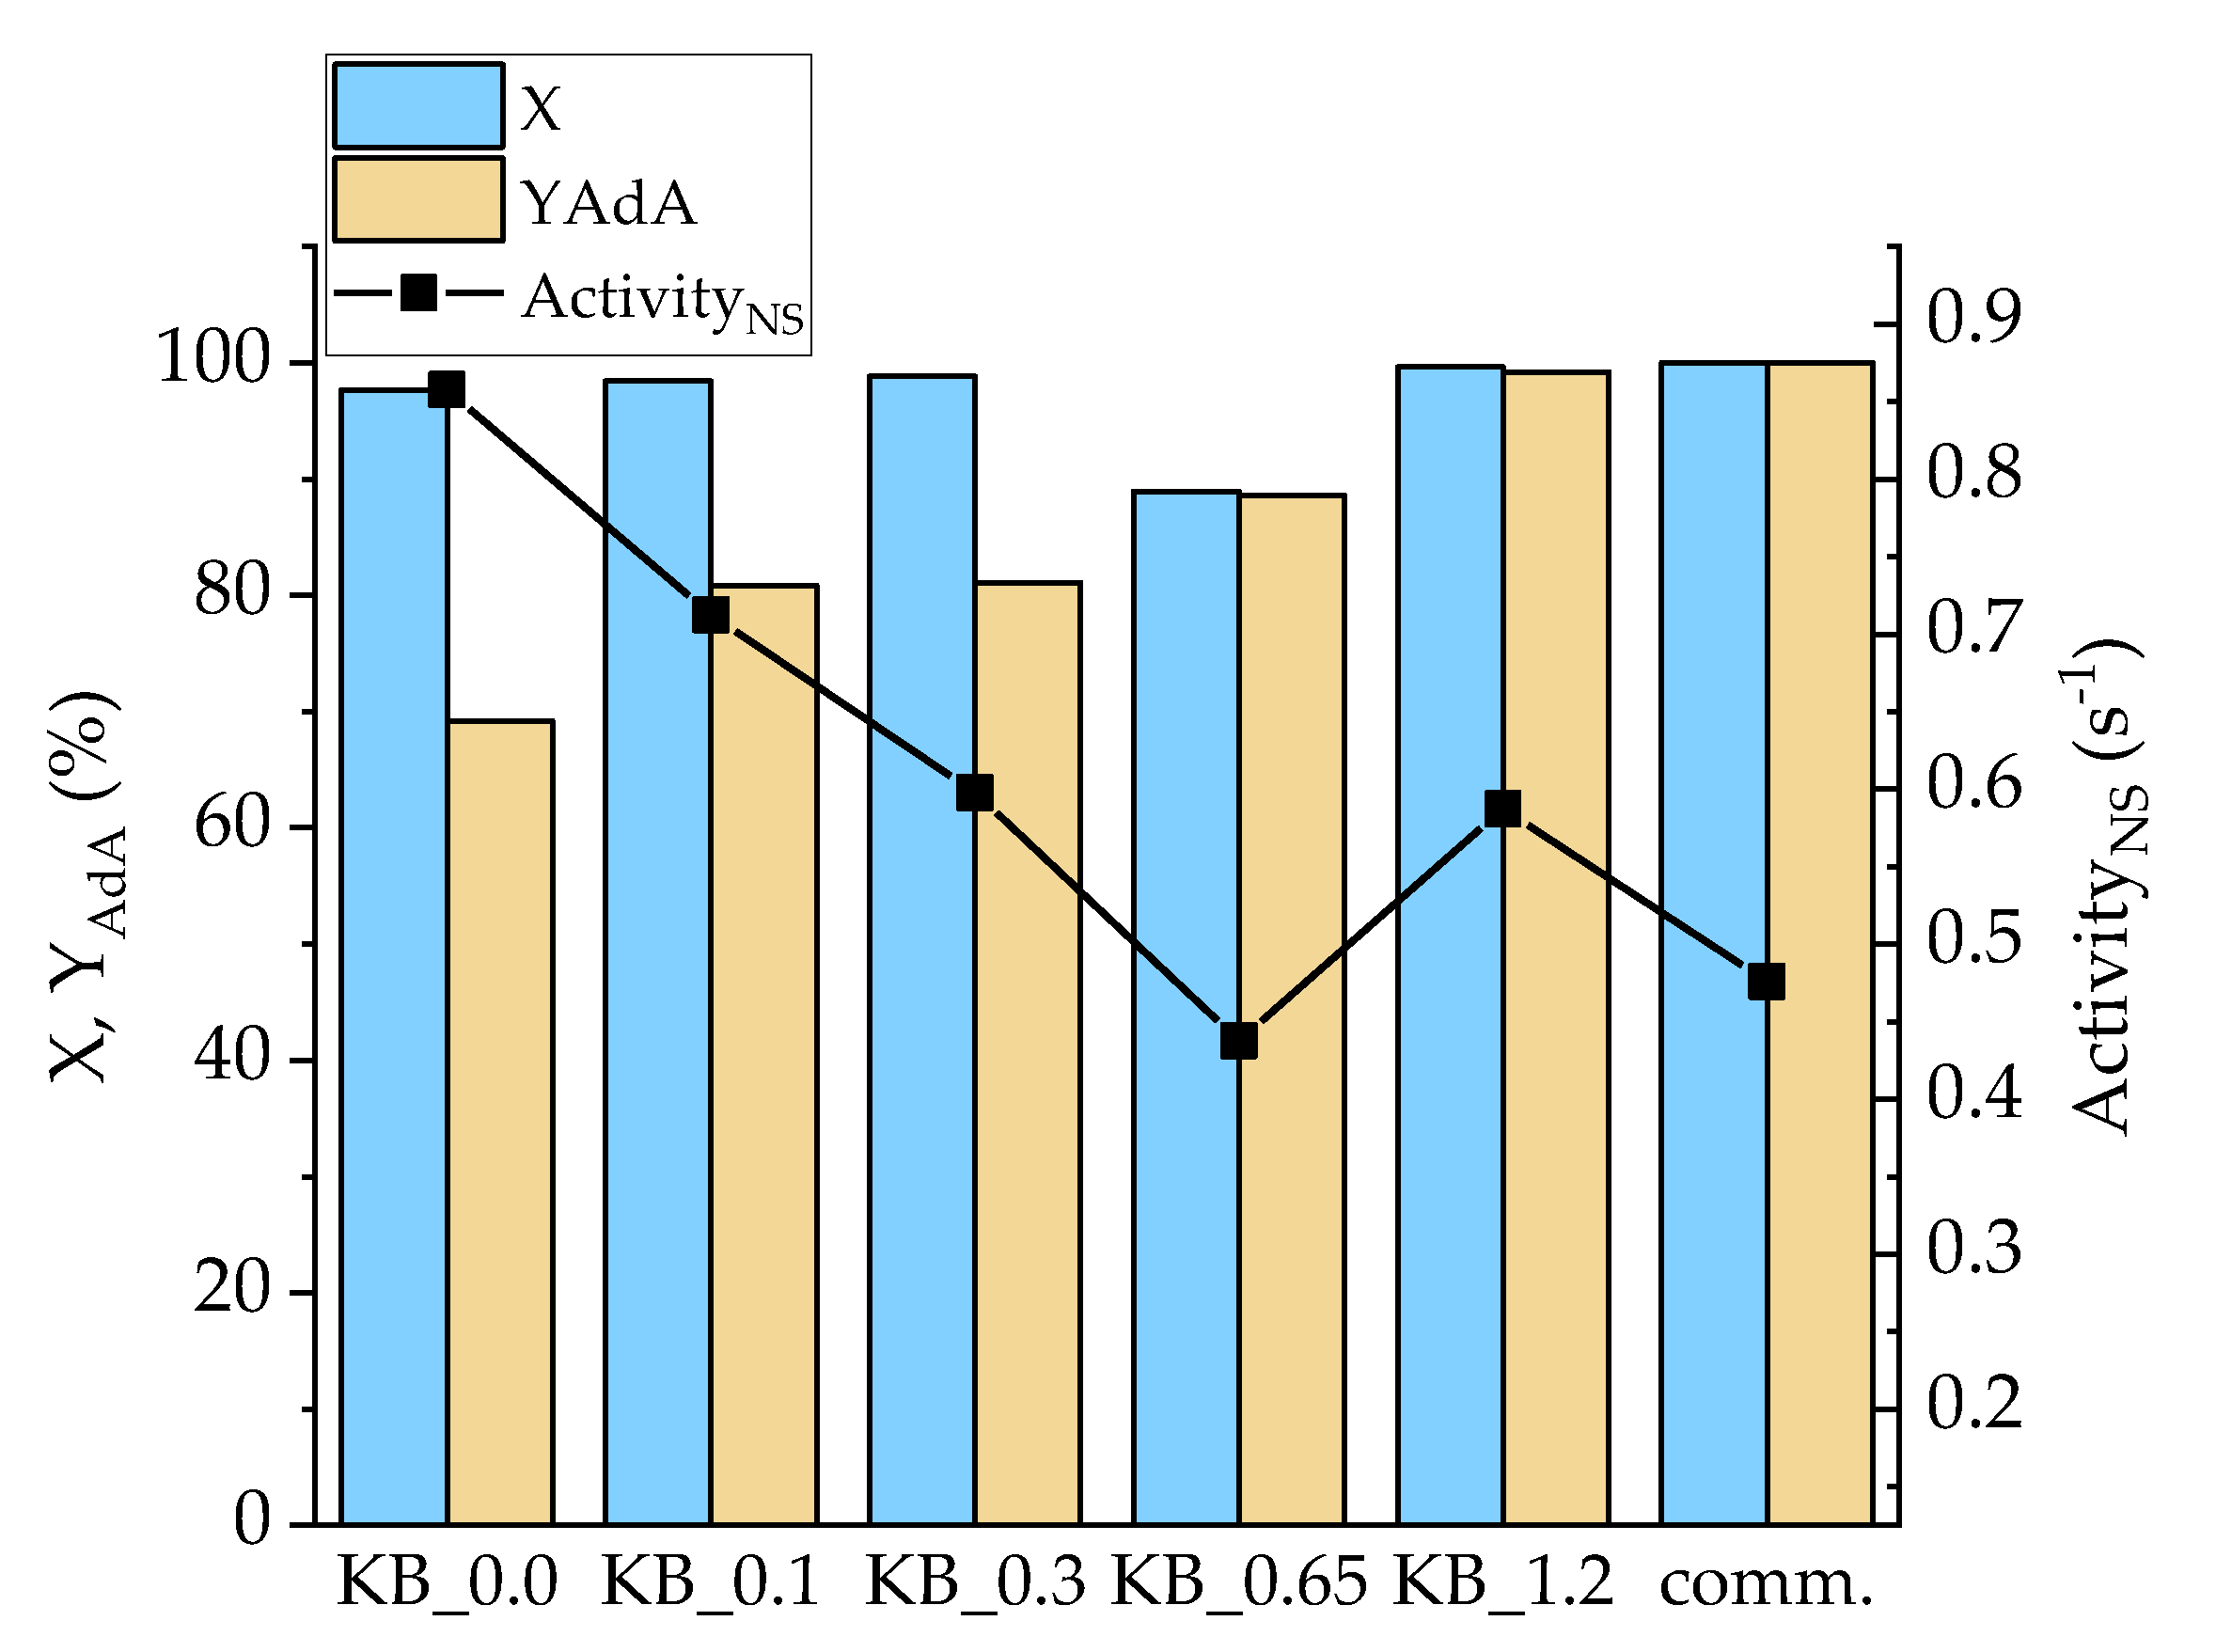
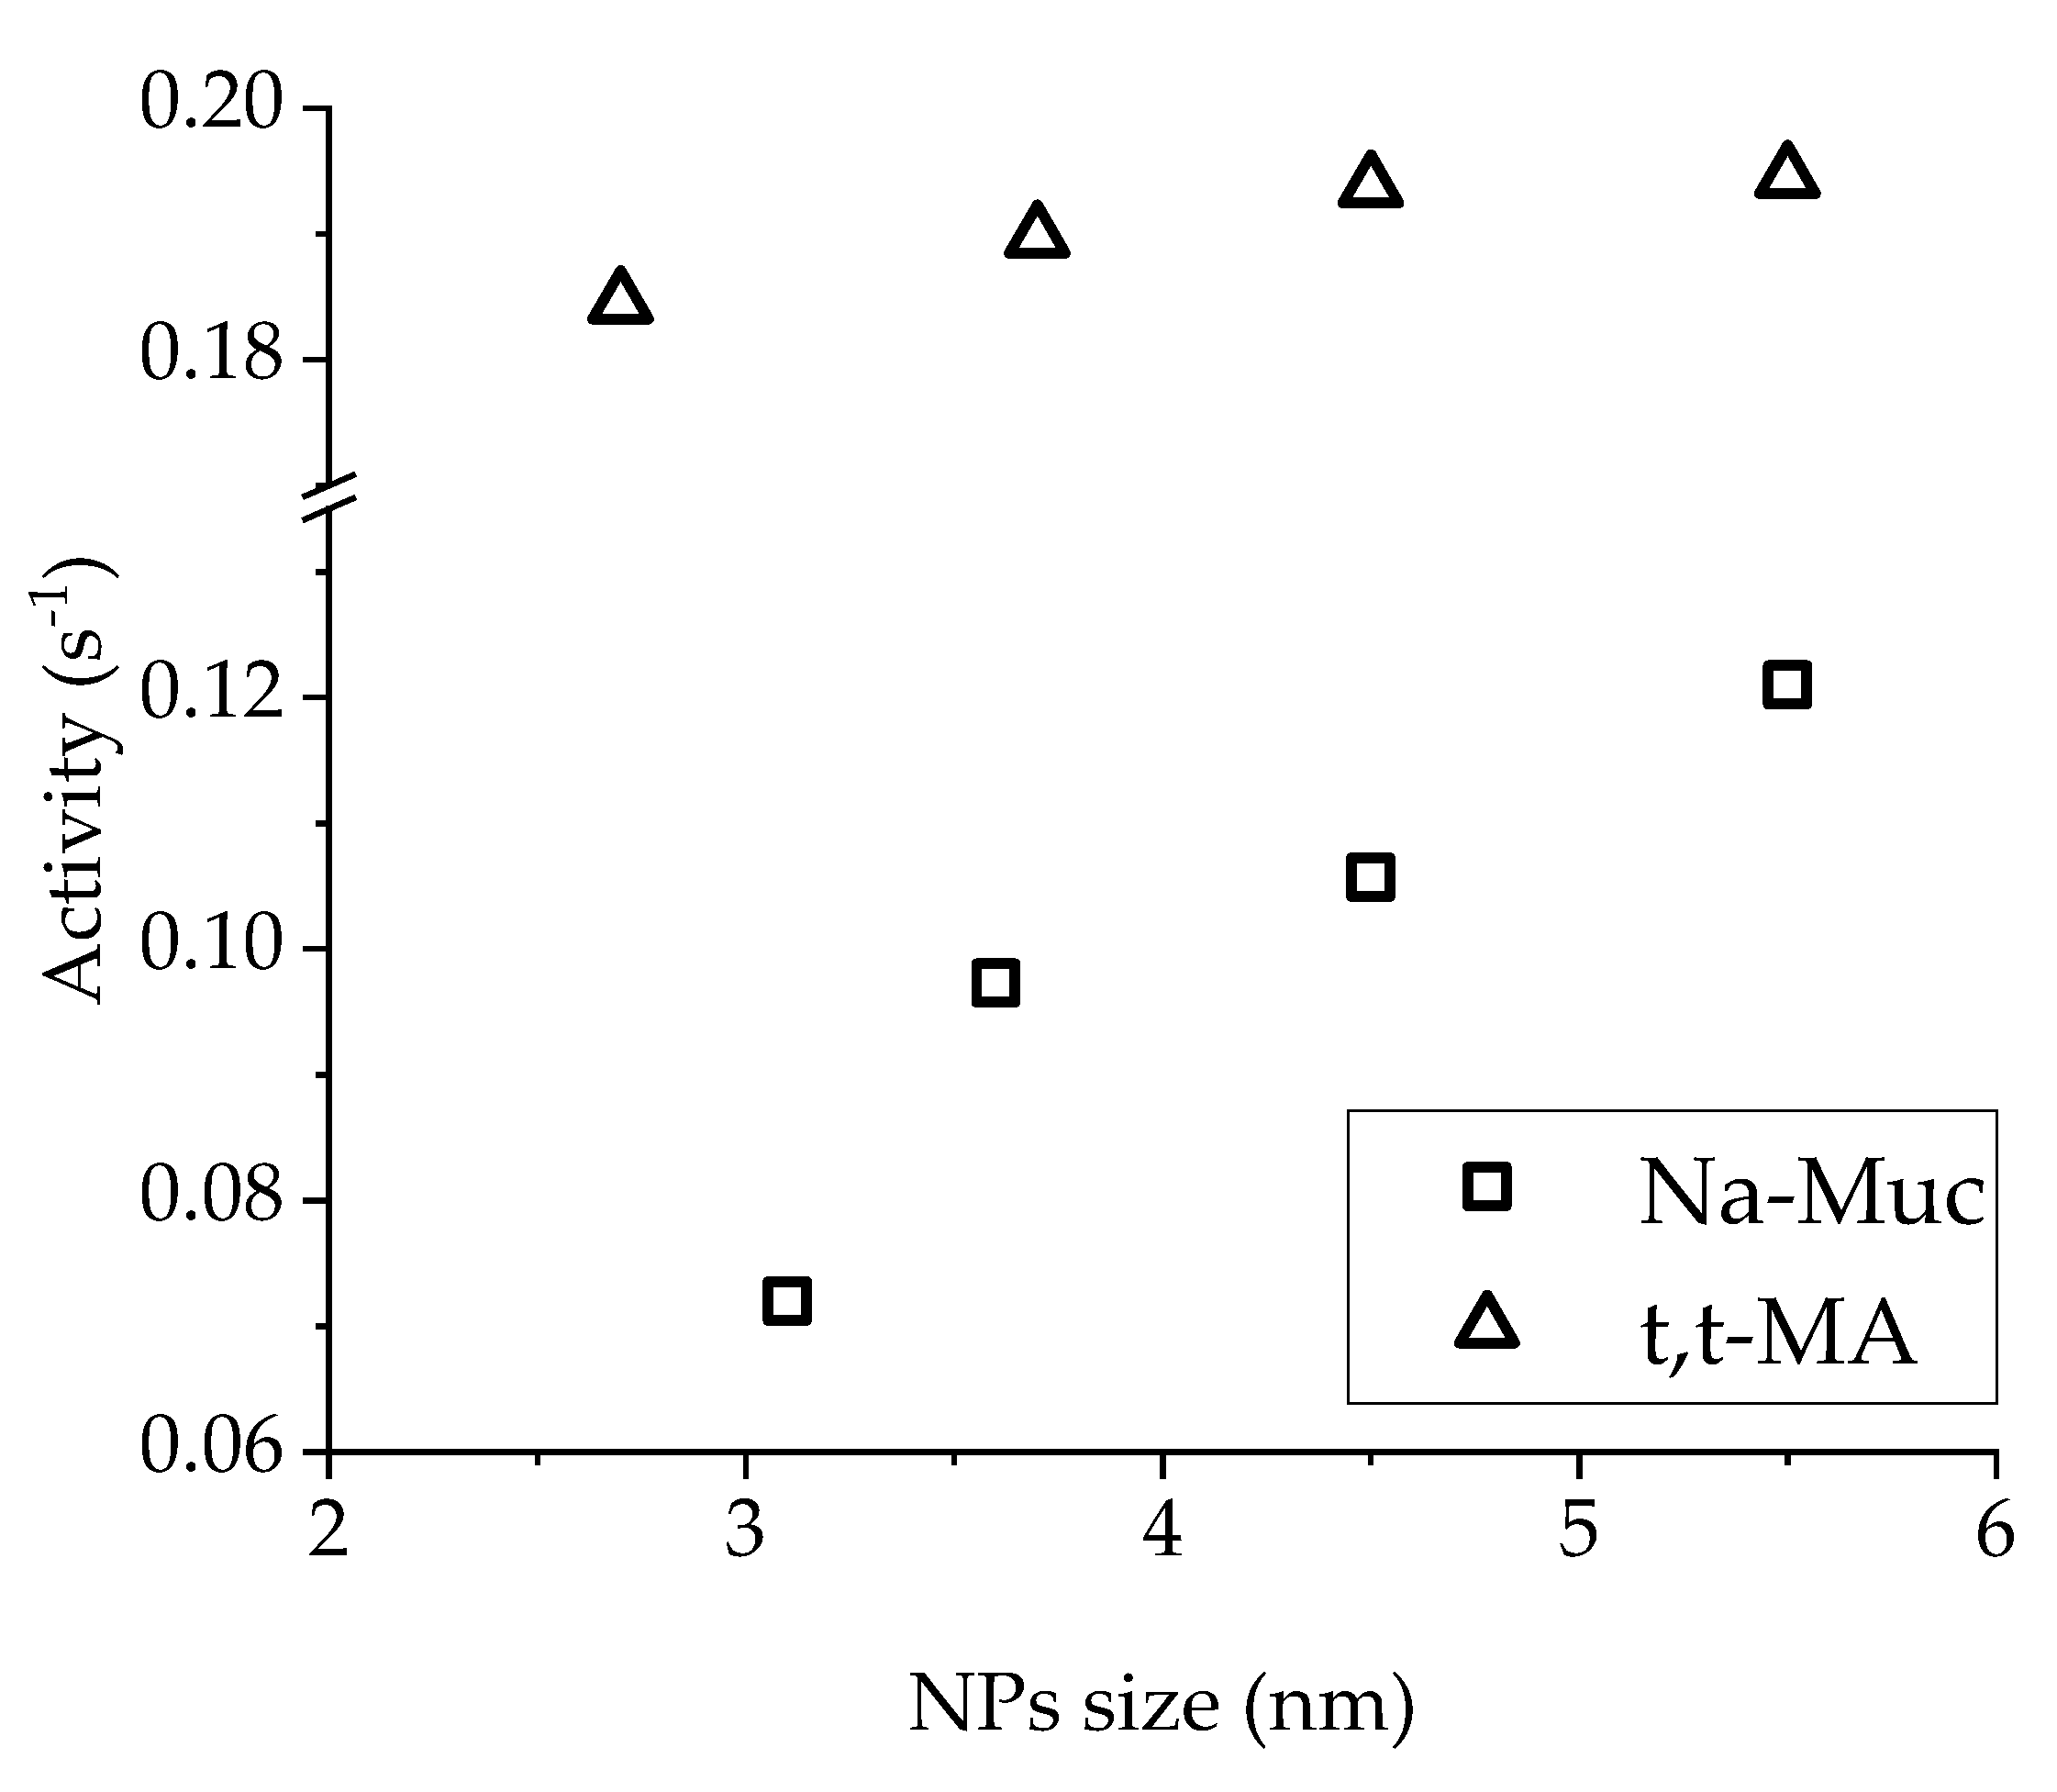
3.1. Support Effect
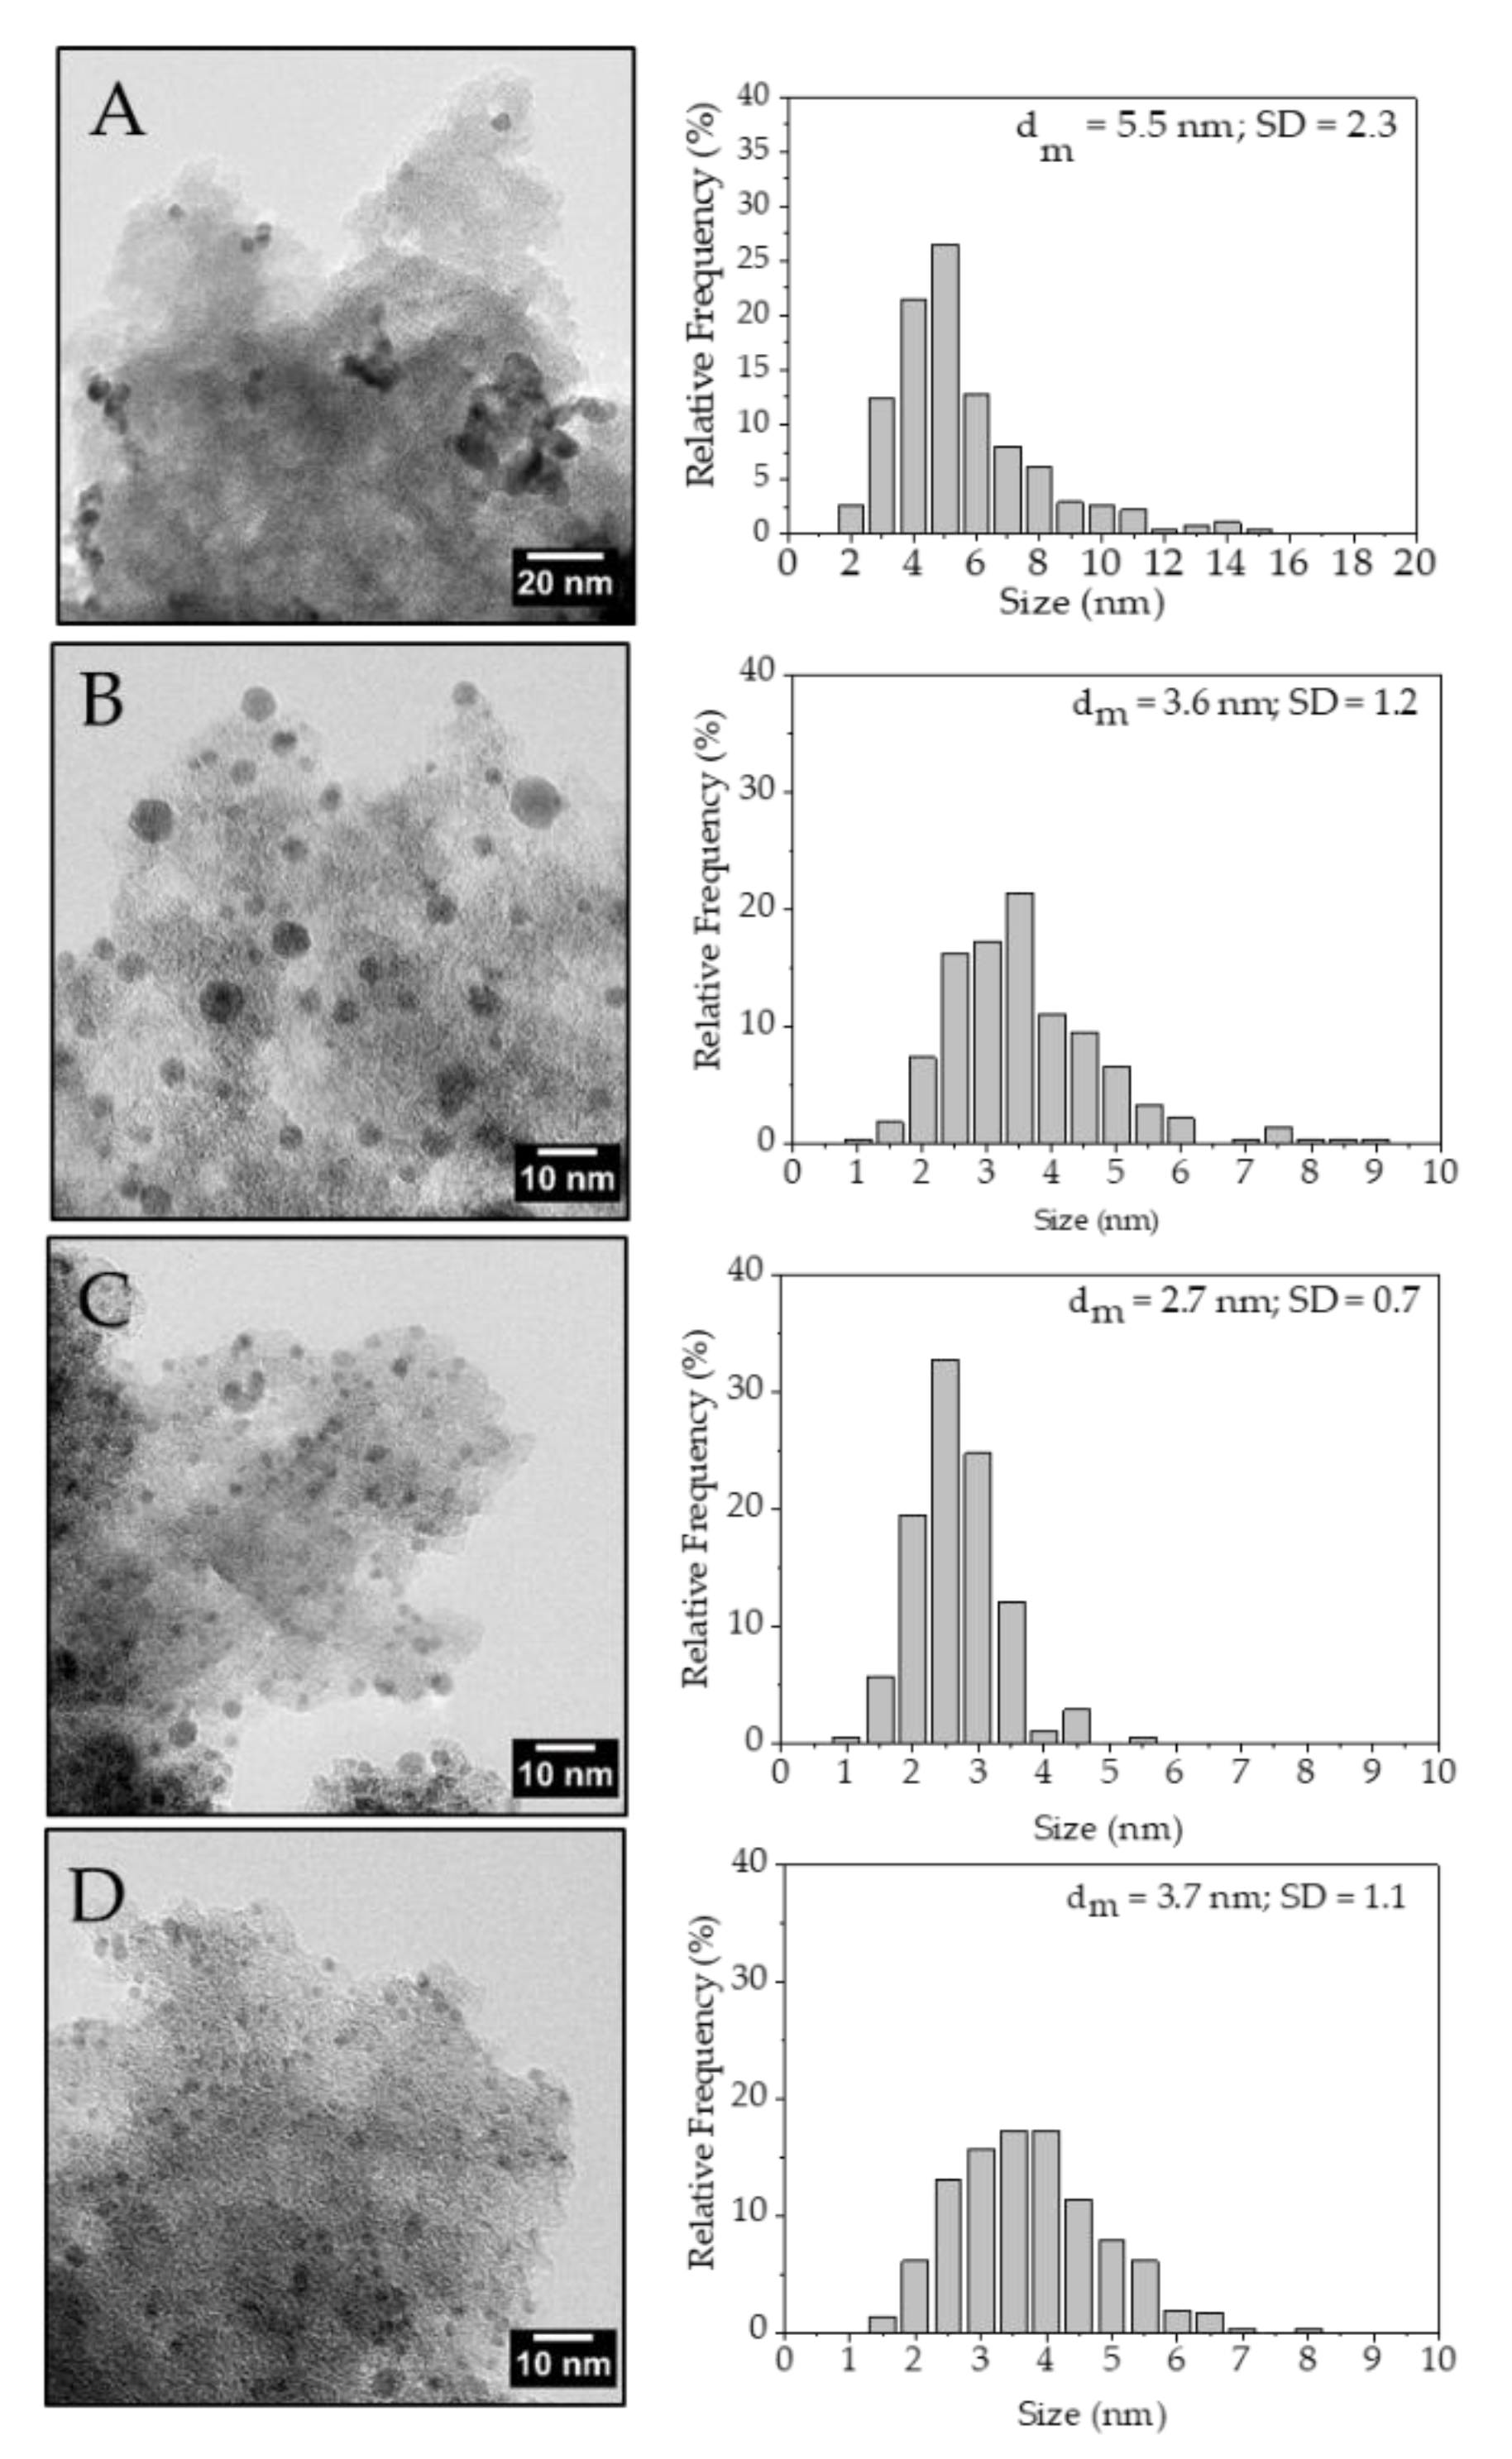
3.2. Influence of PVA Amount
4. Conclusions
Supplementary Materials
Author Contributions
Funding
Conflicts of Interest
References
- Thiemens, M.H.; Trogler, W.C. Nylon Production: An Unknown Source of Atmospheric Nitrous Oxide. Science 1991, 251, 932–934. [Google Scholar] [CrossRef] [PubMed]
- Arvanitoyannis, I.; Psomiadou, E.; Yamamoto, N.; Nikolaou, E.; Blanshard, J.M.V. Novel Copolyamides Based on Adipic Acid, 1,6-Hexanediamine and α-Amino Acids: 2. Study of Properties and Their Biodegradability for Food-Packaging Applications. Polymer 1995, 36, 2957–2967. [Google Scholar] [CrossRef]
- Hugl, H.; Gürtler, C. Chemical Industry Reduces Emissions–from Production to the Consumer. Chemosphere 2001, 43, 17–20. [Google Scholar] [CrossRef]
- Adipic Acid Market Size, Share & Trends Analysis Report by Application (Nylon 66 Fiber, Nylon 66 Resin, Polyurethane, Adipate Ester), by Region (APAC, North America, Europe, MEA, CSA), and Segment Forecasts, 2018–2024. Available online: https://www.grandviewresearch.com/industry-analysis/adipic-acid-market (accessed on 1 July 2018).
- Luedeke, V.D. Adipic Acid. In Encyclopedia of Chemical Processing and Design; McKetta, J.J., Cunningham, W.A., Eds.; Marcel Dekker, Inc.: New York, NY, USA, 1977; pp. 128–146. [Google Scholar]
- Jevtovic-Todorovic, V.; Beals, J.; Benshoff, N.; Olney, J.W. Prolonged Exposure to Inhalational Anesthetic Nitrous Oxide Kills Neurons in Adult Rat Brain. Neuroscience 2003, 122, 609–616. [Google Scholar] [CrossRef] [PubMed]
- Jay, M. Nitrous Oxide: Recreational Use, Regulation and Harm Reduction. Drugs Alcohol. Today 2008, 8, 22–25. [Google Scholar] [CrossRef]
- Johnson, C.W.; Salvachua, D.; Khanna, P.; Smith, H.; Peterson, D.J.; Beckham, G.T.; Salvachúa, D.; Khanna, P.; Smith, H.; Peterson, D.J.; et al. Enhancing Muconic Acid Production from Glucose and Lignin-Derived Aromatic Compounds via Increased Protocatechuate Decarboxylase Activity. Metab. Eng. Commun. 2016, 3, 111–119. [Google Scholar] [CrossRef]
- Kaneko, A.; Ishii, Y.; Kirimura, K. High-Yield Production of Cis, Cis-Muconic Acid from Catechol in Aqueous Solution by Biocatalyst. Chem. Lett. 2011, 40, 381–383. [Google Scholar] [CrossRef]
- Polen, T.; Spelberg, M.; Bott, M. Toward Biotechnological Production of Adipic Acid and Precursors from Biorenewables. J. Biotechnol. 2013, 167, 75–84. [Google Scholar] [CrossRef]
- Sengupta, S.; Jonnalagadda, S.; Goonewardena, L.; Juturu, V. Metabolic Engineering of a Novel Muconic Acid Biosynthesis Pathway via 4-Hydroxybenzoic Acid in Escherichia Coli. Appl. Environ. Microbiol. 2015, 81, 1837–1843. [Google Scholar] [CrossRef]
- Kruyer, N.S.; Peralta-Yahya, P. Metabolic Engineering Strategies to Bio-Adipic Acid Production. Curr. Opin. Biotechnol. 2017, 45, 136–143. [Google Scholar] [CrossRef]
- Capelli, S.; Rosengart, A.; Villa, A.; Citterio, A.; Di Michele, A.; Bianchi, C.L.L.; Prati, L.; Pirola, C. Bio-Adipic Acid Production by Catalysed Hydrogenation of Muconic Acid in Mild Operating Conditions. Appl. Catal. B Environ. 2017, 218, 220–229. [Google Scholar] [CrossRef]
- Vardon, D.R.; Franden, M.A.; Johnson, C.W.; Karp, E.M.; Guarnieri, M.T.; Linger, J.G.; Salm, M.J.; Strathmann, T.J.; Beckham, G.T. Adipic Acid Production from Lignin. Energy Environ. Sci. 2015, 8, 617–628. [Google Scholar] [CrossRef]
- She, X.; Brown, H.M.; Zhang, X.; Ahring, B.K.; Wang, Y. Selective Hydrogenation of Trans, Trans-Muconic Acid to Adipic Acid over a Titania-Supported Rhenium Catalyst. ChemSusChem 2011, 4, 1071–1073. [Google Scholar] [CrossRef] [PubMed]
- Niu, W.; Draths, K.M.M.; Frost, J.W.W. Benzene-Free Synthesis of Adipic Acid. Biotechnol. Prog. 2002, 18, 201–211. [Google Scholar] [CrossRef]
- Lan, L.; Liu, Y.; Liu, S.; Ma, X.; Li, X.; Dong, Z.; Xia, C. Effect of the Supports on Catalytic Activity of Pd Catalysts for Liquid-Phase Hydrodechlorination/Hydrogenation Reaction. Environ. Technol. 2019, 40, 1615–1623. [Google Scholar] [CrossRef]
- Mironenko, R.M.; Belskaya, O.B.; Gulyaeva, T.I.; Nizovskii, A.I.; Kalinkin, A.V.; Bukhtiyarov, V.I.; Lavrenov, A.V.; Likholobov, V.A. Effect of the Nature of Carbon Support on the Formation of Active Sites in Pd/C and Ru/C Catalysts for Hydrogenation of Furfural. Catal. Today 2015, 249, 145–152. [Google Scholar] [CrossRef]
- Li, D.; Wang, C.; Tripkovic, D.; Sun, S.; Markovic, N.M.; Stamenkovic, V.R. Surfactant Removal for Colloidal Nanoparticles from Solution Synthesis: The Effect on Catalytic Performance. ACS Catal. 2012, 2, 1358–1362. [Google Scholar] [CrossRef]
- Alijani, S.; Capelli, S.; Cattaneo, S.; Schiavoni, M.; Evangelisti, C.; Mohammed, K.M.H.; Wells, P.P.; Tessore, F.; Villa, A. Capping Agent Effect on Pd-Supported Nanoparticles in the Hydrogenation of Furfural. Catalysts 2019, 10, 11. [Google Scholar] [CrossRef]
- Niu, Z.; Li, Y. Removal and Utilization of Capping Agents in Nanocatalysis. Chem. Mater. 2014, 26, 72–83. [Google Scholar] [CrossRef]
- Zhong, R.-Y.; Sun, K.-Q.; Hong, Y.-C.; Xu, B.-Q. Impacts of Organic Stabilizers on Catalysis of Au Nanoparticles from Colloidal Preparation. ACS Catal. 2014, 4, 3982–3993. [Google Scholar] [CrossRef]
- Schoenbaum, C.A.; Schwartz, D.K.; Medlin, J.W. Controlling the Surface Environment of Heterogeneous Catalysts Using Self-Assembled Monolayers. Acc. Chem. Res. 2014, 47, 1438–1445. [Google Scholar] [CrossRef] [PubMed]
- Marshall, S.T.; O’Brien, M.; Oetter, B.; Corpuz, A.; Richards, R.M.; Schwartz, D.K.; Medlin, J.W. Controlled Selectivity for Palladium Catalysts Using Self-Assembled Monolayers. Nat. Mater. 2010, 9, 853. [Google Scholar] [CrossRef] [PubMed]
- Park, J.Y.; Aliaga, C.; Renzas, J.R.; Lee, H.; Somorjai, G.A. The Role of Organic Capping Layers of Platinum Nanoparticles in Catalytic Activity of CO Oxidation. Catal. Lett. 2009, 129, 1–6. [Google Scholar] [CrossRef]
- Villa, A.; Veith, G.M.; Ferri, D.; Weidenkaff, A.; Perry, K.A.; Campisi, S.; Prati, L. NiO as a Peculiar Support for Metal Nanoparticles in Polyols Oxidation. Catal. Sci. Technol. 2013, 3, 394–399. [Google Scholar] [CrossRef]
- Capelli, S.; Motta, D.; Evangelisti, C.; Dimitratos, N.; Prati, L.; Pirola, C.; Villa, A. Bio Adipic Acid Production from Sodium Muconate and Muconic Acid: A Comparison of Two Systems. ChemCatChem 2019, 11, 3075–3084. [Google Scholar] [CrossRef]
- Mori, K.; Hara, T.; Mizugaki, T.; Ebitani, K.; Kaneda, K. Hydroxyapatite-Supported Palladium Nanoclusters: A Highly Active Heterogeneous Catalyst for Selective Oxidation of Alcohols by Use of Molecular Oxygen. J. Am. Chem. Soc. 2004, 126, 10657–10666. [Google Scholar] [CrossRef]
- Sanchez, F.; Motta, D.; Bocelli, L.; Albonetti, S.; Roldan, A.; Hammond, C.; Villa, A.; Dimitratos, N. Investigation of the Catalytic Performance of Pd/CNFs for Hydrogen Evolution from Additive-Free Formic Acid Decomposition. C J. Carbon Res. 2018, 4, 26. [Google Scholar] [CrossRef]
- Savara, A.; Chan-Thaw, C.E.; Rossetti, I.; Villa, A.; Prati, L. Benzyl Alcohol Oxidation on Carbon-Supported Pd Nanoparticles: Elucidating the Reaction Mechanism. ChemCatChem 2014, 6, 3464–3473. [Google Scholar] [CrossRef]
- Chan-Thaw, C.E.; Villa, A.; Veith, G.M.; Prati, L. Identifying the Role of N-Heteroatom Location in the Activity of Metal Catalysts for Alcohol Oxidation. ChemCatChem 2015, 7, 1338–1346. [Google Scholar] [CrossRef]
- Dimitratos, N.; Villa, A.; Prati, L.; Hammond, C.; Chan-Thaw, C.E.; Cookson, J.; Bishop, P.T. Effect of the Preparation Method of Supported Au Nanoparticles in the Liquid Phase Oxidation of Glycerol. Appl. Catal. A Gen. 2016, 514, 267–275. [Google Scholar] [CrossRef]
- Ma, L.; Hu, W.; Pan, Q.; Zou, L.; Zou, Z.; Wen, K.; Yang, H. Polyvinyl Alcohol-Modified Gold Nanoparticles with Record-High Activity for Electrochemical Reduction of CO2 to CO. J. CO2 Util. 2019, 34, 108–114. [Google Scholar] [CrossRef]
- Terzyk, A.P. The Influence of Activated Carbon Surface Chemical Composition on the Adsorption of Acetaminophen (Paracetamol) in Vitro: Part II. TG, FTIR, and XPS Analysis of Carbons and the Temperature Dependence of Adsorption Kinetics at the Neutral PH. Colloids Surf. A Physicochem. Eng. Asp. 2001, 177, 23–45. [Google Scholar] [CrossRef]
- Arrigo, R.; Hävecker, M.; Wrabetz, S.; Blume, R.; Lerch, M.; McGregor, J.; Parrott, E.P.J.; Zeitler, J.A.; Gladden, L.F.; Knop-Gericke, A.; et al. Tuning the Acid/Base Properties of Nanocarbons by Functionalization via Amination. J. Am. Chem. Soc. 2010, 132, 9616–9630. [Google Scholar] [CrossRef] [PubMed]
- Payne, B.P.; Biesinger, M.C.; McIntyre, N.S. The Study of Polycrystalline Nickel Metal Oxidation by Water Vapour. J. Electron. Spectros. Relat. Phenom. 2009, 175, 55–65. [Google Scholar] [CrossRef]
- Militello, M.C.; Simko, S.J. Elemental Palladium by XPS. Surf. Sci. Spectra 1994, 3, 387–394. [Google Scholar] [CrossRef]
- Militello, M.C.; Simko, S.J. Palladium Oxide (PdO) by XPS. Surf. Sci. Spectra 1994, 3, 395–401. [Google Scholar] [CrossRef]
- Shinde, V.M.; Skupien, E.; Makkee, M. Synthesis of Highly Dispersed Pd Nanoparticles Supported on Multi-Walled Carbon Nanotubes and Their Excellent Catalytic Performance for Oxidation of Benzyl Alcohol. Catal. Sci. Technol. 2015, 5, 4144–4153. [Google Scholar] [CrossRef]
- Qadir, K.; Joo, S.H.; Mun, B.S.; Butcher, D.R.; Renzas, J.R.; Aksoy, F.; Liu, Z.; Somorjai, G.A.; Park, J.Y. Intrinsic Relation between Catalytic Activity of CO Oxidation on Ru Nanoparticles and Ru Oxides Uncovered with Ambient Pressure XPS. Nano Lett. 2012, 12, 5761–5768. [Google Scholar] [CrossRef]
- Baeza, J.A.; Calvo, L.; Gilarranz, M.A.; Rodriguez, J.J. Effect of Size and Oxidation State of Size-Controlled Rhodium Nanoparticles on the Aqueous-Phase Hydrodechlorination of 4-Chlorophenol. Chem. Eng. J. 2014, 240, 271–280. [Google Scholar] [CrossRef]


| Catalyst | Support | Label 1 | Metal/NaBH4 2 | Metal/PVA 3 |
|---|---|---|---|---|
| 1%PdPVA/Norit | Norit | Pd/Norit_0.65 | 1/8 | 1/0.65 |
| 1%PdPVA/G60 | G60 | Pd/G60_0.65 | 1/8 | 1/0.65 |
| 1%PdPVA/KB | KB | Pd/KB_0.65 | 1/8 | 1/0.65 |
| 1%PdPVA/KB | KB | Pd/KB_0.0 | 1/8 | 1/0.0 |
| 1%PdPVA/KB | KB | Pd/KB_0.1 | 1/8 | 1/0.1 |
| 1%PdPVA/KB | KB | Pd/KB_0.3 | 1/8 | 1/0.3 |
| 1%PdPVA/KB | KB | Pd/KB_1.2 | 1/8 | 1/1.2 |
| AC Support | Surface Area (m2/g) | Total Pore Volume (cm3/g) | Micropore Volume (cm3/g) | Average Pore Radius (nm) |
|---|---|---|---|---|
| KB | 1600 | 1.59 | 0.53 | 2.0 |
| Norit | 1200 | 0.80 | 0.19 | 5.5 |
| G60 | 800 | 0.75 | 0.23 | 18.7 |
| AC Support | Surface Area (m2/g) | Micropore Volume (cm3/g) | Average Pore Radius (nm) |
|---|---|---|---|
| Pd/KB_0.0 | 1600 | 0.48 | 2.0 |
| Pd/KB_0.1 | 1570 | 0.10 | 4.7 |
| Pd/KB_0.3 | 1550 | 0.10 | 4.6 |
| Pd/KB_0.65 | 1530 | 0.11 | 4.6 |
| Pd/KB_1.2 | 1490 | 0.11 | 4.6 |
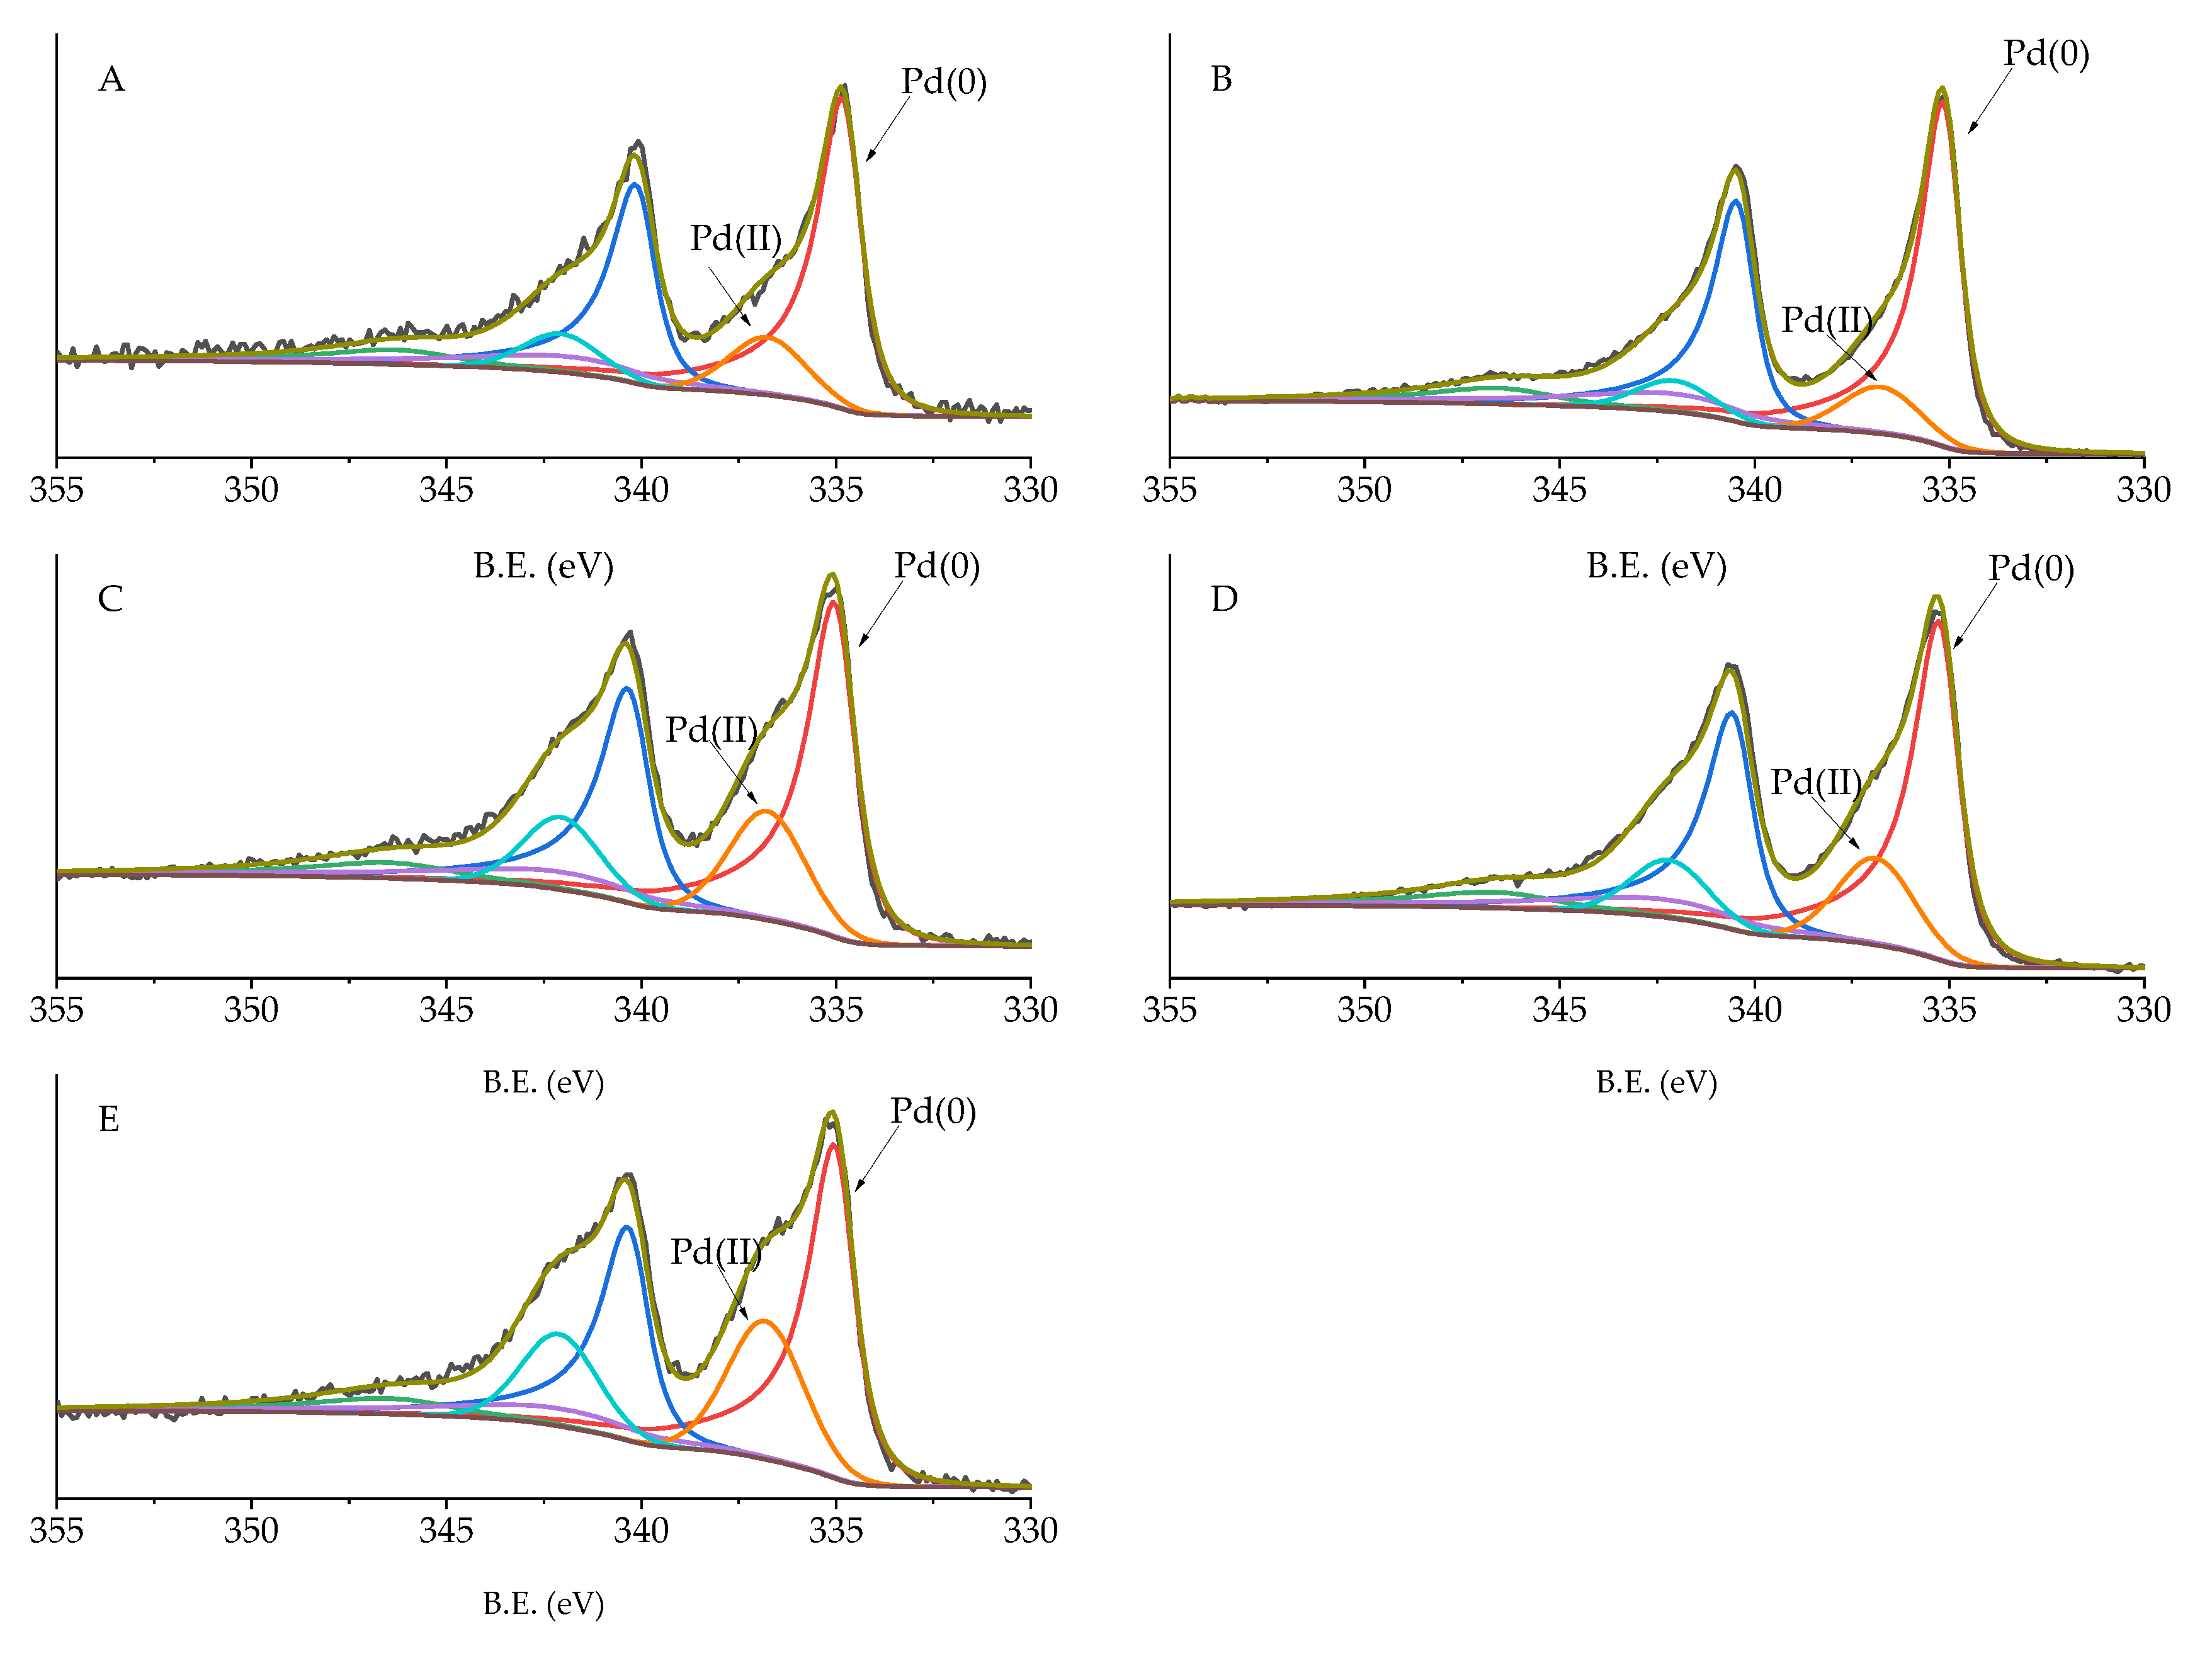
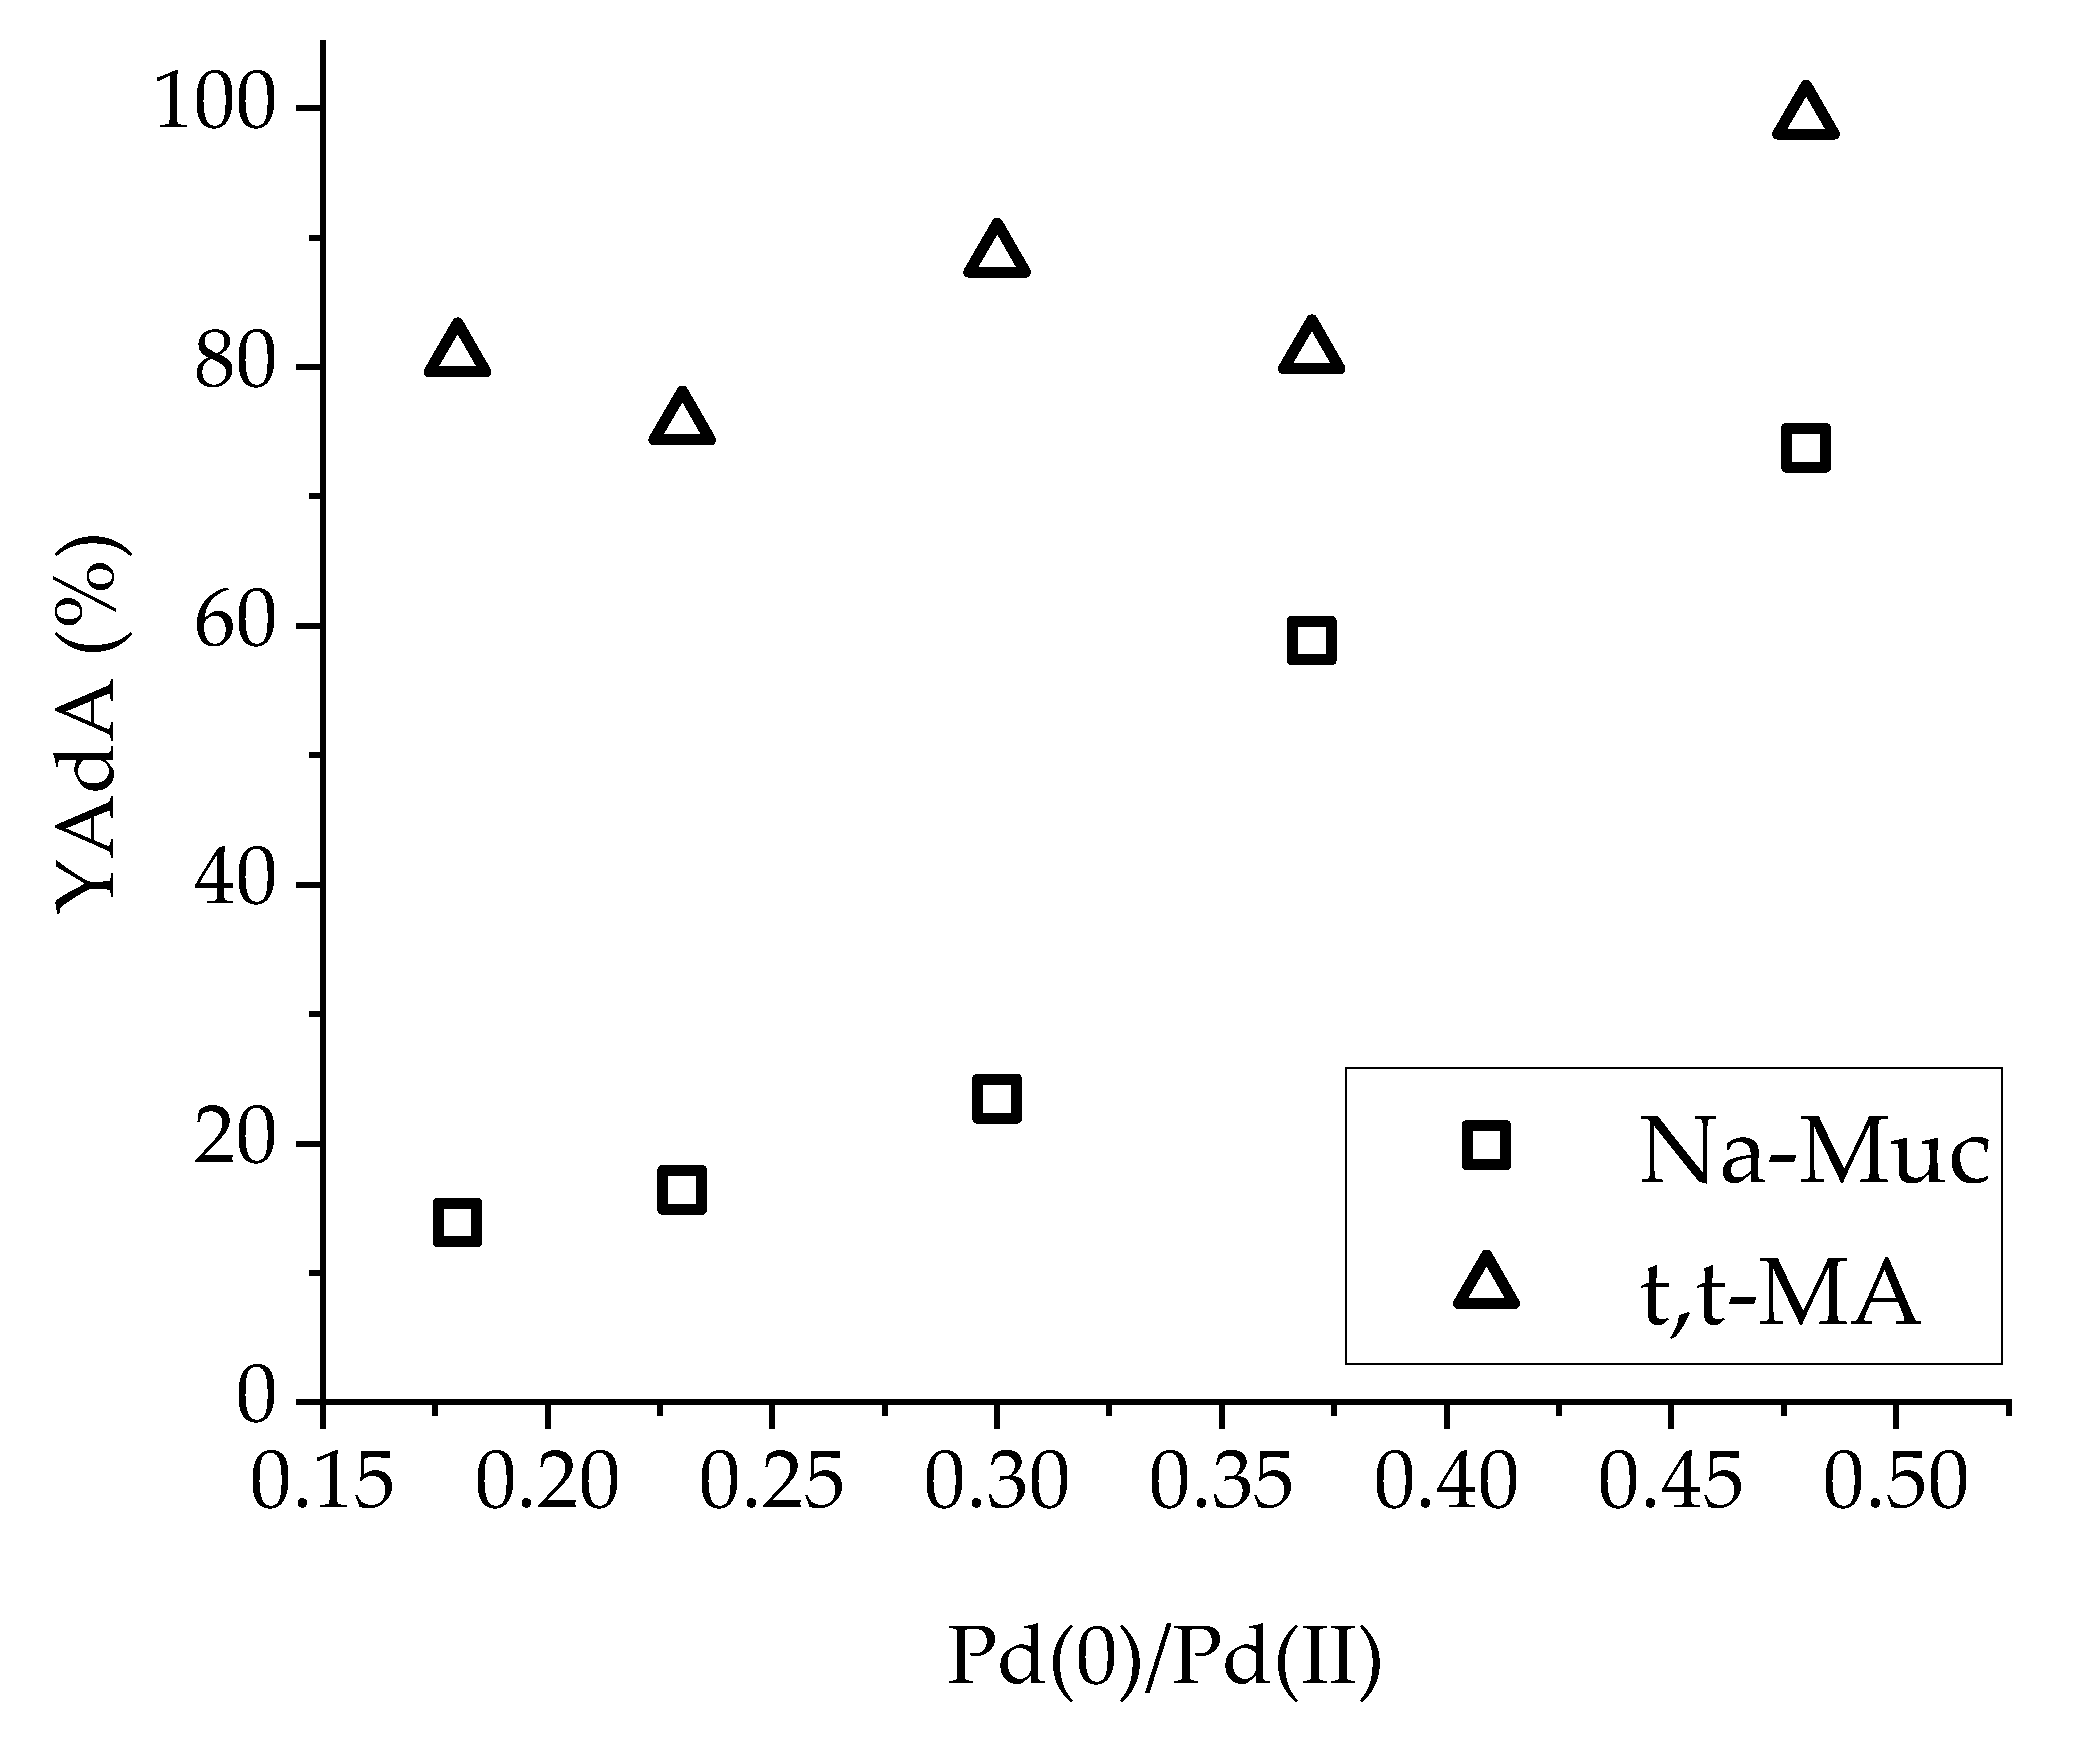
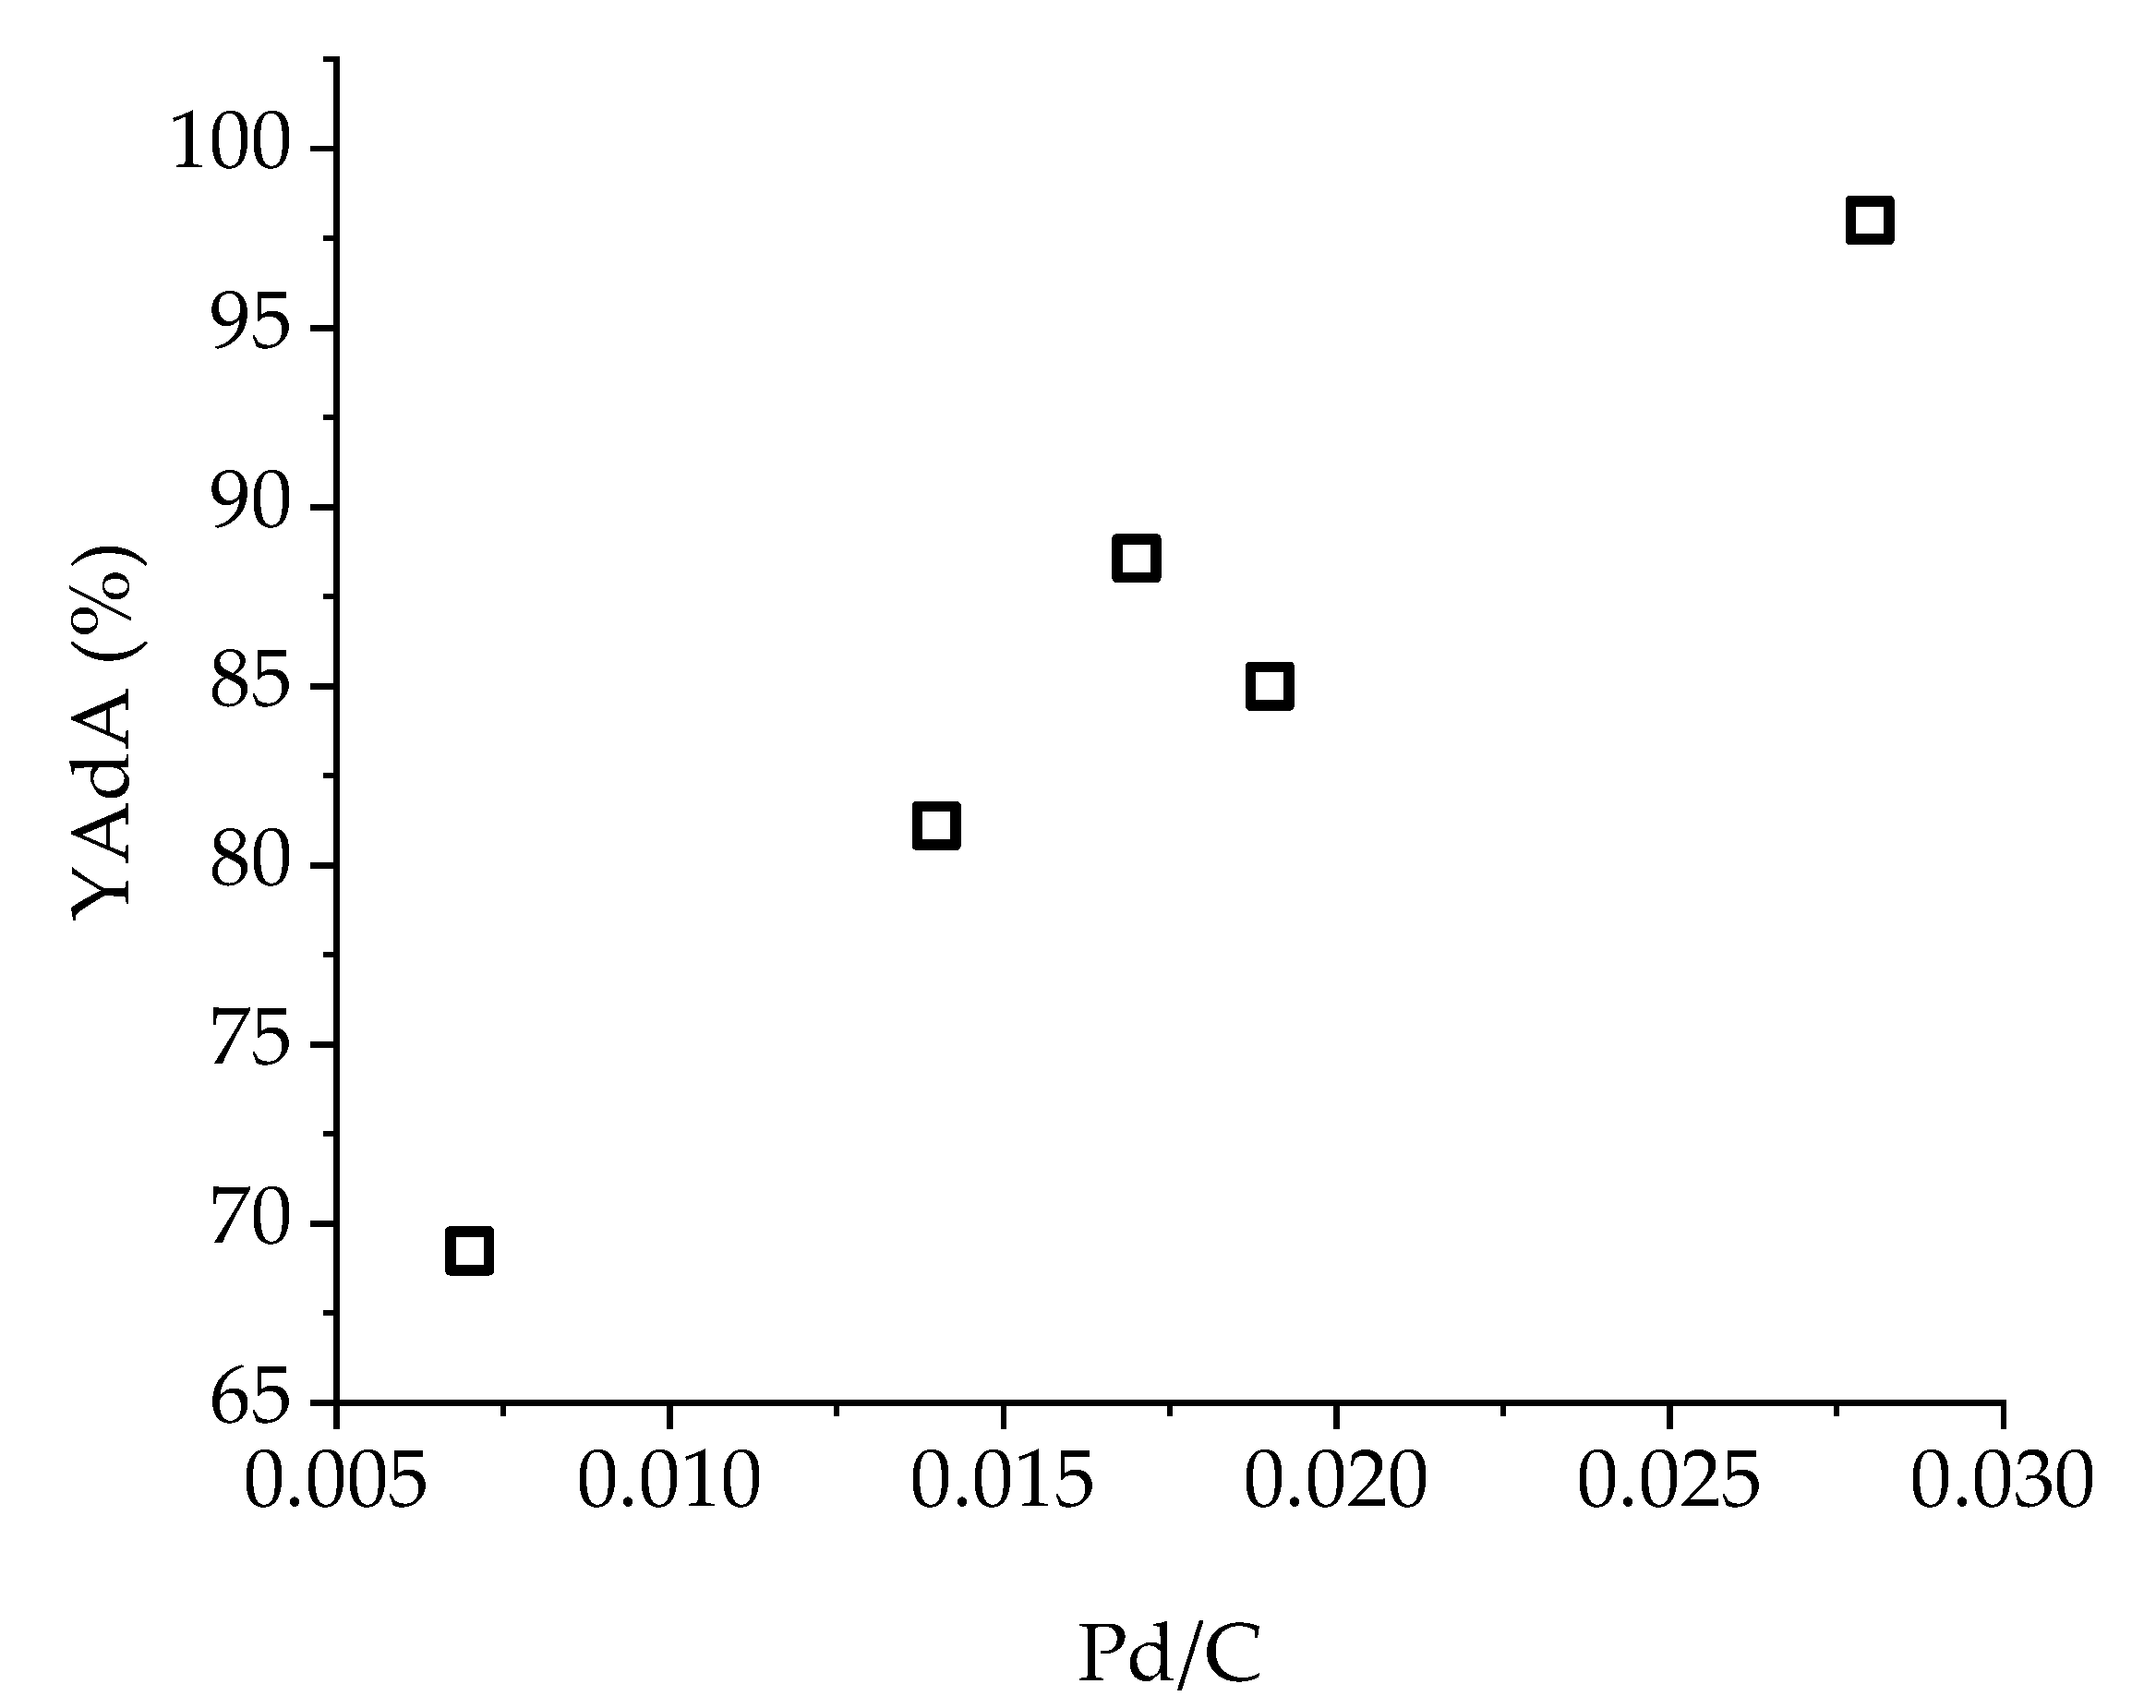
| Sample | C 1s | Pd 3d | O 1s | Pd/C | O/C | |
|---|---|---|---|---|---|---|
| Pd/Norit_0.65 | B.E. (eV) | 284.07 | 335.08 | 532.07 | ||
| A.P. a (%) | 85.3 | 1.2 | 15.3 | 0.014 | 0.183 | |
| Pd/G60_0.65 | B.E. (eV) | 284.07 | 335.08 | 532.07 | ||
| A.P. (%) | 91.1 | 1.2 | 7.7 | 0.013 | 0.085 | |
| Pd/KB_0.0 | B.E. (eV) | 284.08 | 335.08 | 532.08 | ||
| A.P. a (%) | 91.9 | 0.6 | 7.5 | 0.007 | 0.082 | |
| Pd/KB_0.1 | B.E. (eV) | 285.08 | 335.08 | 533.08 | ||
| A.P. a (%) | 89.6 | 1.8 | 8.6 | 0.020 | 0.096 | |
| Pd/KB_0.3 | B.E. (eV) | 284.08 | 336.08 | 533.08 | ||
| A.P. a (%) | 88.84 | 1.3 | 9.9 | 0.014 | 0.112 | |
| Pd/KB_0.65 | B.E. (eV) | 285.08 | 336.08 | 533.08 | ||
| A.P. a (%) | 87.3 | 1.5 | 11.2 | 0.017 | 0.128 | |
| Pd/KB_1.2 | B.E. (eV) | 284.08 | 336.08 | 532.08 | ||
| A.P. a (%) | 85.98 | 1.11 | 12.90 | 0.013 | 0.150 |
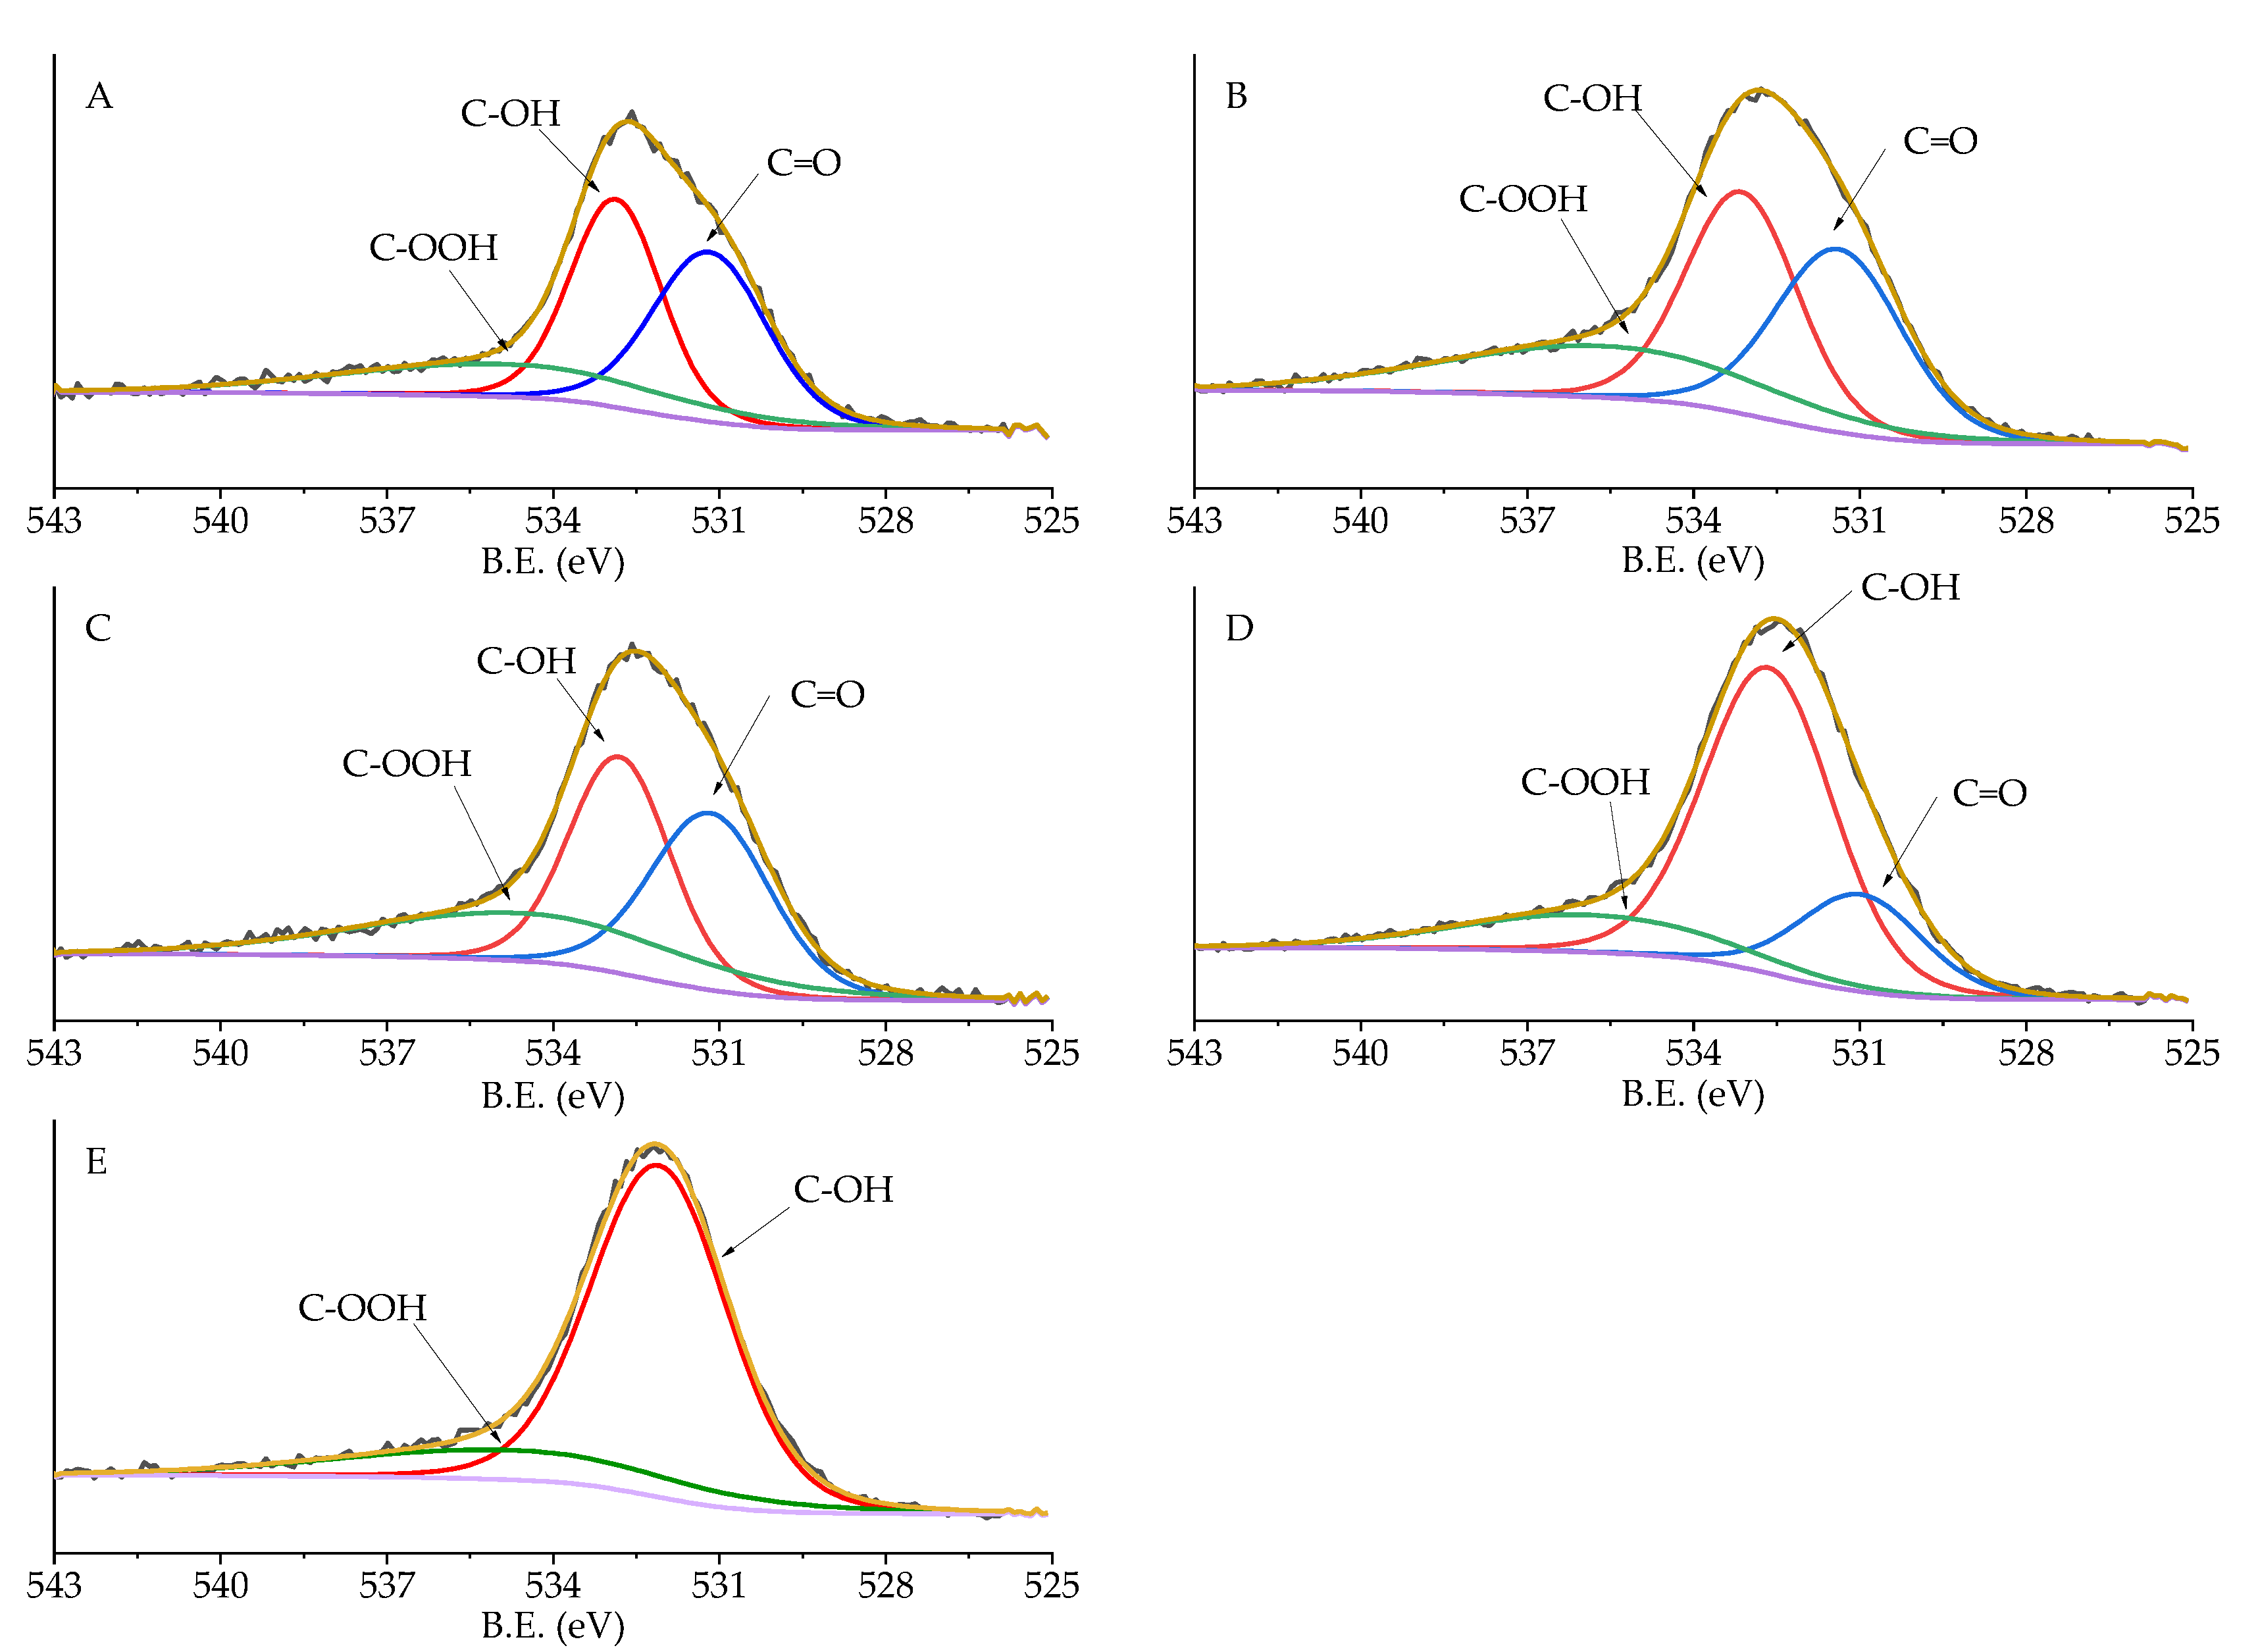
| Sample | C sp2 | C pi s | C pi b | C-O | C=O | Csp3 | Pd (0) | Pd (II) | Pd(0)/Pd(II) | C=O | C-OH | COOH | |
|---|---|---|---|---|---|---|---|---|---|---|---|---|---|
| Pd/Norit_0.65 | B.E. (eV) | 284.20 | - | - | 288.9 | 286.98 | 285.10 | 335.45 | 337.01 | 532.00 | 533.01 | 535.47 | |
| A.P. a (%) | 28.0 | - | - | 9.9 | 19.2 | 42.9 | 58.5 | 41.5 | 1.41 | 32.2 | 62.7 | 5.1 | |
| Pd/G60_0.65 | B.E. (eV) | 284.30 | - | - | 289.10 | 286.57 | 285.21 | 335.5 | 337.4 | 531.89 | 533.34 | 535.58 | |
| A.P. a (%) | 54.5 | - | - | 5.4 | 13.8 | 23.3 | 52.7 | 47.3 | 1.11 | 20.5 | 58.4 | 21.1 | |
| Pd/KB_0.0 | B.E. (eV) | 284.09 | 290.57 | 293.54 | 287.70 | 287.08 | 284.80 | 334.81 | 336.77 | 531.18 | 532.87 | 534.86 | |
| A.P. a (%) | 70.6 | 6.3 | 0.5 | 2.2 | 1.7 | 18.8 | 18.5 | 81.5 | 0.23 | 39.4 | 38.6 | 22.0 | |
| Pd/KB_0.1 | B.E. (eV) | 284.39 | 290.87 | 293.84 | 287.28 | 289.36 | 284.80 | 335.13 | 336.77 | 531.38 | 533.13 | 535.60 | |
| A.P. a (%) | 63.9 | 5.7 | 0.5 | 4.9 | 2.3 | 22.7 | 15.2 | 84.8 | 0.18 | 35.9 | 39.3 | 25.7 | |
| Pd/KB_0.3 | B.E. (eV) | 294.09 | 290.57 | 293.54 | 288.70 | 287.52 | 284.80 | 335.00 | 336.76 | 531.17 | 532.80 | 534.49 | |
| A.P. a (%) | 66.1 | 5.9 | 0.4 | 1.1 | 4.2 | 22.2 | 26.9 | 73.1 | 0.37 | 36.3 | 37.9 | 26.8 | |
| Pd/KB_0.65 | B.E. (eV) | 284.29 | 290.78 | 293.75 | 288.99 | 287.19 | 284.80 | 335.23 | 336.89 | 530.98 | 532.65 | 535.87 | |
| A.P. a (%) | 63.6 | 5.7 | 0.4 | 2.5 | 4.9 | 22.9 | 23.1 | 76.9 | 0.30 | 19.6 | 64.2 | 16.2 | |
| Pd/KB_1.2 | B.E. (eV) | 284.09 | 290.57 | 293.54 | 286.81 | 288.5 | 284.80 | 335.00 | 336.81 | - | 532.81 | 534.60 | |
| A.P. a (%) | 66.4 | 5.9 | 0.5 | 4.9 | 2.9 | 19.4 | 32.2 | 67.8 | 0.48 | - | 81.2 | 18.7 |
© 2020 by the authors. Licensee MDPI, Basel, Switzerland. This article is an open access article distributed under the terms and conditions of the Creative Commons Attribution (CC BY) license (http://creativecommons.org/licenses/by/4.0/).
Share and Cite
Capelli, S.; Motta, D.; Evangelisti, C.; Dimitratos, N.; Prati, L.; Pirola, C.; Villa, A. Effect of Carbon Support, Capping Agent Amount, and Pd NPs Size for Bio-Adipic Acid Production from Muconic Acid and Sodium Muconate. Nanomaterials 2020, 10, 505. https://doi.org/10.3390/nano10030505
Capelli S, Motta D, Evangelisti C, Dimitratos N, Prati L, Pirola C, Villa A. Effect of Carbon Support, Capping Agent Amount, and Pd NPs Size for Bio-Adipic Acid Production from Muconic Acid and Sodium Muconate. Nanomaterials. 2020; 10(3):505. https://doi.org/10.3390/nano10030505
Chicago/Turabian StyleCapelli, Sofia, Davide Motta, Claudio Evangelisti, Nikolaos Dimitratos, Laura Prati, Carlo Pirola, and Alberto Villa. 2020. "Effect of Carbon Support, Capping Agent Amount, and Pd NPs Size for Bio-Adipic Acid Production from Muconic Acid and Sodium Muconate" Nanomaterials 10, no. 3: 505. https://doi.org/10.3390/nano10030505
APA StyleCapelli, S., Motta, D., Evangelisti, C., Dimitratos, N., Prati, L., Pirola, C., & Villa, A. (2020). Effect of Carbon Support, Capping Agent Amount, and Pd NPs Size for Bio-Adipic Acid Production from Muconic Acid and Sodium Muconate. Nanomaterials, 10(3), 505. https://doi.org/10.3390/nano10030505