Article

Investigation of AC-Measurements of Epoxy/Ferrite Composites

by
Moustafa A. Darwish
1,2,
Alex V. Trukhanov
1,3,4,
Oleg S. Senatov
1,
Alexander T. Morchenko
1,
Samia A. Saafan
2,
Ksenia A. Astapovich
4,
Sergei V. Trukhanov
1,3,4,*,
Ekaterina L. Trukhanova
1,4,
Andrey A. Pilyushkin
1,
Antonio Sergio B. Sombra
5,
Di Zhou
6,
Rajshree B. Jotania
7 and
Charanjeet Singh
8
1
Department of Technology of Electronics Materials, National University of Science and Technology “MISiS”, Leninskii av., Moscow 4119049, Russia
2
Physics Department, Faculty of Science, Tanta University, Al-Geish st., Tanta 31527, Egypt
3
Scientific and Educational Center “Nanotechnology”, South Ural State University, Lenin av. 76, Chelyabinsk 454080, Russia
4
SSPA “Scientific and Practical Materials Research Centre of the NAS of Belarus”, P. Brovki Str. 19, 220072 Minsk, Belarus
5
Department of Physics, Federal University of Ceara, Fortaleza, Ceara 60-455-970, Brazil
6
Electronic Materials Research Laboratory, Key Laboratory of the Ministry of Education & International Center for Dielectric Research, School of Electronic Science and Engineering, Xi’an Jiaotong University, Xi’an 710049, China
7
Department of Physics, Electronics and Space Science, Gujarat University, Gujarat, Ahmedabad 380009, India
8
School of Electronics and Electrical Engineering, Lovely Professional University, Phagwara, Punjab 144411, India
*
Author to whom correspondence should be addressed.
Nanomaterials 2020, 10(3), 492; https://doi.org/10.3390/nano10030492
Submission received: 12 February 2020 / Revised: 26 February 2020 / Accepted: 4 March 2020 / Published: 9 March 2020
(This article belongs to the Special Issue Oxide Magnetics)

Abstract

:
A pure ferrite and epoxy samples as well as the epoxy/ferrite composites with different 20 wt.%, 30 wt.%, 40 wt.%, and 50 wt.% weight ferrite contents have been prepared by the chemical co-precipitation method. AC-conductivity and dielectric properties such as the dielectric constant and dielectric loss of the prepared samples have been studied. The obtained results showed that the samples had a semiconductor behavior. The dielectric constant of the composites has been calculated theoretically using several models. For the composite sample that contains 20 wt.% of ferrites, these models give satisfactory compliance, while for the composite samples with a higher percentage of nanofillers, more than 30 wt.% theoretical results do not coincide with experimental data. The investigated polymer has very low conductivity, so this type of polymer can be useful for high-frequency applications, which can reduce the losses caused by eddy current. Thus, the prepared samples are promising materials for practical use as elements of microwave devices.

Graphical Abstract

1. Introduction

In recent years, nanotechnology has continued to be an essential topic for many researchers around the world due to new phenomena and distinctive properties shown by nanoparticles [1]. Nanotechnology can be an excellent tool in the study, preparation, research, and use of new perspective materials, as well as in solving the problem of particles sizes in the range of 1–100 nm, where unusual phenomena allow new applications [2,3,4]. Tiny nanoparticles with diameters of some nanometers usually look like molecules. Therefore, the atomic and electronic structures of such small nanoparticles possess different features, certainly not the same as those of the bulk materials. The size-dependent abilities of nanoparticles include electronic, magnetic, optical, and chemical substance characteristics. Nanoparticles can be crystalline or amorphous [5].
Nanosized ferrites could be prepared by many methods, including mechanized milling, ultrasonic cavitation method, radio rate of recurrence plasma, hydrothermal technique, reverse micelle method, sol-gel technique, citrate precursor, and co-precipitation technique [6,7,8,9,10,11,12,13,14,15,16,17,18,19,20,21]. It is advisable to possess a synthesis method that allows for governor on the nanoparticle dimension and produces nanoparticles having a significant size distribution [2]. The chemical substance co-precipitation method is the most excellent ideal for the formation of nanoparticles due to its ease and much-improved handle over the crystallite dimension and other qualities of the components [22]. Also, lately, magnetic composites comprising magnetic materials alongside polymers comprise a new era of multifunctional components that mix the properties from the constituents; these components are known as magneto-polymeric components [23].
The characteristics of ferrites are highly susceptible to methodical handling, sintering conditions, and impurity. Nickel-zinc ferrite is one of the first widely used ferrite produced for an open range of applications that recognizes to high saturation magnetization, high resistance, high Curie temperature, high chemical stability, low coercive power, and biodegradability [24,25,26,27,28]. In technological applications as telecommunications, transformers, and microwave devices, etc., Ni-Zn ferrites now play a crucial role. Spinel Ni-Zn ferrites are commonly employed in several devices as core materials, high-frequency transformer-core ferrites, frequency antennas, RAMs (radar absorption materials), and electrical components [29,30,31,32]. Lithium ferrite substituted with zinc has extended importance because it possesses high saturation magnetization, which is found to be suitable in memory core applications and microwave communication [29].
Many researchers work on the 2-phase dielectric-polymer, or magnetic-polymer composites are extensively studied within the last years. Nonetheless, the principal focus is on enhancing the dielectric and magnetic properties. Within the recent past, however, the developments of the three-phase dielectric, dielectric and magnetic polymer polymers offer further choices on the design and expansion of the material application, like those utilized within the sensors and inductor capacitors [33,34,35,36,37,38].
The weather-shed of out of doors insulators and cable terminators is typically employed by polymeric insulation materials like epoxy and polyethene. Additionally, to their other uses in modern technology, epoxy resins are commonly used as suitable matrices, as they supply flexibility, low shrinking, additives, high dielectric properties, and excellent adhesion. Epoxy blends are quite conventional high-voltage isolators, like epoxy mica composites used to insulate power transformers, station, and line posts, rotary machine isolating coils, and much of more [39,40,41].
In applications, they are not only as inductive and capacitive materials but also microwave absorbers. The distinguishing features of the ferrite/polymer composites are quite desirable. Both features are correlated with sharply lower dielectric losses as compared with bulk ferrites, while because of the advantage of organic, ferromagnetic resonance, the microwave absorption properties remain uninfluenced. Nevertheless, epoxy resins provide excellent electrical insulators and protect the electrical components from short-circuiting, dust, and humidity. Epoxy resins are the primary resin within the industry utilized in integrated circuits, transistors, and hybrids [42].
Composite systems of ferrite nanoparticles with conducting polymers can be used as an active coating for electromagnetic shielding (magnetic and high-frequency) [43,44,45]. This work is devoted to investigating some electrical properties for nickel-zinc lithium ferrite nanoparticles and epoxy/ferrite composites for comparison purposes.

2. Materials and Methods

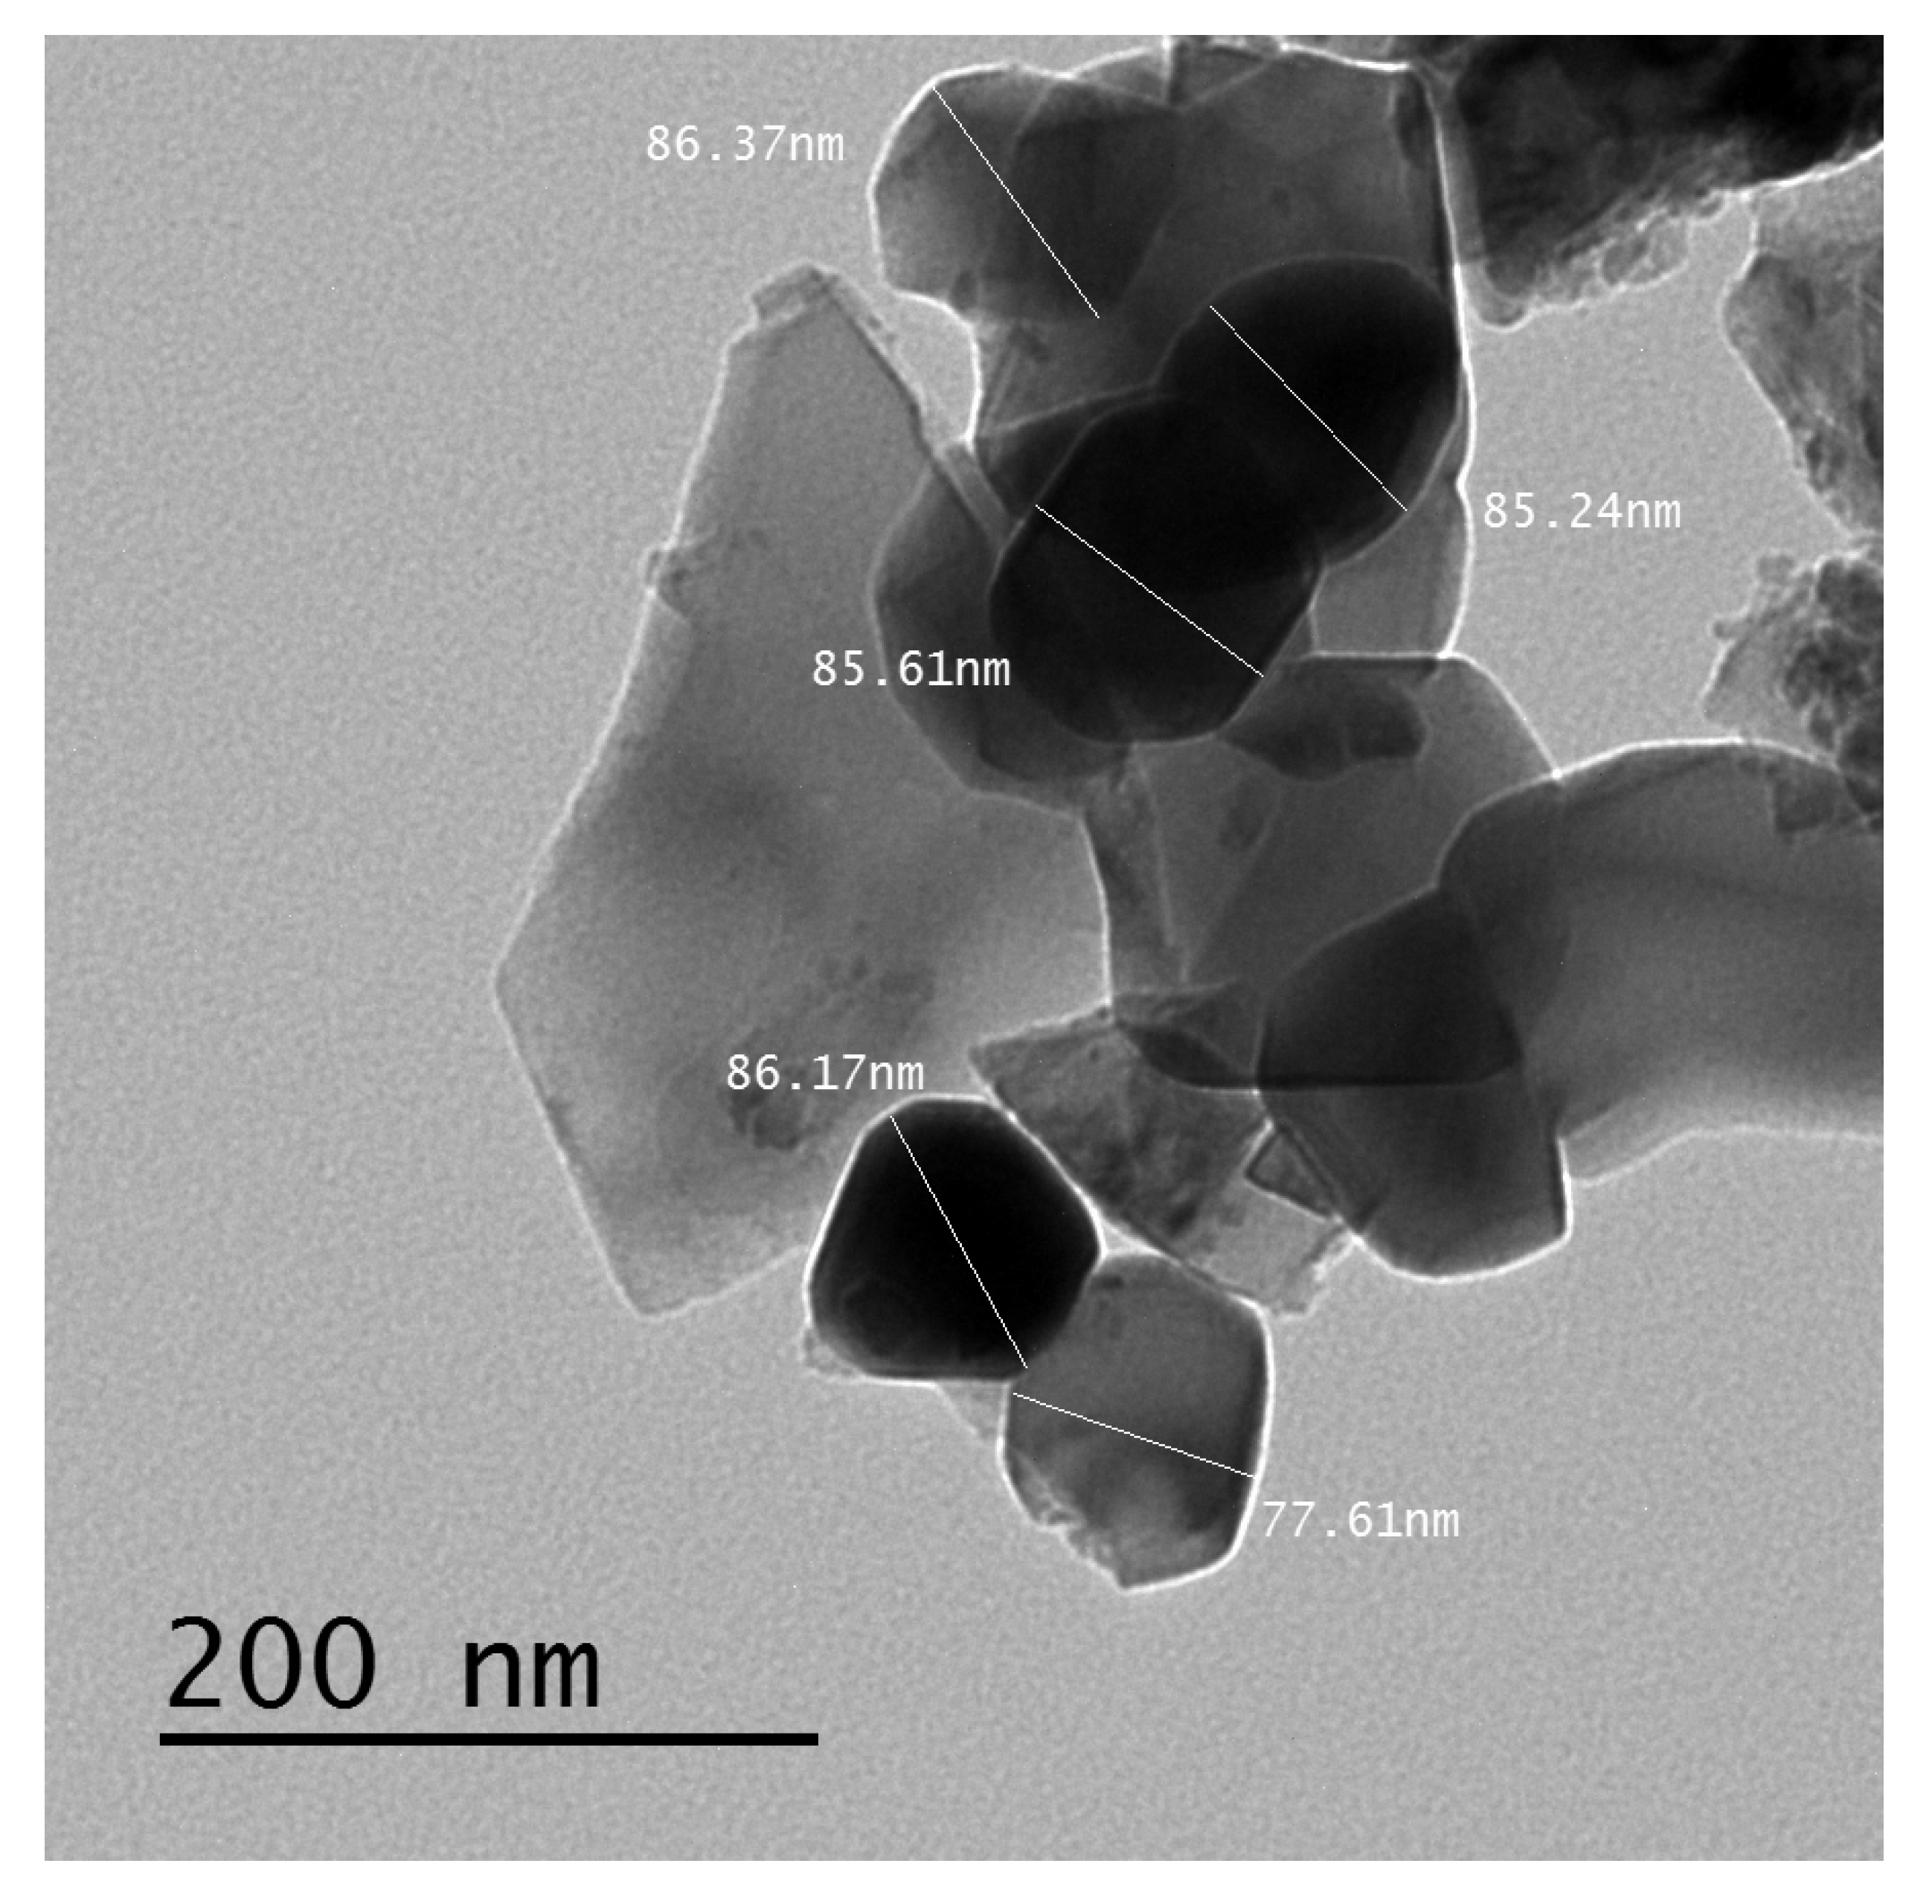
2.1. Preparation of Nickel-Zinc Lithium Ferrite Nanoparticles and Epoxy/Ferrite Composites

Ferrite nanoparticles with the Li0.15(Ni0.5Zn0.5)0.7Fe2.15O4 (LNCFO) composition were prepared by the chemical co-precipitation method. This specific method for the preparation and characterization of all the samples with the magnetic properties had been previously published [46,47,48,49]. The obtained ferrite powder consisted of particles with an average size in the range from 31 nm to 88 nm. The average crystallite size was determined from transmission electron microscopy data. The particle size has been recalculated by using JEOL JEM-100SX transmission electron microscope (Microscope Unit, Mansoura University, Faculty of Science, Egypt). An illustration of the obtained ferrite nanoparticles and their characteristic sizes are shown in Figure 1.
Then, the ferrite powder was compressed in pellets form for the electrical measurements. The pure epoxy and epoxy/ferrite composites with different ferrite weight contents (20 wt.%, 30 wt.%, 40 wt.%, and 50 wt.%) were cut into pellets for the electrical measurements.

2.2. Alternating Current (AC) -Measurements

The AC electrical measurements, such as σac‘ (AC-conductivity) in S/cm, ε‘ (dielectric constant), and tanδ (dielectric loss tangent), were studied with frequencies and temperatures.
In-circuit, the sample coated with conducting material from both sides; in this case, the coating is a silver paste, relates to resistance (R) in series. It must be mentioned that the voltage across the resistance must be small enough (≤1%) compared with the root mean square voltage, i.e., the applied voltage (Vapplied = Vr.m.s = 1 V). The voltage across the resistance (VR) and the phase angle (φ) were measured by using a lock-in amplifier. Here the phase angle (φ) is the angle between the Vapplied and I = Itotal, and the total current is equal to the current across the resistance R. The sample used for the electrical measurements can be symbolled as a capacitor with capacitance (C) and resistance (r). From the equivalent circuit (RC) of the sample, the total current (I) is divided into two parts Ic and Ir, and the angle between them is π/2. The applied voltage (V) can be calculated from the following Equation:
V = VR + VC
So, VC >> VR, we can consider that VVC and δ is the angle between I and IC and named the loss angle or the loss factor.
The following equations were used for calculations of σac′, ε′, and tanδ.
The next relation can be used to calculate the resistance (r) of the sample:
r = V C I r = V I cos ϕ = V R V R cos ϕ
Since,
r = d σ a c A
where σac′ is the AC-conductivity real part, d and A are the thickness of the sample (cm), and its surface area (cm2), respectively.
So,
σ a c = d r A = d V R cos ϕ A V R
The reactance of the Resistance-Capacitance RC equivalent circuit of sample XC is given by the relation:
X C = 1 ω C = V I c = V I sin ϕ = V R V R sin ϕ
where, ω = 2 π f ; f is the frequency of the applied voltage.
C = I sin ϕ V ω = V R sin ϕ V R ω
where C is the capacitance of the sample, and V is the voltage of 1 V.
The capacitance Co (pF) of an air capacitor consists of two parallel plates of area A (cm2) and separated by a distance d (cm) is given by:
C o = A ( c m 2 ) 11.3 d ( c m )
From the previous equations, the dielectric constant εʹ of a sample is:
ε = C C o = 11.3 d V R sin ϕ R A ω × 10 12
The dielectric loss is calculated from the ϕ phase angle by using the relation:
tan δ = 1 tan ϕ

3. Results and Discussion

3.1. Electrical Properties

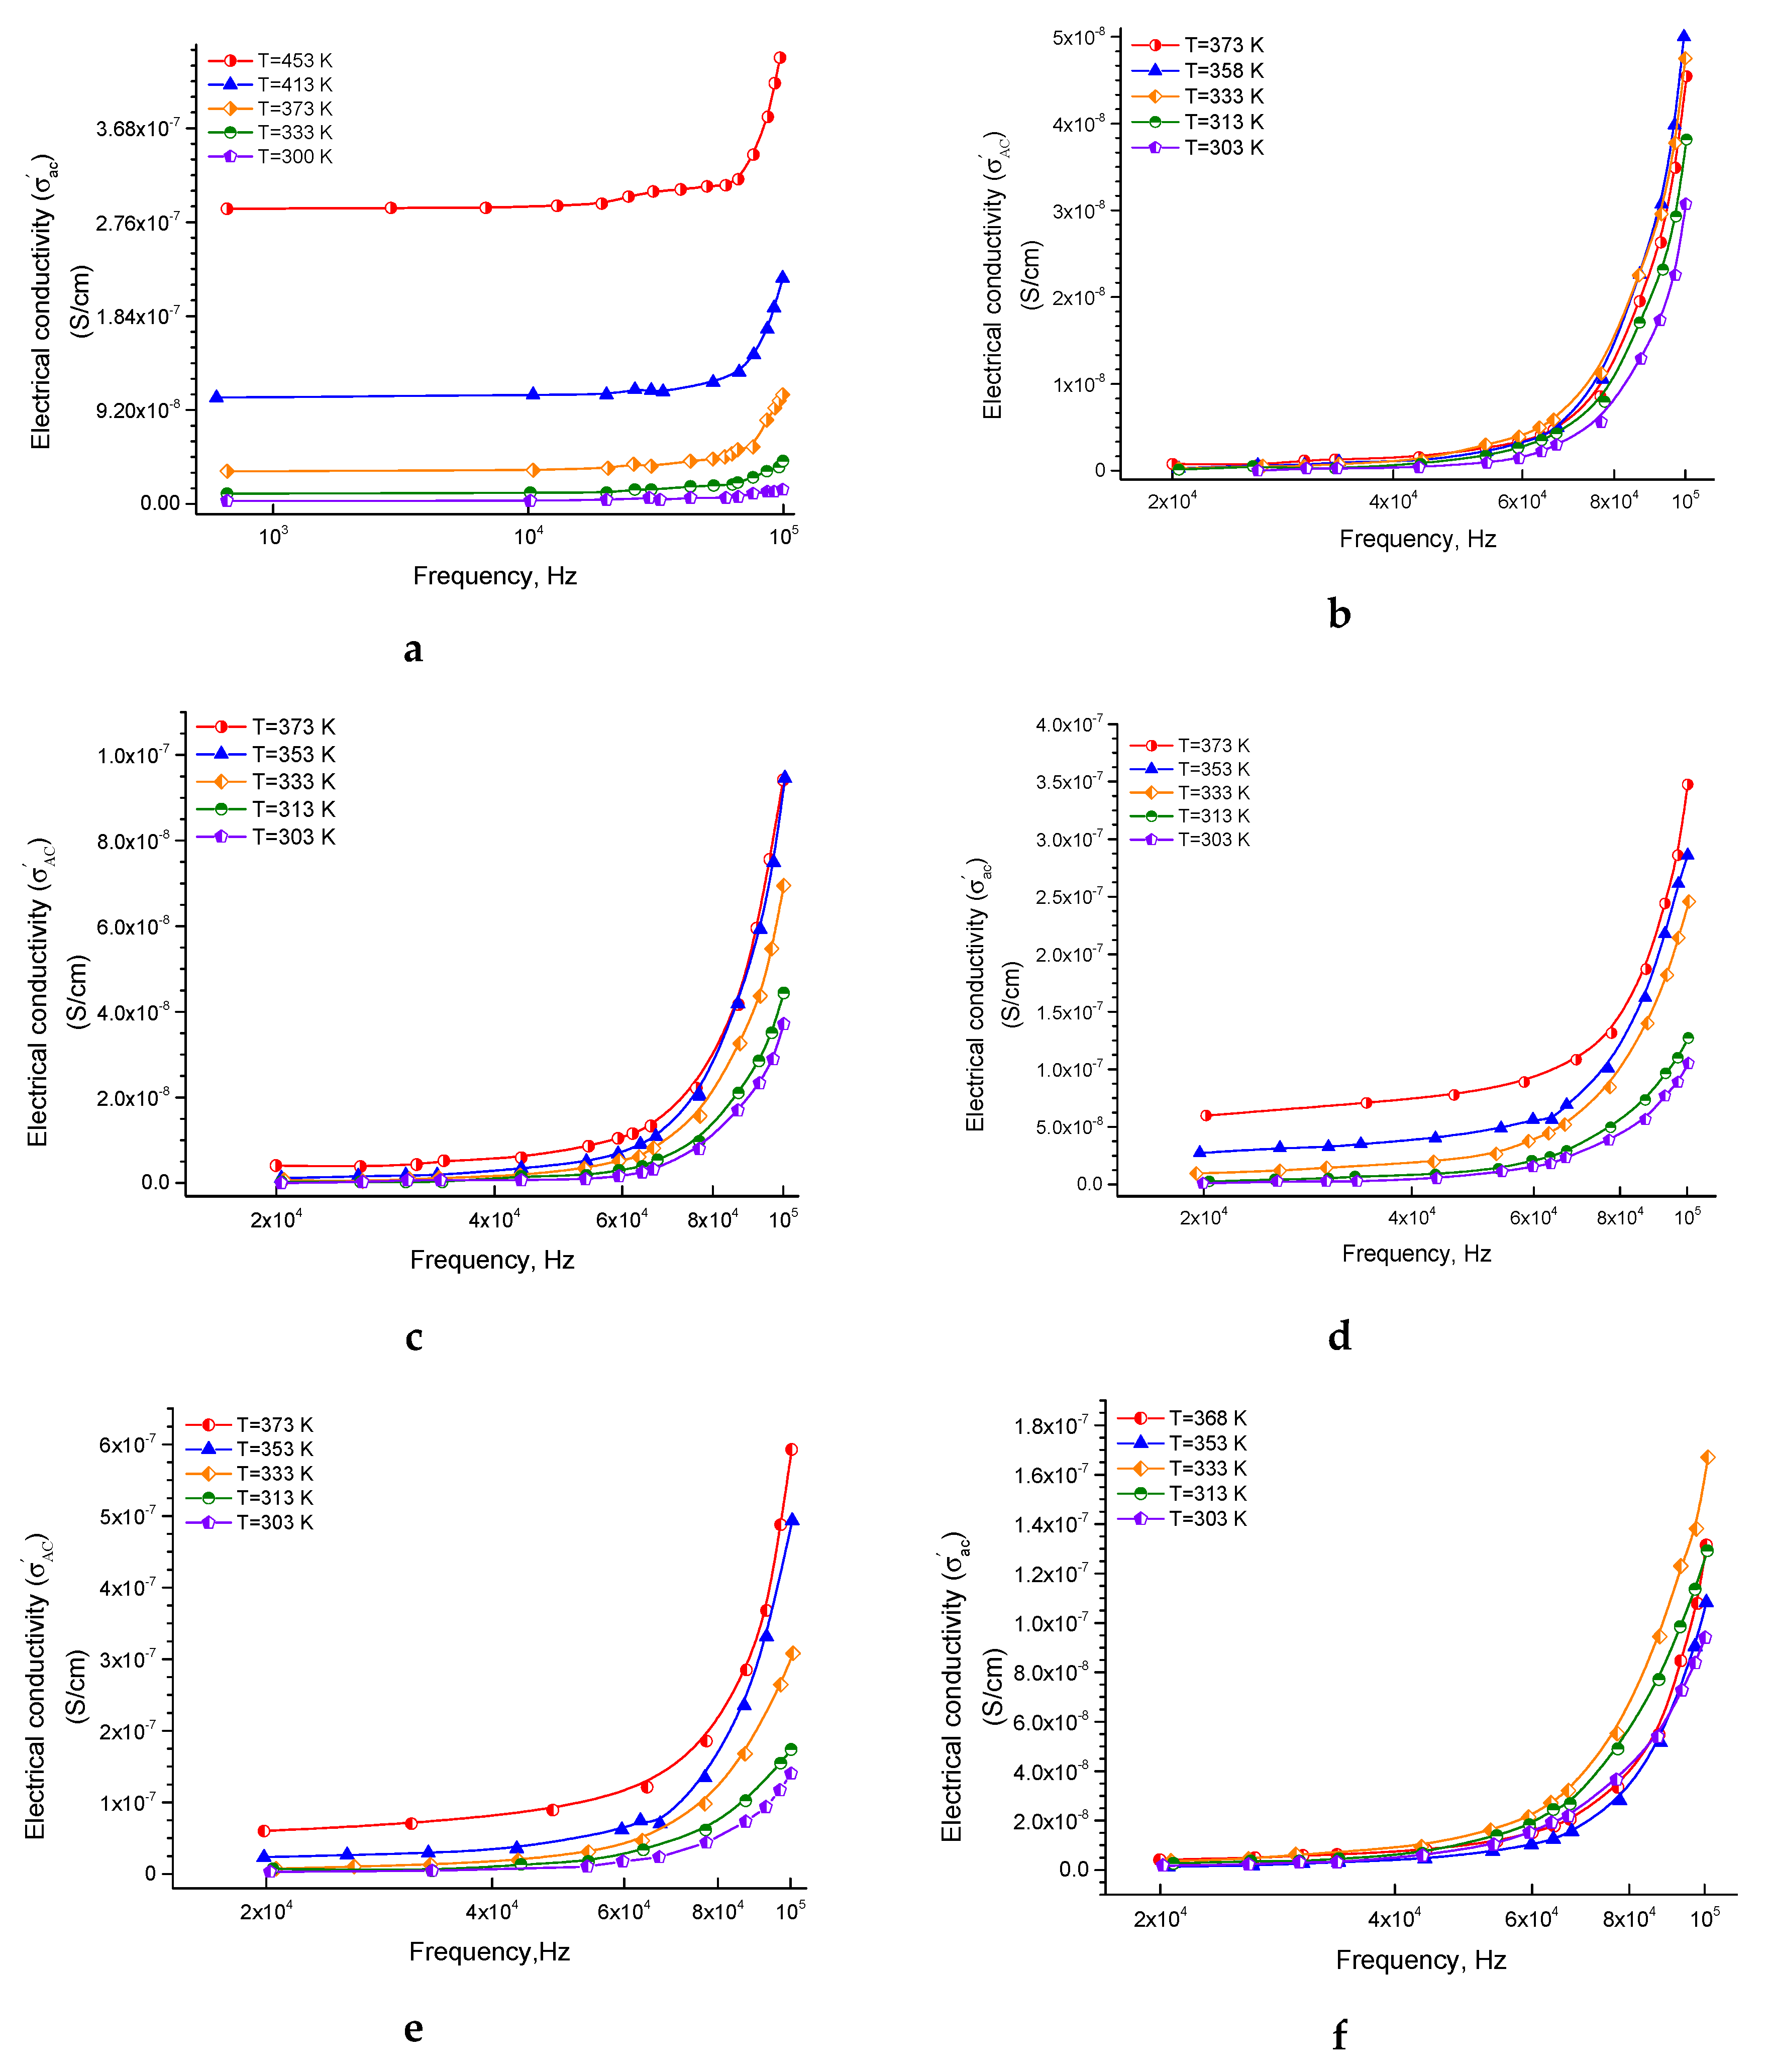
3.1.1. The Behavior of Ac Conductivity

This section may be divided by subheadings. It should provide a concise and precise description of the experimental results, their interpretation as well as the experimental conclusions that can be drawn. The following relation gives the complex conductivity (AC):
σ * ( ω ) = σ a c + i σ a c
where the real part of this equation consists of two parts:
σ a c = σ 1 ( T ) + σ 2 ( T , ω )
The first term, σ1(T) = σdC(T), is the electrical conductivity produced according to the direct current (DC), and this term is frequency independent and temperature-dependent. σ1(T) follows an Arrhenius, which relates the electric charge carriers and their drift mobility. The second term σ2(T, ω) depends on the temperature and the frequency and follows the power law, as shown in the following Equation:
σ 2 ( T , ω ) = A ω s
where s and A are parameters that depend on the temperature and the composition [50,51,52]. The power-law relation represents straight lines with slopes equal to the exponent (s) and intercepts parts equal to log A on the vertical axis at log ω = 0. The values of (T, at low frequencies are small and increase as ω increases, which can have the same explanation that will be discussed regarding the increase of the ac conductivity (σac) with the frequency and temperature. In the literature, it was also reported that s = 0 for DC conductivity (frequency-independent) and 0 < s < 1 for AC conductivity (frequency-dependent) [53].
Figure 2a–f displays the dependence of AC-conductivity (σac′) on frequency in log scale at different temperatures from a range of 300–453K for ferrite, epoxy, and their composites samples. This figure shows that the parameter σac′ of the ferrite sample is usually higher than σdc, that was published earlier [51]. This is predictable because σdc is a portion of rendering to Equation (11). The σac′ increases with increasing temperature, i.e., increases with increasing frequency at a specified temperature, and this behavior is typical in many kinds of ferrites that have a semiconducting behavior. This type of behavior has been explained according to the hopping conduction mechanism. After increasing the temperature, the electron hopping between Fe2+ and Fe3+ ions and holes hopping between Ni2+ and Ni3+ ions increased and led to an increase in the σac′.
Many types of research [54,55,56] have assumed that the ferrites consist of different regions with dissimilar conductivities and have explained the increase in the conductivity of the ferrites with increasing frequency according to Koop’s two-layer model and the space charge polarization [57], recognized to be appropriate to define the heterogeneous structures. It is assumed that the ferrite consists of grains, i.e., functional conductive layers, and grain boundaries, i.e., weak conductive layers. So, as it has been declared above, the conduction takes place by the hopping of electrons and holes. Through hopping, the electron reaching the grain boundary and accumulated there. This occurs because of the high resistivity of the grain boundary and producing so-called space charge polarization [55] that leads to the increase in the dielectric values, as will be discussed later. However, at higher frequencies, the grains were found to be more effective than the grain boundaries and vice versa at lower frequencies [50,51,58].
Figure 2b–f displays σac′ values versus frequency at different temperatures 303, 313, 333, 358, and 373K for the pure epoxy and the composite samples. By comparing the results of σac′ of the pure epoxy and the pure ferrite at almost similar temperatures and frequencies, it has been found that σac′ of the pure epoxy is significantly lower than that of the pure ferrite sample. The pure epoxy has a very low conductivity (very high resistivity), which can decrease the eddy current losses, and this behavior can be appropriate for high-frequency applications [59,60]. This decrease in AC-conductivity is expected, and it is attributed to the more insulating character of the epoxy than that of the ferrite. Whereas in the composites, which are supposed to be composed of islands of ferrites embedded into an insulating matrix of epoxy, it is be expected that of the composite samples will be generally higher than the pure epoxy sample, which has occurred. Also, it may be expected that as the ferrite fraction will increase in the composite, the value of will be increased, which has happened too, except for the composite sample of 50% ferrite. This difference can be clarified by the fact that increasing the number of fillers may increase viscosity, and consequently may cause cracks and defects in the prepared samples. These cracks and defects obviously lower the conductivity. Therefore, a practical recommendation may be concluded here; that is, the suitable fraction of ferrites for preparing such composites is preferred for the low percentage of fillers to avoid cracks and defects. Also, this observation recorded for the pure epoxy in which the non-monotonic behavior concerning the sintering temperature in the pure epoxy may be, in common, due to the dependence of conductivity on several further factors such as the porosity and density [61,62].
Moreover, at lower temperatures, the conduction mechanism may be due to the electron hopping and at higher temperatures may be due to polaron hopping [63,64,65], which means that at high temperature the electron moves by thermal activation and caused a large degree of local lattice distortion so, the mentioned factors can affect the measured results and produce non-monotonicity in the AC conductivity behavior and the other electrical factors.

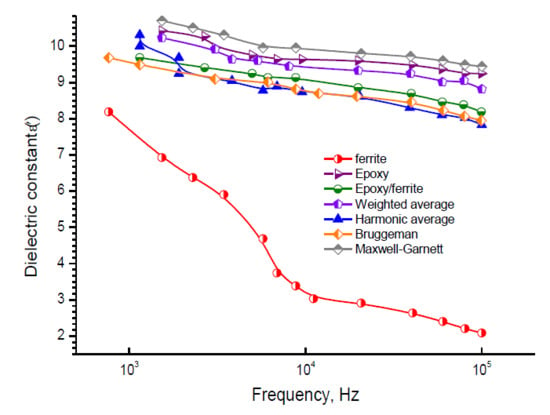
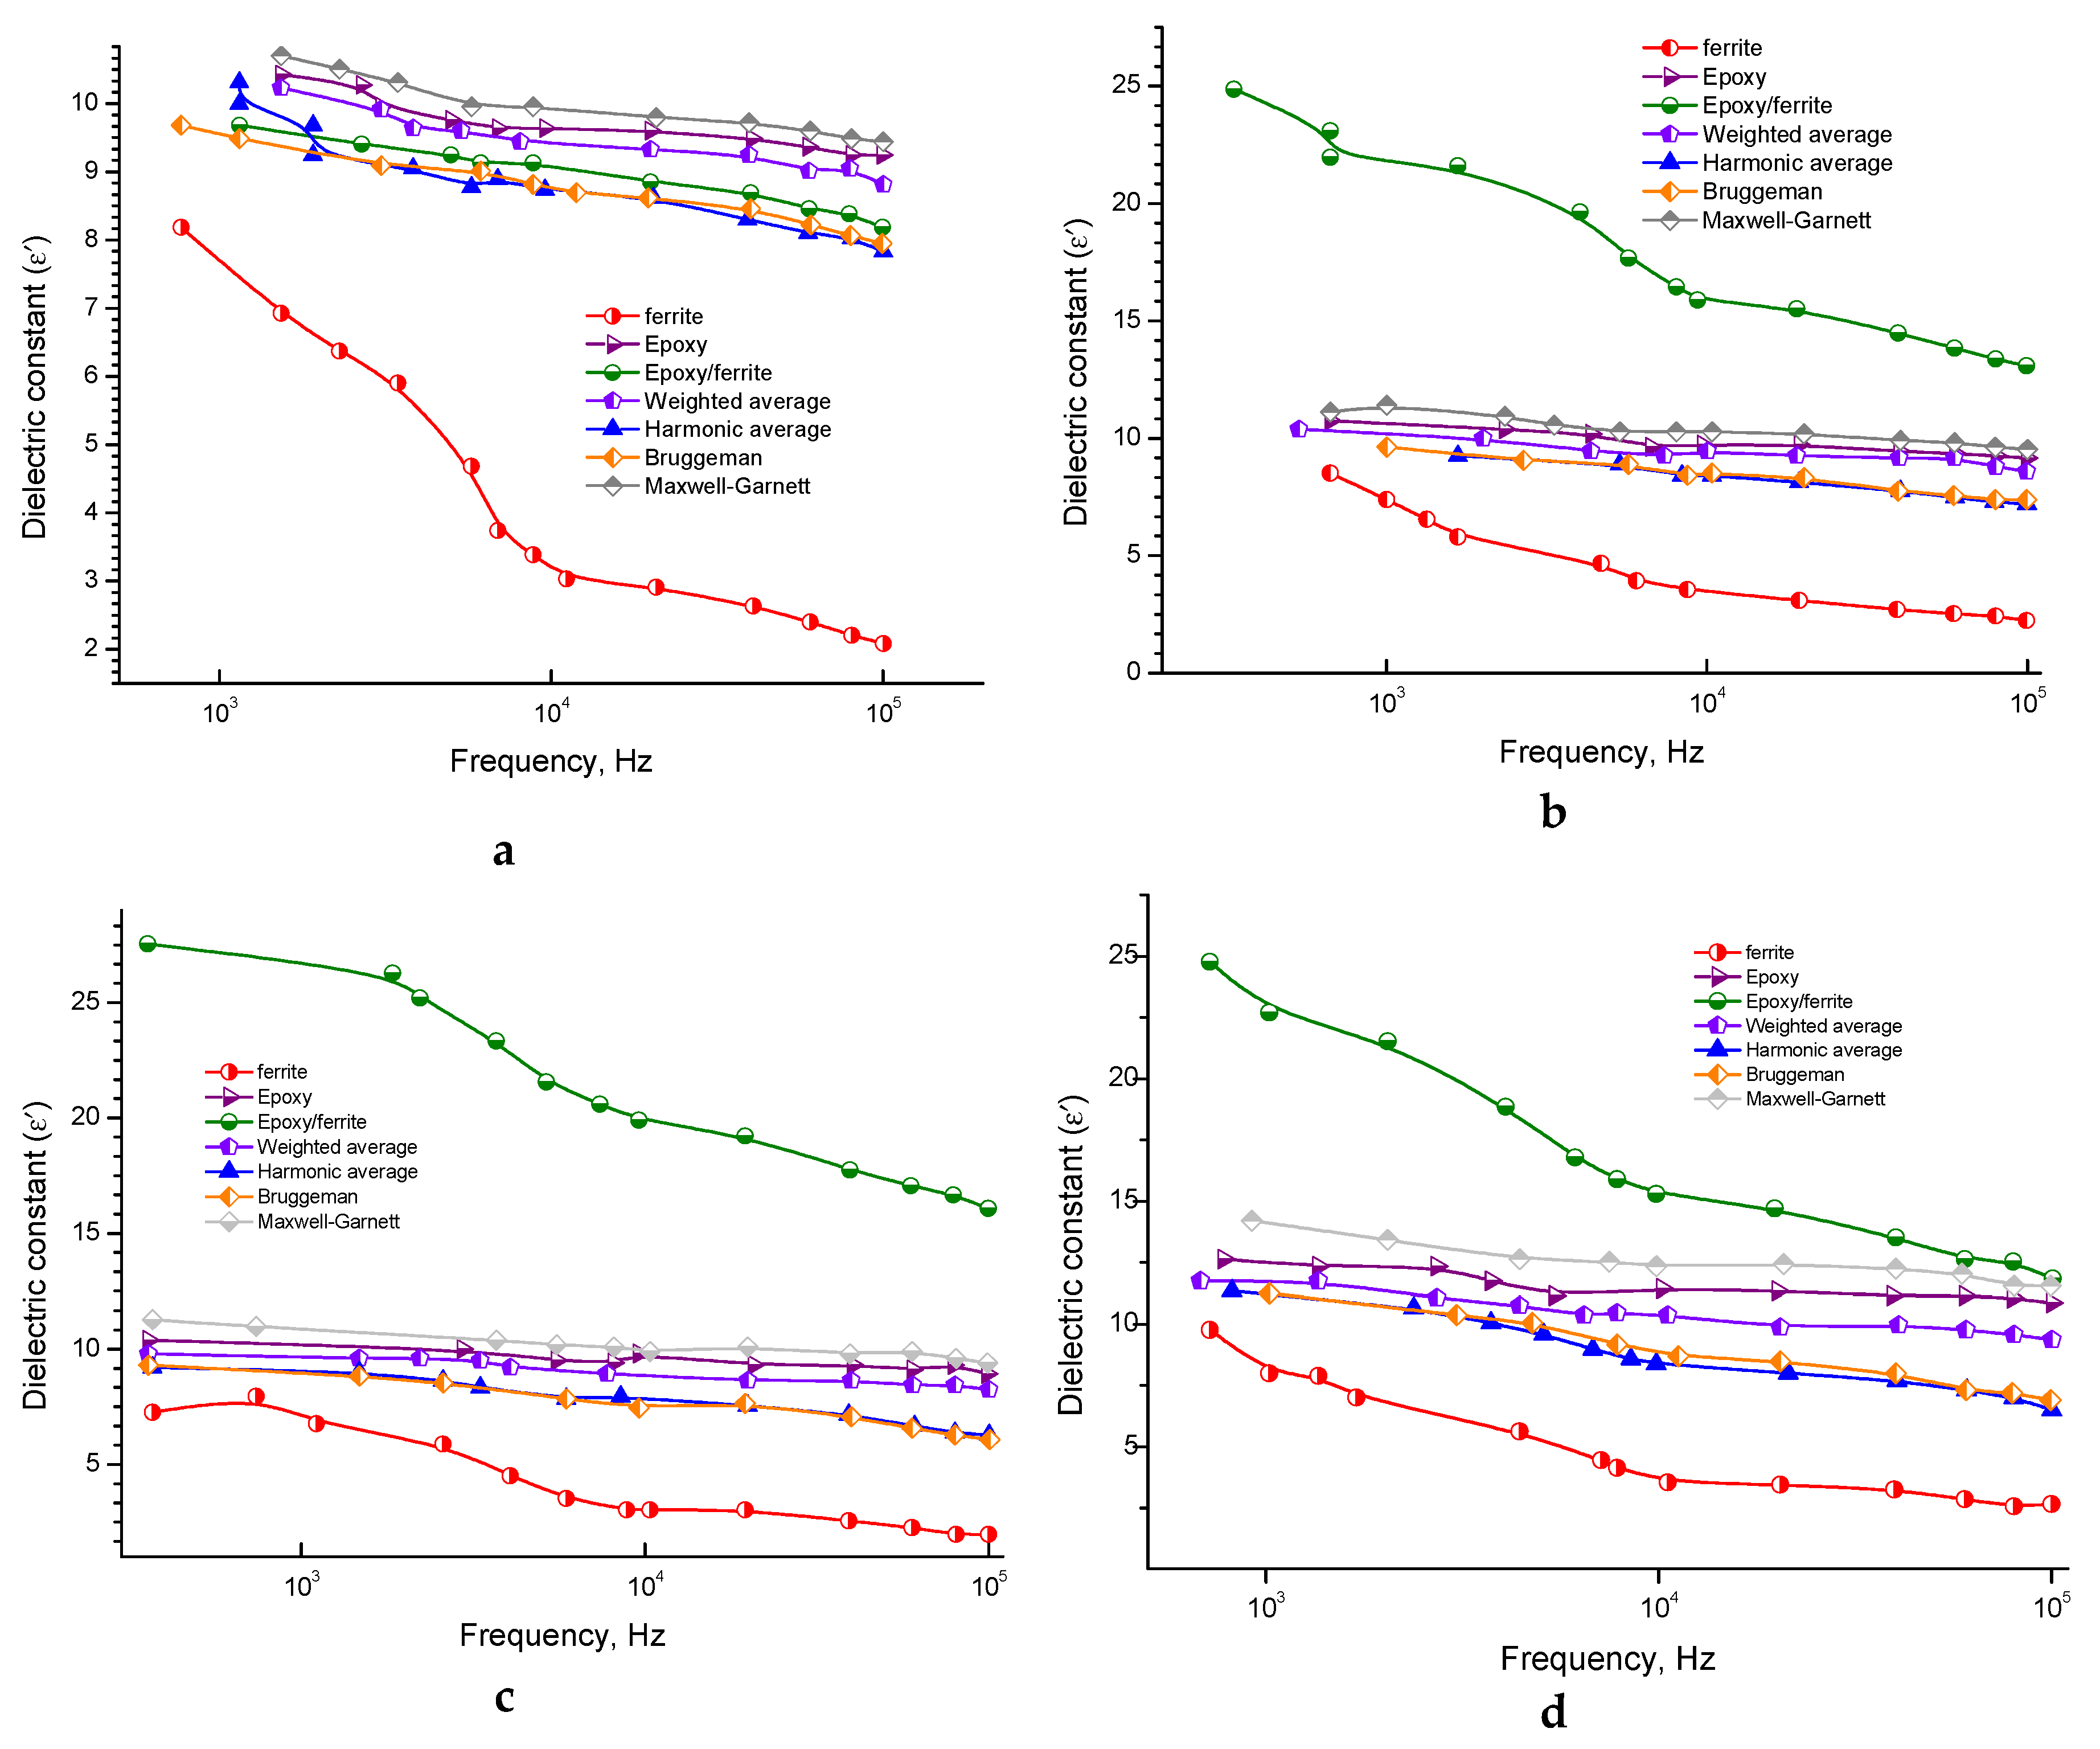
3.1.2. The Behavior of Dielectric Constant

The relation between the dielectric constant (ε′) and the frequency at different temperatures is shown in Figure 3a–f. The ε′ at different temperatures is decreasing with increasing the frequency.
At lower frequencies, the decrease is very sharp, and vice versa, at higher frequencies. The high value of ε′ has been explained by Koop’s theory or model [57], as mentioned above. The interfacial polarization occurred according to the accumulation of charges between the grain and grain boundary and increasing ε′ [54,55,56].
Consequently, there is a strong connection between the conduction mechanism, i.e., the conduction process of the ferrites and the dielectric behavior, i.e., the polarization process, which are similar to each other [66]. When increasing the applied field frequency, ε′ decreases and reaches a constant value, because the polarization could not follow its fluctuations at a specific frequency of the applied electric field [67]. Likewise, the electrons direction motion will be reversed by increasing the frequency, and, thus, will prevent the electrons from reaching the grain boundary so that the total polarization will decrease and, as a result, the dielectric constant will also decrease [56].
With increasing the temperature, ε′ increased, and this increase can be correctly seen at lower frequencies. With increasing the temperature, the electron exchange interactions increase and, as a result, ε′ enhances. It is worth mentioning that the polarization has four contributions in any material—interfacial, dipolar, atomic, and electronic polarization. At high frequencies, atomic and electronic polarizations are necessary and temperature-independent. The interfacial and dipolar polarization are temperature dependent. The interfacial polarization is directly proportional to the temperature, and the dipolar polarization is inversely proportional to the temperature [55,56], and this explains the detected increase in ε′ at lower frequencies. From Figure 3b–f, the ε′ values of the pure epoxy and composites at almost similar temperatures are significantly lower than that of the pure ferrite sample. This can be explained based on the strong correlation between the conduction mechanism and the dielectric behavior mentioned above, along with the fact that the main contributor to the dielectric constant in such heterogeneous structures is the interfacial polarization. Moreover, the ε values of the composite samples at almost similar temperatures increase as the fraction of ferrite increases in the sample, except for the sample of 50% ferrite, which may have some cracks as mentioned above.
From the previous discussions, the conductivity results and the constant dielectric results of these samples and their interpretations are consistent and reinforce each other.

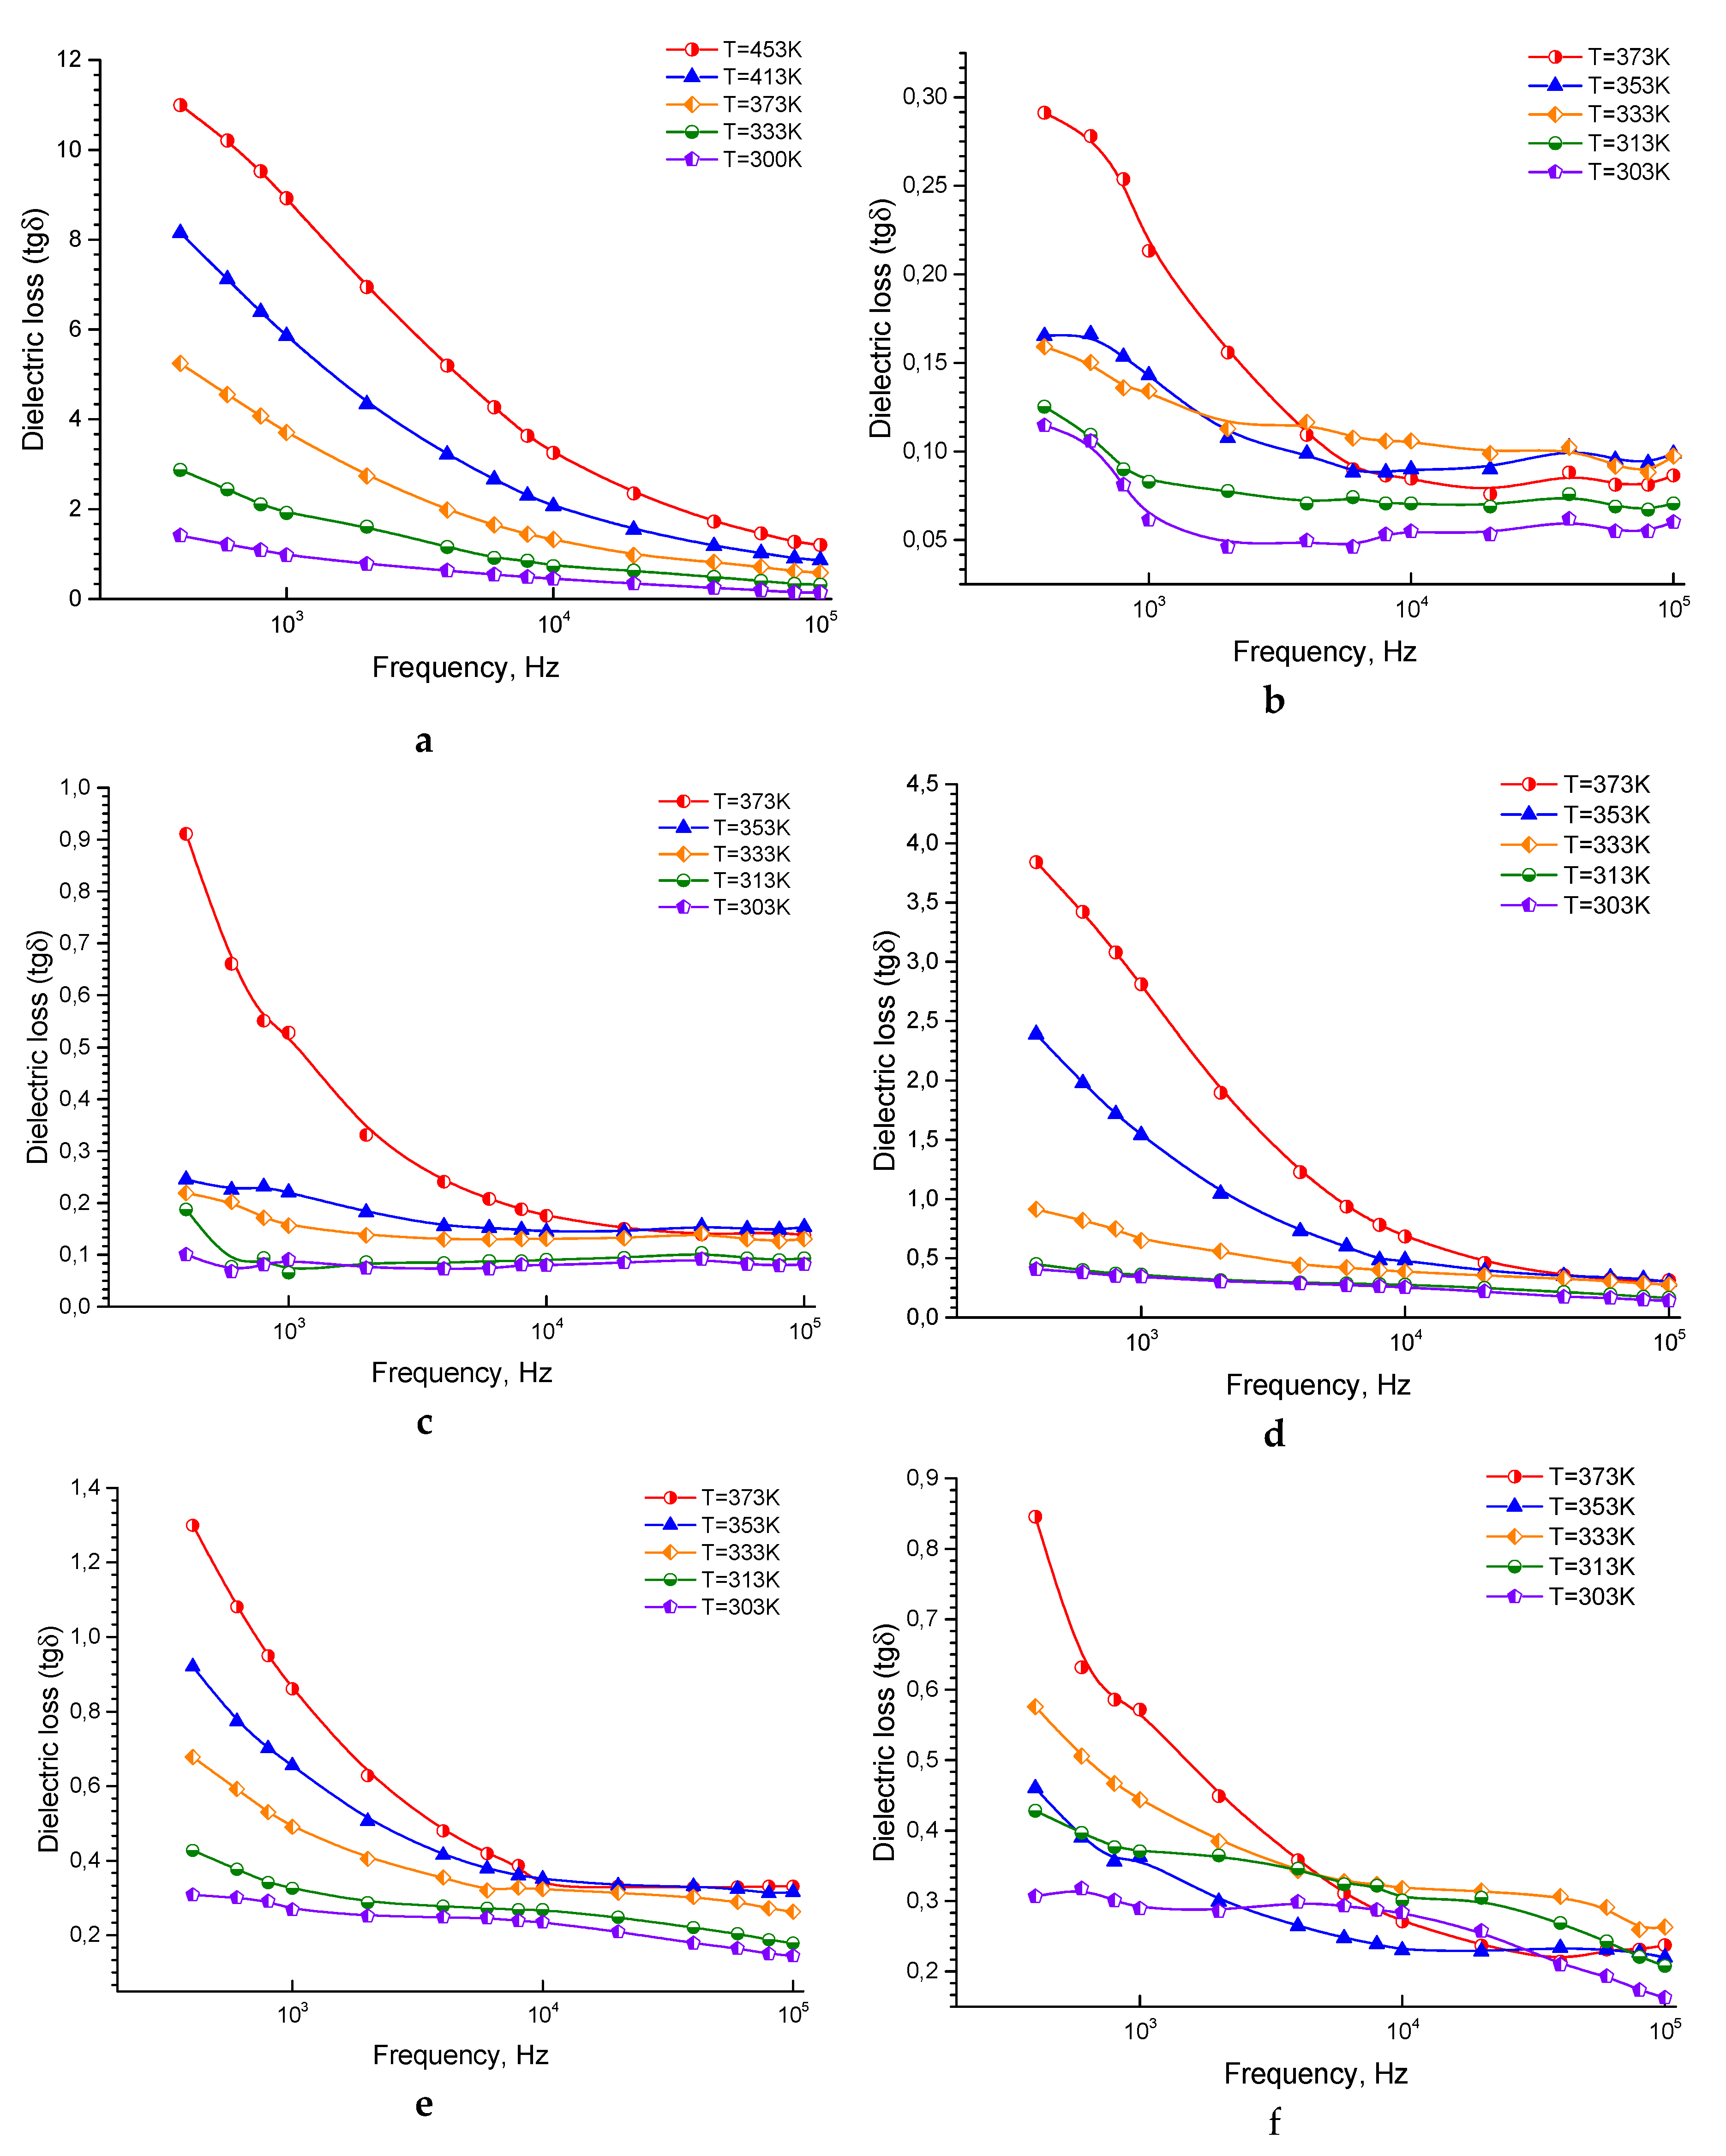
3.1.3. The Behavior of Dielectric Loss tangent

The relation between the tanδ dielectric loss and the frequency at different temperatures for the ferrite sample, pure epoxy, and the composites is shown in Figure 4a–f. tanδ for all the samples shows a typical behavior with frequency, that decreases with increasing the frequency. For all the samples, tanδ decreases quickly at low frequencies, although the degree of the decrease is decelerating at the high-frequencies and then turn out to be nearly independent of the frequency. Such behavior can be clarified according to the elevated resistivity due to the grain boundary at the lower frequencies region. So, more energy is essential for the electron exchange between Fe2+ and Fe3+ ions, and, as a result, the loss is high. Besides, there is a discrepancy with the measured tanδ = ε″/ε′ dielectric loss; where ε″, ε′ represents the resistive current and the capacitive current, respectively. Due to the grains at the high frequencies (low resistivity), low energy is required for the electron transmission at the octahedral site. Moreover, tanδ depends on many factors, such as structural homogeneity, stoichiometry, and Fe2+ content. The latter depends on other factors like the annealing temperature and the composition of the samples [54]. Also, as mentioned above, there is a great connection between the conduction mechanism and the dielectric behavior of the ferrites. In n-type ferrites, the conduction mechanism is caused by the electrons hopping between Fe2+ and Fe3+. The hopping occurred at a specific frequency when this frequency is equal to the applied electric field frequency. The dielectric loss is observed to be maximum and very high [66,67,68].
In these samples, the exceptionally high dielectric loss is not observed which is, probably, caused by the low conductivity rendering to the ferrite sample porous structure, and the presence of epoxy in the composite samples may lead to reducing the relaxation frequency of the samples to values less than the measured frequencies range occurred. Also, for all the samples, tanδ increases with increasing temperature, which is predictable because the resistivity of the samples decreases with increasing temperature [54]. It is worth mention that the low of loss tangent is observed in pure epoxy may be due to the significant decrease in conductivity according to insulating property of the epoxy so that a decrease of the relaxation frequency of the sample to values less than the measured range of frequencies may have occurred, which may decrease in the loss tangent [69,70,71]. The reduction in conductivity and losses can be useful for several applications demanding the reduction of the eddy current effects [59,60]. The prepared samples are promising materials for practical use as elements of microwave devices according to previous studies depending on the magnetic properties for the studied samples [47,72].

3.2. Modeling Dielectric Constant Behavior by Mixing Formulas

To determine the field of application of composite materials (CM), one needs to know their dielectric and magnetic frequency dependence. To solve this problem, it is necessary to describe the dielectric constant of CM as a function depending on the permeability of the primary components: the matrix and the filler.
The standard approach to solving this problem is to apply empirical mixing formulas that use simple idealized models based on a quasi-static consideration of ellipsoidal inclusions and leading to mathematically simple expressions [73,74,75]. As a rule, the two-phases CM is considered, in which identical inclusions are enclosed in a homogeneous matrix (matrix mixtures). The effective properties of such a mixture depend not only on the intrinsic properties of the inclusions and the matrix but also on the morphology of the CM, which characterizes the structure of the material, including concentration, shape, and correlations in the location of inclusions, for example, the presence of agglomerates, the preferential orientation of inclusions, etc. The concentration and characteristics of the form of inclusions usually formulate explicit formulas, and other morphological characteristics are taken into account by choosing its type [76]. There is a considerable variety of mixing formulas. To simulate the dielectric constant, we will use the following ones.

3.2.1. The Maxwell Garnett (MG) Model

This model describes a medium where particles are uniformly distributed in the sample matrix, occupying its entire volume. It is assumed that the interaction between adjacent particles is not significant. We can operate with the concept of the dielectric constant ε′ as the total polarizability of all inclusions. The interaction between particles described by this formula is the smallest with the current concentration of inclusions.
ε = ε m ( p N ( 1 p ) + s m s i + 1 )
where εm, εi dielectric constant of the matrix and inclusions, respectively; N is the form factor of inclusions; p – is the bulk density. The transition from mass percentage and density of components to volume are described in [45].

3.2.2. The Symmetric Brüggemann Model

In the literature on magnetic CM [77], it is often called the Polder – van Santen theory. It is based on the formal separation of the CM matrix into individual particles having the same shape as the inclusions; both inclusions and matrix particles are considered immersed in an effective medium characterized by the same permeability as the whole CM. To obtain a homogeneous medium, the polarizabilities of both types of particles must compensate each other, which leads to the equation written concerning the dielectric constant:
p ε i ε ε + N ( ε i ε ) + ( 1 p ) ε m ε ε + N ( ε m ε ) = 0
As a result of solving this equation, we get two roots. The root leading that gives negative ε′ values in plotting was not used.

3.2.3. Weighted Average Model

The value of the dielectric constant of the obtained composite can be found using a simple weighted average [78] of the initial components of the matrix and the material of the inclusions [75]:
ε = ε i p + ε m ( 1 p )
Alternatively, by using the harmonic average formula (model):
ε = 1 p s i 1 p s m
Most of the mixing formulas for the data used to give similar results, so below, we will only consider those that give the greatest agreement with the experiment.
In Figure 5a–d, it can be seen that the values of the dielectric constant for the composite, starting from about 30 wt.%, have a synergistic effect. This is manifested in the fact that the values of ε′ for the resulting composite are higher than for the original components.
The research paper [68] describes that the effect of the synergistic increase in permittivity was not observed in composite with high-resistance NiZn fillers, on the other hand, this was observed in composites containing MnZn ferrite that has significant electrical conductivity at high > 40 vol.% filler concentrations. In the considered composites with an even more conductive Li ferrite based on inorganic ferroelectrics, the effect already exists at a low volumetric concentration of fillers. Moreover, this effect was observed in a composite that has manifested fracture with 50 wt.%, although in a more weakened form [79,80].
NiCuZn ferrite, with the addition of TiO2, was considered by Yanag et al. 2019 [73]. This additive led to a decrease in the grain size and, accordingly, a more uniform and dense structure of the ferrite. With a smaller grain size, a large part of titanium oxide falls into the intergranular boundaries, forming a new phase there, which increases the resistance of the sample and reduces the losses. Thus, we have a phase of grains in an intergrain medium with high electrical resistance. Such a phase can contribute to the dielectric constant, but this was not taken into account when the model was calculated. In this case, the right way is to apply mixing formulas to filler particles, considering them as a composite in values into the calculated formulas as the contribution of fillers. Therefore, a more thorough study of the structure and elemental distribution in the filler granules may explain the synergistic effect.
The use of the additive ∆ε allows us to obtain the form of a simulated curve with a better approximation order to obtain valid values of the parameters for granules, and already substitute these of the experimental data.

4. Conclusions

The AC conductivity for all the samples indicated the presence of the semiconducting behavior in the investigated samples. The AC conductivity of the pure epoxy has a very low value, that can decrease the eddy current losses, and this behavior can be appropriate for high-frequency applications. The AC conductivity of the composites is slightly higher than that of the pure epoxy resin, but still acceptable for practical applications. The permittivity of the composite under consideration was simulated by using various mixing formulas (models). The Harmonic and Bruggeman mixing formulas gave the most significant agreement for the composite with 20 wt.%. Modeling for higher concentrations is challenging to estimate theoretically. This discrepancy could be explained by an increase in the ferrite filler increasing the viscosity, that may cause cracks and non-uniform distribution in the prepared samples. These defects can obviously affect all the measured parameters experimentally, that leads to theoretical results, did not match with the experimental results.

Author Contributions

Conceptualization, A.T.M., S.T. and A.V.T.; methodology, A.S.B.S., E.L.T. and D.Z.; software, O.S.S.; validation, M.A.D., O.S.S. and K.A.A.; formal analysis, A.V.T.; investigation, M.A.D.; resources, R.B.J.; data curation, A.T.M.; writing—original draft preparation, M.A.D., S.V.T. and K.A.A.; writing—review and editing, A.V.T.; visualization, S.A.S. and A.A.P.; supervision, A.T.M., A.S.B.S., D.Z., R.B.J. and C.S.; project administration, S.V.T.; funding acquisition, M.A.D. and A.V.T. All authors have read and agreed to the published version of the manuscript.

Funding

The work was support by the Russian Science Foundation (Agreement No. 19-72-10071 from 06 Aug. 2019).

Conflicts of Interest

The authors declare no conflict of interest. The funders had no role in the design of the study; in the collection, analyses, or interpretation of data; in the writing of the manuscript, or in the decision to publish the results.

References

  1. Kumar, A.M.; Varma, M.C.; Dube, C.L.; Rao, K.H.; Kashyap, S.C. Development of Ni–Zn nanoferrite core material with improved saturation magnetization and DC resistivity. J. Magn. Magn. Mater. 2008, 320, 1995–2000. [Google Scholar] [CrossRef]
  2. Mathew, D.S.; Juang, R.-S. An overview of the structure and magnetism of spinel ferrite nanoparticles and their synthesis in microemulsions. Chem. Eng. J. 2007, 129, 51–65. [Google Scholar] [CrossRef]
  3. Dippong, T.; Levei, E.A.; Cadar, O. Preparation of CoFe2O4/SiO2 Nanocomposites at low temperatures using short chain diols. J. Chem. 2017, 2017, 3. [Google Scholar] [CrossRef] [Green Version]
  4. Yakovenko, O.S.; Matzui, L.Y.; Vovchenko, L.L.; Trukhanov, A.V.; Kazakevich, I.S.; Trukhanov, S.V.; Prylutskyy, Y.I.; Ritter, U. Magnetic anisotropy of the graphite nanoplatelet–epoxy and MWCNT–epoxy composites with aligned barium ferrite filler. J. Mater. Sci. 2017, 52, 5345–5358. [Google Scholar] [CrossRef]
  5. Moreau, L.M.; Ha, D.-H.; Zhang, H.; Hovden, R.; Muller, D.A.; Robinson, R.D. Defining crystalline/amorphous phases of nanoparticles through X-ray absorption spectroscopy and X-ray diffraction: The case of nickel phosphide. Chem. Mater. 2013, 25, 2394–2403. [Google Scholar] [CrossRef]
  6. Hu, C.; Gao, Z.; Yang, X. One-pot low temperature synthesis of MFe2O4 (M=Co, Ni, Zn) superparamagnetic nanocrystals. J. Magn. Magn. Mater. 2008, 320, L70–L73. [Google Scholar] [CrossRef]
  7. Zhao, H.; Zheng, Z.; Wong, K.W.; Wang, S.; Huang, B.; Li, D. Fabrication and electrochemical performance of nickel ferrite nanoparticles as anode material in lithium ion batteries. Electrochem. Commun. 2007, 9, 2606–2610. [Google Scholar] [CrossRef]
  8. Sivakumar, M.; Towata, A.; Yasui, K.; Tuziuti, T.; Iida, Y. A new ultrasonic cavitation approach for the synthesis of zinc ferrite nanocrystals. Curr. Appl. Phys. 2006, 6, 591–593. [Google Scholar] [CrossRef]
  9. Thakur, S.; Katyal, S.C.; Singh, M. Structural and magnetic properties of nano nickel–zinc ferrite synthesized by reverse micelle technique. J. Magn. Magn. Mater. 2009, 321, 1–7. [Google Scholar] [CrossRef]
  10. Poddar, P.; Srikanth, H.; Morrison, S.A.; Carpenter, E.E. Inter-particle interactions and magnetism in manganese–zinc ferrite nanoparticles. J. Magn. Magn. Mater. 2005, 288, 443–451. [Google Scholar] [CrossRef]
  11. Ohsaki, S.; Hono, K.; Hidaka, H.; Takaki, S. Characterization of nanocrystalline ferrite produced by mechanical milling of pearlitic steel. Scr. Mater. 2005, 52, 271–276. [Google Scholar] [CrossRef]
  12. Rao, B.P.; Caltun, O.; Cho, W.S.; Kim, C.-O.; Kim, C. Synthesis and characterization of mixed ferrite nanoparticles. J. Magn. Magn. Mater. 2007, 310, e812–e814. [Google Scholar] [CrossRef]
  13. Son, S.; Taheri, M.; Carpenter, E.; Harris, V.; McHenry, M. Synthesis of ferrite and nickel ferrite nanoparticles using radio-frequency thermal plasma torch. J. Appl. Phys. 2002, 91, 7589–7591. [Google Scholar] [CrossRef] [Green Version]
  14. Chu, N.; Wang, X.; Liu, Y.; Jin, H.; Wu, Q.; Li, L.; Wang, Z.; Ge, H. Magnetic properties of low Mn-doped NiCuZn nanocrystalline ferrites. J. Alloys Compd. 2009, 470, 438–442. [Google Scholar] [CrossRef]
  15. Bhosale, D.N.; Verenkar, V.M.S.; Rane, K.S.; Bakare, P.P.; Sawant, S.R. Initial susceptibility studies on Cu-Mg-Zn ferrites. Mater. Chem. Phys. 1999, 59, 57–62. [Google Scholar] [CrossRef]
  16. Maletin, M.; Moshopoulou, E.G.; Kontos, A.G.; Devlin, E.; Delimitis, A.; Zaspalis, V.T.; Nalbandian, L.; Srdic, V.V. Synthesis and structural characterization of In-doped ZnFe2O4 nanoparticles. J. Eur. Ceram. Soc. 2007, 27, 4391–4394. [Google Scholar] [CrossRef]
  17. Stewart, S.J.; Tueros, M.J.; Cernicchiaro, G.; Scorzelli, R.B. Magnetic size growth in nanocrystalline copper ferrite. Solid State Commun. 2004, 129, 347–351. [Google Scholar] [CrossRef]
  18. Soibam, I.; Phanjoubam, S.; Prakash, C. Mössbauer and magnetic studies of cobalt substituted lithium zinc ferrites prepared by citrate precursor method. J. Alloys Compd. 2009, 475, 328–331. [Google Scholar] [CrossRef]
  19. Dippong, T.; Levei, E.A.; Tanaselia, C.; Gabor, M.; Nasui, M.; Barbu Tudoran, L.; Borodi, G. Magnetic properties evolution of the CoxFe3−xO4/SiO2 system due to advanced thermal treatment at 700 °C and 1000 °C. J. Magn. Magn. Mater. 2016, 410, 47–54. [Google Scholar] [CrossRef]
  20. Li, J.; Zhou, D.; Liu, W.-F.; Su, J.-Z.; Fu, M.-S. Novel and facile reduced graphene oxide anchored Ni-Co-Zn-Nd-ferrites composites for microwave absorption. Scr. Mater. 2019, 171, 42–46. [Google Scholar] [CrossRef]
  21. Vinnik, D.A.; Podgornov, F.V.; Zabeivorota, N.S.; Trofimov, E.A.; Zhivulin, V.E.; Chernukha, A.S.; Gavrilyak, M.V.; Gudkova, S.A.; Zherebtsov, D.A.; Ryabov, A.V.; et al. Effect of treatment conditions on structure and magnetodielectric properties of barium hexaferrites. J. Magn. Magn. Mater. 2020, 498, 166190. [Google Scholar] [CrossRef]
  22. Gul, I.H.; Ahmed, W.; Maqsood, A. Electrical and magnetic characterization of nanocrystalline Ni–Zn ferrite synthesis by co-precipitation route. J. Magn. Magn. Mater. 2008, 320, 270–275. [Google Scholar] [CrossRef]
  23. Murugendrappa, M.V.; Ambika Prasad, M.V.N. Dielectric spectroscopy of polypyrrole–γ–Fe2O3 composites. Mater. Res. Bull. 2006, 41, 1364–1369. [Google Scholar] [CrossRef]
  24. De Morais, J.E.V.; Oliveira, R.G.M.; Silva, M.A.S.; Costa, M.M.; Sales, A.J.M.; Bessa, V.L.; Rodrigues, A.R.; Vasconcelos, I.F.; Goldsmith, J.; Carroll, T.K.; et al. Magneto-dielectric properties studies of the matrix composite [SrFe12O19(SFO)1-X – BiFeO3(BFO)X]. J. Alloys Compd. 2018, 735, 2111–2118. [Google Scholar] [CrossRef]
  25. Dippong, T.; Goga, F.; Levei, E.A.; Cadar, O. Influence of zinc substitution with cobalt on thermal behaviour, structure and morphology of zinc ferrite embedded in silica matrix. J. Solid State Chem. 2019, 275, 159–166. [Google Scholar] [CrossRef]
  26. Dippong, T.; Levei, E.A.; Cadar, O.; Deac, I.G.; Diamandescu, L.; Barbu-Tudoran, L. Effect of nickel content on structural, morphological and magnetic properties of NixCo1−xFe2O4/SiO2 nanocomposites. J. Alloys Compd. 2019, 786, 330–340. [Google Scholar] [CrossRef]
  27. Li, J.; Zhou, D. Influence of Ag doping on the dielectric and magnetic properties of LiFe5O8 ceramics. J. Alloys Compd. 2019, 785, 13–18. [Google Scholar] [CrossRef]
  28. Vinnik, D.A.; Zhivulin, V.E.; Starikov, A.Y.; Gudkova, S.A.; Trofimov, E.A.; Trukhanov, A.V.; Trukhanov, S.V.; Turchenko, V.A.; Matveev, V.V.; Lahderanta, E.; et al. Influence of titanium substitution on structure, magnetic and electric properties of barium hexaferrites BaFe12−xTixO19. J. Magn. Magn. Mater. 2020, 498, 166117. [Google Scholar] [CrossRef]
  29. Dippong, T.; Deac, I.G.; Cadar, O.; Levei, E.A.; Diamandescu, L.; Borodi, G. Effect of Zn content on structural, morphological and magnetic behavior of ZnxCo1−xFe2O4/SiO2 nanocomposites. J. Alloys Compd. 2019, 792, 432–443. [Google Scholar] [CrossRef]
  30. Ismail, I.; Hashim, M.; Ibrahim, I.R.; Nazlan, R.; Mohd Idris, F.; Shafie, S.E.; Manap, M.; Bahmanrokh, G.; Abdullah, N.H.; Wan Rahman, W.N. Crystallinity and magnetic properties dependence on sintering temperature and soaking time of mechanically alloyed nanometer-grain Ni0.5Zn0.5Fe2O4. J. Magn. Magn. Mater. 2013, 333, 100–107. [Google Scholar] [CrossRef]
  31. Liu, R.; Shen, X.; Jiang, C.; Song, F.; Li, H. Preparation of Ni0.5Zn0.5Fe2O4/SiO2 nanocomposites and their adsorption of bovine serum albumin. J. Alloys Compd. 2012, 511, 163–168. [Google Scholar] [CrossRef]
  32. Aphesteguy, J.C.; Damiani, A.; DiGiovanni, D.; Jacobo, S.E. Microwave-absorbing characteristics of epoxy resin composites containing nanoparticles of NiZn- and NiCuZn-ferrites. Phys. B Condens. Matter 2009, 404, 2713–2716. [Google Scholar] [CrossRef]
  33. Almessiere, M.A.; Trukhanov, A.V.; Khan, F.A.; Slimani, Y.; Tashkandi, N.; Turchenko, V.A.; Zubar, T.I.; Tishkevich, D.I.; Trukhanov, S.V.; Panina, L.V.; et al. Correlation between microstructure parameters and anti-cancer activity of the [Mn0.5Zn0.5](EuxNdxFe2-2x)O4 nanoferrites produced by modified sol-gel and ultrasonic methods. Ceram. Int. 2020, 46, 7346–7354. [Google Scholar] [CrossRef]
  34. Dukenbayev, K.; Korolkov, I.V.; Tishkevich, D.I.; Kozlovskiy, A.L.; Trukhanov, S.V.; Gorin, Y.G.; Shumskaya, E.E.; Kaniukov, E.Y.; Vinnik, D.A.; Zdorovets, M.V.; et al. Fe3O4 nanoparticles for complex targeted delivery and boron neutron capture therapy. Nanomaterials 2019, 9, 494. [Google Scholar] [CrossRef] [Green Version]
  35. Yakovenko, O.S.; Matzui, L.Y.; Vovchenko, L.L.; Lozitsky, O.V.; Prokopov, O.I.; Lazarenko, O.A.; Zhuravkov, A.V.; Oliynyk, V.V.; Launets, V.L.; Trukhanov, S.V.; et al. Electrophysical properties of epoxy-based composites with graphite nanoplatelets and magnetically aligned magnetite. Mol. Cryst. Liq. Cryst. 2018, 661, 68–80. [Google Scholar] [CrossRef]
  36. Trukhanov, A.V.; Astapovich, K.A.; Almessiere, M.A.; Turchenko, V.A.; Trukhanova, E.L.; Korovushkin, V.V.; Amirov, A.A.; Darwish, M.A.; Karpinsky, D.V.; Vinnik, D.A.; et al. Pecularities of the magnetic structure and microwave properties in Ba(Fe1−xScx)12O19 (x < 0.1) hexaferrites. J. Alloys Compd. 2020, 822, 153575. [Google Scholar] [CrossRef]
  37. Almessiere, M.A.; Trukhanov, A.V.; Slimani, Y.; You, K.Y.; Trukhanov, S.V.; Trukhanova, E.L.; Esa, F.; Sadaqat, A.; Chaudhary, K.; Zdorovets, M.; et al. Correlation between composition and electrodynamics properties in nanocomposites based on hard/soft ferrimagnetics with strong exchange coupling. Nanomaterials 2019, 9, 202. [Google Scholar] [CrossRef] [Green Version]
  38. Matzui, L.Y.; Trukhanov, A.V.; Yakovenko, O.S.; Vovchenko, L.L.; Zagorodnii, V.V.; Oliynyk, V.V.; Borovoy, M.O.; Trukhanova, E.L.; Astapovich, K.A.; Karpinsky, D.V.; et al. Functional magnetic composites based on hexaferrites: Correlation of the composition, magnetic and high-frequency properties. Nanomaterials 2019, 9, 1720. [Google Scholar] [CrossRef] [Green Version]
  39. Turchenko, V.A.; Trukhanov, A.V.; Bobrikov, I.A.; Trukhanov, S.V.; Balagurov, A.M. Study of the crystalline and magnetic structures of BaFe11.4Al0.6O19 in a wide temperature range. J. Surf. Investig. 2015, 9, 17–23. [Google Scholar] [CrossRef]
  40. Trukhanov, A.V.; Darwish, M.A.; Panina, L.V.; Morchenko, A.T.; Kostishyn, V.G.; Turchenko, V.A.; Vinnik, D.A.; Trukhanova, E.L.; Astapovich, K.A.; Kozlovskiy, A.L.; et al. Features of crystal and magnetic structure of the BaFe12−xGaxO19 (x ≤ 2) in the wide temperature range. J. Alloys Compd. 2019, 791, 522–529. [Google Scholar] [CrossRef]
  41. Trukhanov, A.V.; Almessiere, M.A.; Baykal, A.; Trukhanov, S.V.; Slimani, Y.; Vinnik, D.A.; Zhivulin, V.E.; Starikov, A.Y.; Klygach, D.S.; Vakhitov, M.G.; et al. Influence of the charge ordering and quantum effects in heterovalent substituted hexaferrites on their microwave characteristics. J. Alloys Compd. 2019, 788, 1193–1202. [Google Scholar] [CrossRef]
  42. Ramajo, L.A.; Cristóbal, A.A.; Botta, P.M.; Porto López, J.M.; Reboredo, M.M.; Castro, M.S. Dielectric and magnetic response of Fe3O4/epoxy composites. Compos. Part A Appl. Sci. 2009, 40, 388–393. [Google Scholar] [CrossRef]
  43. Wang, Y.; Li, L.; Jiang, J.; Liu, H.; Qiu, H.; Xu, F. Conductivity and magnetic properties of Zn0.6Cu0.4Cr0.5La0.04Fe1.46O4/PPy composites prepared by in situ inverse microemulsion polymerization. React. Funct. Polym. 2008, 68, 1587–1593. [Google Scholar] [CrossRef]
  44. Li, G.; Yan, S.; Zhou, E.; Chen, Y. Preparation of magnetic and conductive NiZn ferrite-polyaniline nanocomposites with core-shell structure. Colloid Surf. A 2006, 276, 40–44. [Google Scholar] [CrossRef]
  45. Salem, M.M.; Panina, L.V.; Trukhanova, E.L.; Darwish, M.A.; Morchenko, A.T.; Zubar, T.I.; Trukhanov, S.V.; Trukhanov, A.V. Structural, electric and magnetic properties of (BaFe11.9Al0.1O19)1−x - (BaTiO3)x composites. Compos. B Eng. 2019, 174, 107054. [Google Scholar] [CrossRef]
  46. Saafan, S.A.; Assar, S.T.; Moharram, B.M.; El Nimr, M.K. Comparison study of some structural and magnetic properties of nano-structured and bulk Li–Ni–Zn ferrite samples. J. Magn. Magn. Mater. 2010, 322, 628–632. [Google Scholar] [CrossRef]
  47. Darwish, M.A.; Saafan, S.A.; El-Kony, D.; Salahuddin, N.A. Preparation and investigation of dc conductivity and relative permeability of epoxy/Li–Ni–Zn ferrite composites. J. Magn. Magn. Mater. 2015, 385, 99–106. [Google Scholar] [CrossRef]
  48. Trukhanov, S.V.; Trukhanov, A.V.; Kostishin, V.G.; Panina, L.V.; Kazakevich, I.S.; Turchenko, V.A.; Oleinik, V.V.; Yakovenko, E.S.; Matsui, L.Y. Magnetic and absorbing properties of M-type substituted hexaferrites BaFe12−xGaxO19 (0.1 < x < 1.2). JETP 2016, 123, 461–469. [Google Scholar] [CrossRef]
  49. Yang, Y.; Wang, F.; Shao, J.; Huang, D.; He, H.; Trukhanov, A.V.; Trukhanov, S.V. Influence of Nd-NbZn co-substitution on structural, spectral and magnetic properties of M-type calcium-strontium hexaferrites Ca0.4Sr0.6−xNdxFe12.0−x(Nb0.5Zn0.5)xO19. J. Alloys Compd. 2018, 765, 616–623. [Google Scholar] [CrossRef]
  50. El Hiti, M.A. Dielectric behavior and ac electrical conductivity of Zn-substituted Ni-Mg ferrites. J. Magn. Magn. Mater. 1996, 164, 187–196. [Google Scholar] [CrossRef]
  51. Abdeen, A.M. Electric conduction in Ni–Zn ferrites. J. Magn. Magn. Mater. 1998, 185, 199–206. [Google Scholar] [CrossRef]
  52. Vinnik, D.A.; Klygach, D.S.; Zhivulin, V.E.; Malkin, A.I.; Vakhitov, M.G.; Gudkova, S.A.; Galimov, D.M.; Zherebtsov, D.A.; Trofimov, E.A.; Knyazev, N.S.; et al. Electromagnetic properties of BaFe12O19:Ti at centimeter wavelengths. J. Alloys Compd. 2018, 755, 177–183. [Google Scholar] [CrossRef]
  53. Elliott, S.R. Ac conduction in amorphous chalcogenide and pnictide semiconductors. Adv. Phys. 1987, 36, 135–217. [Google Scholar] [CrossRef]
  54. Batoo, K.M.; Kumar, S.; Lee, C.G.; Alimuddin. Finite size effect and influence of temperature on electrical properties of nanocrystalline Ni–Cd ferrites. Curr. Appl. Phys. 2009, 9, 1072–1078. [Google Scholar] [CrossRef]
  55. Soibam, I.; Phanjoubam, S.; Sharma, H.B.; Sarma, H.N.K.; Laishram, R.; Prakash, C. Effects of cobalt substitution on the dielectric properties of Li–Zn ferrites. Solid State Commun. 2008, 148, 399–402. [Google Scholar] [CrossRef]
  56. Thakur, A.; Mathur, P.; Singh, M. Study of dielectric behaviour of Mn-Zn nano ferrites. J. Phys. Chem. Solids 2007, 68, 378–381. [Google Scholar] [CrossRef]
  57. Koops, C.G. On the dispersion of resistivity and dielectric constant of some semiconductors at audiofrequencies. Phys. Rev. 1951, 83, 121–124. [Google Scholar] [CrossRef]
  58. El Hiti, M.A. Electrical and dielectric properties of NixMg1−xFe2O4. J. Phys. III 1996, 6, 1307–1313. [Google Scholar] [CrossRef]
  59. Goldman, A. Modern Ferrite Technology; Springer: Pittsburgh, PA, USA, 2006. [Google Scholar] [CrossRef] [Green Version]
  60. Saafan, S.A.; Assar, S.T. Dielectric behavior of nano-structured and bulk Li Ni Zn ferrite samples. J. Magn. Magn. Mater. 2012, 324, 2989–3001. [Google Scholar] [CrossRef]
  61. Trukhanov, A.V.; Grabchikov, S.S.; Solobai, A.A.; Tishkevich, D.I.; Trukhanov, S.V.; Trukhanova, E.L. AC and DC-shielding properties for the Ni80Fe20/Cu film structures. J. Magn. Magn. Mater. 2017, 443, 142–148. [Google Scholar] [CrossRef]
  62. Gul, I.H.; Abbasi, A.Z.; Amin, F.; Anis-ur-Rehman, M.; Maqsood, A. Structural, magnetic and electrical properties of Co1−xZnxFe2O4 synthesized by co-precipitation method. J. Magn. Magn. Mater. 2007, 311, 494–499. [Google Scholar] [CrossRef]
  63. Ravinder, D. Effect of sintering temperature on electrical conductivity of mixed lithium-cadmium ferrites. Mater. Lett. 1999, 40, 198–203. [Google Scholar] [CrossRef]
  64. Ramana Reddy, A.V.; Ranga Mohan, G.; Boyanov, B.S.; Ravinder, D. Electrical transport properties of zinc-substituted cobalt ferrites. Mater. Lett. 1999, 39, 153–165. [Google Scholar] [CrossRef]
  65. Ravinder, D.; Chandrashekhar Reddy, A.; Shalini, P. High-temperature electrical conductivity of Li-Ge ferrites. J. Alloys Compd. 2003, 360, 30–33. [Google Scholar] [CrossRef]
  66. Almessiere, M.A.; Slimani, Y.; Güngüne, H.; Baykal, A.; Trukhanov, S.V.; Trukhanov, A.V. Manganese/Yttrium codoped strontium nanohexaferrites: Evaluation of magnetic susceptibility and Mössbauer spectra. Nanomaterials 2019, 9, 24. [Google Scholar] [CrossRef] [PubMed] [Green Version]
  67. Ravinder, D.; Latha, K. Dielectric behaviour of mixed Mg–Zn ferrites at low frequencies. Mater. Lett. 1999, 41, 247–253. [Google Scholar] [CrossRef]
  68. Salem, M.M.; Morchenko, A.T.; Panina, L.V.; Kostishyn, V.G.; Andreev, V.G.; Bibikov, S.B.; Nikolaev, A.N. Dielectric and magnetic properties of two-phase composite system: Mn-Zn or Ni-Zn ferrites in dielectric matrices. Phys. Proc. 2015, 75, 1360–1369. [Google Scholar] [CrossRef] [Green Version]
  69. Grabchikov, S.S.; Trukhanov, A.V.; Trukhanov, S.V.; Kazakevich, I.S.; Solobay, A.A.; Erofeenko, V.T.; Vasilenkov, N.A.; Volkova, O.S.; Shakin, A. Effectiveness of the magnetostatic shielding by the cylindrical shells. J. Magn. Magn. Mater. 2016, 398, 49–53. [Google Scholar] [CrossRef] [Green Version]
  70. Ravinder, D.; Kumar, K.V. Dielectric behaviour of erbium substituted Mn-Zn ferrites. Bull. Mater. Sci. 2001, 24, 505–509. [Google Scholar] [CrossRef]
  71. Turchenko, V.; Trukhanov, A.; Trukhanov, S.; Balasoiu, M.; Lupu, N. Correlation of crystalline and magnetic structures of barium ferrites with dual ferroic properties. J. Magn. Magn. Mater. 2019, 477, 9–16. [Google Scholar] [CrossRef]
  72. Assar, S.T.; Abosheiasha, H.F.; Mansour, D.E.A.; Darwish, M.A. Preparation and investigation of epoxy/Li0.5AlxFe2.5−xO4 nanocomposites for electronic packaging applications. J. Alloys Compd. 2020, 821, 153533. [Google Scholar] [CrossRef]
  73. Yang, Y.; Li, J.; Zhang, H.; Wang, G.; Rao, Y.; Gan, G. TiO2 tailored low loss NiCuZn ferrite ceramics having equivalent permeability and permittivity for miniaturized antenna. J. Magn. Magn. Mater. 2019, 487, 165318. [Google Scholar] [CrossRef]
  74. Morchenko, A.T. Modeling the structure and conditions of the absorption of electromagnetic radiation in magnetic composites using effective medium approximations. Bull. Russ. Acad. Sci. Phys. 2014, 78, 1209–1217. [Google Scholar] [CrossRef]
  75. Rozanov, K.N. Frequency-dependent effective material parameters of composites as a function of inclusion shape. In Composites and Their Properties; Koledintseva, M.Y., Ed.; IntechOpen: Rijeka, Croatia, 2012; p. 15. [Google Scholar] [CrossRef] [Green Version]
  76. Bruggeman, D.A.G. Berechnung verschiedener physikalischer konstanten von heterogenen substanzen. I. Dielektrizitätskonstanten und leitfähigkeiten der mischkörper aus isotropen substanzen. Ann. Phys. 1935, 416, 636–664. [Google Scholar] [CrossRef]
  77. Polder, D.; van Santen, J.H. The effective permeability of mixtures of solids. Physica 1946, 12, 257–271. [Google Scholar] [CrossRef]
  78. Barber, P.; Balasubramanian, S.; Anguchamy, Y.; Gong, S.; Wibowo, A.; Gao, H.; Ploehn, H.J.; zur Loye, H.-C. Polymer composite and nanocomposite dielectric materials for pulse power energy storage. Materials 2009, 2, 1697–1733. [Google Scholar] [CrossRef]
  79. Turchenko, V.; Kostishyn, V.G.; Trukhanov, S.; Damay, F.; Porcher, F.; Balasoiu, M.; Lupu, N.; Bozzo, B.; Fina, I.; Trukhanov, A.; et al. Crystal and magnetic structures, magnetic and ferroelectric properties of strontium ferrite partially substituted with in ions. J. Alloys Compd. 2020, 821, 153412. [Google Scholar] [CrossRef]
  80. Kaur, H.; Marwaha, A.; Singh, C.; Narang, S.B.; Jotania, R.; Jacobo, S.; Sombra, A.S.B.; Trukhanov, S.V.; Trukhanov, A.V.; Dhruv, P. Investigation of structural, hysteresis and electromagnetic parameters for microwave absorption application in doped Ba-Sr hexagonal ferrites at X-band. J. Alloys Compd. 2019, 806, 1220–1229. [Google Scholar] [CrossRef]
Figure 1. The transmission electron microscopy image for the obtained ferrite nanopowder.
Nanomaterials 10 00492 g001
Figure 2. The σac′ electrical AC-conductivity as a function of the frequency of ferrite sintered at 1473K (a), pure epoxy (b), 20% ferrite + 80% epoxy (c), 30% ferrite + 70% epoxy (d), 40% ferrite + 60% epoxy (e), 50% ferrite + 50% epoxy (f).
Nanomaterials 10 00492 g002
Figure 3. The ε′ dielectric constant as a function of the frequency of ferrite sintered at 1473K (a), pure epoxy (b), 20% ferrite + 80% epoxy (c), 30% ferrite + 70% epoxy (d), 40% ferrite + 60% epoxy (e), 50% ferrite + 50% epoxy (f).
Nanomaterials 10 00492 g003
Figure 4. The tanδ dielectric loss as a function of the frequency of ferrite sintered at 1473K (a), pure epoxy (b), 20% ferrite + 80% epoxy (c), 30% ferrite + 70% epoxy (d), 40% ferrite + 60% epoxy (e), 50% ferrite + 50% epoxy (f).
Nanomaterials 10 00492 g004
Figure 5. Modeling curves calculated in different approximations for the 20% ferrite + 80% epoxy sample (a), 30% ferrite + 70% epoxy (b), 40% ferrite + 60% epoxy (c), 50% ferrite + 50% epoxy (d) at room temperature.
Nanomaterials 10 00492 g005

