Abstract
Highly ordered anodic hafnium oxide (AHO) nanoporous or nanotubes were synthesized by electrochemical anodization of Hf foils. The growth of self-ordered AHO was investigated by optimizing a key electrochemical anodization parameter, the solvent-based electrolyte using: Ethylene glycol, dimethyl sulfoxide, formamide and N-methylformamide organic solvents. The electrolyte solvent is here shown to highly affect the morphological properties of the AHO, namely the self-ordering, growth rate and length. As a result, AHO nanoporous and nanotubes arrays were obtained, as well as other different shapes and morphologies, such as nanoneedles, nanoflakes and nanowires-agglomerations. The intrinsic chemical-physical properties of the electrolyte solvents (solvent type, dielectric constant and viscosity) are at the base of the properties that mainly affect the AHO morphology shape, growth rate, final thickness and porosity, for the same anodization voltage and time. We found that the interplay between the dielectric and viscosity constants of the solvent electrolyte is able to tailor the anodic oxide growth from continuous-to-nanoporous-to-nanotubes.
Keywords:
anodic hafnium oxide; HfO2; anodic oxide; anodization; nanotubes; nanoporous; organic solvent; dielectric; viscosity 1. Introduction
Advances in nanoscience and nanotechnology are interconnected with the development of new platforms where the physical properties of materials/structures, like size, porosity, geometry and surface functionalization can be controlled at the nanoscale. In this way, the potential of applications is created for a large number of areas [1,2,3,4], and thus, are pushing fast the research on the topic. As an example, metal-oxide nanostructures, such as nanotube arrays, have been instigating great interest, due to their demand for optoelectronics, microelectronics, energy storage, solar cells, catalysis or biomedical applications [1,2,3,4,5,6].
Hafnium oxide (HfO2) with its high thermal, chemical and mechanical stability, as well as its high refractive index and dielectric constant is remarkably appealing for new nanostructure architectures like nanoporous or nanotube (NT) arrays and a large range of applications [5,6,7,8,9,10,11,12]. Having into account the emerging application of anodic TiO2 nanotubes in DSCs, the question arises about the applicability of self-ordered arrays of anodic HfO2 for the same purpose. The truth is that the use of an HfO2 compact layer on dye-sensitized solar cells (DSCs) results in improved photovoltaic performance of 66%, compared to DSCs with a conventional sol-gel processed TiO2 layer [8].
Self-organized porous anodic hafnium oxide (AHO) layers were first successfully obtained by Schmuki et al. via the electrochemical anodization of hafnium foils [13]. Using 50 V in a 1 M H2SO4 +0.2 wt% NaF electrolyte at room temperature, high-aspect-ratios AHO nanoporous templates with several tens of micrometers in thickness were obtained. The pore diameter increased with the anodization potential, where the latter was a factor that affected the morphology and the structure of the porous oxide. On the other hand, highly ordered HfO2 NT arrays were successfully realized through electrochemical anodizations in NH4F and ethylene glycol-based electrolytes [14,15]. Such realization largely benefited from the developments obtained in the production of self-ordered TiO2 NTs arrays.
Recent developments in electrochemical anodization techniques allow us to prepare a variety of self-organized metal oxide nanotube arrays directly from substrates of value metals, such as hafnium oxide. After the first generation of anodic TiO2 NT arrays produced using an aqueous HF based electrolyte, the NT fabrication process has come a long way [16]. The pioneer work of Grimes et al., introducing a variety of organic electrolytes, including ethylene glycol (EG), dimethyl sulfoxide (DMSO), formamide (FA) and N-methylformamide (NMF), was the key to achieve long (hundreds of microns) and ordered TiO2 NT arrays [17,18]. The use of organic electrolytes results in a reduced propensity to form an oxide and leads to longer NT arrays. Furthermore, the action of organic-electrolytes lowers the anodic oxide film relative permittivity, and thus, increases its dielectric breakdown voltage and the attainable range of anodization potentials [19]. By mimicking the electrolyte used in TiO2 NTs, Qiu et al. obtained self-ordered nanoporous anodic hafnium oxide (AHO) NTs [introducing ethylene glycol (with NH4F) based electrolytes] [14,15].
HfO2 nanostructures (nanoporous or nanotubes) show promising applications in several fields, such as nanofluidics and electrical engineering systems [20], sensor applications, particularly in real-time bio-sensing [21], as a gate dielectric in place of/or in combination with SiO2 in electronic devices, such as field effect transistors [22] or has due to its high melting temperature and excellent physical, electronic and chemical properties or has multifunctional data storage medium [7].
In this work, we investigated the growth of self-ordered AHO nanoporous/nanotubes templates synthesized by the electrochemical anodization of Hf foils. Several organic solvents (EG, DMSO, FA and NMF), combined with fluoride ions, were used to understand the influence of the solvent in the fabrication process of AHO. The electrolyte solvent was found to be a key factor in the morphology and final layer thickness of AHO. Vertically oriented nanoporous and NT arrays were obtained, together with other different shapes and morphologies. We found that the organic solvent used in the electrolyte plays a main role in morphology, and thus, we can engineer different structures, from pores to tubes and also tune the regularity of the self-ordered structures. Additionally, the length of such oxide structures was found to depend on the solvent type, leading to thicknesses of several tens of micrometers. Moreover, a detailed analysis of the growth mechanism and formation stages of such structures was extracted through the anodization (density current vs. anodization time), barrier layer thickness vs. anodization time and charge curves.
2. Materials and Methods
Prior to the anodization, Hf foils (0.127 mm thick, 99.99% purity from AlfaAesar (Heysham, United Kingdom) were cut into 1 cm2 pieces, and ultrasonically cleaned—first in ethanol and after in deionized water, 10 min each stage. Afterwards, the foils were electrochemically anodized (as-rolled, without any pre-treatment on the surface) in an in-house made anodization cell (two-electrodes), where Hf acted as the anode and an inert Pt mesh as the cathode [23]. The time evolution of the current density [j(t)] was monitored during the anodization process using a Keithley 2004 Sourcemeter (Solon, United States) remotely controlled by a LabView (National Instruments, Austin, United States) application (using a 100 ms acquisition step for the first 5 min). The electrochemical anodization was carried out in four different samples in freshly prepared electrolyte solutions containing NH4F (0.3 wt%) (to provide fluoride ions), H2O (2 wt%) and different organic solvents: Ethylene glycol (EG), formamide (FA), N-methylformamide (NMF) and dimethyl sulfoxide (DMSO). All the anodizations were performed under a constant potential of 60 V for 1 h, at room temperature with mechanical stirring [18,24]. After the anodization, the as-prepared samples were immediately cleaned with ethanol. From now on, the samples prepared with different electrolyte solvent will be referred to as EG, FA, NMF and DMSO. The NTs morphology was evaluated by an FEI Quanta 400FEG Field Emission (Hillsboro, United States) Scanning Electron Microscopy (SEM) using cross-sections (for the AHO length calculation) and surface top views.
3. Results and Discussion
3.1. Growth Mechanism: Anodization Curves with Different Organic Solvents
The main mechanisms responsible for the formation of NTs by an Hf anodization processes are: (i) The electric field-assisted oxidation at the metal/oxide interface, forming an HfO2 continuous layer; (ii) the field-assisted dissolution of the oxide layer (at the oxide/electrolyte interface); and (iii) the chemical dissolution of the oxide by F− ions at the metal/oxide and electrolyte/oxide interfaces (Figure 1). The electrochemical equations for HfO2 formation are:
and
for the oxidation (1) and dissolution (2) reactions, respectively (Figure 1). The reactions occurring at the anode are oxidation of the metal, that releases Hf4+ ions and electrons:
whereas, in the electrolyte one has the dissociation of water:
Hf + 2H2O → HfO2 + 4H+ + 4e−
HfO2 + 6F− + 4H+→ [HfF6]2− + 2H2O
Hf → Hf4+ + 4e−
H2O → OH− + H+
OH− → O2−+ H+
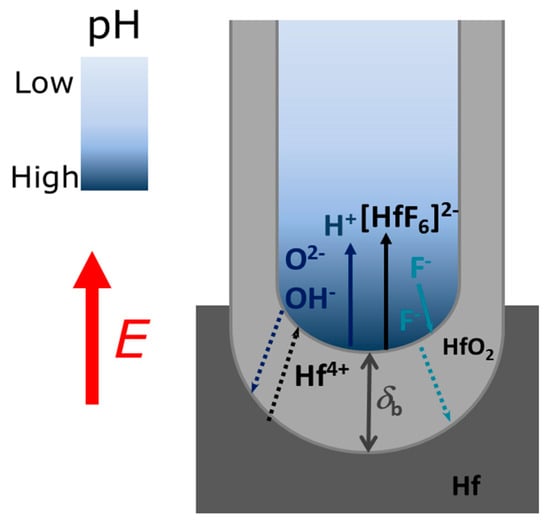
Figure 1.
Scheme diagram illustrating the ions profiles inside the nanotubes (NTs) during the anodization.
Differently from the Al metal anodization case [25,26], where a steady-state condition is achieved (oxidation rate is balanced with the dissolution rate), the Hf anodization case (as that of Ti anodization) consists in a non-steady state anodization process with higher oxidation than dissolution rates [24]. Such effect severely compromises the HfO2 NTs length and growth [24]. There are also additional chemical dissolution effects during the anodization that affect the oxidation/dissolution equilibrium and limit NTs growth.
The evaluation of the mechanisms that lead to the formation and growth of self-ordered HfO2 nanoporous/nanotubes, can be studied using current density [j(t)] curves (Figure 2) [23,24,25,26,27]. The evolution of the HfO2 barrier layer thickness (δb) at the bottom of the NTs (Figure 1) was also estimated from the j(t) curves (Figure 3) [27]. According to the high-field conduction theory [28], the current density (j) is related to the voltage (V) drop across the barrier layer as follows:
where α and β are electrolyte and material-dependent constants and the (V/δb) ratio is the effective electric-field across δb [27,28]. From Equation (6) we obtain,
during the anodization [24,27]. It was considered the material constants, α = 2.4 × 10⁻⁹ mA·cm−2 and β = 27.98 nm·V−1 (at room temperature), determined previously for TiO2 [27], and due to the physical similarities between these oxides here are also considered. Figure 3 shows the evolutions of δb along the anodization time calculated from the Equation (7).
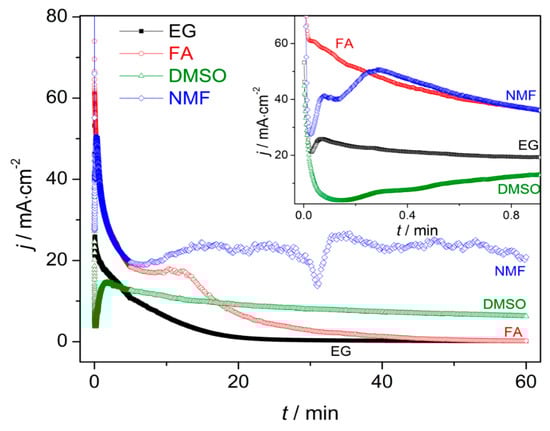
Figure 2.
Current density anodization curves throughout the anodization [inset shows the transient period (1 min)] for ethylene glycol (EG), dimethyl sulfoxide (DMSO), formamide (FA) and N-methylformamide (NMF) samples.
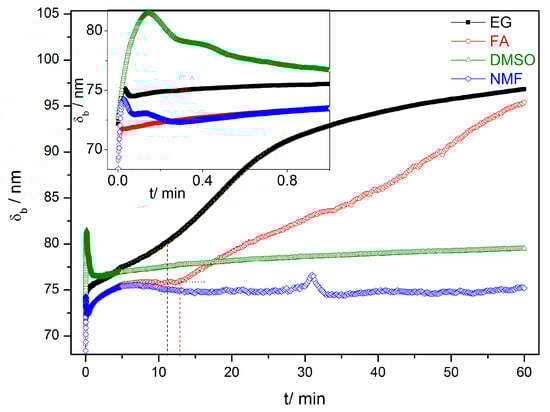
Figure 3.
HfO2 barrier layer thickness (δb) during the first hour of anodization for the EG, FA, NMF and DMSO samples.
j(t) curves for all the samples (EG, FA, NMF and DMSO; Figure 2 and corresponding inset) present the transient anodization characteristic of the successful formation of nanopore/nanotube arrays (as in the Al or Ti cases [23,24,25,26,27]). After applying 60 V, a continuous HfO2 layer is rapidly formed that leads to a resistance increase [rapid j decrease (inset of Figure 2) and δb increase (Figure 3)]. The following slight j decrease marks the initiation of pore nucleation, likely on the surface valley-type irregularities where the electric field enhances the oxide dissolution and promotes hole formation (i.e., the dissolution promoted by F− ions in favorable spots of the HfO2 surface) [21,24]. Consequently, the HfO2 layer thickness starts to increase, while the pores/tubes formation accelerates. This is evidenced by the increase of j until a maximum is reached. A barrier layer, with thickness δb, forms at the pores/tubes bottom (Figure 1 and Figure 3). Afterwards, the emerging porous structure will mechanically adjust and compete with each other in a self-organization process.
The differences between j(t) transient periods of each sample (inset of Figure 2) clearly reveals the decisive importance of the electrolyte solvent in promoting effective nucleation spots. In fact, comparing the j(t) transient period of each sample, we can observe three main aspects: (i) The lower j(t) values; (ii) the earlier emergence of NT nucleation; and (iii) the smaller nucleation time are attributed to samples FA, NMF, EG and DMSO, respectively.
As the anodization process evolves, j(t) of samples FA and EG present similar trends with the typical j(t)-decay of Ti anodization in fluoride-based electrolytes with EG [23,24,25,26,27]. This behavior arises from the non-equilibrium in the oxidation/dissolution processes, being the HfO2 dissolution lower than its formation, resulting in a slow decay of j(t) during the anodization. As a result, a progressive increase of δb of the NTs’ occurs, as shown in Figure 3. Consequently, the ionic migration path along the oxide barrier [27,29] significantly extends, inhibiting the transport of F−, Hf4+ and O2− ions across δb (Hf4+ and O2− for oxidation, F− for dissolution) which subsequently limits a further NTs growth (Figure 1). Additionally, chemical effects, such as local pH decrease, occur throughout the anodization leading to the chemical dissolution of the NTs wall preferentially at the NTs tops (V-shape NTs) [17,18,27,29,30]. The NMF j(t) curve presents a large decay up to 8 min, similar to EG and FA, but then an overall constant j(t) emerges, although with some singularities during the anodization.
On the other hand, in the case of the DMSO, the j(t) curve remains approximately constant throughout the anodization, indicating a more optimized anodization for NTS growth, with balanced oxidation/dissolution processes that lead to a constant oxide growth rate (similar with Al nanoporous anodization were no limit in length is imposed [25,26]). Additionally, the DMSO j(t) transient curve shows an extended nucleation period of time (indication of low-rate pore nucleation) [24] with fairly smaller j(t) values over such region [indicating a thinner δb (Figure 3)] when comparing with other samples (FA or EG) [24,27].
Additionally, Figure 3 shows that by changing the electrolyte medium, we obtain different final δb. Furthermore, for each sample, the capacitance density (C) at the oxide barrier was also calculated from the j(t) curves [Supporting Information (SI) - Figure S3 and Table S1]. At the end of the anodization (1 h), we can extract the final δb and C for each sample (SI - Table S1). It shows that the FA/EG samples led to thicker δb (and lower C) and DMSO/NMF led to thinner δb (and higher C).
Moreover, we perform additional anodizations with the same conditions as for the samples EG, FA, NMF and DMSO during 17 h (SI - Figure S1). In this case, j(t) of the sample NMF rapidly decays after 444 min. This corresponds that a complete conversion on the Hf foil into HfO2 has occurred at this time (444 min), as observed by SEM cross-section images (SI - Figure S2).
3.2. Growth Rate with Different Organic Solvents
Figure 4 shows the charge curves Q(t) obtained from the integration of the j(t) data. The Q(t) curves describe the growth rate along the anodization [24]. Until the first 13 min both Q(t) slopes of NMF and FA samples are higher than those of the DMSO and EG. Although the NMF sample presents a higher charge over time for the entire anodization period (comparing to the rest of the samples), Q(t) of the DMSO sample overcomes that of the FA sample at the end of the anodization period (close to 50 min). Higher Q(t) curve indicates higher charge transfer, leading to a higher growth rate. The charge transferred during the anodization process can then be related to the solvent characteristics and Q(t) values. Additionally, the Q(t) curves present different slope’s trend: Whereas, in NMF and DMSO samples the slope is fairly linear, providing an almost constant AHO growth rate, that is not the case for the EG and FA samples, where Q(t) has a non-linear slope and presents two distinct growth rate regimes. After 11 min and 13 min of anodization time, for EG and FA, respectively, the growth rate slows down. With these electrolytes, the δb increases during the anodization, leading to a constant Q(t) over time [and significantly lower final Q(t) values]. As discussed before, the δb increase is related to the unbalanced oxidation-dissolution rate reactions, being the HfO2 dissolution smaller than its formation, ultimately limiting the NTs growth and length [24,27]. δb(t) curves (Figure 3) of NMF/DMSO samples present thinner δb, while EG/FA samples shows thicker δb. One can observe the similar Q(t) trend of the two groups of samples EG/FA and NMF/DMSO. EG and FA presents the transition of two regimes at 11 min and 13 min, respectively. After these anodization times, δb greatly increases (Figure 3) and the growth rate slows down. On the other hand, NMF/DMSO samples show a Q(t) linear slope, corresponding to a constant δb over time (Figure 3). At the end, EG/FA samples presents thicker δb than NMF/DMSM samples.
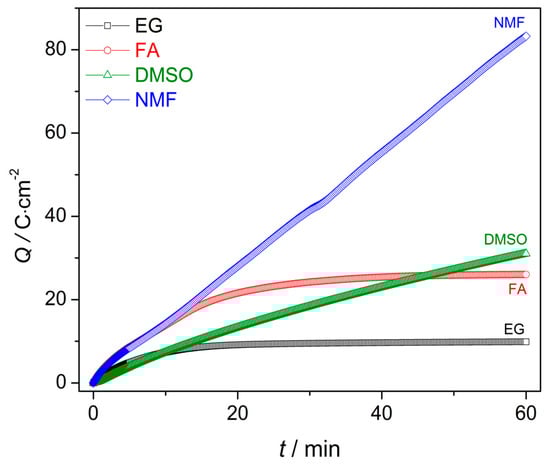
Figure 4.
Charge curves during the first hour of anodization for the EG, FA, NMF and DMSO samples.
3.3. Morphology and Layer Thickness
Figure 5, Figure 6, Figure 7 and Figure 8 shows SEM cross-section, and top view images of the AHO templates for all samples after 1 h of anodization. Comparing the different samples, one sees that the electrolyte solvent has a critical impact on the AHO morphology, growth rate and layer thickness. From the top view images, we can see that FA leads to a self-ordered nanoporous template (Figure 5), while EG and DMSO lead to highly self-ordered NT arrays with hexagonal closely packed distribution (Figure 6 and Figure 7, respectively). For the NMF samples (Figure 8), instead of homogeneous NTs or nanoporous structures, we obtained different morphologies, ranging from Figure 8a a continuous oxide layer, Figure 8b nanoporous, Figure 8c nanoneedles, Figure 8d nanoflakes or Figure 8e agglomerated nanowires.
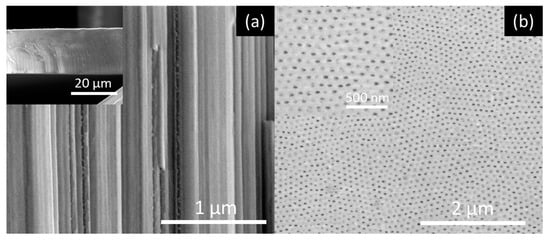
Figure 5.
SEM images of the nanoporous AHO templates after 1 h of anodization for the FA sample: (a) Cross-section view (inset at lower magnification) and (b) top-view (inset at higher magnification).
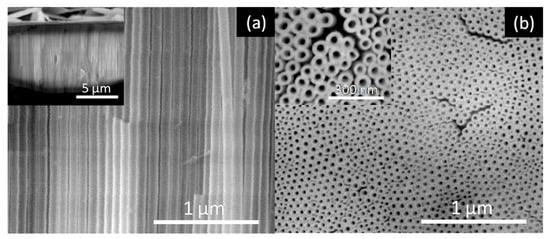
Figure 6.
SEM images of the AHO NTs after 1 h of anodization for the EG sample: (a) Cross-section view (inset at lower magnification) and (b) top-view (inset at higher magnification).
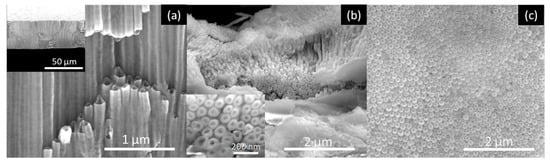
Figure 7.
SEM images of the AHO NTs after 1 h of anodization for the DMSO sample: (a) Cross-section view (inset at lower magnification), (b) top view (inset at higher magnification) and (c) bottom view.
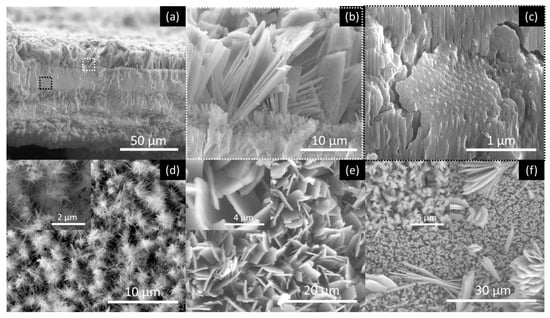
Figure 8.
SEM images of the AHO nanostructures after 1 h of anodization for the NMF sample. Cross-section images showing (a) the thick oxide layer that contains (b) nanoflakes at the layers’ top and (c) self-ordered nanoporous structures (zone areas where (b,c)) images where extracted from (a) images are indicated; top view shows (d) nanoneedles (inset at higher magnification) (e) nanoflakes (inset at higher magnification) and (f) nanowires-agglomerations (inset at higher magnification), all present in this sample.
EDS analyses showed (SI-Figure S5) that the anodic as-grown nanoporous (FA) nanotubes (DMSO/EG) presents significant amounts of F, which is typical of anodic HfO2 or TiO2 structures [14,18]. Literature associates the F presence with the formation of hafnium oxyfluoride in the AHO. For the sample NMF the same the F presence was obtained (SI - Figure S5d). Additionally, in NMF sample we perform separated EDS analyses for bulk oxide (SI - Figure S5e: Z1 area), and surface top nanostructures (flakes/needles; SI - Figure S5f: Z2 area) identifying the same chemical elements in both areas and are in accordance with the other anodic hafnium oxide samples.
The pore diameter (Dp), and interpore distance (Dint) geometrical parameters were extracted from the SEM image (100 pores analyzed) for the EG, FA and DMSO samples as shown in Table 1. The average Dp and Dint (and standard deviation SD) were estimated from the histogram of the size distribution, which were then fitted to a normal distribution (Figure 9).

Table 1.
AHO nanoporous and nanotubes geometrical parameters: pore diameter (Dp) interpore distance (Dint) and Porosity (P) for the different samples.
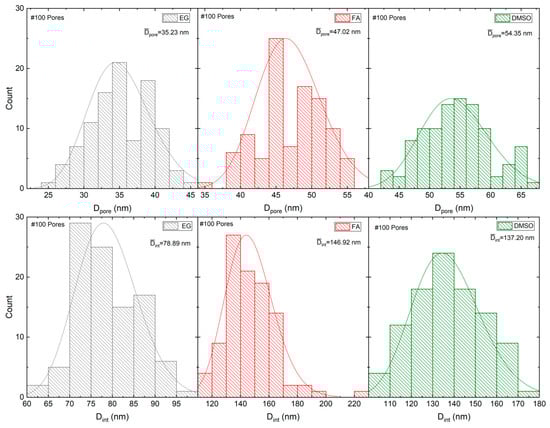
Figure 9.
Histograms of the size distribution, Dp and Dint, which were fitted with a normal distribution for samples EG, FA and DMSO.
Usually, the regularity of the geometrical patterns in self-ordered nanoporous/nanotubes of anodic TiO2, Al2O3 or HfO2 is analyzed by a typical parameter—the porosity (P). For the well-defined hexagonal porous structures, P of the anodic oxide layer is given by the equation proposed by Nielsch et al.:
where r is the pore radius (r = Dp/2) [31]. For the hexagonal self-ordered nanoporous Al2O3, or TiO2 NT arrays the obtained porosities are close to 10% (10% porosity rule) when mild anodizations are implemented (low anodization potentials). This rule assumes that a perfect hexagonal structure shows a P of 10% and deviations from these values results in the imperfect ordering of the structures. Qiu et al. presented a study of porosity for anodic HfO2 NTs (electrolyte with ethylene glycol as solvent) and obtained porosity values of 10% when the anodizations were performed within the range of 10 to 40 V [14]. In this work, P was calculated for the samples FA, EG and DMSO, as shown in Table 1. For the FA and DMSO samples, porosities closer to 10% (of ~9.3 and 14.2%, respectively) were obtained, consistent with the 10% rule. However, for the EG sample P clearly deviates from the 10% rule (P~18.1%).
The resulting AHO layer thicknesses are shown in Table 2. The EG, FA and DMSO samples have a mean AHO layer thickness (L) of approximately 8.0; 23.6 and 37.3 µm, respectively. On the other hand, the NFM sample shows a rapid AHO growth rate with L = 94.8 µm, much larger than the other samples. Notice that while previously discussing the Q(t) curves (Figure 3), the higher final Q(t) was indicative of thicker L: L(NMF) > L(DMSO) > L(FA) > L(EG), as obtained [24].
Table 2.
Solvent characteristics: Classification at room temperature, dielectric constant (κ) and viscosity (η); AHO mean layer thickness L and the type of nanostructures obtained for the different samples.
3.4. Electrolyte Solvent as the Driven Factor behind AHO Morphology, Porosity and Growth
In this study, there are two relevant parameters in the electrolyte solvent: The viscosity (η) and dielectric constant (κ) (Table 2). The Stokes-Einstein equation relates the diffusion constant (D) of a macroscopic particle of radius r, undergoing a Brownian motion, to the viscosity η of the fluid in which it is immersed [32]. Thus, at a constant temperature, the individual ions [O2−] or [F−] diffusion constant will be inversely dependent on solvent η, limiting both oxidation and dissolution rates. On the other hand, a high-κ solvent draws a higher electrolyte capacitance (for a constant potential) inducing the formation of more charges at the oxide layer, thus, improving the extraction of the Hf4+ ions and ultimately leading to a high oxidation rate [17,18]. Therefore, κ will be intimately related to the rate of the oxidation processes [Equation (1)] at the oxide/metal interface (higher κ, higher oxidation rate).
Figure 10a,b shows the analyses of the features Dp, Dint and P as a function of the solvent physical parameters, η and κ. Dp and Dint decrease as η increases (Figure 10a). The individual ions [O2−] or [F−] diffusion constant will be inversely dependent on solvent η (according to Stokes-Einstein equation), limiting both oxidation and dissolution processes rates. Increasing η, the diffusion of [O2−] or [F−] will decrease, leading to smaller Dp (and Dint) (Figure 10a) and higher P (Figure 10b) (deviating from the optimized 10% rule for optimized self-ordered regularity). On the other hand, by decreasing κ [or the solvent conductivity (σ) SI: Table S1], P increases, also leading to deviations of 10% rule).
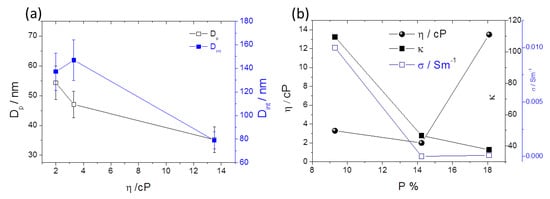
Figure 10.
(a) Dp, Dint as a function of the solvent viscosity η and (b) η and κ;σ as a function of the porosity (P).
Figure 11a,b displays the counterplots (color-maps) of the AHO L and P as a function of the solvent physical parameters η and κ. We used the parameters for each sample, (η, κ, L) from Table 2 and (η, κ, P) from Table 1 and Table 2, to perform a numerical estimation of 20 new data points by the interpolation method of cubic Spline. By this interpolating method, we are able to create an estimation of new values of L and P with certain conditions of the electrolyte (varying η and κ). The obtained (η, κ, L) and (η, κ, P) arrays were then plotted in 3D counterplot in Figure 11a,b, respectively. One can observe that thicker AHO is obtained for high κ and low η values. These anodization conditions led to extremely fast oxidation rates as in the case of the NFM sample and demonstrated by the Q(t) curve (Figure 4). The NFM sample shows a faulty structure without self-ordered nanoporous or tubes [only small areas revealed a nanoporous structure; Figure 7c]. Indeed, much faster oxidation than field-enhanced dissolution occurred during the anodization, being the process out of the steady-state anodization conditions, which is mandatory for nanoporous/tubes upraise. We believe that, at the initial anodization stages, already nanoporous/NTs formation occurred [see initial j(t) transient in Figure 2 and SEM image in Figure 8c], but the NMF solvent high-κ (Table 2) led to a much faster Hf4+ extraction, and thus, leaving no time to maintain the nanostructures self-organization regime, i.e., to have a proper dissolution rate that would counter-balance the high oxidation rate. Additionally, the NMF j(t) singularities observed during the anodization (Figure 2) can be related to the different nanostructures morphologies obtained (Figure 8).
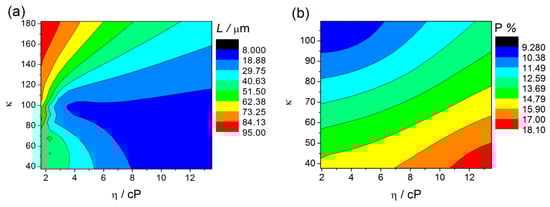
Figure 11.
Counterplots of L (a) and P (b) as a function of the solvent parameters η and κ, obtained by interpolation (cubic Spline-20 points) of η, κ, L and P values.
Figure 11b shows the counterplot of P as a function of the solvent parameters η and κ. With this analysis, we establish a range of P tunability. We can observe that porosities closer to the 10% rule can be obtained for higher κ and lower η. However, it is also observed that the porosity clearly deviates from the 10% rule for lower values of κ and higher η. Notice that moderate values of P (closer to 10%) can be obtained with higher η values, but κ has to be at the higher value range. Contrarily to what is usually presented in literature, that P depends exclusively on anodization parameters such, voltage, (Dp, Dint) or water content, we demonstrate for the first time that the porosity also critically depends on physical properties of the solvent (η, κ). These new results bring the possibility to mix the solvents in order to tune the anodic oxides with a perfect hexagonal arrangement.
The anodization conditions mandatory for the self-ordered nanoporous/tubes morphology to arise are obtained decreasing κ, either with low or high η. The FA solvent has a relatively lower κ, but a slightly higher η than those of NMF. This seems to be enough to establish the necessary conditions of a more equilibrated oxidation/dissolution balance for the formation of structures with self-organization (nanoporous structure; Figure 5). Additionally, under these conditions, moderate L is obtained, as shown in the counterplot map (Figure 11a). On the other hand, the NT structure arises when decreasing even more κ, either in low or high η regimes, although with thinner or thicker thicknesses, respectively. Both DMSO and EG samples showed an NT structure, but the DMSO sample presented a higher L. Both own a similar κ value, albeit much smaller than the one from the previously discussed samples. EG much higher viscosity, making F− ions more difficult to be replaced by new ones at the NTs bottom. As a result, oxidation is faster than dissolution, leading to a j(t) decrease during the anodization, indicating the progressive increase of δb. Thus, the ionic migration path along the oxide barrier [29] significantly extends, inhibiting the transport of F−, Hf4+ and O2− ions across δb (Hf4+ and O2− for oxidation, F− for dissolution) which subsequently limits a further NT growth (Figure 1). On the other hand, from the dissolution reaction [Equation (2)] one can see that the failure of F− leads to H+ excess, and thus, to additional chemical dissolution effects that also result in limited NTs growth. DMSO showed a perfect balance between oxidation and dissolution, j(t) constant during the anodization, just as in the Al anodization case [23,25,26]. The increased NT-array length when using a DMSO electrolyte can also be attributed to the controlled chemical dissolution process effect. Thus, the route to successfully obtain long NT arrays is to minimize the pH decrease promoted by H+ additional etching. The DMSO aprotic photophilic solvent accepts an H+ ion from NH4F and reduces its activity, decreasing the chemical etching. Thus, allowing the DMSO NTs to grow deep into the hafnium foil without any significant loss at the tube tops. The presence of DMSO modifies the space charge region in the pores, thereby also avoiding the lateral etching and leading to a steady-state pore growth and low chemical etching of the NT walls.
As expected, the same conclusions were obtained for the counterplots with the solvent conductivity (σ) instead of using κ (SI - Figure S6).
In summary, the electrolyte solvent affects the morphology and length of anodic HfO2 (Figure 12). Different nanostructures with different shapes of morphologies are obtained by changing the electrolyte solvent physical characteristics. For instance, we can tailor the anodic oxide morphology from NTs (EG and DMSO) to nanoporous (NPs; FA) to a thick oxide layer (NMF), by increasing the electrolyte κ, since the oxidation rate is higher (Figure 11a (easier Hf4+ extraction). Additionally, with the κ increase the porosity decreases (Figure 11a). On the other hand, increasing η, the L severally decreases (Figure 11b), since the dissolution rate decreases because the ionic diffusion is limited. Overall, an accurate balance between the electrolyte solvents’ κ and η is needed to obtain the desired morphology, porosity and length.
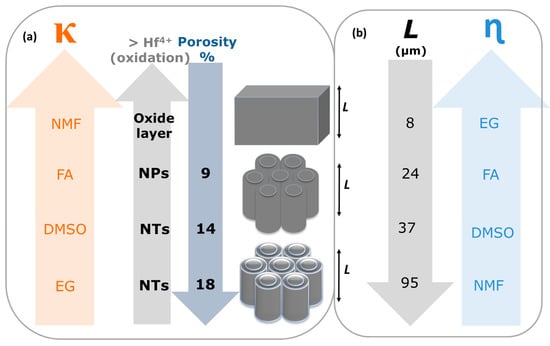
Figure 12.
Scheme of (a) AHO morphology transition from bulk-to-nanoporous (NPs)-to-nanotubes (NTs) with the electrolyte solvent constant dielectric constant (κ) increase (as the porosity (P) decreases); and (b) the AHO layer thickness (L) increase with the viscosity (η) decrease.
4. Conclusions
We investigated the growth of self-ordered anodic hafnium oxide (AHO) by using different solvent base electrolytes: EG, FA, NMF and DMSO. We found that the solvents are a key factor for tunning the possible morphology of the nanostructures of the AHO. EG and DMSO allow vertically oriented growth in self-ordered NT arrays, due to low κ and high η (in the case of EG), and because the photophilic character (in the case of DMSO) of the solvent. On the other hand, FA and NMF lead to nanoporous AHO (for FA), due to their much higher κ, and to diverse nano-shapes (for NMF), including nanoflakes, nanoneedles, nanotube-agglomerations and thick continuous oxide. Furthermore, the final layer thickness of the AHO was also correlated with the electrolyte solvent type, and particular its κ and η values. While κ determines a higher oxidation rate (out of the steady state regime), leading to thicker HfO2 oxide layer (NMF) out of the self-organization anodization regime (nanoporous or nanotubes), a lower κ combined with lower η lead to higher lengths, but in the self-ordered regime, and thus, to hexagonally distributed NTs (DMSO). Additionally, porosities within the 10% self-ordered regime were obtained for high κ and low η.
The detailed analyses of j(t), δb(t) and Q(t) anodization curves combined with morphology analyses demonstrate that an accurate balance between the oxidation and dissolution rates during the anodization is mandatory to obtain optimized self-ordered nanostructures. The anodization curves j(t) and Q(t) for the different solvent electrolytes revealed different growth mechanism and growth rates of AHO.
Overall, the κ and η constants from the solvent electrolyte directly affects the transition from thick oxide-to-nanoporous-to-nanotubes (as κ decreases), the porosities and the growth of oxide layer thickness, (as η increase). This study clearly reveals that the organic solvent is the main factor affecting the transition from pores to tubes and the regularity of the structures, as well as the anodization growth rates.
Supplementary Materials
The following are available online at https://www.mdpi.com/2079-4991/10/2/382/s1, Figure S1: Current density anodization curves during 17 h, Figure S2: SEM images of the NMF sample for 17 h of anodization, Figure S3: Capacitance Calculation Estimative - Capacitance density as a function of the anodization time (60min), Figure S4: Barrier layer thickness (δb) and capacitance density (C), at the AHO nanotubes/nanoporous bottom, as a function of the electrolyte viscosity (η), Table S1: Summary of electrolyte physical parameters (κ, η and σ) and the AHO experimental parameters extracted from the anodization curves (δb and C) and from the SEM images (L and P), Figure S5: EDS Spectroscopy—Chemical Characterization - EDS spectra for all the samples, Figure S6: Counterplots of L and P as a function of the solvent parameters η and conductivity (σ).
Author Contributions
The authors individual contributions are: conceptualization, A.A., C.T.S. and A.M.L.L.; validation, C.T.S., A.M.L.L. and J.V.; formal analysis, A.A., G.N.P.O.; investigation, A.A., G.N.P.O.; resources, L.A., A.M. and J.P.A.; project administration, L.P.A., writing—Original draft preparation A.A.; writing—Review and editing, A.A., J.V., C.T.S., A.M.L.L., A.M and J.P.A.; visualization, A.A., G.N.P.O.; supervision, A.M. and J.P.A.; funding acquisition, J.P.A. All authors have read and agreed to the published version of the manuscript.
Funding
This work was supported by national funds, Fundação para a Ciência e a Tecnologia (FCT) and by the projects: Network of Extreme Conditions Laboratories (NECL)-NORTE-01-0145-FEDER-022096 funded by North Portugal Regional Operational Programme (NORTE 2020), under the Portugal 2020 Partnership Agreement, through the European Regional Development Fund (FEDER); PTDC/028766- POCI-01-0145-FEDER-028766; PTDC/31575 -POCI-01-0145-FEDER-031575 and POCI-01-0145-FEDER-006961, POCI-01-0145-FEDER-029454 and POCI-01-0145-FEDER-032527 funded by European Regional Development Fund (FEDER) through COMPETE2020 -Operational Program for Competitiveness and Internationalization (POCI) and with the financial support of FCT/MCTES through national funds (PIDDAC); UID/NAN/50024/2019. A. Apolinário, C. T Sousa, G. Oliveira and A. M. L. Lopes are funded by FCT Grants Nº: SFRH/BPD/87430/2012, IF/01159/2015, SFRH/BPD/75110/2010, and IF/00686/2014; respectively.
Acknowledgments
The authors would like to acknowledge Fundação para a Ciência e a Tecnologia and the projects: NORTE-01-0145-FEDER-022096; PTDC/028766 -POCI-01-0145-FEDER-028766; PTDC/31575 -POCI-01-0145-FEDER-031575; POCI-01-0145-FEDER-006961; POCI-01-0145-FEDER-029454; POCI-01-0145-FEDER-032527 and UID/NAN/50024/2019. A. Apolinário, C. T Sousa, G. Oliveira and A. M. L. Lopes would like to acknowledge FCT for Grants No: SFRH/BPD/87430/2012, IF/01159/2015, SFRH/BPD/75110/2010, and IF/00686/2014; respectively.
Conflicts of Interest
The authors declare no conflict of interest.
References
- Baxter, J.; Bian, Z.; Chen, G.; Danielson, D.; Dresselhaus, M.S.; Fedorov, A.G.; Fisher, T.S.; Jones, C.W.; Maginn, E.; Kortshagen, U.; et al. Nanoscale design to enable the revolution in renewable energy. Energy Environ. Sci. 2009, 2, 559–588. [Google Scholar] [CrossRef]
- Mayrhofer, K.J.J.; Juhart, V.; Hartl, K.; Hanzlik, M.; Arenz, M. Adsorbate-Induced Surface Segregation for Core–Shell Nanocatalysts. Angew. Chem. Int. Ed. 2009, 48, 3529–3531. [Google Scholar] [CrossRef] [PubMed]
- Service, R.F. Is Silicon’s Reign Nearing Its End? Science 2009, 323, 1000. [Google Scholar] [CrossRef]
- Chau, R.; Doyle, B.; Datta, S.; Kavalieros, J.; Zhang, K. Integrated nanoelectronics for the future. Nat. Mater. 2007, 6, 810. [Google Scholar] [CrossRef] [PubMed]
- Brezesinski, T.; Smarsly, B.; Iimura, K.-I.; Grosso, D.; Boissière, C.; Amenitsch, H.; Antonietti, M.; Sanchez, C. Self-Assembly and Crystallization Behavior of Mesoporous, Crystalline HfO2 Thin Films: A Model System for the Generation of Mesostructured Transition-Metal Oxides. Small 2005, 1, 889–898. [Google Scholar] [CrossRef]
- Tirosh, E.; Markovich, G. Control of Defects and Magnetic Properties in Colloidal HfO2 Nanorods. Adv. Mater. 2007, 19, 2608–2612. [Google Scholar] [CrossRef]
- Qi, L.-Q.; Pan, D.-Y.; Li, J.-Q.; Liu, L.-H.; Sun, H.-Y. HfO2/porous anodic alumina composite films for multifunctional data storage media materials under electric field control. Nanotechnology 2017, 28, 115702. [Google Scholar] [CrossRef]
- Bills, B.; Shanmugam, M.; Baroughi, M.F. Effects of atomic layer deposited HfO2 compact layer on the performance of dye-sensitized solar cells. Thin Solid Film. 2011, 519, 7803–7808. [Google Scholar] [CrossRef]
- Kong, M.; Li, B.; Guo, C.; Zeng, P.; Wei, M.; He, W. The Optical Absorption and Photoluminescence Characteristics of Evaporated and IAD HfO2 Thin Films. Coatings 2019, 9, 307. [Google Scholar] [CrossRef]
- Zhao, L.; Liu, H.; Wang, X.; Wang, Y.; Wang, S. Electrical Properties and Interfacial Issues of HfO2/Ge MIS Capacitors Characterized by the Thickness of La2O3 Interlayer. Nanomaterials 2019, 9, 697. [Google Scholar] [CrossRef]
- Liu, C.-F.; Tang, X.-G.; Wang, L.-Q.; Tang, H.; Jiang, Y.-P.; Liu, Q.-X.; Li, W.-H.; Tang, Z.-H. Resistive Switching Characteristics of HfO2 Thin Films on Mica Substrates Prepared by Sol-Gel Process. Nanomater. (Basel) 2019, 9, 1124. [Google Scholar] [CrossRef] [PubMed]
- Shim, J.; Rivera, J.A.; Bashir, R. Electron beam induced local crystallization of HfO2 nanopores for biosensing applications. Nanoscale 2013, 5, 10887–10893. [Google Scholar] [CrossRef] [PubMed]
- Tsuchiya, H.; Schmuki, P. Self-organized high aspect ratio porous hafnium oxide prepared by electrochemical anodization. Electrochem. Commun. 2005, 7, 49–52. [Google Scholar] [CrossRef]
- Qiu, X.; Howe, J.Y.; Cardoso, M.B.; Polat, O.; Heller, W.T.; Parans Paranthaman, M. Size control of highly ordered HfO2 nanotube arrays and a possible growth mechanism. Nanotechnology 2009, 20, 455601. [Google Scholar] [CrossRef] [PubMed]
- Qiu, X.; Howe, J.Y.; Meyer, H.M.; Tuncer, E.; Paranthaman, M.P. Thermal stability of HfO2 nanotube arrays. Appl. Surf. Sci. 2011, 257, 4075–4081. [Google Scholar] [CrossRef]
- Gong, D.; Grimes, C.A.; Varghese, O.K.; Hu, W.; Singh, R.S.; Chen, Z.; Dickey, E.C. Titanium oxide nanotube arrays prepared by anodic oxidation. J. Mater. Res. 2011, 16, 3331–3334. [Google Scholar] [CrossRef]
- Paulose, M.; Shankar, K.; Yoriya, S.; Prakasam, H.E.; Varghese, O.K.; Mor, G.K.; Latempa, T.A.; Fitzgerald, A.; Grimes, C.A. Anodic Growth of Highly Ordered TiO2 Nanotube Arrays to 134 μm in Length. J. Phys. Chem. B 2006, 110, 16179–16184. [Google Scholar] [CrossRef]
- Shankar, K.; Mor, G.K.; Prakasam, H.E.; Yoriya, S.; Paulose, M.; Varghese, O.K.; Grimes, C.A. Highly-ordered TiO2 nanotube arrays up to 220 µm in length: Use in water photoelectrolysis and dye-sensitized solar cells. Nanotechnology 2007, 18, 065707. [Google Scholar] [CrossRef]
- Ue, M.; Mizutani, F.; Takaha, H.; Takeuchi, S.; Sugiyama, K.; Nishiwaki, T.; Sato, N. Anodization of Al–Nd alloy films in nonaqueous electrolyte solutions for TFT-LCD application. Electrochim. Acta 2001, 47, 217–223. [Google Scholar] [CrossRef]
- Kragh, K.C.; Kueltzo, A.; Singh, M.; Tao, Q.; Jursich, G.; Takoudis, C.G. Atomic Layer Deposition of Hafnium Oxide on Silicon and Polymer Fibers at Temperatures below 100o C. J. Undergrad. Research Univ. Ill. Chic. 2009, 2. [Google Scholar] [CrossRef]
- Uchino, T.; Ayre, G.N.; Smith, D.C.; Hutchison, J.L.; de Groot, C.H.; Ashburn, P. Growth of Carbon Nanotubes on HfO2 towards Highly Sensitive Nano-Sensors. Jpn. J. Appl. Phys. 2010, 49, 04DN11. [Google Scholar] [CrossRef]
- Rao, B.M.; Torabi, A.; Varghese, O.K. Anodically grown functional oxide nanotubes and applications. MRS Commun. 2016, 6, 375–396. [Google Scholar] [CrossRef]
- Leitao, D.C.; Apolinario, A.; Sousa, C.T.; Ventura, J.; Sousa, J.B.; Vazquez, M.; Araujo, J.P. Nanoscale Topography: A Tool to Enhance Pore Order and Pore Size Distribution in Anodic Aluminum Oxide. J. Phys. Chem. C 2011, 115, 8567–8572. [Google Scholar] [CrossRef]
- Apolinário, A.; Sousa, C.T.; Ventura, J.; Costa, J.D.; Leitão, D.C.; Moreira, J.M.; Sousa, J.B.; Andrade, L.; Mendes, A.M.; Araújo, J.P. The role of the Ti surface roughness in the self-ordering of TiO2 nanotubes: A detailed study of the growth mechanism. J. Mater. Chem. A 2014, 2, 9067–9078. [Google Scholar] [CrossRef]
- Li, F.; Zhang, L.; Metzger, R.M. On the Growth of Highly Ordered Pores in Anodized Aluminum Oxide. Chem. Mater. 1998, 10, 2470–2480. [Google Scholar] [CrossRef]
- Sousa, C.T.; Leitao, D.C.; Proenca, M.P.; Ventura, J.; Pereira, A.M.; Araujo, J.P. Nanoporous alumina as templates for multifunctional applications. Appl. Phys. Rev. 2014, 1, 031102. [Google Scholar] [CrossRef]
- Apolinário, A.; Quitério, P.; Sousa, C.T.; Ventura, J.; Sousa, J.B.; Andrade, L.; Mendes, A.M.; Araújo, J.P. Modeling the Growth Kinetics of Anodic TiO2 Nanotubes. J. Phys. Chem. Lett. 2015, 6, 845–851. [Google Scholar] [CrossRef]
- Cabrera, N.; Mott, N.F. Theory of the oxidation of metals. Rep. Prog. Phys. 1949, 12, 163–184. [Google Scholar] [CrossRef]
- Sreekantan, S.; Saharudin, K.A.; Lockman, Z.; Tzu, T.W. Fast-rate formation of TiO2 nanotube arrays in an organic bath and their applications in photocatalysis. Nanotechnology 2010, 21, 365603. [Google Scholar] [CrossRef]
- Sun, L.; Zhang, S.; Sun, X.W.; He, X. Effect of electric field strength on the length of anodized Titania nanotube arrays. J. Electroanal. Chem. 2009, 637, 6–12. [Google Scholar] [CrossRef]
- Nielsch, K.; Choi, J.; Schwirn, K.; Wehrspohn, R.B.; Gösele, U. Self-ordering Regimes of Porous Alumina: The 10 Porosity Rule. Nano Lett. 2002, 2, 677–680. [Google Scholar] [CrossRef]
- Macak, J.M.; Schmuki, P. Anodic growth of self-organized anodic TiO2 nanotubes in viscous electrolytes. Electrochim. Acta 2006, 52, 1258–1264. [Google Scholar] [CrossRef]
© 2020 by the authors. Licensee MDPI, Basel, Switzerland. This article is an open access article distributed under the terms and conditions of the Creative Commons Attribution (CC BY) license (http://creativecommons.org/licenses/by/4.0/).