Article

Negatively-Doped Single-Walled Carbon Nanotubes Decorated with Carbon Dots for Highly Selective NO2 Detection

1
Sensor System Research Center, Korea Institute of Science and Technology (KIST), Seoul 02792, Korea
2
Advanced Semiconductor Research Center, Gumi Electronics & Information Technology Research Institute (GERI), Gumi 39253, Korea
*
Author to whom correspondence should be addressed.
These authors contributed equally to this work.
Nanomaterials 2020, 10(12), 2509; https://doi.org/10.3390/nano10122509
Submission received: 28 October 2020 / Revised: 2 December 2020 / Accepted: 11 December 2020 / Published: 14 December 2020
(This article belongs to the Section 2D and Carbon Nanomaterials)

Abstract

:
In this study, we demonstrated a highly selective chemiresistive-type NO2 gas sensor using facilely prepared carbon dot (CD)-decorated single-walled carbon nanotubes (SWCNTs). The CD-decorated SWCNT suspension was characterized using transmission electron microscopy (TEM), X-ray diffraction (XRD), and UV-visible spectroscopy, and then spread onto an SiO2/Si substrate by a simple and cost-effective spray-printing method. Interestingly, the resistance of our sensor increased upon exposure to NO2 gas, which was contrary to findings previously reported for SWCNT-based NO2 gas sensors. This is because SWCNTs are strongly doped by the electron-rich CDs to change the polarity from p-type to n-type. In addition, the CDs to SWCNTs ratio in the active suspension was critical in determining the response values of gas sensors; here, the 2:1 device showed the highest value of 42.0% in a sensing test using 4.5 ppm NO2 gas. Furthermore, the sensor selectively responded to NO2 gas (response ~15%), and to other gases very faintly (NO, response ~1%) or not at all (CO, C6H6, and C7H8). We propose a reasonable mechanism of the CD-decorated SWCNT-based sensor for NO2 sensing, and expect that our results can be combined with those of other researches to improve various device performances, as well as for NO2 sensor applications.

Graphical Abstract

1. Introduction

As hazardous gases, nitrogen oxides (typically, NO and NO2) are mainly generated by combustion processes of fossil fuels, such as vehicle exhausts, power plants, and various industrial processes, and are the main causes of acid rain and photochemical smog, having a significant influence on air, water, and soil pollution [1,2,3]. Furthermore, the gases can cause serious problems to human organisms, irritating eyes, causing dizziness, and chronically weakening the respiratory system. Generally, NO gas is highly reactive due to its radical structure and is oxidized in air into toxic reddish-brown NO2 gas with a biting odor, which can lead to death at a concentration above the immediate danger to life and health (IDLH) value of 20 ppm [4]. Therefore, developing a high-performance NO2 gas sensor is very important in the fields of human respiratory health and environmental pollution.
For NO2 gas detection, electrochemical-, semiconductor (SC, or chemiresistive)-, and infrared (IR) absorption-type sensors are generally used. Among them, the SC-type sensors have been widely studied because of their advantages, such as their rapid detection, wide sensing range, low power consumption, low cost, etc. [5] SC-type gas sensors detect target gases through redox reactions between gas molecules and SC channels. As channel platform materials, metal oxides, conducting polymers (CPs), and carbon-based nanomaterials are typically utilized [5]. The metal oxide-based gas sensors (e.g., ZnO [6,7,8,9], SnO2 [10], In2O3 [11], NiO [12], and WO3 [13]) have advantages such as a high responsivity, excellent thermal stability, low cost, etc. On the other hand, they generally require a heating process (>300 °C) to activate the sensing materials, thus increasing the volume of sensor systems and power consumption during operation [5]. CP-based gas sensors (e.g., polyaniline [14]) exhibit moderate response values and rapid detection, but they also have drawbacks, such as long-term instability and irreversibility originating from organic properties, which restrict their practical applications [14,15].
Gas sensors using carbon-based nanomaterials (e.g., single-walled carbon nanotubes (SWCNTs) [5,15,16,17,18,19,20], multi-walled carbon nanotubes (MWCNTs) [3,21], graphene [22,23], graphene oxide (GO) [24], and reduced GO (R-GO)) show desirable properties, such as a high response, detectability of low concentrations, low temperature operations, etc., making them highly attractive as platform materials. However, they still have limitations, such as a low selectivity and long response and recovery times compared to metal oxide- or CP-based sensors [25,26,27,28]. Regarding these issues, there have been some results improved by surface treatments [16,29,30], functionalization [19,31,32,33], the use of core-shell structures [34,35], specially designed hetero-structures [36,37], etc.
In this paper, we propose carbon dot (CD)-decorated SWCNTs as an NO2 gas sensing material with a reasonable sensing mechanism. Synthesized CDs and the CD-decorated SWCNTs were characterized by transmission electron microscope (TEM) images and X-ray diffraction (XRD)- and UV-visible spectra. Interestingly, our experimental results show that the sensing platform (i.e., CD-decorated SWCNTs) behaves as an n-type material, which is opposite to what has been reported for SWCNT-based gas sensors [3,15]. Moreover, the CDs to SWCNTs ratio in active suspension is a critical factor determining the response value. The NO2 gas sensor fabricated with the 2:1 (CDs:SWCNTs) suspension exhibited the highest response of ~42% to 4.5 ppm NO2, and responded to a low concentration of 100 ppb (with the response of ~3.3%). More desirably, the sensor insignificantly responded to nitric oxide (NO), and did not respond to carbon monoxide (CO), benzene (C6H6), and toluene (C7H8), meaning that it has a high selectivity to NO2 gas. Our new proposed mechanism of NO2 gas detection can provide researchers of sensor materials and/or devices with a promising solution to further enhance their sensor performances.

2. Materials and Methods

2.1. Synthesis of Carbon Dots (CDs)

The carbon dots (CDs) were synthesized via a precursor pyrolysis method [38,39]. 1-octadecene (15 mL) and oleylamine (2 mL) were blended in a three-neck flask (50 mL), and then degassed under nitrogen (N2) purge for 30 min. Sequentially, the temperature was elevated to 200 °C, and citric acid (1 g, precursor) was added into the flask with mild stirring. After 20 min, the reactant solution was cooled down to room temperature, and ethanol (20 mL) was added for the precipitation of CDs. The solution was centrifuged at 4000 RPM for 10 min, and the precipitated CDs were re-dispersed in 1,2-dichlorobenzene (C6H4Cl2, Sigma-Aldrich, St. Louis, MO, USA) by 0.02 mg/mL.

2.2. Preparation of Carbon Dot (CD)-Decorated SWCNT Suspensions

Purchased SWCNTs (diameter: 1.2–1.7 nm, length: 0.1–4 μm, purity: >99%, Nanointegris Technologies, Boisbriand, Quebec, Canada) were used without further purification. A total of 1 mg of the SWCNTs was uniformly dispersed in 50 mL of 1,2-dichlorobenzene by sonicating for 4 h (here, the concentration value was chosen in previously reported SWCNT-based sensors [15,17,18]). For preparing CD-decorated SWCNT suspensions, the CD suspension (0.02 mg/mL, prepared in experimental Section 2.1) was injected into 0.02 mg/mL of SWCNT suspension with the volume ratios of 1:1, 2:1, and 3:1, respectively.

2.3. Fabrication of CD-Decorated SWCNT-Based Gas Sensors

Figure 1 shows the fabrication schematics of the CD-decorated SWCNT-based gas sensor. An SiO2/Si substrate was cleaned by sonicating it in acetone, methanol, and deionized (DI) water for 15 min each, and then exposing it to an ultraviolet (UV)-ozone atmosphere for 20 min to eliminate residual contaminants and make the surface hydrophilic. Sequentially, the SiO2 surface was pre-treated with poly-l-lysine (PLL) solution for 20 min to form a homogeneous SWCNT layer [40]. In total, 4 mL of the CD-decorated SWCNT suspension was sprayed onto the SiO2/Si substrate using a spray gun with a 0.18 mm-nozzle. The SWCNT network was successfully adsorbed onto the substrate by placing it on a hot plate at 180 °C for 30 min. Finally, interdigitated 200 nm-thick Au electrodes were deposited using a shadow mask with a 150 μm gap.

2.4. Sensing Measurements

The gas sensing performance was measured in a custom-built system consisting of gas bombes, mass flow controllers (MFCs), a gas mixer, a gas chamber, etc., as described in Figure S1. Five target gases (NO2, CO, NO, C6H6, and C7H8) were tested, and each gas was diluted with a carrier gas (N2) using accurate MFCs. In all measurements, the total flow rate was 300 sccm at room temperature, and the bias voltage was 1 V. To connect the Keithley 2400 source meter (Keithley Instrument, Cleveland, OH, USA) to a computer, a GPIB-to-USB converter was used, and the LabView software (National Instruments, Austin, TX, USA) was then utilized for data acquisition.

3. Results and Discussion

The synthesized carbon dots (CDs) were characterized by TEM analysis. Figure 2a shows that spherical CDs with a uniform diameter of ~6.3 nm were synthesized by the precursor pyrolysis method. The high resolution TEM image (inset) shows the lattice fringes of a CD, whose d-spacing value is 0.21 nm, indicating the (100) lattice structure [1]. The CDs were further characterized by a wide-angle X-ray diffraction (XRD) pattern (Figure 2b). Two broad peaks (including a faint and broad peak at around 2θ = 42°) demonstrate the existence of numerous disordered CDs containing C(002) and C(100) lattice structures [41].
Three kinds of CD-decorated SWCNT suspensions were prepared with volume ratios of 1:1, 2:1, and 3:1, respectively, and then characterized using TEM and UV-visible spectroscopy. Figure 2c is a highly magnified TEM image of the (1:1) CD-decorated SWCNTs. Here, strands of SWCNTs decorated with lots of CDs are clearly seen, verifying the successful decoration of SWCNTs with CDs. Because there is no chemical interaction between CDs and SWCNTs, the CDs are weakly bound to SWCNT walls by van der Waals forces [1]. Considering that the SWCNTs with diameters of 1.2–1.7 nm were initially used, the diameter of ~15 nm in the TEM image was obtained as a bundle of SWCNTs, but not an individual SWCNT (TEM images of the SWCNTs before and after CD decoration are compared in Figure S2). The inset shows a photograph of the CD-decorated SWCNT suspension with a brownish color, which demonstrates its homogeneous dispersion.
Figure 2d shows the UV-visible absorbance spectrum of the CD-decorated SWCNT suspension. The spectrum looks similar to that of a pure CD suspension, whose absorbance continuously increases down to 300 nm [41]. However, a series of tiny peaks were found in the wavelength region of 450~550 nm (see the inset). The small peaks indicated by red arrows are only observed in the SWCNT suspension, and are not found in the pure CD suspension. This is more evidence for CD-decorated SWCNTs (see Figure S3 for more information).
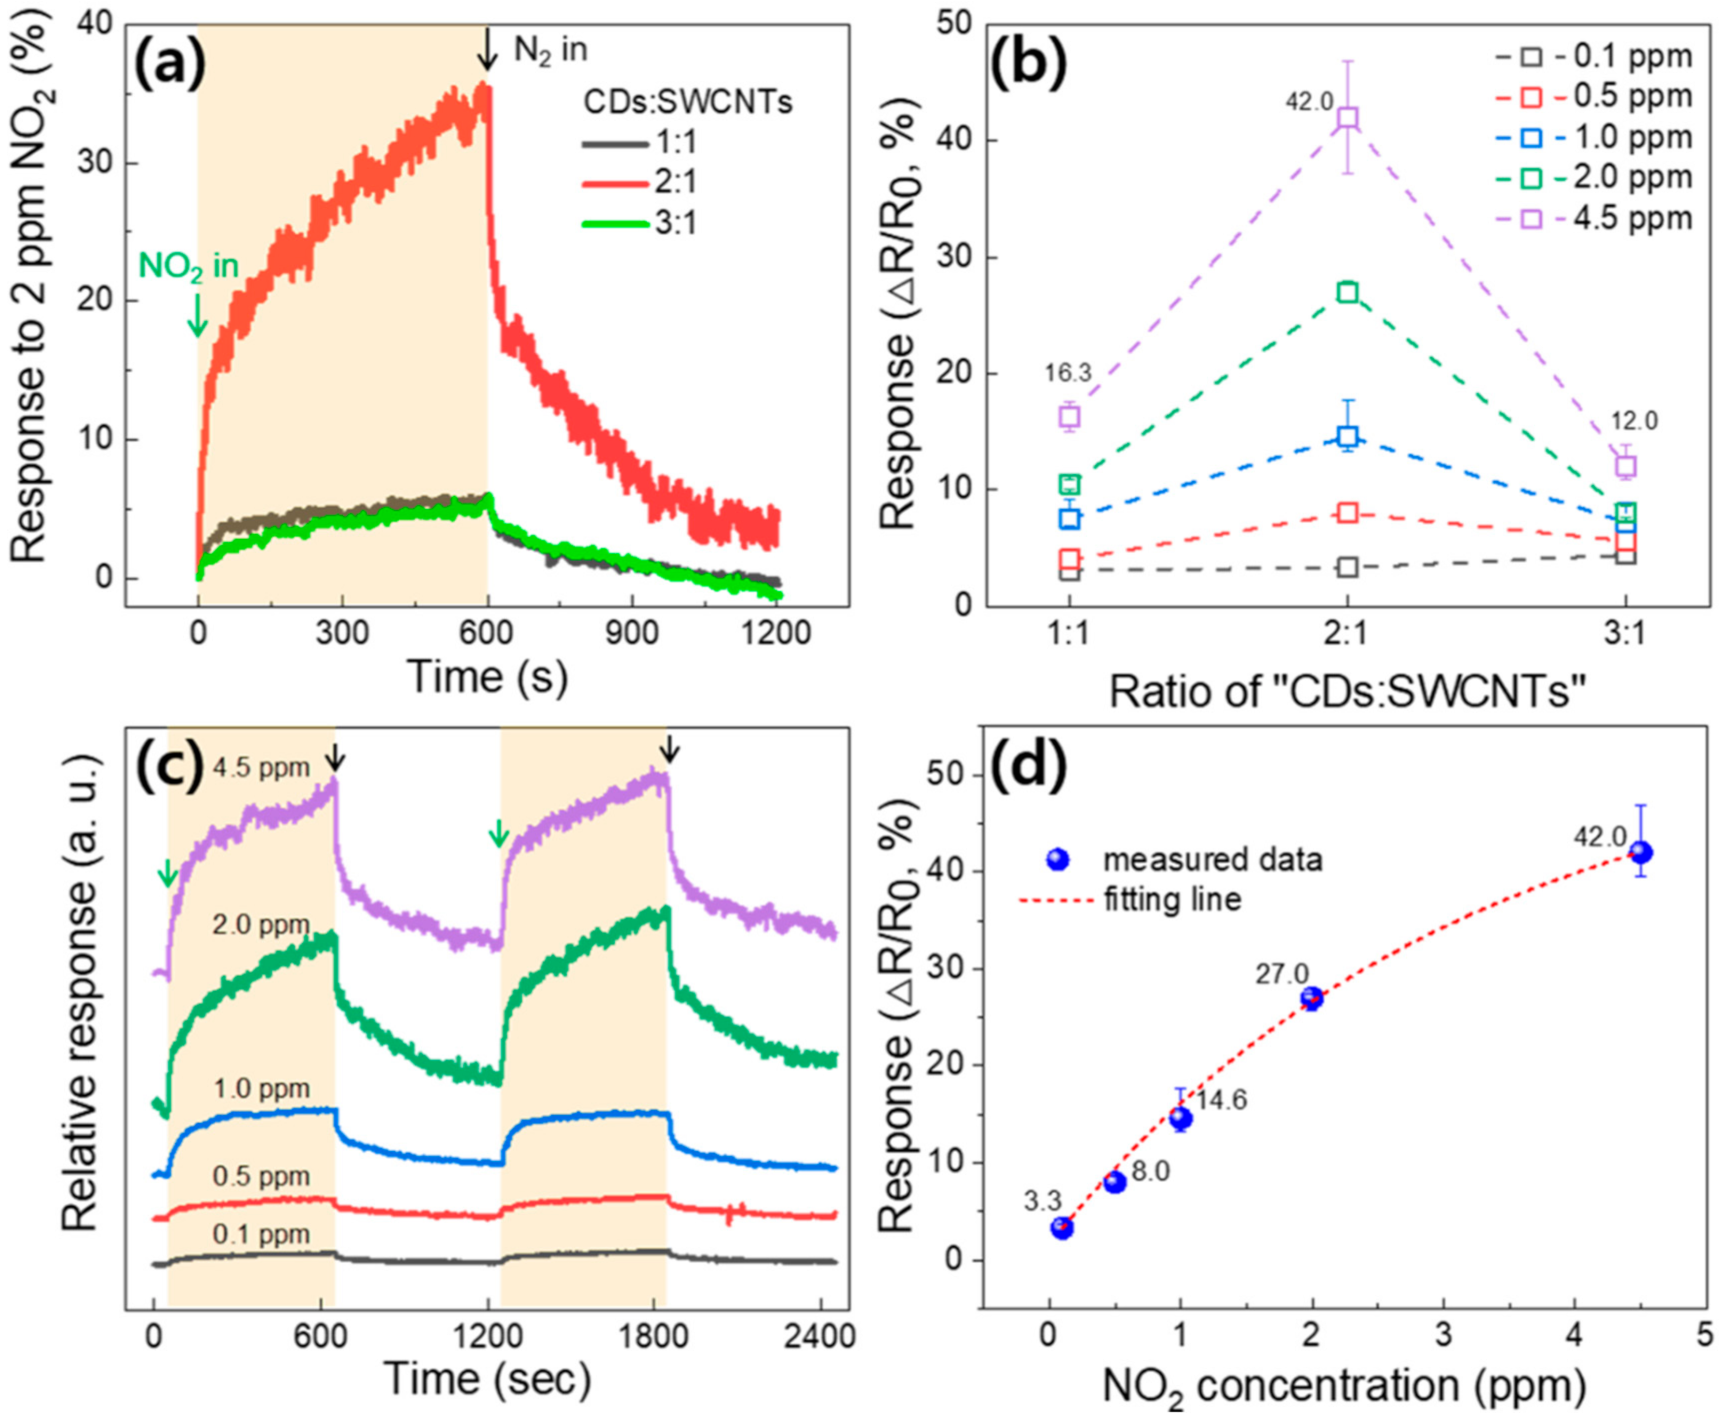
Three kinds of gas sensors were fabricated using the different CD-decorated SWCNT suspensions (1:1, 2:1, and 3:1), and the responses to the nitrogen dioxide (NO2) gas were measured in the custom-built gas sensing system (see Figure S1 for fabrication details). Figure 3a shows the time-resolved response curves of three sensors measured at 2 ppm NO2 (here, the gas response (%) is defined as Δ R / R 0 × 100 ). During the measurement, the NO2 gas was introduced into the chamber consistently with a total flow rate of 300 sccm by using a mass flow controller (MFC) for 600 s (on state), and the inert nitrogen (N2) gas was then introduced identically (off state). All the measurements were performed at room temperature (~25 °C). Here, since the CD-decorated SWCNT-based sensors do not show any saturations in both the on and off states, the response and recovery times are defined as the times required to reach and recover 90% of the sensor’s maximum and minimum resistances, respectively [15,17,21]. According to the analyzed data, the average response and recovery times are ~381 and ~294 s, respectively, and there is no noticeable dependence of the response and recovery time on the CDs to SWCNTs ratio or NO2 concentration (see Figure S4 for more information).
In general, the resistance of an SWCNT-based chemiresistive-type gas sensor decreases when exposed to the oxidizing NO2 gas. This is because SWCNTs display a p-type nature in air due to the doping effects of H2O and O2 [42], and electron-withdrawing NO2 molecules capture electrons from SWCNTs, making more holes in the p-type channel, as described in Equation (1) [3,15].
NO 2   NO 2 +   h +
Interestingly, in our results, the sensor resistance increased when exposed to NO2, as shown in Figure 3a. This phenomenon can be understood with the n-doping effect by the electron-rich CDs [39,43]. The decrease in electron density upon exposure to NO2 gas can increase the resistance of CD-decorated SWCNT sensors. Moreover, the results show that the CDs to SWCNTs ratio is critical in determining the response values. The sensor’s response values extracted from their time-resolved response curves are summarized in Figure 3b. When the CDs to SWCNTs ratio is 2:1, the sensor shows the highest response (Raverage) value of ~42.0% to NO2 gas at 4.5 ppm. From the results, we can reasonably expect that there exists an optimized CDs to SWCNTs ratio for NO2 gas molecule adsorption, which means the optimum doping state of the SWCNTs for NO2 detection. In this experiment, we controlled the NO2 concentration in target gas at 0.1, 0.5, 1.0, 2.0, and 4.5 ppm, and then measured the time-resolved response curves in each case. The results show that at every concentration of NO2 gas (except the 0.1 ppm case, in which the response difference is not clear), the 2:1 sensor exhibited the highest response values.
Figure 3c shows relative comparisons of the time-resolved response curves measured at different NO2 concentrations (hereafter, the 2:1 sensor was used for analysis). Shaded regions indicate the area where the NO2 gas was introduced. At the low concentrations of 0.1 and 0.5 ppm, the difference in their relative response values is inconspicuous. However, as the NO2 concentration increases, the corresponding response value markedly increases. Figure 3d shows plotted data of the response values as a function of the NO2 concentration. At each concentration, 5-cycle response curves were measured and their response values were averaged. The red-dotted curve is a fitting line with the formula y = A 1 e x t 1 + A 2 e x t 2 +   y 0 (here, the fitting line coincides well with the actual data, with the coefficient of determination (COD, R2) value of 0.9969). When the NO2 concentration increases from 0.1 to 2.0 ppm, the gas response rapidly increases from 3.3% to 27.0%. In this concentration range of NO2 gas, surface occupation by the NO2 gas molecules is accelerated in a relatively short time, markedly increasing the surface reaction [3,44]. However, in the range of 2.0~4.5 ppm, the surface reaction becomes gradual, and the response increases slightly to 42.0%. Through the results, it can be predicted that the active surface coverage is gradually saturated by NO2 molecules at concentrations above 2.0 ppm, and the number of vacant adsorption sites thus decreases. From the curve, the sensor’s limit of detection (LOD) was theoretically calculated to be 18 ppb [1,45] (see Figure S5 for more information).
Figure 4 describes an expected NO2 gas sensing mechanism of the CD-decorated SWCNT-based sensor. As discussed above, the CD-decorated SWCNTs behave as n-type material because the SWCNTs are heavily doped by the electron-rich CDs. Considering that the SWCNT is a hollow structure, the carriers are mainly present near the wall, which increases the carrier concentration (Figure 4a). This state can be expressed as band-bending, as shown in the diagram below. The electron accumulation layer corresponds to the bending area (1). In the presence of NO2 gas, oxidative NO2 molecules are adsorbed on the SWCNT surface, resulting in electron transfer from the SWCNT surface to the NO2 molecules. Therefore, the concentration of electrons (i.e., main carriers) is decreased, as schematically shown in Figure 4b. Meanwhile, the adsorption of NO2 gas molecules on the surface of SWCNTs causes upward band-bending in the energy band (1 → 2), which results in an increase of the electrical resistance.
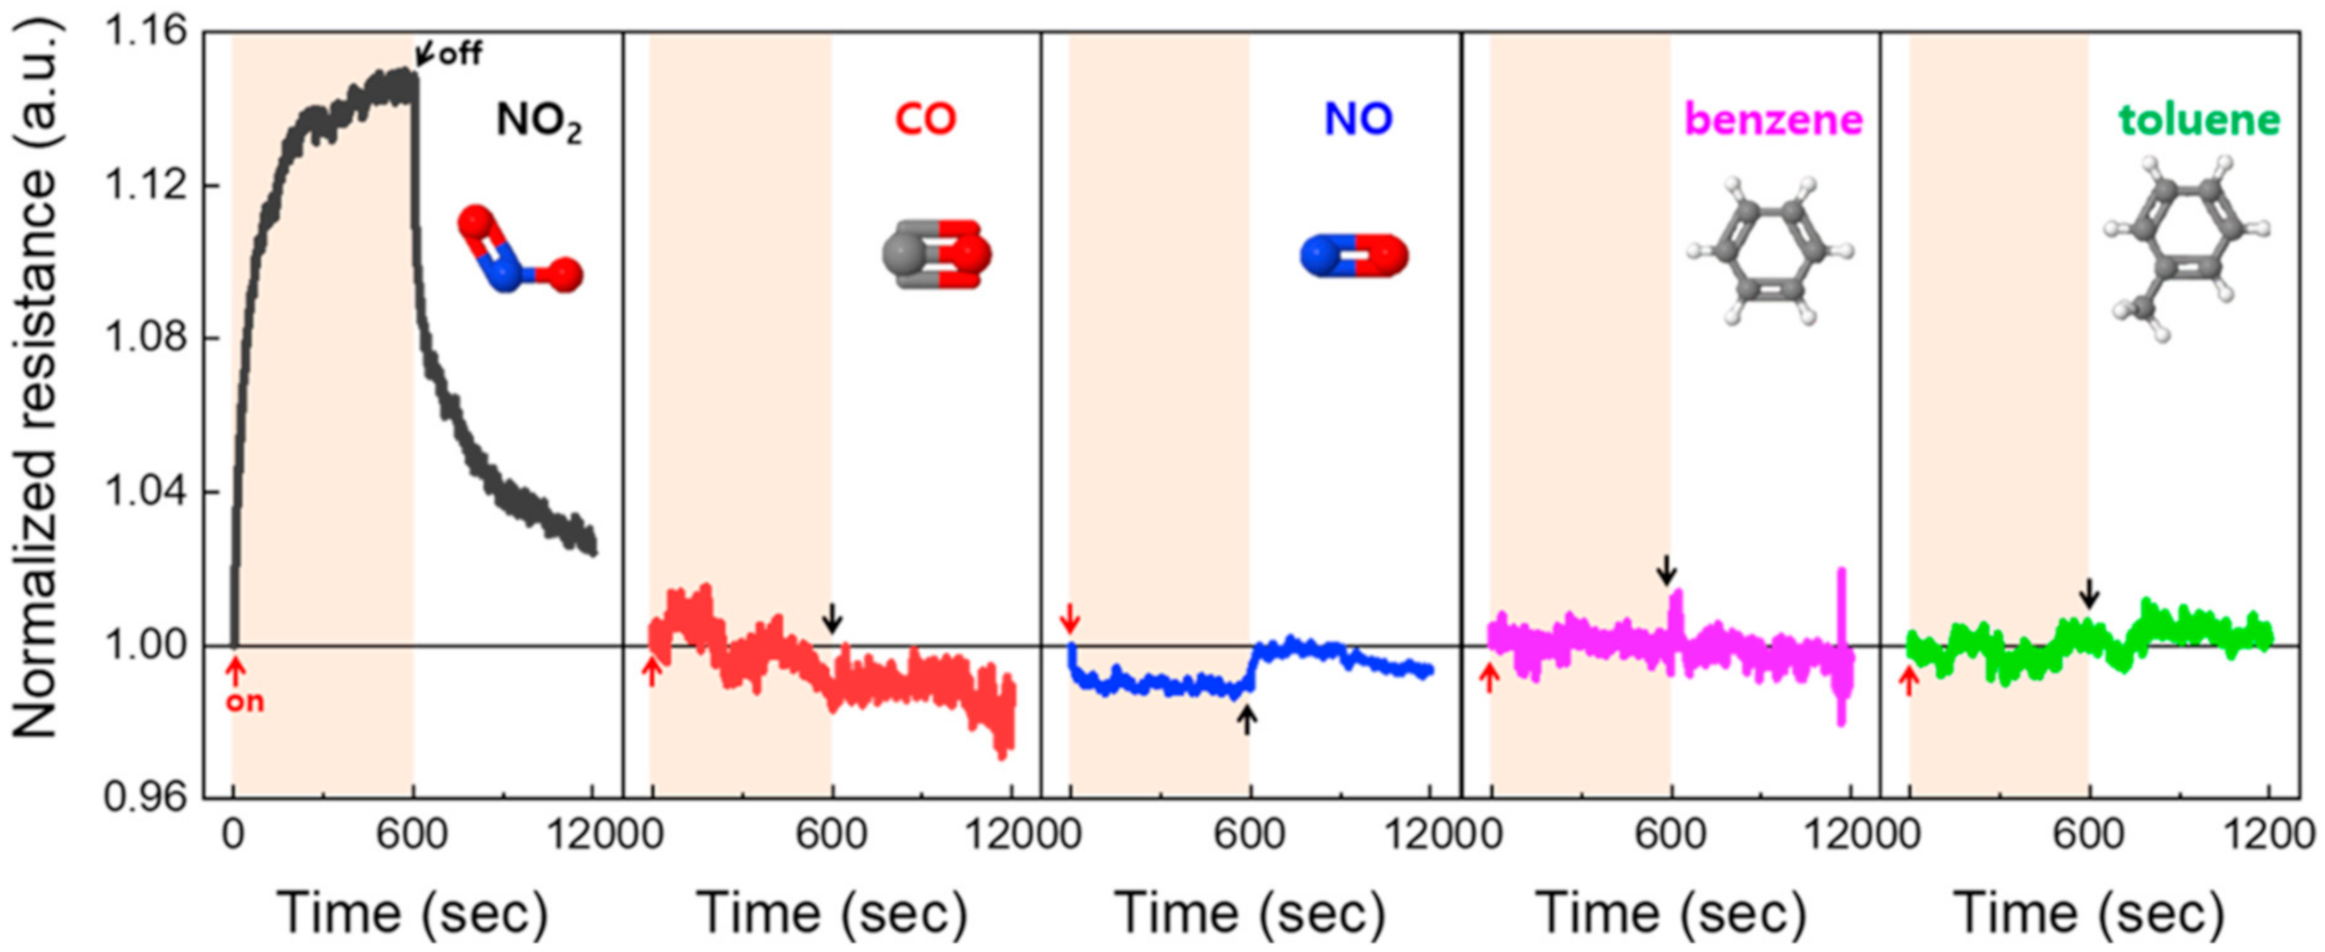
Finally, we measured the sensing performances of the CD-decorated SWCNT-based gas sensor for five different gases (NO2, CO, NO, C6H6, and C7H8) to evaluate the sensor’s selectivity. Here, each target gas was diluted by using N2 gas to obtain a concentration of 1.0 ppm, and the resistance change was then measured by the same method. Figure 5 shows the time-resolved response curves of the sensor for the above-mentioned gas species (here, the normalized resistance value (y-axis) is defined as R/R0, and each inset image indicates the visualized molecular structure of the corresponding gas). In the case of NO2 gas, the resistance increases immediately upon exposure to the gas, and also rapidly decreases when N2 gas is introduced, with the maximum value of ~1.15 (converted response value is ~15%). The large resistance variation can be understood with the electrophilic nature of NO2 molecules that can easily interact with the n-type channel, as discussed above. On the other hand, there is no noticeable resistance change for other gases (CO, C6H6, and C7H8), except for the NO gas (~1%). The slight decrease in the resistance upon exposure to NO gas is probably due to the electron-donating effect of the NO molecules [46]. When the NO molecules are adsorbed on the surface of CD-decorated SWCNTs, the NO molecules are oxidized to give electrons to the n-type channel. As a result, the sensor’s resistance decreases. Nevertheless, because the response value to NO gas is negligible (~1%) compared to that of NO2 gas (~15%), we can conclude that the CD-decorated SWCNT-based sensor can detect NO2 gas with a high selectivity.

4. Conclusions

In this paper, we have suggested the possibility of employing CD-decorated SWCNTs for highly selective NO2 detection at room temperature. The facilely prepared CD-decorated SWCNT suspension was spray-coated on an SiO2/Si substrate, and the interdigitated Au electrodes were then sputtered to complete the sensor. The resistance of the sensor increased when exposed to NO2 gas, which was opposite to the results of previously reported SWCNT-based NO2 sensors. This is because the SWCNTs were heavily n-doped by the synthesized CDs. In addition, the response values of the sensors were significantly changed, depending on the CDs to SWCNTs ratio in the active suspension, and showed the highest value of 42% at the 2:1 ratio (in results of the sensing test using 4.5 ppm NO2). More desirably, the fabricated sensor responded very weakly to NO gas, and did not respond at all to other gases (CO, C6H6, and C7H8), revealing its high selectivity toward NO2 gas. We expect that the proposed NO2 sensing mechanism and the doping phenomenon can be utilized to improve various device performances, as well as highly selective NO2 sensor applications.

Supplementary Materials

The following are available online at https://www.mdpi.com/2079-4991/10/12/2509/s1, Figure S1: Schematic image of the chemiresistive-type gas sensor measurement system, Figure S2: TEM images of SWCNTs; (a) before- and (b) after the CDs decoration, Figure S3: UV-visible spectra of the synthesized carbon dots (CDs) (a) and the purchased single-walled carbon nanotubes (SWCNTs) (b). (Each inset shows a photograph of the corresponding suspension.), Figure S4: (a) Definition of response- and recovery times in a typical time-resolved response curve. Variations of (b) response- and (c) recovery times depending on the ratio of CDs to SWCNTs (the measurement was performed at 2.0 ppm of NO2 concentration.). Variations of (d) response- and (e) recovery times depending on the NO2 concentrations (the 2:1 device was utilized for this data.), Figure S5: (a) Time-resolved response curve of the sensor to 0.1 ppm NO2. (b) Response to NO2 concentration curve and its fitting.

Author Contributions

N.L., research concept and manuscript writing; J.-S.L., research concept and data acquisition; Y.T.B., supervision and funding acquisition. All authors have read and agreed to the published version of the manuscript.

Funding

This research was supported by the National Research Council of Science & Technology (NST) funded by the Korean government (MISP) (No. QLT-CRC-18-02-KICT) and the National Research Foundation of Korea (NRF) grant funded by the Korean government (MSIT, MOE) (No. 2019M3E7A1113097).

Conflicts of Interest

The authors declare no conflict of interest.

References

  1. Cheng, M.; Wu, Z.; Liu, G.; Zhao, L.; Gao, Y.; Li, S.; Zhang, B.; Yan, X.; Lu, G. Carbon dots decorated hierarchical litch-like In2O3 nanospheres for highly sensitive and selective NO2 detection. Sens. Actuators B 2020, 304, 127272. [Google Scholar] [CrossRef]
  2. Wang, R.; Li, G.; Dong, Y.; Chi, Y.; Chen, G. Carbon quantum dot-functionalized aerogels for NO2 gas sensing. Anal. Chem. 2013, 85, 8065–8069. [Google Scholar] [CrossRef]
  3. Sayago, I.; Santos, H.; Horrillo, M.C.; Aleixandre, M.; Fernandez, M.J.; Terrado, E.; Tacchini, I.; Aroz, R.; Maser, W.K.; Benito, A.M.; et al. Carbon nanotube networks as gas sensors for NO2 detection. Talanta 2008, 77, 758–764. [Google Scholar] [CrossRef]
  4. Mane, A.A.; Moholkar, A.V. Palladium (Pd) sensitized molybdenum trioxide (MoO3) nanobelts for nitrogen dioxide (NO2) gas detection. Solid-State Electron. 2018, 139, 21–30. [Google Scholar] [CrossRef]
  5. Jeon, J.; Kang, B.; Byun, Y.T.; Ha, T. High-performance gas sensors based on single-walled carbon nanotube random networks for the detection of nitric oxide down to the ppb-Level. Nanoscale 2019, 11, 1587–1594. [Google Scholar] [CrossRef] [PubMed]
  6. Pan, X.; Liu, X.; Bermak, A.; Fan, Z. Self-gating effect induced large performance improvement of ZnO nanocomb gas sensors. ACS Nano 2013, 7, 9318–9324. [Google Scholar] [CrossRef]
  7. Sun, G.; Lee, J.K.; Choi, S.; Lee, W.I.; Kim, H.W.; Lee, C. Selective oxidizing gas sensing and dominant sensing mechanism of n-CAO-decorated n-ZnO nanorod sensors. ACS Appl. Mater. Interfaces 2017, 9, 9975–9985. [Google Scholar] [CrossRef]
  8. Shishiyanu, S.T.; Shishiyanu, T.S.; Lupan, O.I. Sensing characteristics of tin-doped ZnO thin films as NO2 gas sensor. Sens. Actuators B 2005, 107, 379–386. [Google Scholar] [CrossRef]
  9. Kumar, R.; Al-Dossary, O.; Kumar, G.; Umar, A. Zinc oxide nanostructures for NO2 gas-sensor applications: A review. Nano-Micro Lett. 2015, 7, 97–120. [Google Scholar] [CrossRef] [Green Version]
  10. Li, Y.-X.; Guo, Z.; Su, Y.; Jin, X.-B.; Tang, X.-H.; Huang, J.-R.; Huang, X.-J.; Li, M.-Q.; Liu, J.-H. Hierarchical morphology-dependent gas-sensing performances of three-dimensional SnO2 nanostructures. ACS Sens. 2017, 2, 102–110. [Google Scholar] [CrossRef]
  11. Wang, X.; Su, J.; Chen, H.; Li, G.-D.; Shi, Z.; Zou, H.; Zou, X. Ultrathin In2O3 nanosheets with uniform mesopores for highly sensitive nitric oxide detection. ACS Appl. Mater. Interfaces 2017, 9, 16335–16342. [Google Scholar] [CrossRef] [PubMed]
  12. Zhang, J.; Zeng, D.; Zhu, Q.; Wu, J.; Xu, K.; Liao, T.; Zhang, G.; Xie, C. Effect of grain-boundaries in NIO nanosheet layers room-temperature sensing mechanism under NO2. J. Phys. Chem. C 2015, 119, 17930–17939. [Google Scholar] [CrossRef]
  13. Cai, Z.-X.; Li, H.-Y.; Ding, J.-C.; Guo, X. Hierarchical flowerlike WO3 nanostructures assembled by porous nanoflakes for enhanced NO gas sensing. Sens. Actuators B 2017, 246, 225–234. [Google Scholar] [CrossRef]
  14. Geng, L.; Zhao, Y.; Huang, X.; Wang, S.; Zhang, S.; Wu, S. Characterization and gas sensitivity study of polyaniline/SnO2 hybrid material prepared by hydrothermal route. Sens. Actuators B 2007, 120, 568–572. [Google Scholar] [CrossRef]
  15. Choi, S.-W.; Kim, J.; Byun, Y.T. Highly sensitive and selective NO2 detection by Pt nanoparticles-decorated single-walled carbon nanotubes and the underlying sensing mechanism. Sens. Actuators B 2017, 238, 1032–1042. [Google Scholar] [CrossRef]
  16. Kim, J.; Choi, S.-W.; Lee, J.-H.; Chung, Y.; Byun, Y.T. Gas sensing properties of defect-induced single-walled carbon nanotubes. Sens. Actuators B 2016, 228, 688–692. [Google Scholar] [CrossRef]
  17. Choi, S.-W.; Byun, Y.T. The effect of platinum precursor concentrations on chlorine sensing characteristics of platinum nanoparticles-loaded single walled carbon nanotubes. Appl. Surf. Sci. 2018, 433, 480–486. [Google Scholar] [CrossRef]
  18. Lee, D.-J.; Choi, S.-W.; Byun, Y.T. Room temperature monitoring of hydrogen peroxide vapor using platinum nanoparticles-decorated single-walled carbon nanotube networks. Sens. Actuators B 2018, 256, 744–750. [Google Scholar] [CrossRef]
  19. Choi, S.-W.; Kim, B.-M.; Oh, S.-H.; Byun, Y.T. Selective detection of chlorine at room temperature utilizing single-walled carbon nanotubes functionalized with platinum nanoparticles synthesized via ultraviolet irradiation. Sens. Actuators B 2017, 249, 414–422. [Google Scholar] [CrossRef]
  20. Lee, J.-S.; Jeong, D.-W.; Byun, Y.T. Porphyrin nanofiber/single-walled carbon nanotube nanocomposite-based sensors for monitoring hydrogen peroxide vapor. Sens. Actuators B 2020, 306, 127518. [Google Scholar] [CrossRef]
  21. Yaqoob, U.; Phan, D.-T.; Uddin, A.S.M.I.; Chung, G.-S. Highly flexible room temperature NO2 sensor based on MWCNTs-WO3 nanoparticles hybrid on a PET substrate. Sens. Actuators B 2015, 221, 760–768. [Google Scholar] [CrossRef]
  22. Hong, J.; Lee, S.; Seo, J.; Pyo, S.; Kim, J.; Lee, T. A highly sensitive hydrogen sensor with gas selectivity using a PMMA membrane-coated Pd nanoparticle/single-layer graphene hybrid. Sens. ACS Appl. Mater. Interfaces 2015, 7, 3354–3561. [Google Scholar] [CrossRef] [PubMed]
  23. Chung, M.G.; Kim, D.H.; Lee, H.M.; Kim, T.; Choi, J.H.; Seo, D.; Yoo, J.-B.; Hong, S.-H.; Kang, T.-J.; Kim, Y.H. Highly sensitive NO2 gas sensor based on ozone treated graphene. Sens. Actuators B 2012, 166-167, 172–176. [Google Scholar] [CrossRef]
  24. Choi, S.-J.; Ryu, W.-H.; Kim, S.-J.; Cho, H.-J.; Kim, I.-D. Bi-functional co-sensitization of graphene oxide sheets and Ir nanoparticles on p-Type Co3O4 nanofibers for selective acetone detection. J. Mater. Chem. B 2014, 2, 7160–7167. [Google Scholar] [CrossRef] [PubMed]
  25. Septiani, N.L.W.; Yuliarto, B. Review-the development of gas sensor based on carbon nanotubes. J. Electrochem. Soc. 2016, 163, B97. [Google Scholar] [CrossRef]
  26. Ellis, J.E.; Star, A. Carbon nanotube based gas sensors toward breath analysis. ChemPlusChem 2016, 81, 1248–1265. [Google Scholar] [CrossRef]
  27. Goldoni, A.; Alijani, V.; Sangaletti, L.; D’Arsie, L. Advanced promising routes of carbon/metal oxides hybrid in sensors: A review. Electrochim. Acta 2018, 266, 139–150. [Google Scholar] [CrossRef]
  28. Baptista, F.R.; Belhout, S.A.; Giordani, S.; Quinn, S.J. Recent develpments in carbon nanomaterial sensors. Chem. Soc. Rev. 2015, 44, 4433–4453. [Google Scholar] [CrossRef]
  29. Zhang, X.; Yang, B.; Wang, X.; Luo, C. Effect of plasma treatment on multi-walled carbon nanotubes for the detection of H2S and SO2. Sensors 2012, 12, 9375–9385. [Google Scholar] [CrossRef] [Green Version]
  30. Zhao, W.; Fam, D.W.H.; Yin, Z.; Sun, T.; Tan, H.T.; Liu, W.; Tok, A.I.Y.; Boey, Y.C.F.; Zhang, H.; Hng, H.H.; et al. A carbon monoxide gas sensor using oxygen plasma modified carbon nanotubes. Nanotechnology 2012, 23, 425502. [Google Scholar] [CrossRef]
  31. Cho, B.; Yoon, J.; Hahm, M.G.; Kim, D.-H.; Kim, A.R.; Kahng, Y.H.; Park, S.-W.; Lee, Y.-J.; Park, S.-G.; Kwon, J.-D.; et al. Graphene-based gas sensor: Metal decoration effect and application to a flexible device. J. Mater. Chem. C 2014, 2, 5280–5285. [Google Scholar] [CrossRef]
  32. Evans, G.P.; Buckley, D.J.; Skipper, N.T.; Parkin, I.P. Single-walled carbon nanotube composite inks for printed gas sensors: Enhanced detection of NO2, NH3, EtOH and acetone. RSC Adv. 2014, 4, 51395–51403. [Google Scholar] [CrossRef]
  33. Choi, S.-W.; Kim, J.; Lee, J.-H.; Byun, Y.T. Remarkable improvement of CO-sensing performances in single-walled carbon nanotubes due to modification of the conducting channel by functionalization of Au nanoparticles. Sens. Actuators B 2016, 232, 625–632. [Google Scholar] [CrossRef]
  34. Marichy, C.; Russo, P.A.; Latino, M.; Tessonnier, J.-P.; Willinger, M.-G.; Donato, N.; Neri, G.; Pinna, N. Tin dioxide-carbon heterostructures applied to gas sensing: Structure-dependent properties and general sensing mechanism. J. Phys. Chem. C 2013, 117, 19729–19739. [Google Scholar] [CrossRef] [Green Version]
  35. Tian, X.; Wang, Q.; Chen, X.; Yang, W.; Wu, Z.; Xu, X.; Jiang, M.; Zhou, Z. Enhanced performance of core-shell structured polyaniline at helical carbon nanotube hybrids for ammonia gas sensor. Appl. Phys. Lett. 2014, 105, 203109. [Google Scholar] [CrossRef]
  36. Liu, S.; Wang, Z.; Zhang, Y.; Zhang, C.; Zhang, T. High performance room temperature NO2 sensors based on reduced graphene oxide-multiwalled carbon nanotubes-tin oxide nanoparticles hybrids. Sens. Actuators B 2015, 211, 318–324. [Google Scholar] [CrossRef]
  37. Tung, T.T.; Pham-Huu, C.; Janowska, I.; Kim, T.Y.; Castro, M.; Feller, J.-F. Hybrid films of graphene and carbon nanotubes for high performance chemical and temperature sensing applications. Small 2015, 11, 3485–3493. [Google Scholar] [CrossRef]
  38. Wang, S.; Chen, Z.-G.; Cole, I.; Li, Q. Structural evolution of graphene quantum dots during thermal decomposition of citric acid and the corresponding photoluminescence. Carbon 2015, 82, 304–313. [Google Scholar] [CrossRef] [Green Version]
  39. Song, Y.; Zhu, S.; Zhang, S.; Fu, Y.; Wang, L.; Zhao, X.; Yang, B. Investigation from chemical structure to photoluminescent mechanism: A type of carbon dots from the pyrolysis of citric acid and an amine. J. Mater. Chem. C 2015, 3, 5976–5984. [Google Scholar] [CrossRef]
  40. Zhang, Y.; Li, J.; Shen, Y.; Wang, M.; Li, J. Poly-l-lysine functionalization of single-walled carbon nanotubes. J. Phys. Chem. B 2004, 108, 15343–15346. [Google Scholar] [CrossRef]
  41. Edison, T.N.J.I.; Atchundan, R.; Sethuraman, M.G.; Shim, J.-J.; Lee, Y.R. Microwave assisted green synthesis of fluorescent N-doped carbon dots: Cytotoxicity and bio-imaging applications. J. Photochem. Photobiol. B 2016, 161, 154–161. [Google Scholar] [CrossRef] [PubMed]
  42. Duong, D.L.; Lee, S.M.; Lee, Y.H. Origin of unipolarity in carbon nanotubes field effect transistors. J. Mater. Chem. 2012, 22, 1994–1997. [Google Scholar] [CrossRef]
  43. Zhu, W.; Song, H.; Zhang, L.; Weng, Y.; Su, Y.; Lv, Y. Fabrication of fluorescent nitrogen-rich graphene quantum dots by tin(IV) catalytic carbonization of ethanolamine. RSC Adv. 2015, 5, 60085–60089. [Google Scholar] [CrossRef]
  44. Robinson, J.A.; Snow, E.S.; Badescu, S.C.; Reinecke, T.L.; Perkins, F.K. Role of defects in single-walled carbon nanotube chemical sensors. Nano Lett. 2006, 6, 1747–1751. [Google Scholar] [CrossRef] [Green Version]
  45. Kumar, D.; Chaturvedi, P.; Saho, P.; Jha, P.; Chouksey, A.; Lal, M.; Rawat, J.S.B.S.; Tandon, R.P.; Chaudhury, P.K. Effect of single wall carbon nanotube networks on gas sensor response and detection limit. Sens. Actuators B 2017, 240, 1134–1140. [Google Scholar] [CrossRef]
  46. Hoffmann, M.W.G.; Prades, J.D.; Mayrhofer, L.; Hernandez-Ramirez, F.; Jarvi, T.T.; Moseler, M.; Waag, A.; Shen, H. Highly selective SAM-nanowire hybrid NO2 sensor: Insight into charge transfer dynamics and alignment of frontier molecular orbitals. Adv. Funct. Mater. 2014, 24, 595–602. [Google Scholar] [CrossRef] [Green Version]
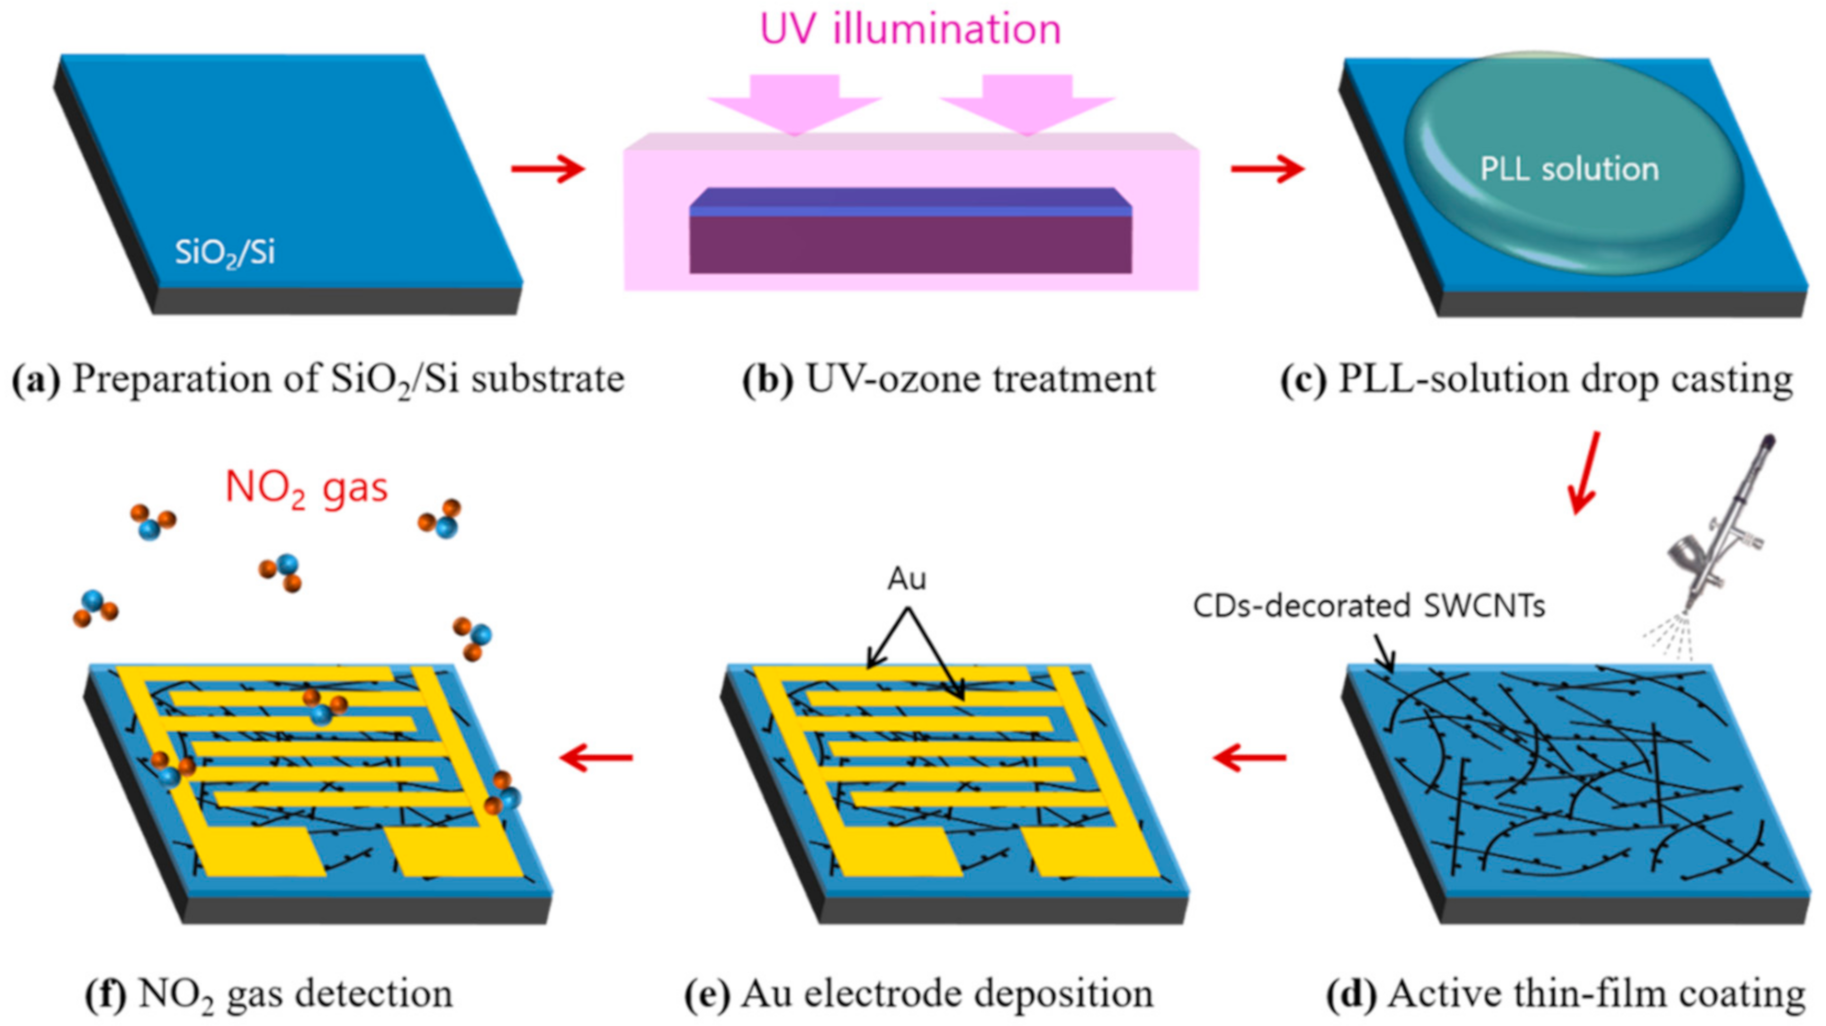
Figure 1. Schematic fabrication process of the chemiresistive-type gas sensor. (a) Preparation of the SiO2/Si substrate by sonicating it in acetone, methanol, and deionized (DI) water for 10 min each. (b) UV-ozone treatment to eliminate organic residues on the SiO2/Si substrate. (c) poly-l-lysine (PLL)-solution drop casting for the successive carbon dot (CD)-decorated single-walled carbon nanotubes (SWCNT) thin-film formation. (d) Active thin-film coating by a spray-printing method. (e) Au electrode deposition by a sputtering method. (f) Measurement of the NO2 gas response in a custom-built gas sensing system.
Nanomaterials 10 02509 g001
Figure 2. Characterization of carbon dots (CDs) and CD-decorated SWCNTs: (a) A transmission electron microscope (TEM) image (inset shows the lattice fringe of a CD); (b) a wide-angle X-ray diffraction (XRD) pattern of the synthesized CDs; (c) a magnified TEM image of CD-decorated SWCNTs; and (d) UV-vis absorbance spectra of the CD-decorated SWCNT suspension (inset shows the magnified spectrum of the 450–550 nm range).
Nanomaterials 10 02509 g002
Figure 3. (a) Time-resolved response curves of gas sensors with CDs to SWCNTs ratios of 1:1, 2:1, and 3:1, respectively. (b) Response variations depending on the CDs to SWCNTs ratio. (c) Variations of the time-resolved response curves at different NO2 concentrations. (d) Response variation of the 2:1 device as a function of the NO2 concentration.
Nanomaterials 10 02509 g003
Figure 4. Schematic illustration of the expected NO2 gas-sensing mechanism of the CD-decorated SWCNTs: (a) In an inert atmosphere, and (b) upon exposure to NO2. The band diagrams indicate the schematic electron distributions of the corresponding structures (bending parts (1 and 2) correspond to the electron accumulation layers in each case).
Nanomaterials 10 02509 g004
Figure 5. Selectivity test of the CD-decorated SWCNT-based gas sensor (CDs:SWCNTs = 2:1); normalized resistance (=R/R0) vs. time curves of gas sensors for five gas species (1 ppm of NO2, CO, NO, C6H6, and C7H8). The measurements were carried out utilizing the custom-built sensing system at room temperature. The inset images indicate the corresponding gas molecular structures.
Nanomaterials 10 02509 g005
Publisher’s Note: MDPI stays neutral with regard to jurisdictional claims in published maps and institutional affiliations.