Boron Nitride Nanotubes Versus Carbon Nanotubes: A Thermal Stability and Oxidation Behavior Study

 , , ,
, , ,  ,
,  and
and
Abstract
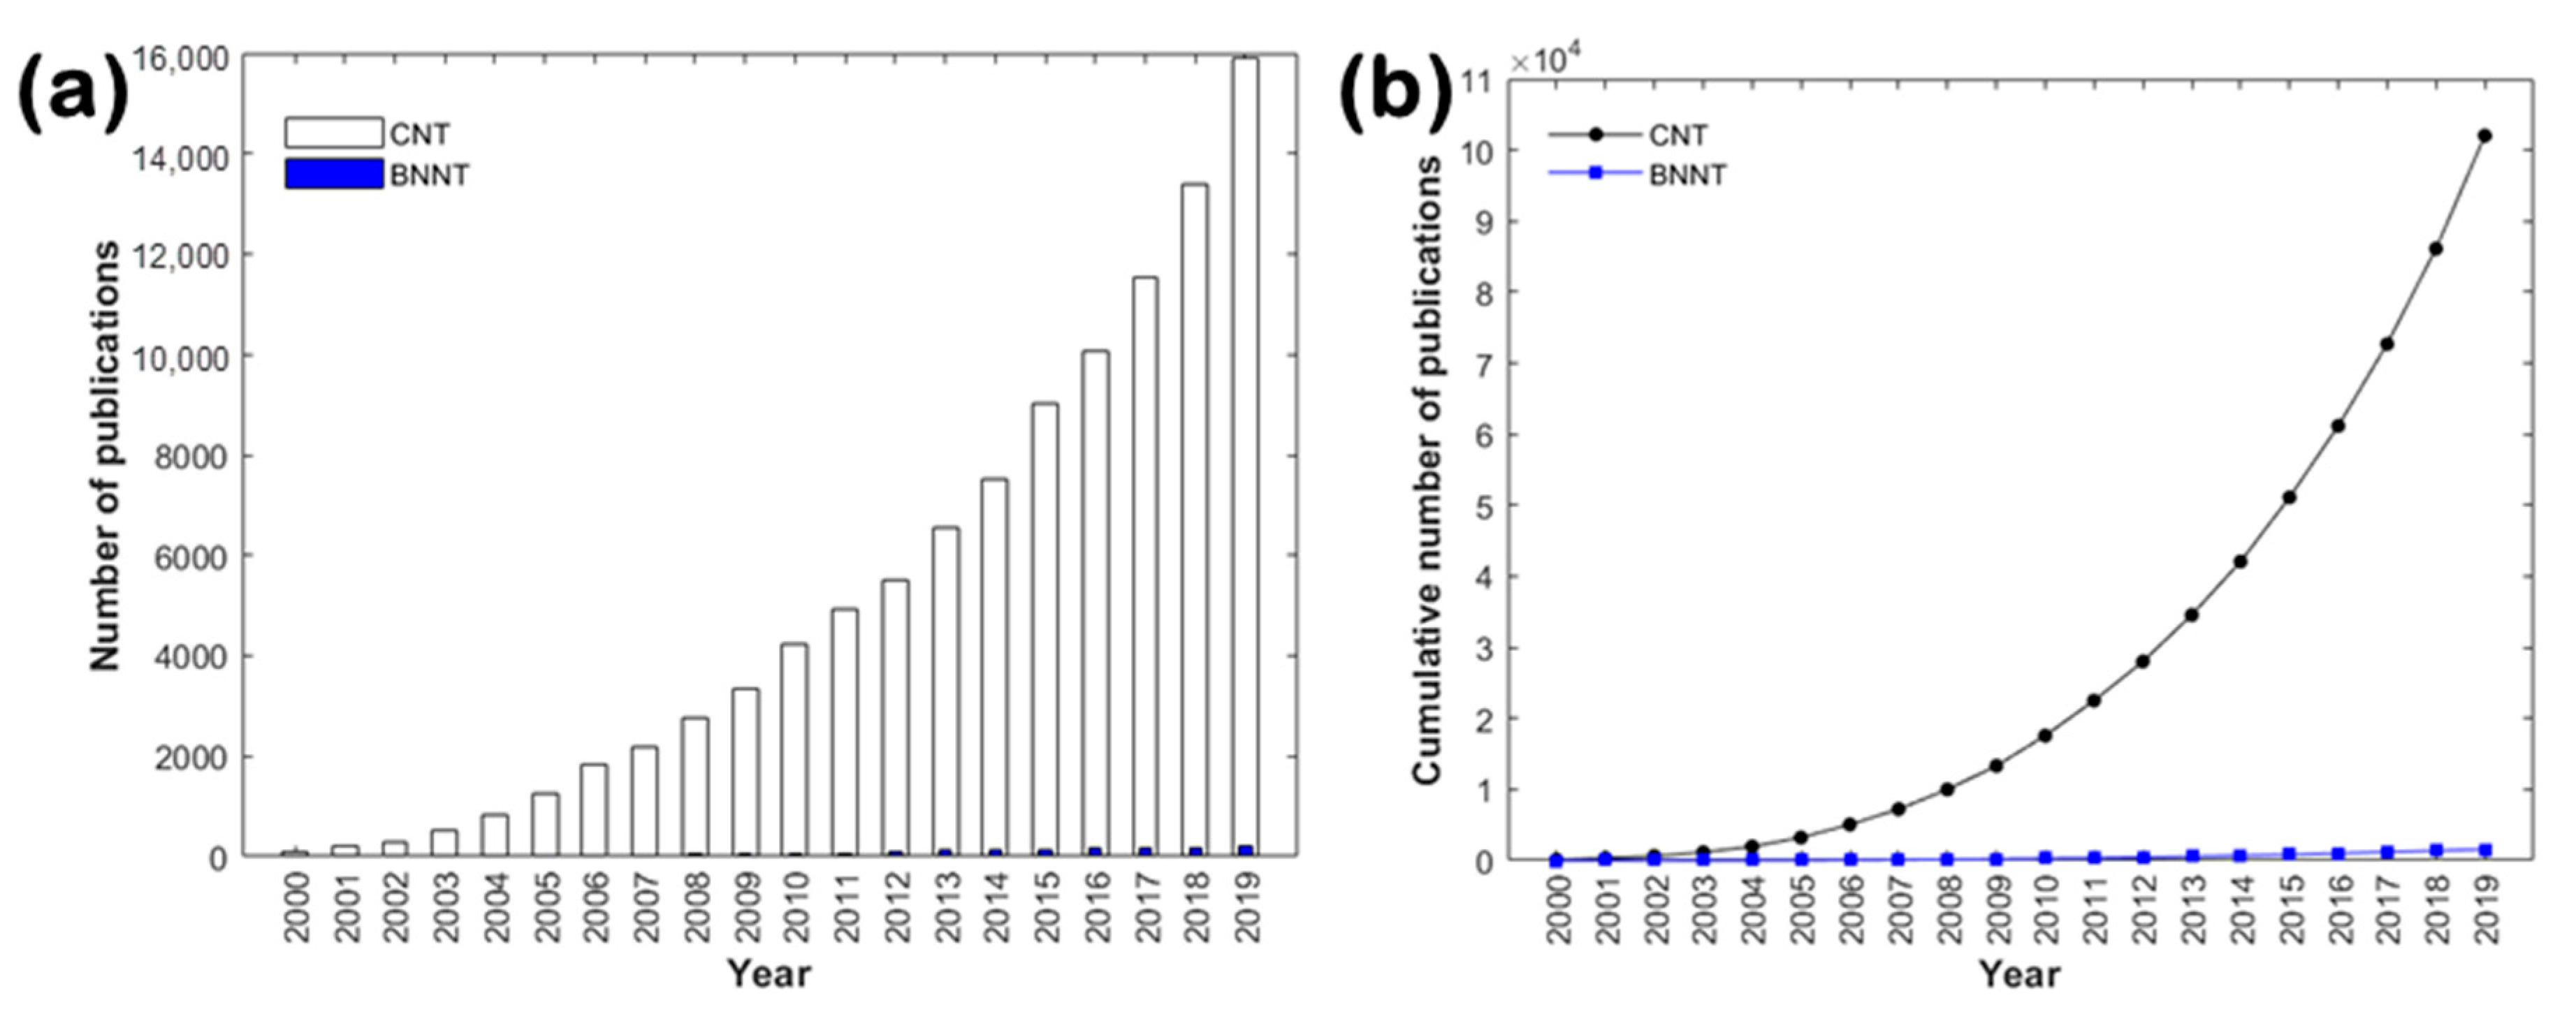
1. Introduction
2. Materials and Methods
3. Results and Discussion
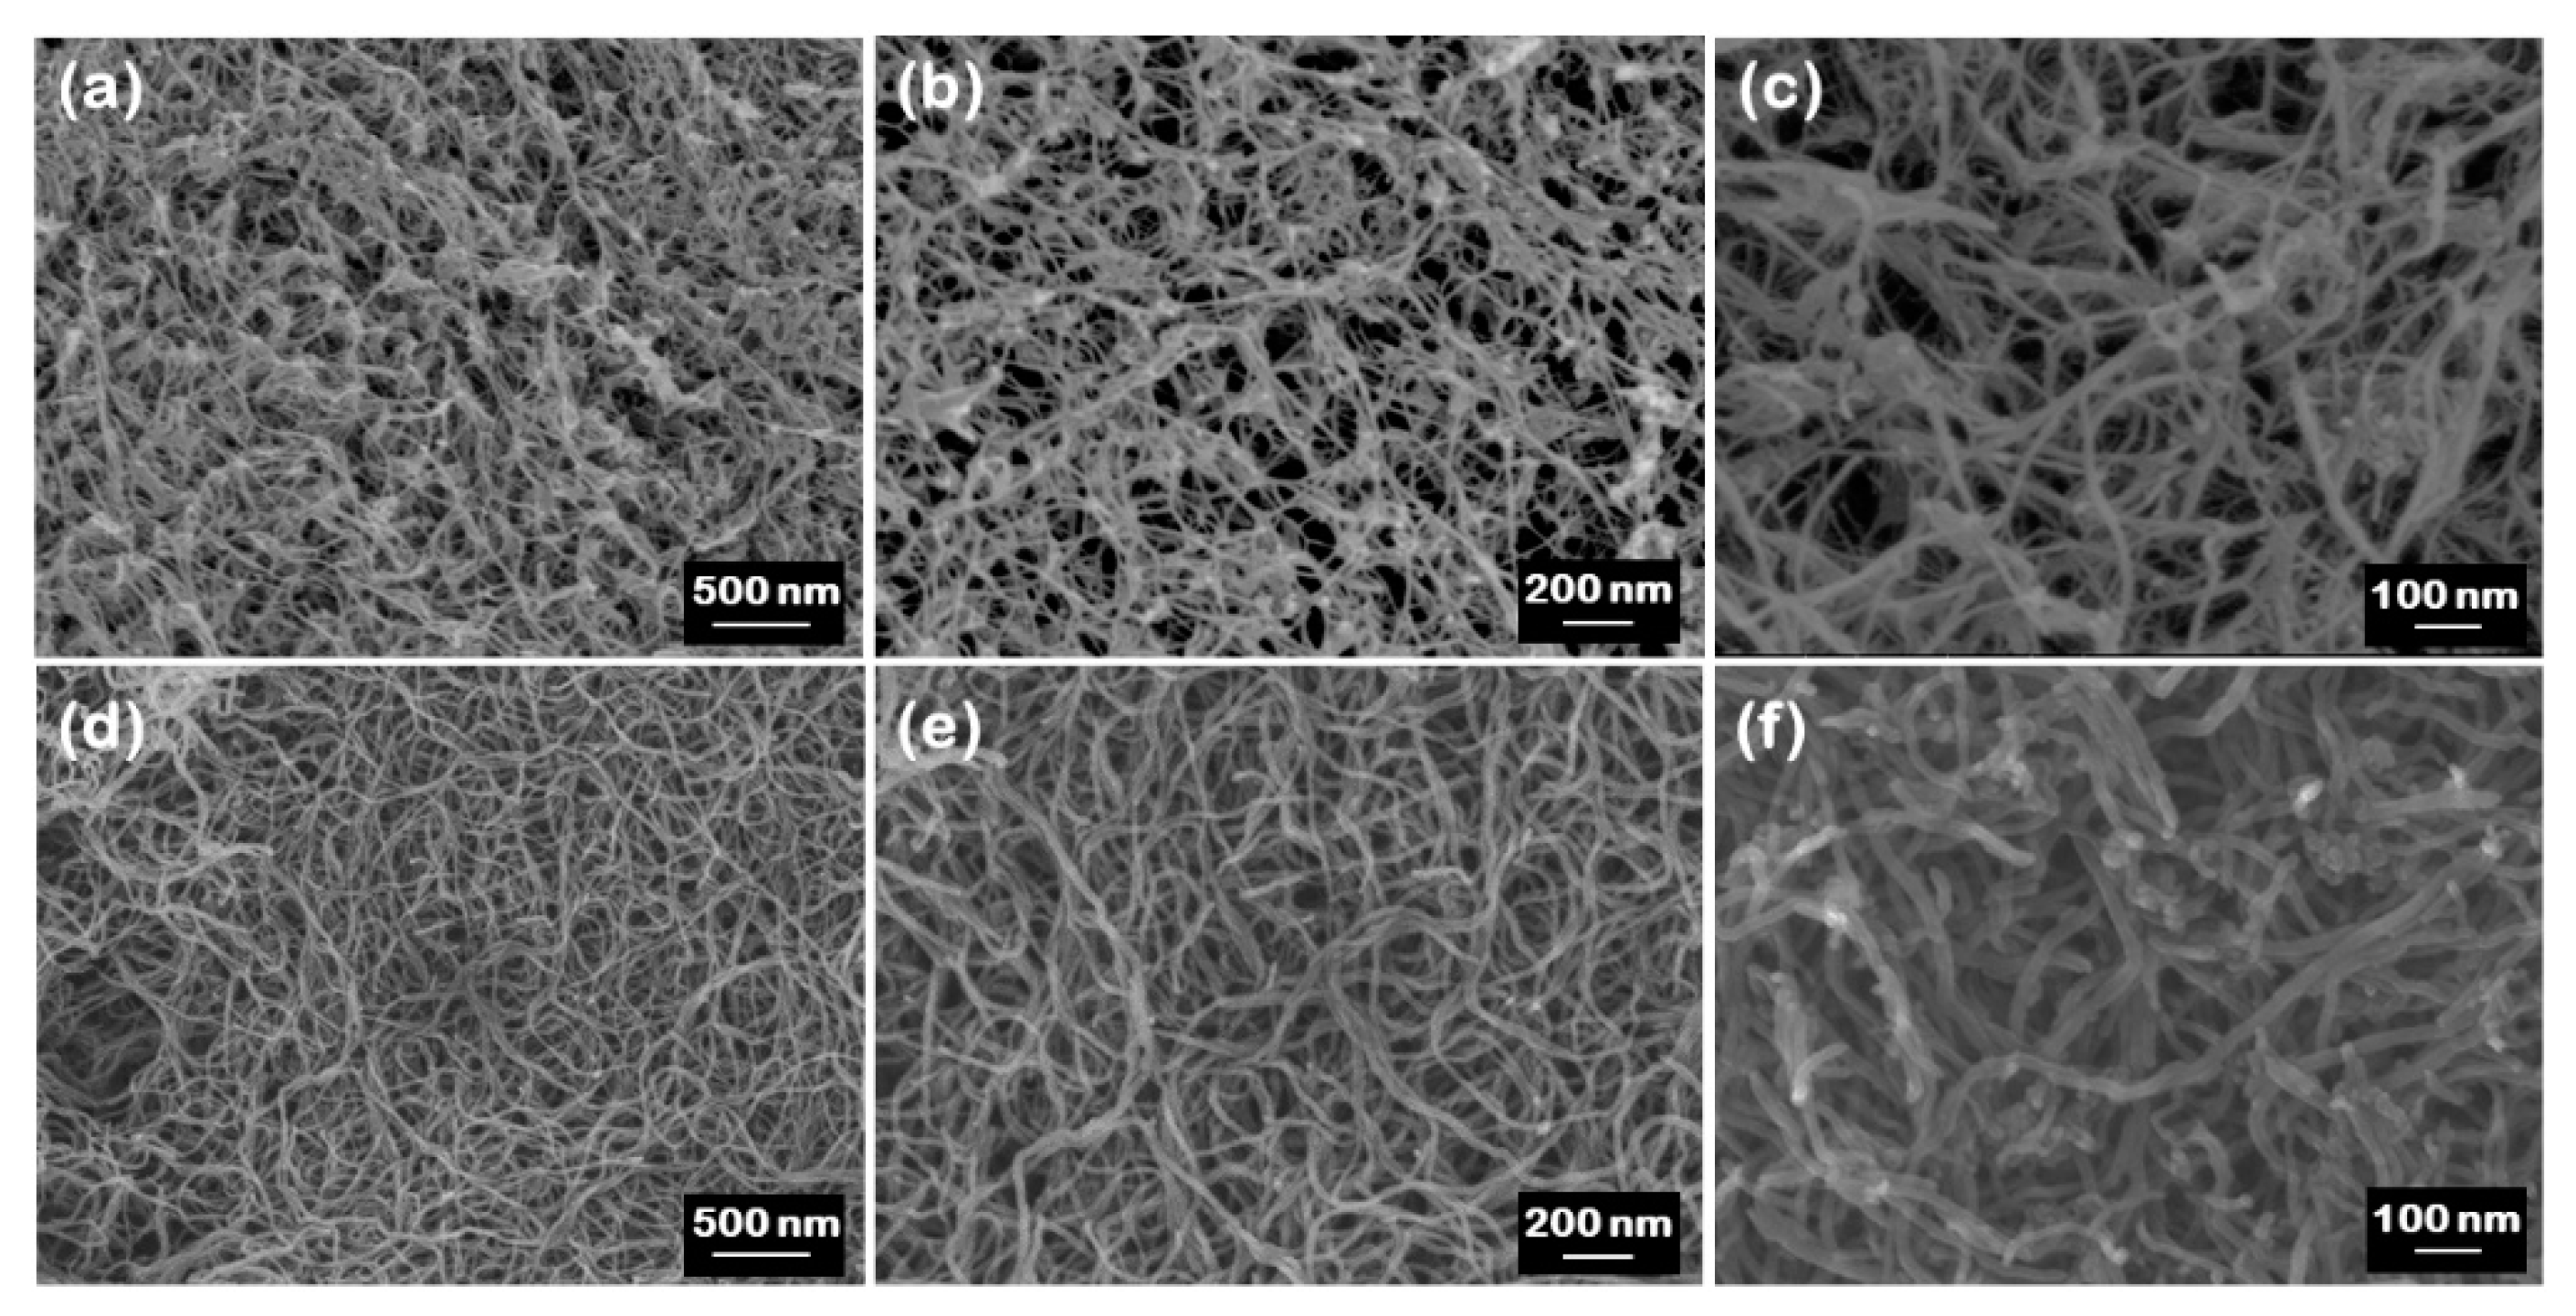
3.1. Surface Morphology
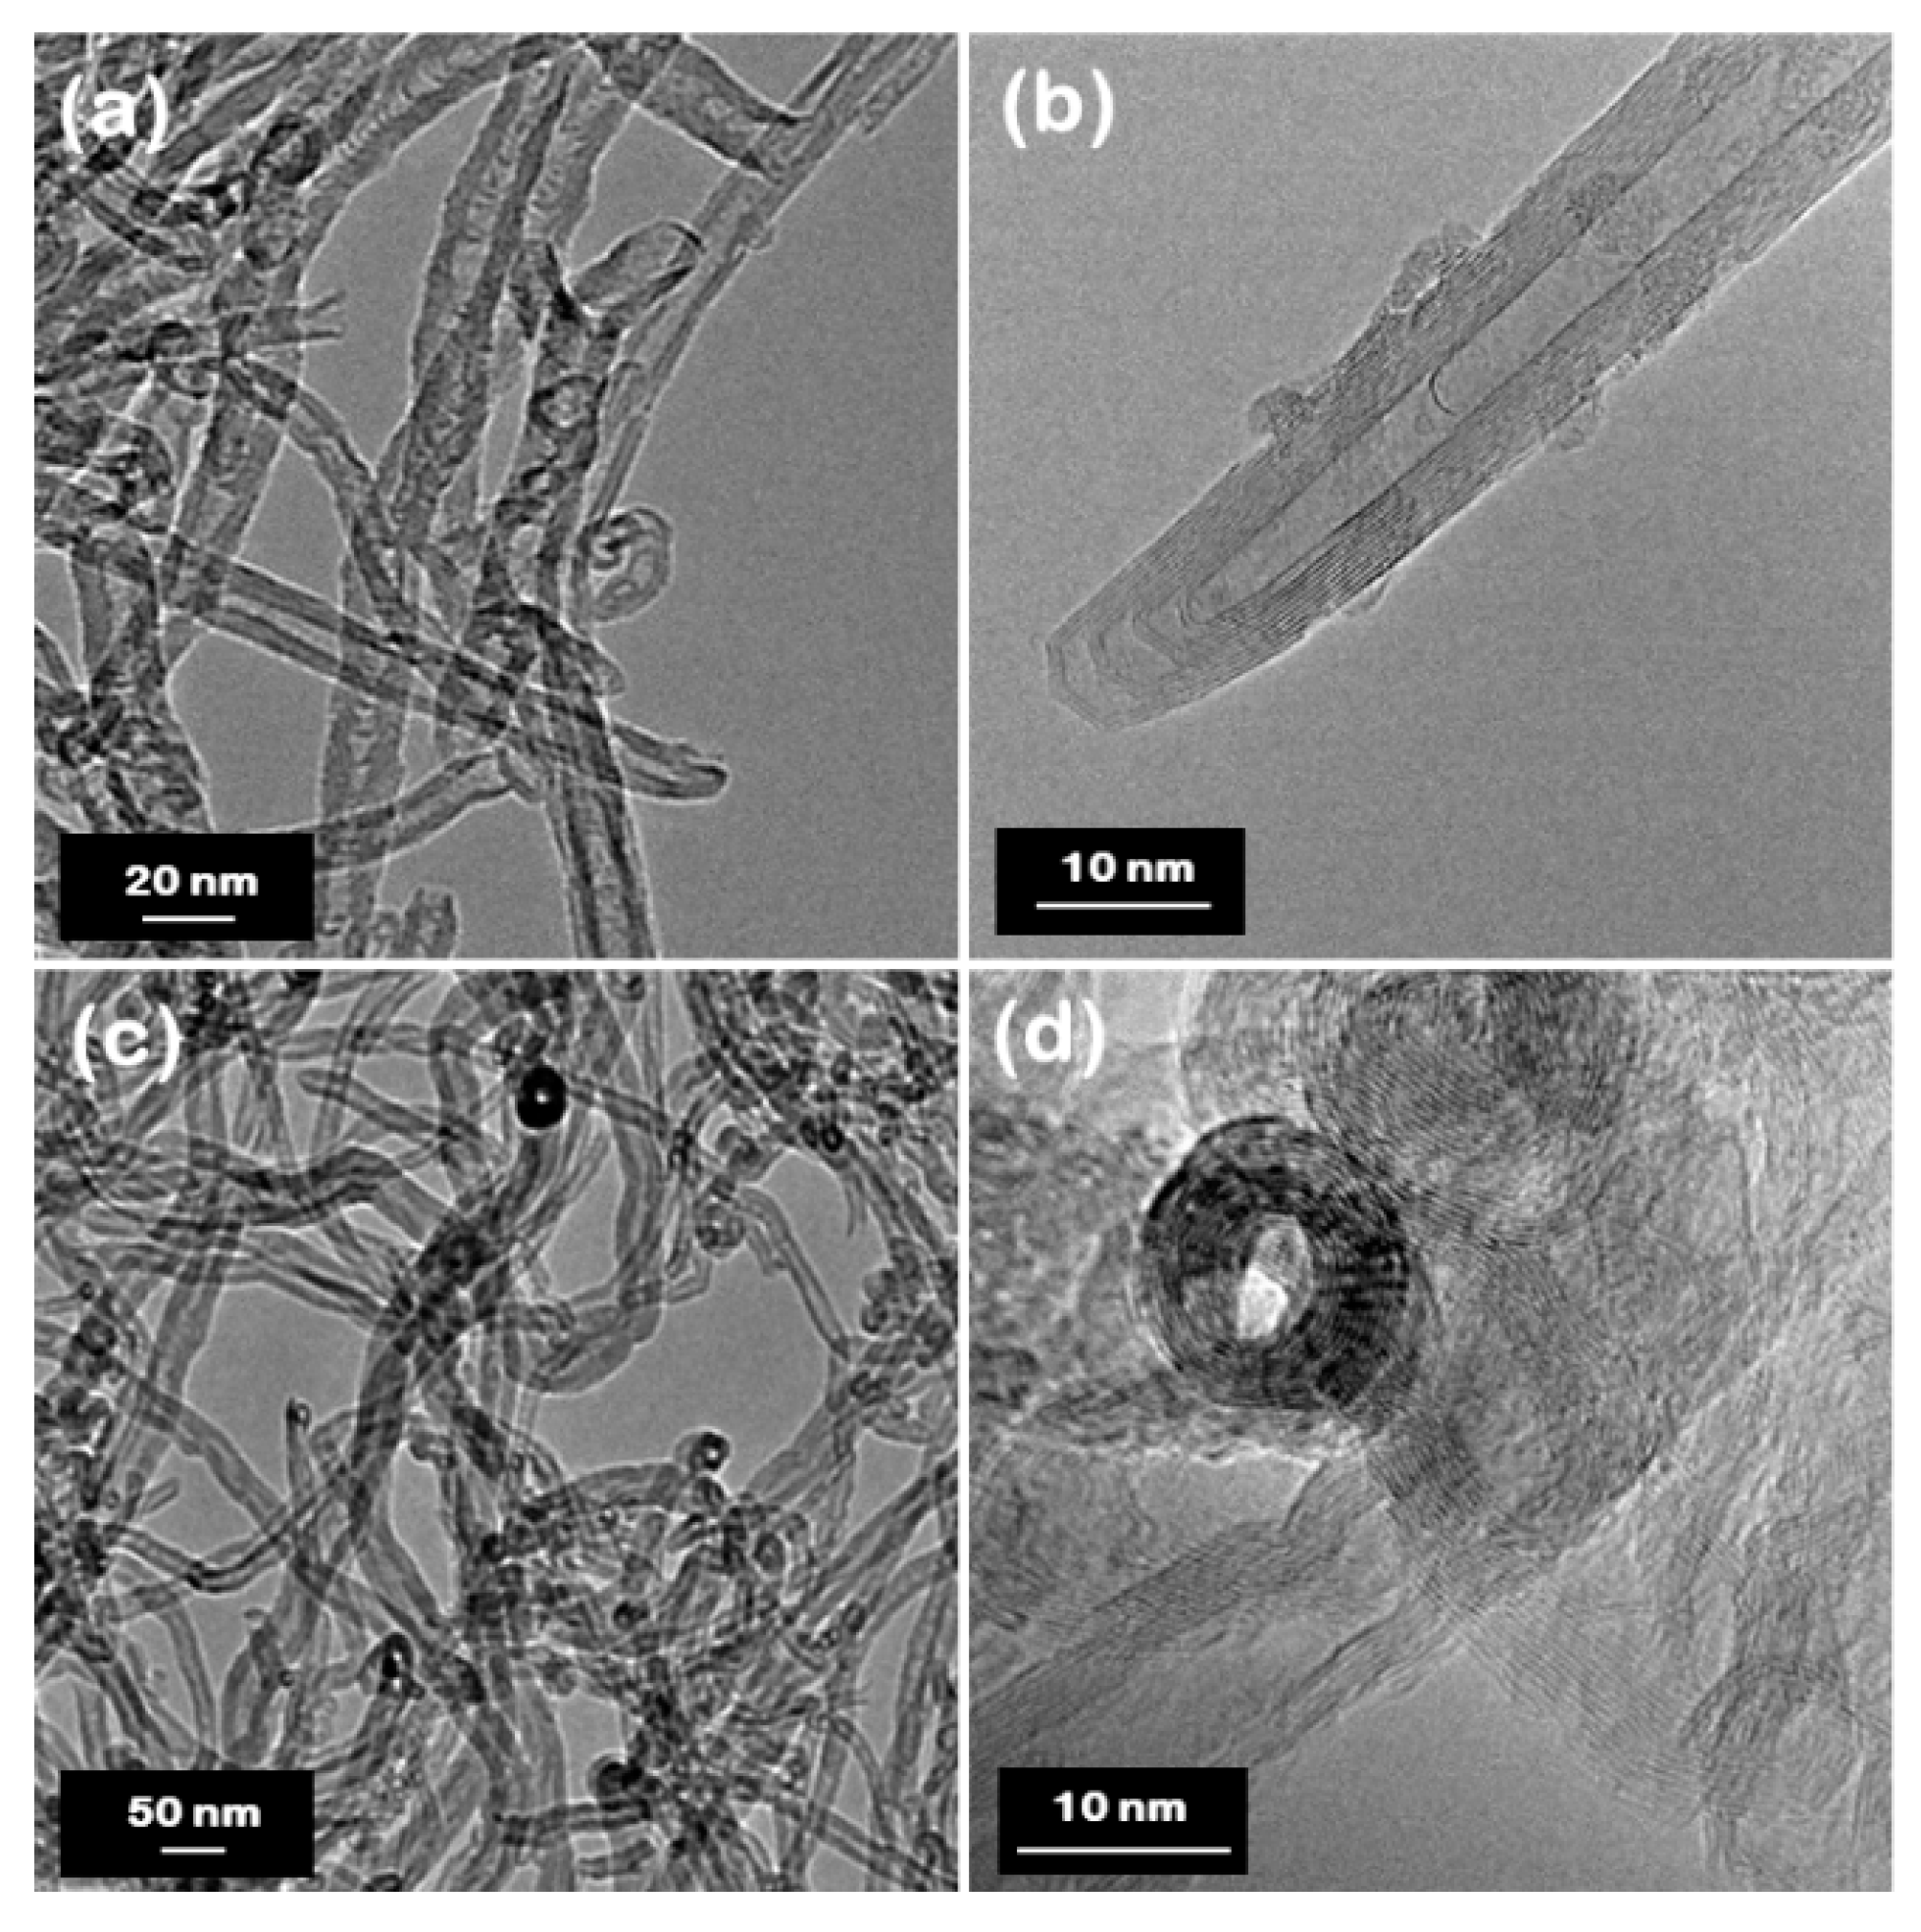
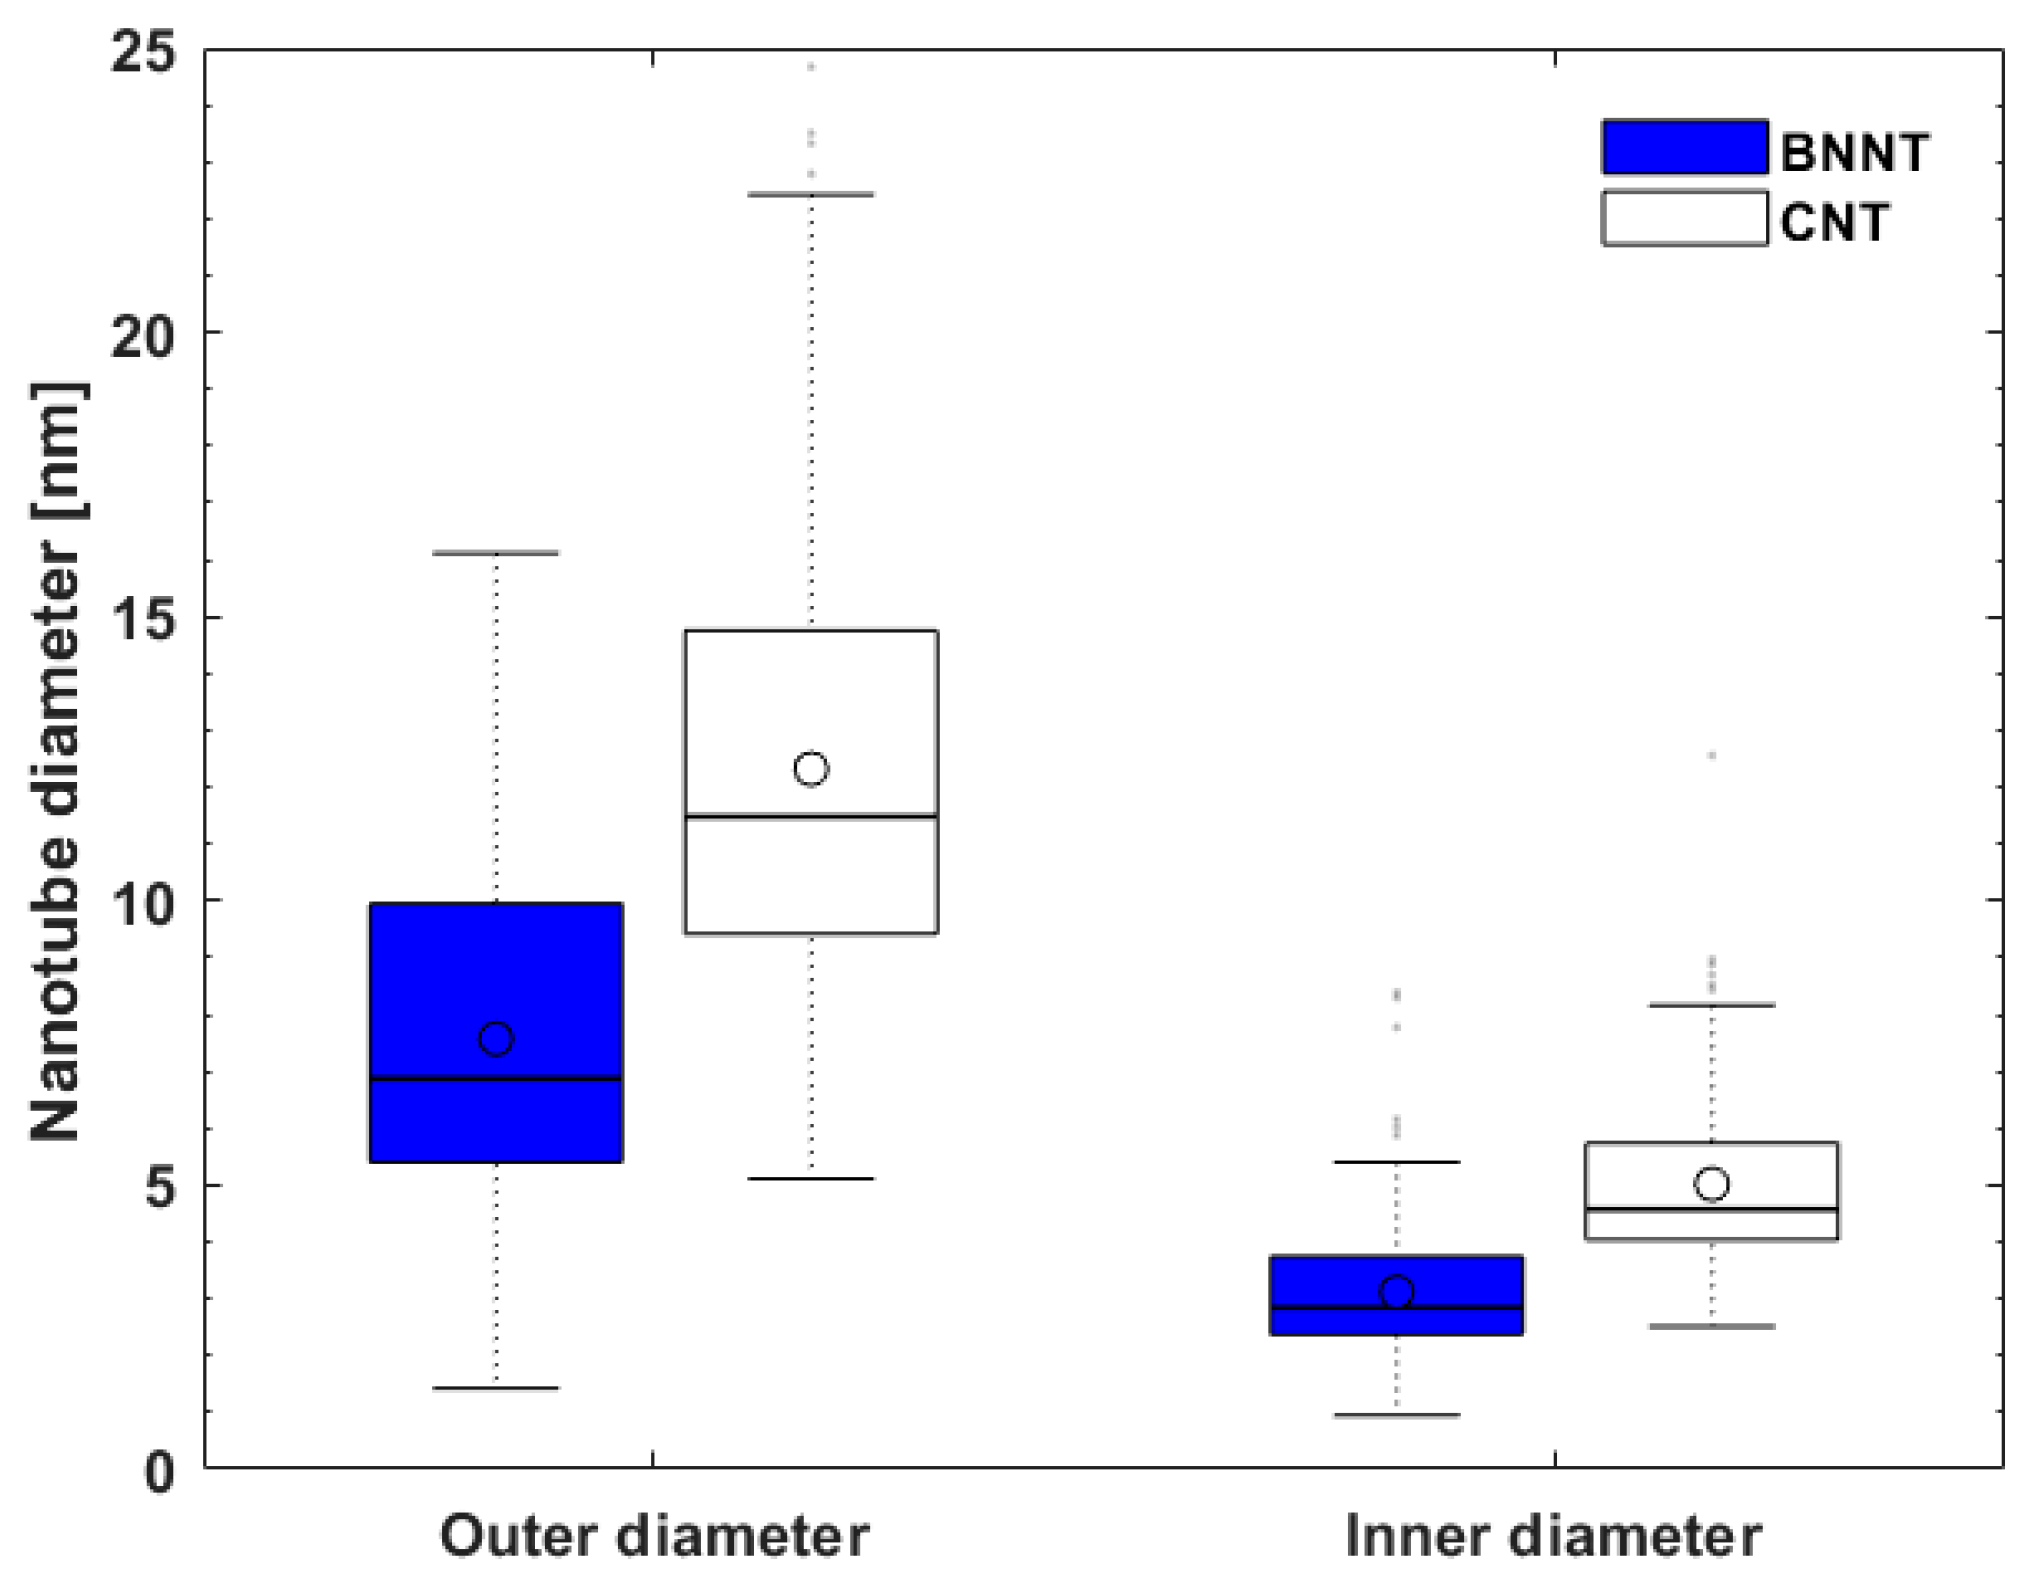
3.2. Microstructure and Surface Chemistry
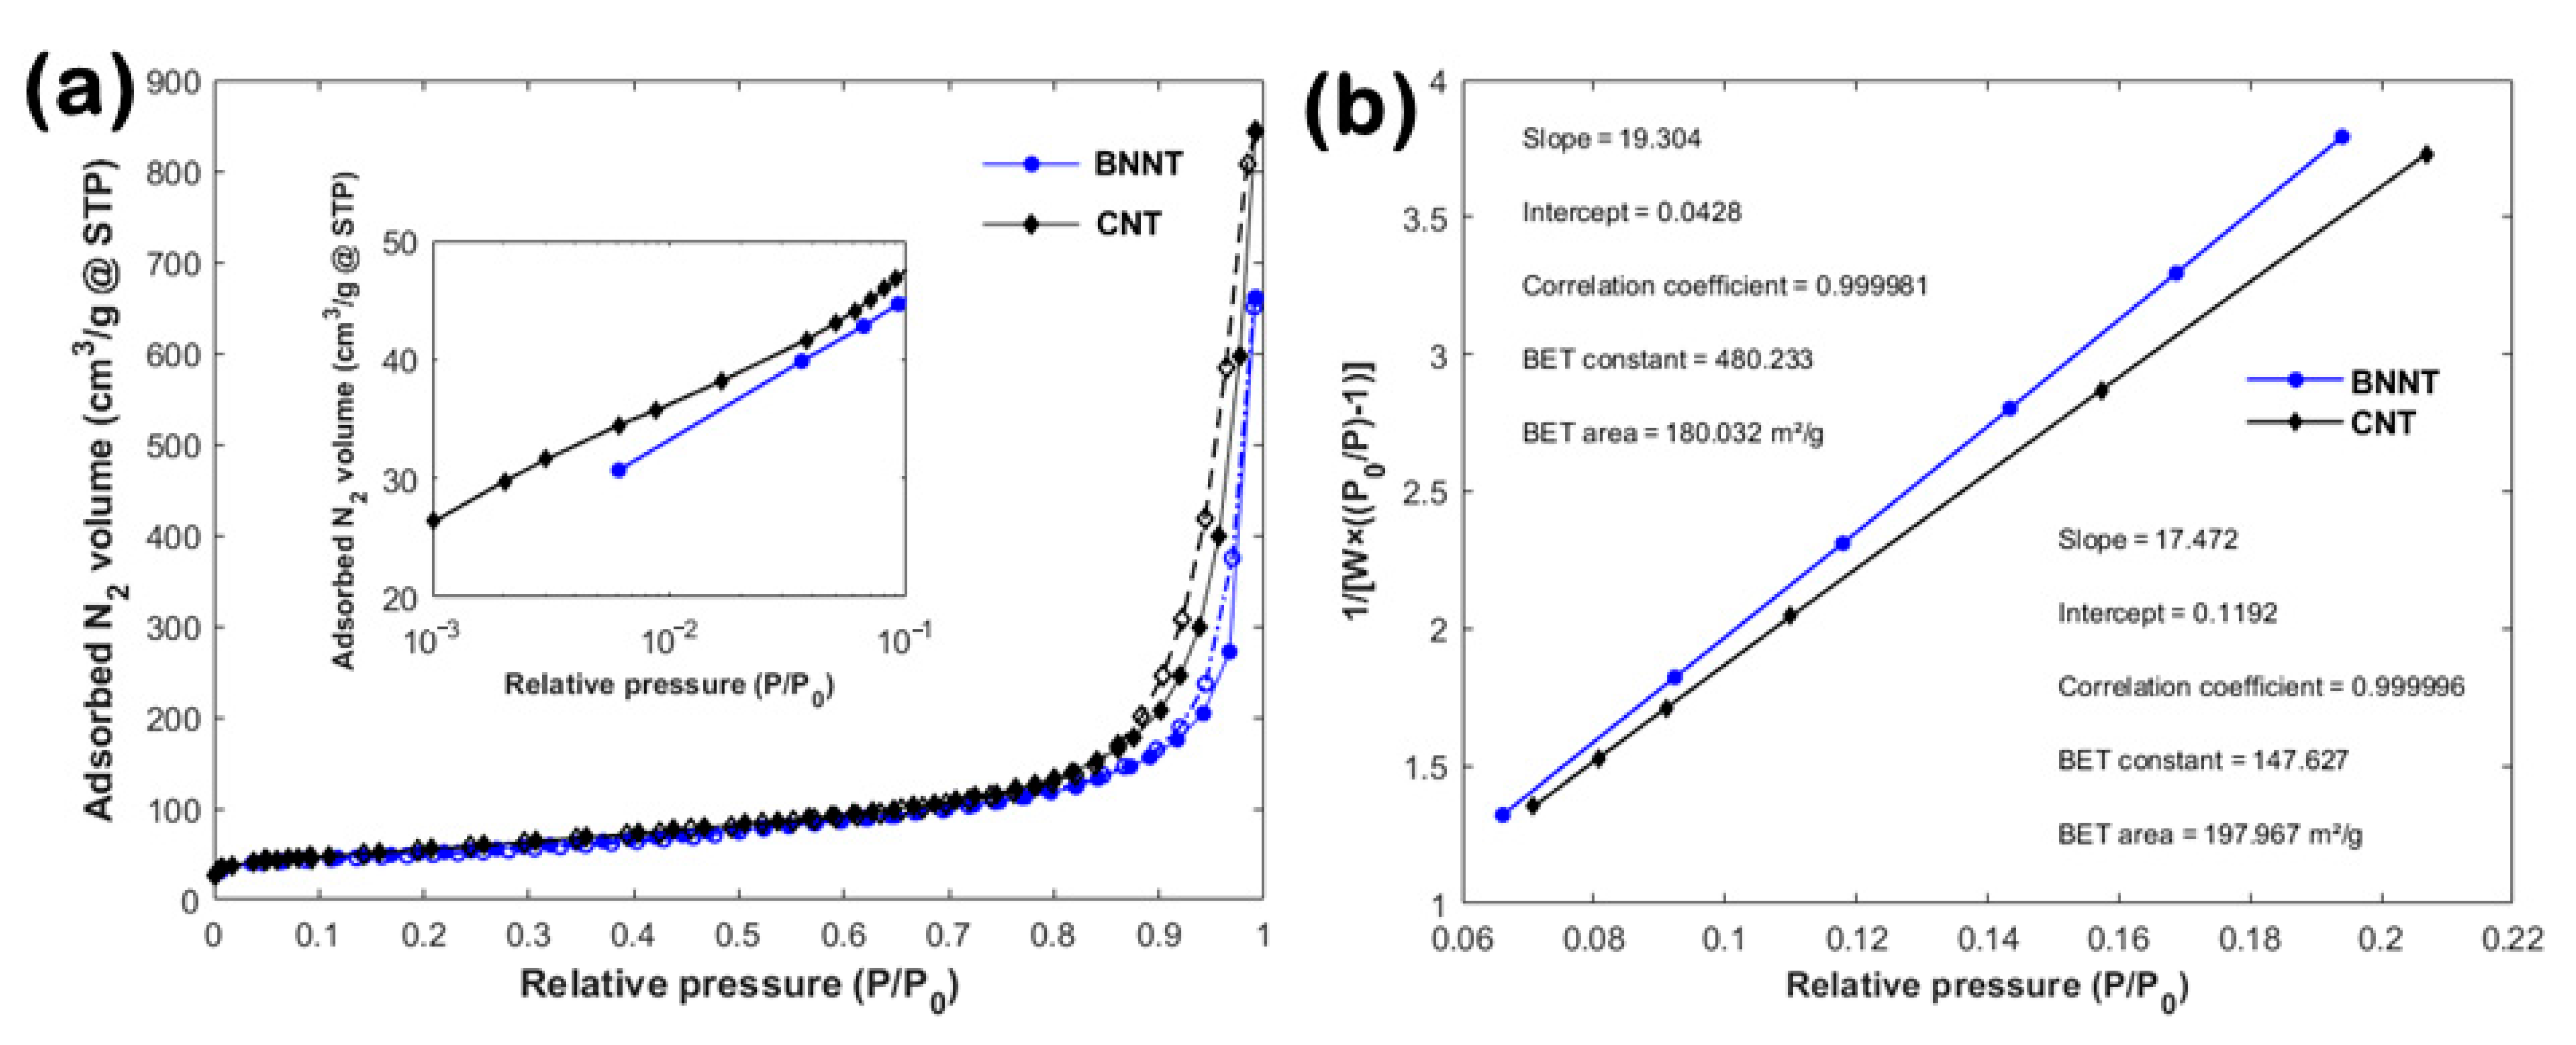
3.3. Porosity and Surface Area
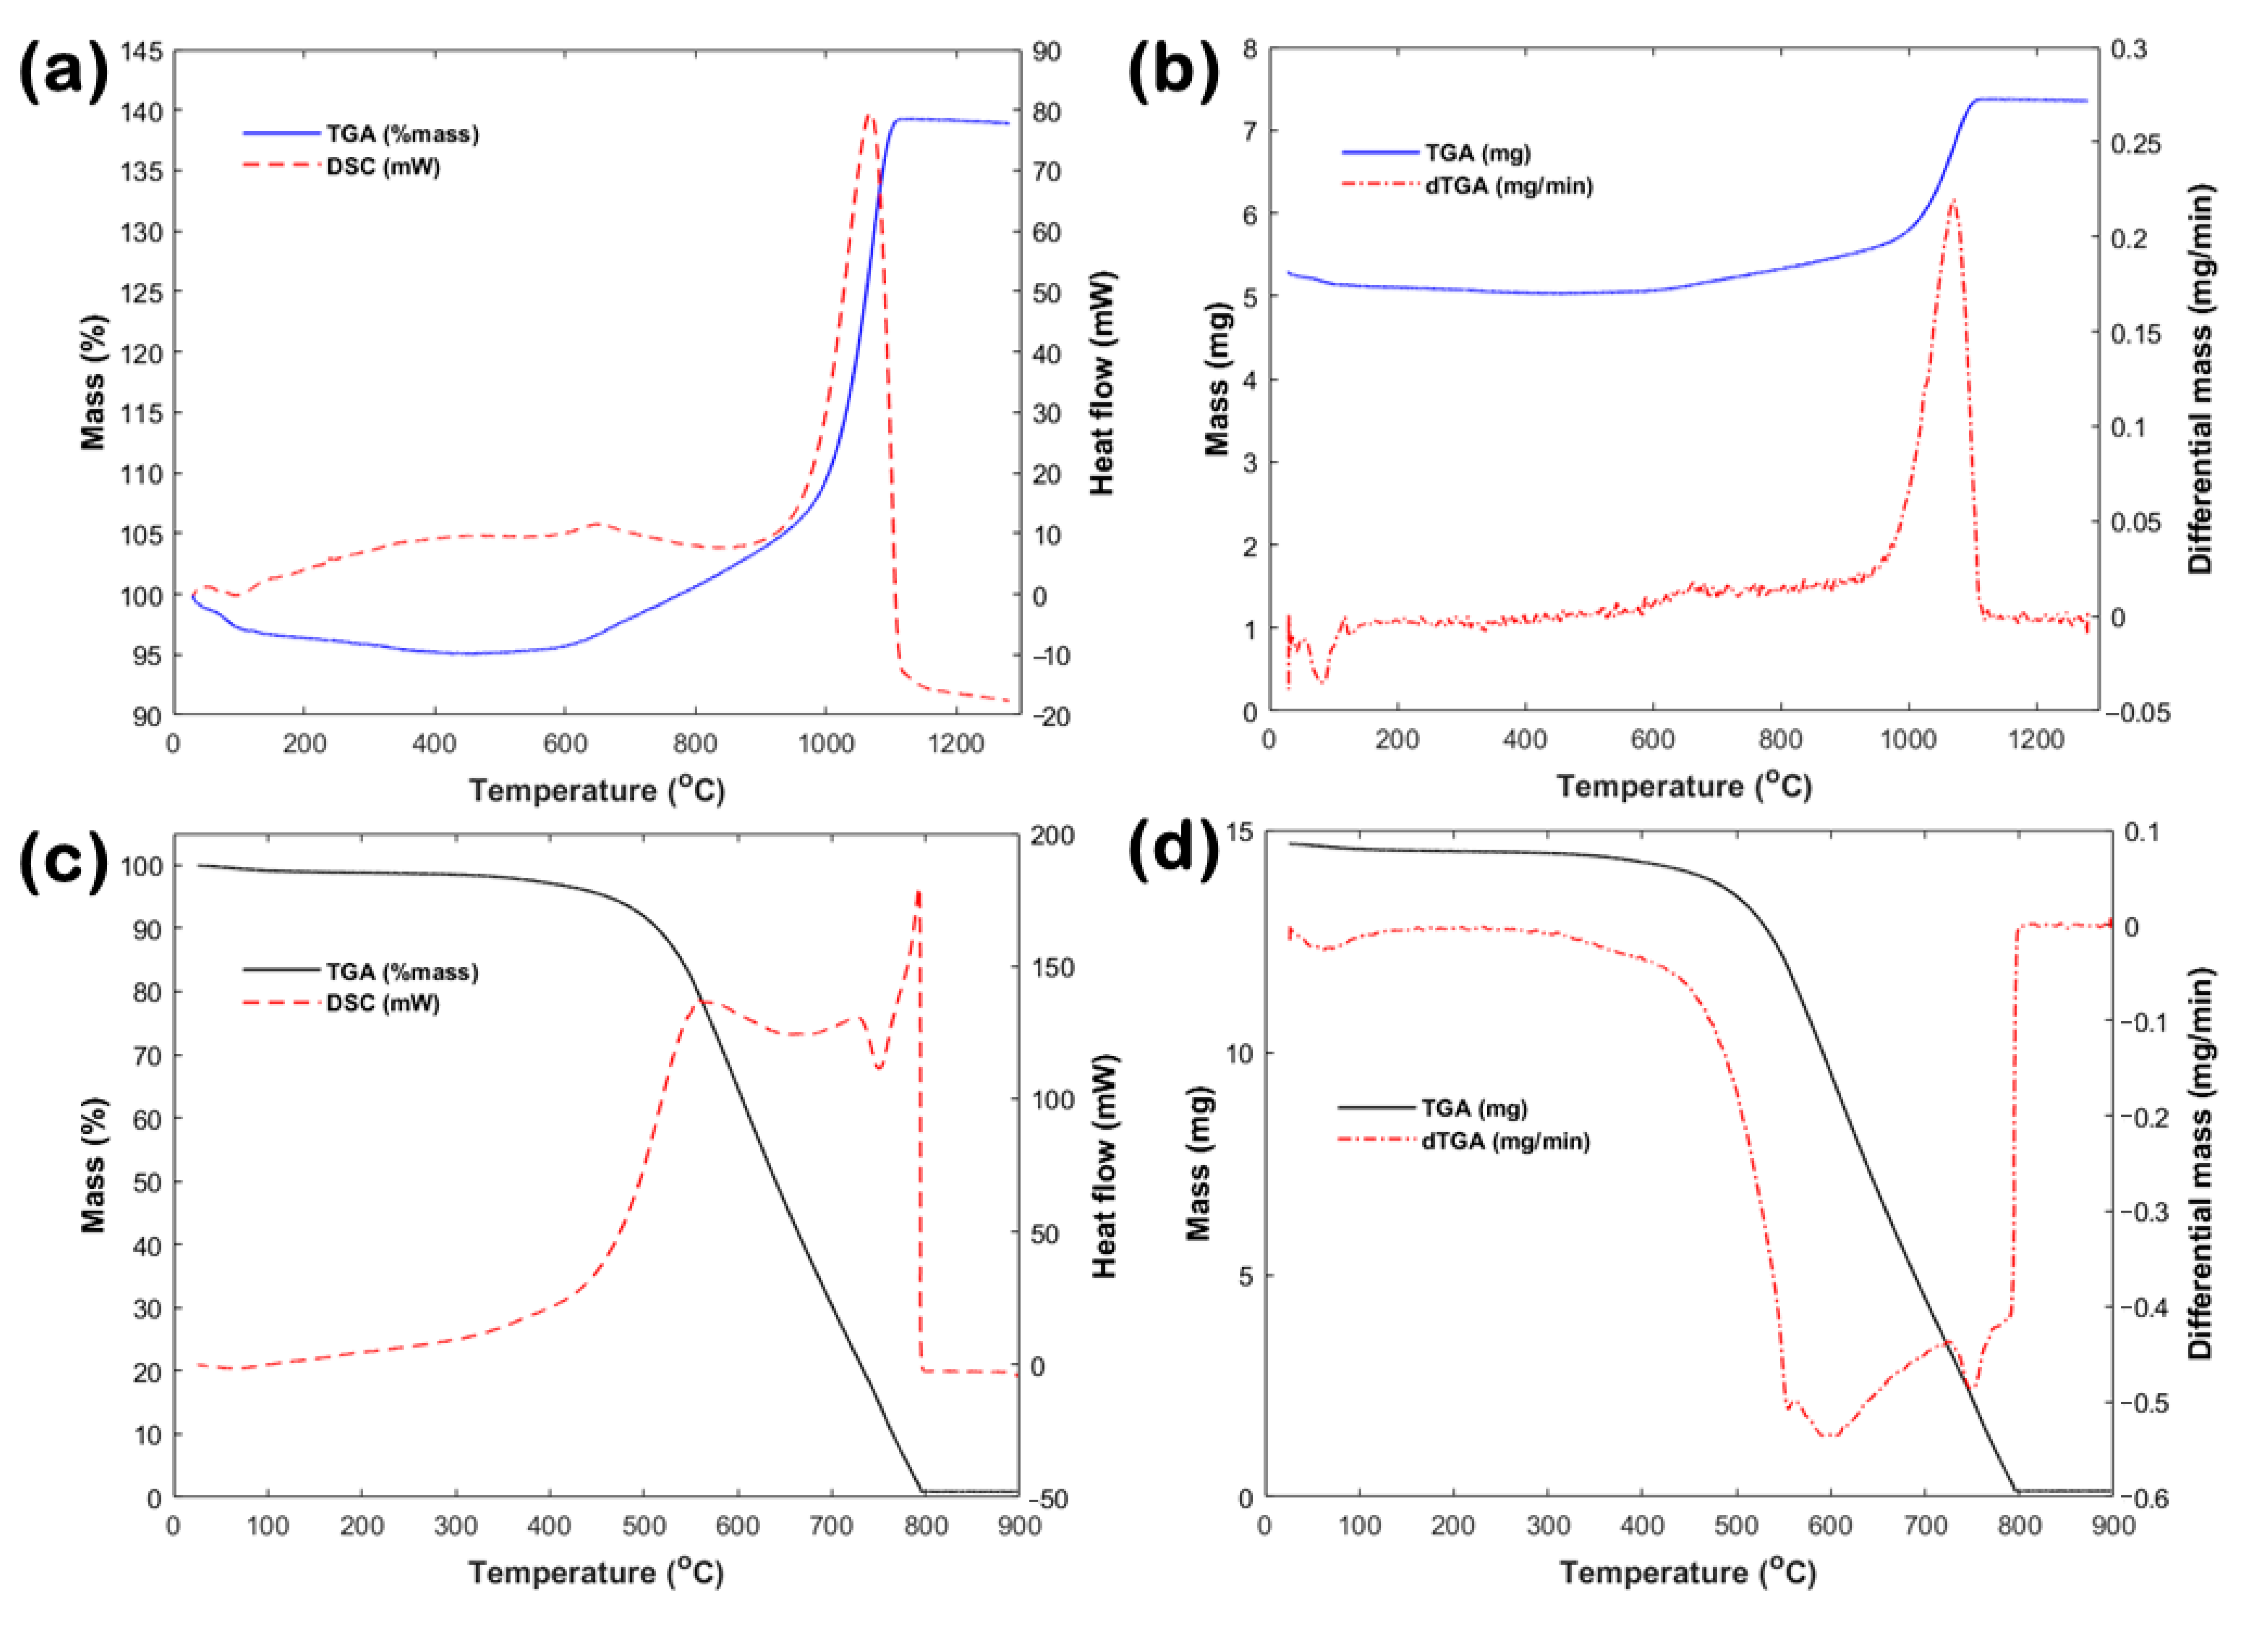
3.4. Thermal Stability and Oxidation Behavior
4. Conclusions
Supplementary Materials
Author Contributions
Funding
Conflicts of Interest
References
- Kolahalam, L.A.; Kasi Viswanath, I.V.; Diwakar, B.S.; Govindh, B.; Reddy, V.; Murthy, Y.L.N. Review on nanomaterials: Synthesis and applications. Mater. Today Proc. 2019, 18, 2182–2190. [Google Scholar] [CrossRef]
- Prakash Sharma, V.; Sharma, U.; Chattopadhyay, M.; Shukla, V.N. Advance Applications of Nanomaterials: A Review. Mater. Today Proc. 2018, 5, 6376–6380. [Google Scholar] [CrossRef]
- Iijima, S. Helical microtubules of graphitic carbon. Nature 1991, 354, 56–58. [Google Scholar] [CrossRef]
- Chopra, N.G.; Luyken, R.J.; Cherrey, K.; Crespi, V.H.; Cohen, M.L.; Louie, S.G.; Zettl, A. Boron nitride nanotubes. Science 1995, 269, 966–967. [Google Scholar] [CrossRef]
- Cohen, M.L.; Zettl, A. The physics of boron nitride nanotubes. Phys. Today 2010, 63, 34–38. [Google Scholar] [CrossRef]
- Kim, J.H.; Pham, T.V.; Hwang, J.H.; Kim, C.S.; Kim, M.J. Boron nitride nanotubes: Synthesis and applications. Nano Converg. 2018, 5, 17. [Google Scholar] [CrossRef]
- Wong, B.S.; Yoong, S.L.; Jagusiak, A.; Panczyk, T.; Ho, H.K.; Ang, W.H.; Pastorin, G. Carbon nanotubes for delivery of small molecule drugs. Adv. Drug Deliv. Rev. 2013, 65, 1964–2015. [Google Scholar] [CrossRef]
- Ciofani, G. Potential applications of boron nitride nanotubes as drug delivery systems. Expert Opin. Drug Deliv. 2010, 7, 889–893. [Google Scholar] [CrossRef]
- Jakubinek, M.B.; Ashrafi, B.; Martinez-Rubi, Y.; Guan, J.; Rahmat, M.; Kim, K.S.; Dénommée, S.; Kingston, C.T.; Simard, B. Boron nitride nanotube composites and applications. In Nanotube Superfiber Materials: Science, Manufacturing, Commercialization; Elsevier: Amsterdam, The Netherlands, 2019; pp. 91–111. ISBN 9780128126677. [Google Scholar]
- Tiano, A.L.; Park, C.; Lee, J.W.; Luong, H.H.; Gibbons, L.J.; Chu, S.-H.; Applin, S.; Gnoffo, P.; Lowther, S.; Kim, H.J.; et al. Boron nitride nanotube: Synthesis and applications. In Nanosensors, Biosensors, and Info-Tech Sensors and Systems 2014; Varadan, V.K., Ed.; SPIE: Bellingham, WA, USA, 2014; Volume 9060, p. 906006. [Google Scholar]
- Hou, X.; Yu, Z.; Li, Y.; Chou, K.C. Preparation and properties of hexagonal boron nitride fibers used as high temperature membrane filter. Mater. Res. Bull. 2014, 49, 39–43. [Google Scholar] [CrossRef]
- Wang, L.; Hang, R.; Xu, Y.; Guo, C.; Qian, Y. From ultrathin nanosheets, triangular plates to nanocrystals with exposed (102) facets, a morphology and phase transformation of sp2 hybrid BN nanomaterials. RSC Adv. 2014, 4, 14233–14240. [Google Scholar] [CrossRef]
- Kostoglou, N.; Lukovic, J.; Babic, B.; Matovic, B.; Photiou, D.; Constantinides, G.; Polychronopoulou, K.; Ryzhkov, V.; Grossmann, B.; Mitterer, C.; et al. Few-step synthesis, thermal purification and structural characterization of porous boron nitride nanoplatelets. Mater. Des. 2016. [Google Scholar] [CrossRef]
- Kostoglou, N.; Polychronopoulou, K.; Rebholz, C. Thermal and chemical stability of hexagonal boron nitride (h-BN) nanoplatelets. Vacuum 2015, 112, 42–45. [Google Scholar] [CrossRef]
- Falconer, K.J. Fractal Geometry: Mathematical Foundations and Applications; Wiley: Hoboken, NJ, USA, 2003; ISBN 0470871350. [Google Scholar]
- Hod, O. Graphite and hexagonal boron-nitride have the same interlayer distance. Why? J. Chem. Theory Comput. 2012, 8, 1360–1369. [Google Scholar] [CrossRef] [PubMed]
- Amin, M.S.; Atwater, B.; Pike, R.D.; Williamson, K.E.; Kranbuehl, D.E.; Schniepp, H.C. High-purity boron nitride nanotubes via high-yield hydrocarbon solvent processing. Chem. Mater. 2019, 31, 8351–8357. [Google Scholar] [CrossRef]
- Hammadi, A.H.; Jasim, A.M.; Abdulrazzak, F.H.; Al-Sammarraie, A.M.A.; Cherifi, Y.; Boukherroub, R.; Hussein, F.H. Purification for Carbon Nanotubes Synthesized by Flame Fragments Deposition via Hydrogen Peroxide and Acetone. Materials 2020, 13, 2342. [Google Scholar] [CrossRef]
- Harrison, H.; Lamb, J.T.; Nowlin, K.S.; Guenthner, A.J.; Ghiassi, K.B.; Kelkar, A.D.; Alston, J.R. Quantification of hexagonal boron nitride impurities in boron nitride nanotubes: Via FTIR spectroscopy. Nanoscale Adv. 2019, 1, 1693–1701. [Google Scholar] [CrossRef]
- Lehman, J.H.; Terrones, M.; Mansfield, E.; Hurst, K.E.; Meunier, V. Evaluating the characteristics of multiwall carbon nanotubes. Carbon N. Y. 2011, 49, 2581–2602. [Google Scholar] [CrossRef]
- Thommes, M.; Kaneko, K.; Neimark, A.V.; Olivier, J.P.; Rodriguez-Reinoso, F.; Rouquerol, J.; Sing, K.S.W. Physisorption of gases, with special reference to the evaluation of surface area and pore size distribution (IUPAC Technical Report). Pure Appl. Chem. 2015, 87, 1051–1069. [Google Scholar] [CrossRef]
- Kostoglou, N.; Ryzhkov, V.; Walters, I.; Doumanidis, C.; Rebholz, C.; Mitterer, C. Arc-produced short-length multi-walled carbon nanotubes as “millstones” for the preparation of graphene-like nanoplatelets. Carbon N. Y. 2019, 146, 779–784. [Google Scholar] [CrossRef]
- Chen, Y.; Zou, J.; Campbell, S.J.; Caer, G. Le Boron nitride nanotubes: Pronounced resistance to oxidation. Appl. Phys. Lett. 2004, 84, 2430–2432. [Google Scholar] [CrossRef]
- Lavrenko, V.A.; Alexeev, A.F. High-temperature oxidation of boron nitride. Ceram. Int. 1986, 12, 25–31. [Google Scholar] [CrossRef]
- Nautiyal, P.; Loganathan, A.; Agrawal, R.; Boesl, B.; Wang, C.; Agarwal, A. Oxidative Unzipping and Transformation of High Aspect Ratio Boron Nitride Nanotubes into “white Graphene Oxide” Platelets. Sci. Rep. 2016, 6, 1–8. [Google Scholar] [CrossRef] [PubMed]
- Likodimos, V.; Steriotis, T.A.; Papageorgiou, S.K.; Romanos, G.E.; Marques, R.R.N.; Rocha, R.P.; Faria, J.L.; Pereira, M.F.R.; Figueiredo, J.L.; Silva, A.M.T.; et al. Controlled surface functionalization of multiwall carbon nanotubes by HNO3 hydrothermal oxidation. Carbon N. Y. 2014, 69, 311–326. [Google Scholar] [CrossRef]


| Material | SEM Image | Capacity | Information | Correlation | Probability |
|---|---|---|---|---|---|
| BNNTs | Figure 2a | 2.51 | 2.40 | 2.17 | 2.36 |
| BNNTs | Figure 2b | 2.53 | 2.40 | 2.16 | 2.30 |
| BNNTs | Figure 2c | 2.39 | 2.25 | 2.12 | 2.30 |
| CNTs | Figure 2d | 2.55 | 2.43 | 2.19 | 2.46 |
| CNTs | Figure 2e | 2.49 | 2.38 | 2.19 | 2.39 |
| CNTs | Figure 2f | 2.30 | 2.18 | 2.09 | 2.26 |
Publisher’s Note: MDPI stays neutral with regard to jurisdictional claims in published maps and institutional affiliations. |
© 2020 by the authors. Licensee MDPI, Basel, Switzerland. This article is an open access article distributed under the terms and conditions of the Creative Commons Attribution (CC BY) license (http://creativecommons.org/licenses/by/4.0/).
Share and Cite
Kostoglou, N.; Tampaxis, C.; Charalambopoulou, G.; Constantinides, G.; Ryzhkov, V.; Doumanidis, C.; Matovic, B.; Mitterer, C.; Rebholz, C. Boron Nitride Nanotubes Versus Carbon Nanotubes: A Thermal Stability and Oxidation Behavior Study. Nanomaterials 2020, 10, 2435. https://doi.org/10.3390/nano10122435
Kostoglou N, Tampaxis C, Charalambopoulou G, Constantinides G, Ryzhkov V, Doumanidis C, Matovic B, Mitterer C, Rebholz C. Boron Nitride Nanotubes Versus Carbon Nanotubes: A Thermal Stability and Oxidation Behavior Study. Nanomaterials. 2020; 10(12):2435. https://doi.org/10.3390/nano10122435
Chicago/Turabian StyleKostoglou, Nikolaos, Christos Tampaxis, Georgia Charalambopoulou, Georgios Constantinides, Vladislav Ryzhkov, Charalabos Doumanidis, Branko Matovic, Christian Mitterer, and Claus Rebholz. 2020. "Boron Nitride Nanotubes Versus Carbon Nanotubes: A Thermal Stability and Oxidation Behavior Study" Nanomaterials 10, no. 12: 2435. https://doi.org/10.3390/nano10122435
APA StyleKostoglou, N., Tampaxis, C., Charalambopoulou, G., Constantinides, G., Ryzhkov, V., Doumanidis, C., Matovic, B., Mitterer, C., & Rebholz, C. (2020). Boron Nitride Nanotubes Versus Carbon Nanotubes: A Thermal Stability and Oxidation Behavior Study. Nanomaterials, 10(12), 2435. https://doi.org/10.3390/nano10122435