Abstract
Pt-SnO2@C-ordered flake array was developed on carbon paper (CP) as an integrated cathode for proton exchange membrane fuel cell through a facile hydrothermal method. In the integrated cathode, Pt nanoparticles were deposited uniformly with a small particle size on the SnO2@C/CP support. Electrochemical impedance spectroscopy analysis revealed lower impedance in a potential range of 0.3–0.5 V for the ordered electrode structure. An electrochemically active surface area and oxygen reduction peak potential determined by cyclic voltammetry measurement verified the synergistic effect between Pt and SnO2, which enhanced the electrochemical catalytic activity. Besides, compared with the commercial carbon-supported Pt catalyst, the as-developed SnO2@C/CP-supported Pt catalyst demonstrated better stability, most likely due to the positive interaction between SnO2 and the carbon coating layer.
1. Introduction
The depletion of fossil-fuel based sources of energy and the rising global concerns with respect to the emission of greenhouse gases are among the key drivers in the current search for alternative and clean sources of energy [1,2,3,4]. Hydrogen-based technologies and proton exchange membrane fuel cells (PEMFCs) have received much attention for both stationary and automotive applications [5,6,7,8]. However, a number of technical issues, such as the use of expensive Pt catalyst, kinetic loss of the cathode electrode and the poor durability with respect to long term operations have hindered the large-scale deployment of PEMFCs [9,10,11]. Among many alternative approaches for the Pt catalysts, alloying with less expensive metals to reduce the Pt content and also increase electrocatalytic activity, and the use of non-precious metal-based catalysts have been widely explored [12,13,14]. However, Pt and Pt-based catalysts still remain the state-of-the-art catalysts available for PEMFCs [15,16]. As well as the activity of catalyst materials, stability/durability issues of materials used in PEMFCs are also critical and need to be improved. The stability challenges include corrosion of carbon-based catalyst support under exposures to high electrochemical potentials [17], which leads to the detachment and loss of the supported Pt-based nanoparticles from the support, and accordingly the decay in the electrocatalytic performance [18].
Recently, some approaches have been reported for the improvement in the stability of catalyst support, such as the replacement of a carbon microporous layer with graphite oxide and the use of alloy catalyst layers without carbon support on the gas diffusion layer [19,20]. In one approach, the Pt catalyst was directly supported on the carbon fibers to form an integrated cathode [21]. However, carbon fibers provide a low specific surface area, resulting in a low electrochemical active area of the supported Pt electrocatalyst. In order to increase the specific surface area of the support and maintain high support stability, many materials, including metal oxides, carbides and high molecular polymers, have been investigated [22,23,24]. A suitable support not only enhances electrochemical stability, but also contributes to the improvement of the catalytic performance of the supported catalyst. For instance, Liu et al. [25] prepared WO3-supported Pt catalysts with high electrochemical activity and stability. In addition to the support material, unhindered transmission channels are desirable and decisive for the reduced mass transport loss, improved three-phase reaction zone and enhanced catalytic activity [26,27,28,29,30,31]. A good example of non-carbon-based ordered support materials is the organic self-assembled crystalline whiskers array structure from 3M Company (St. Paul, MN, United States), which grows by a screw-dislocation mechanism when a vacuum deposited organic pigment (CAS #PR149) film is annealed at 250–270 °C. These support structures replace the traditional carbon-based catalyst support, and have shown excellent stability even after exposure to high electrochemical potentials [32].
Among metal oxide-based materials, SnO2 with stable electrochemical performance in sulfuric acid system and oxygen-containing conditions was reported to be a good candidate for catalyst support material [33]. In addition, Cognard et al. [34] and Suffner et al. [35] prepared Sb-doped SnO2-supported Pt catalysts, which demonstrated better stability than commercial Pt/C in PEMFC. Zhang et al. [36] used SnO2 to modify Pt/C, and showed that the interaction of carbon and SnO2 also led to improvements in the stability and activity of the catalyst. Growth of SnO2 nanosheet arrays on carbon fiber for the enhancement of polysulfides redox in lithium-sulfur batteries has also been demonstrated by Wang et al. [37].
In this work, we report a novel composite catalyst support, SnO2@C/CP, which was prepared by depositing SnO2@C with an ordered flake array (OFA) on carbon paper (CP) through a facile solvothermal method. The SnO2 array structure provides a high specific surface area and stability, as well as adequate pathways for the transport of reactants and products, while the carbon coating layer reduces the contact resistance and provides ample sites for the homogeneous growth of the Pt catalyst. The impact of the ordered nature of the support structure and carbon coating on the performance and stability were analyzed in depth. The structural changes of the Pt-SnO2@C/CP and the baseline Pt/C/GDL (gas diffusion layer) and Pt-SnO2/CP cathodes after the accelerated durability testing (ADT) experiments were also examined by scanning electron microscopy (SEM) observations. Due to the unique nanostructure, the as-developed electrocatalyst not only demonstrated enhanced electrocatalytic activity, but also improved cathode durability compared with the commercial carbon-supported Pt catalyst. It was found that the synergistic effect between Pt and SnO2 was responsible for the enhanced electrocatalytic activity, while the interaction between SnO2 and the carbon layer improved the stability.
2. Experimental Section
2.1. Materials
Hexachloroplatinic acid (H2PtCl6•6H2O, 99.95%), formic acid (HCOOH, 88%) and other chemicals were purchased from Sinopharm Chemical Reagent Beijing Co., Ltd. (Beijing, China). Commercial 40% Pt/C (Johnson Matthey Co., London, UK), CP (Toray, TGP-H-60, Tokyo, Japan) and all chemicals were used as received without any further purification.
Figure 1 presents the schematic illustration of synthesis procedures of Pt-SnO2/CP and Pt-SnO2@C/CP. First, through a hydrothermal reaction, SnO2 grows on the surface of carbon fibre to form a flake-like SnO2. Next, a carbon layer is coated on the SnO2 to form a core-shell structure. Finally, Pt nanoparticles are deposited on the SnO2/CP and SnO2@C/CP supports using the same impregnation-reduction method. Details of the syntheses are described in the next section.
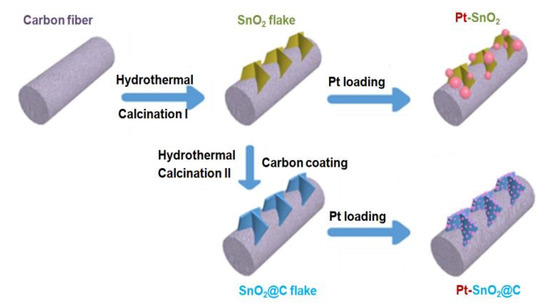
Figure 1.
Schematic illustration of the preparation of Pt-SnO2/CP and Pt-SnO2@C/CP.
2.2. Synthesis of SnO2/CP OFA
For the hydrothermal method, typically 0.064 g of SnCl4 5H2O and 0.064 g of thioacetamide were dissolved in 40 mL of isopropanol [38]. Then, two pieces of CP (5 cm2) were placed in a Teflon-lined stainless autoclave (Sh-yantu Co., Shanghai, China) with one side exposed vertically. Next, 40 mL of the prepared solution was transferred into the autoclave and sealed. The reaction was carried out at 180 °C for 24 h. After cooling down to room temperature (20 °C), the two CPs were dried and calcined at 500 °C for 2 h in air to promote the formation of SnO2. The flake array samples were denoted as SnO2/CP.
2.3. Synthesis of SnO2@C/CP OFA
To produce the carbon layer, a 4.7 g L−1 glucose stock solution was first prepared. Then, about 20 mL of this glucose solution was transferred into the Teflon-lined stainless autoclave [38]. Next, one piece of the as-prepared SnO2/CP was placed at the bottom of the reactor ((Sh-yantu Co., Shanghai, China), with the top side (covered with SnO2) exposed to the solution, and the reactor was sealed. Later, the reaction vessel was placed in an oven at 180 °C for 24 h. Subsequently, the sample was calcined at 500 °C for 2 h under a flow of argon. This flake sample was denoted as SnO2@C/CP.
2.4. Deposition of Pt on the Support
Deposition of Pt on the support was achieved via an impregnation-reduction method. About 200 μL of 0.05 M H2PtCl6 6H2O and 40 μL of 0.5 M HCOOH were dissolved in 4 mL of deionized water as the reaction solution [39,40,41]. A piece of SnO2/CP or SnO2@C/CP was fixed in a homemade reaction container, and the reaction solution was then poured into the container. The reaction was allowed to proceed at room temperature (20 °C) for 72 h. Finally, the product was washed with deionized water for several times, and dried at 50 °C overnight. The products were denoted as Pt-SnO2/CP and Pt-SnO2@C/CP, respectively. The Pt loading was 0.15 mg cm−2 for both samples.
2.5. Physical Characterizations
Scan electron microscopy (SEM) (JSM-7100F, Tokyo, Japan), transmission electron microscopy (TEM, FEI TecnaiF30, Hillsboro, OR, USA) and energy-dispersive X-ray spectroscopy (EDX) were used to detect surface morphology, microstructures and element distribution.
The crystallinity and structure phases of the materials were determined by X-ray diffraction (XRD, Rigaku RINT2400, Tokyo, Japan) and Raman (LabRAMHR Evolution, Pairs, France) analysis.
Chemical states of the samples were examined by X-ray photoelectron spectroscopy (XPS, Kratos AXIS ULTRADLD, London, UK).
The contact angle was tested by a contact angle meter (Dataphysics OCA20, Stuttgart, Germany, water drop, 40 μL).
2.6. Electrochemical Characterization
Electrochemical measurements were carried out in a three-electrode electrochemical cell using a computer-controlled potentiostat (VMP2, Bio-logic Science Instruments, Paris, France) at room temperature (20 °C). The as-prepared Pt-SnO2/CP or Pt-SnO2@C/CP was used as the working electrode. A saturated calomel electrode (SCE) and a Pt plate (Purity, Shanghai Yue Magnetic Electronic Technology Co., Ltd., Shanghai, China) were used as the reference and counter electrodes, respectively. In this work, unless otherwise stated, all the potentials are expressed with respect to the reversible hydrogen electrode (RHE). The electrochemical performance tests were consistent with the single cell cathode test conditions [42,43].
Electrochemical impedance spectroscopy (EIS) was performed in the frequency range of 0.01–100 kHz in nitrogen and oxygen-saturated 0.5 M H2SO4 solution at an open circuit potential of 0.5, 0.4 and 0.3 V vs RHE. Cyclic voltammetry (CV) curves were obtained in a potential range of 0.05–1.2 V vs RHE at a scan rate of 50 mV s−1 in nitrogen-saturated 0.5 M H2SO4 solution. The electrochemical surface area (ECSA) value was determined from the integration of the hydrogen (desorption) region integrated from 0.05 to 0.4 V vs RHE. For the ADT testing, a total of 3000 cycles were performed between 0.6 to 1.2 V at a scan rate of 100 mV s−1 in nitrogen-saturated 0.5 M H2SO4 solution. The ECSA (in m2 gpt−1) was calculated for every 500 cycles using the following formula [44]
where QIntergated area (C) and massPt (mg) are the integrated charge and mass loading of Pt, respectively, and 2.1 (C m−2) corresponds to a monolayer hydrogen adsorption charge on polycrystalline Pt [11]. CV measurements were also performed in an oxygen-saturated 0.5 M H2SO4 solution to determine the peak potential for the oxygen reduction over the various electrocatalysts. In this study, commercial 40 wt.% Pt/C (Johnson Matthey Co., London, UK) was sprayed on a GDL as a baseline for comparison purpose. The loading of Pt was also 0.15 mgpt cm−2.
3. Results and Discussion
Figure 2 shows the morphology of CP and the prepared SnO2@C/CP OFA. It can be observed that SnO2@C flake arrays wrap around the surface of carbon fibres of CP. The overall shape of SnO2 did not change after the carbon coating, as shown in Figure S1, although high magnification SEM imaging (Figure 2c) shows that the flake thickness clearly increases. Compared with the support-free cathode, the flake support greatly enhances the surface area of the CP, thus improving the dispersion of the Pt catalyst. Small spherical particles (white circles in Figure 2c) are carbon spheres. The TEM image of SnO2@C (Figure 2d) shows that the SnO2 flakes are composed of particles and the carbon layer (with no lattice fringes) is coated on the surface of SnO2. The lattice fringes of SnO2 could be clearly observed in the inset of Figure 2d. The fringe spacing is 0.34 nm, consistent with the (110) plane of SnO2. The Bragg angle of (110) planes is 26.61°, although the CP support has a sharp diffraction peak at the same diffraction angle (Figure S2), thus making it difficult to distinguish the dominant diffraction peak of SnO2.
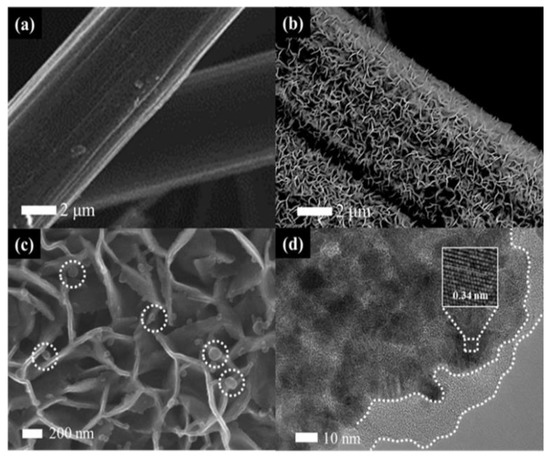
Figure 2.
Scanning electron microscopy (SEM) images of: (a) carbon paper (CP); (b,c) SnO2@C/CP; and (d) transmission electron microscopy (TEM) image of SnO2@C/CP. The inset in (d) shows the high resolution transmission electron microscope (HRTEM) image of SnO2@C/CP. The circles in Figure 2c show the carbon spheres on SnO2@C/CP.
Figure 3 shows the XRD patterns of CP, SnO2/CP and SnO2@C/CP for the scattering angles of 30° ≤ 2θ ≤ 80°. The peak at the scattering angle of 43.45° corresponds to the characteristic diffraction peak of the CP support. In addition, the peak located at 54° corresponds to the crystallitic graphite diffraction peak of the (004) plane on carbon paper [45], which was also reported by other researchers when CP was used as a support for active material [46]. Figure 3 also shows the main five peaks of SnO2, which can be indexed to SnO2 using the standard card (no. 41–1445). These peaks are assigned to a tetragonal rutile-structured SnO2, and indicate the formation of pure phase of SnO2. It is also clear that after the carbon coating, the characteristic peaks did not change.
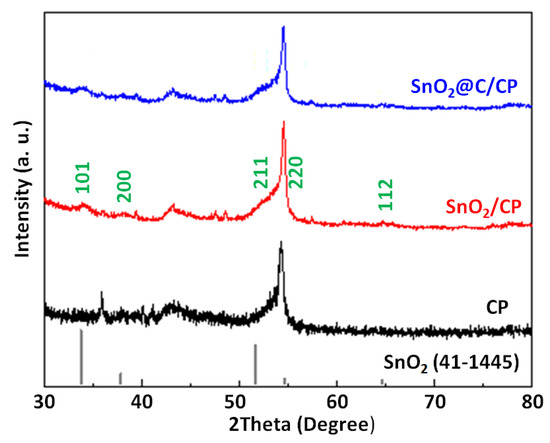
Figure 3.
X-ray diffraction (XRD) patterns of CP, SnO2/CP and SnO2@C/CP.
Figure 4a shows the Raman spectra of SnO2/CP and SnO2@C/CP. According to the literature [47], the Raman peaks located at 470 and 630 cm−1 are the characteristic peaks of SnO2, although these two peaks are not clearly observed. This is because the SnO2 array only exists on the surface of porous CP, and the thin SnO2 layer coated on the CP significantly reduces the sensitivity of the measurements. In addition, there are two sharp peaks located at 1353 and 1586 cm−1, which can be attributed to the D and G bands of the carbon, respectively. The relative intensity of the D and G bands (i.e., the areal peak intensity ratios of D band to G band) was calculated by the deconvolution of the spectral peaks using the Fityk software. The relative intensity of D and G bands is related to the amorphous carbon and defects. The relative intensity of D and G bands are increased from 0.53 to 0.64 after the carbon coating. The results imply that the carbon was coated on the SnO2 and formed a core-shell structure, which is consistent with the TEM result.
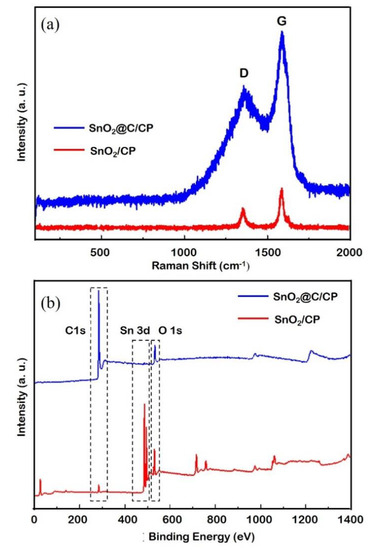
Figure 4.
(a) Ramen spectra; and (b) X-ray photoelectron spectroscopy (XPS) spectra of SnO2/CP.
Figure 4b shows the XPS spectra of SnO2/CP and SnO2@C/CP flake arrays. A pair of peaks at binding energies of 486.3 and 495.3 eV, corresponding to the characteristic peaks of Sn4+, can be observed. The peaks at 531.1 and 284.85 eV correspond to the characteristic peak of O 1s and C 1s from SnO2, respectively. In the SnO2@C/CP spectrum, the intensity of Sn 3d and O 1s peaks decreases and that of C 1s increases, indicating that the carbon content in SnO2@C/CP increases and covers the surface of SnO2. Since the characteristic peak of Sn 3d can also be detected, the thickness of the carbon coating layer should be less than a few nanometers.
The SEM images of Pt-SnO2/CP and Pt-SnO2@C/CP are presented in Figure S3 and Figure 5a, respectively. It is clear that the deposited Pt nanoparticles exhibit different morphologies/sizes on the different supports. For the Pt-SnO2/CP sample, the spherical-shaped Pt grains of different particle sizes are embedded or mixed between the surfaces of the SnO2 flakes. This may be due to the fact that the surface layer of SnO2 lacks sufficient active sites for the even growth of Pt, thus leading to an uneven growth of Pt grains. Interestingly, on the surface of SnO2@C, there are almost no micron-sized Pt spheres, and the overall structure of the OFA does not change significantly after the Pt deposition. The Pt catalyst may cover the surface of the SnO2@C array as an aggregated Pt layer. TEM imaging (Figure 5b) shows that the overall morphology of Pt-SnO2@C is consistent with the SEM observation, and Pt is dispersed on the surface of SnO2@C as nanoparticles. The lattice fringes of Pt and SnO2 can be observed from the HRTEM image shown in Figure 5b (inset). The lattice fringe spacing of Pt is 0.22 nm, which corresponds to the Pt diffraction peak of the (111) plane in the XRD standard card. The EDS spectra (Figure S4) show that the SnO2/CP sample contained Sn, O and C, while significant Pt peaks were observed for the two Pt-based samples. It is thus clear that the non-uniform microspheres and uniform nanoparticles observed from the SEM images (i.e., Figure S3 and Figure 5a) belong to the Pt catalyst. The XRD patterns of SnO2- and SnO2@C-supported Pt catalysts are shown in Figure S5. A broad characteristic peak appears at a diffraction angle of ca. 40°, which corresponds to the diffraction peak of the Pt nanoparticles. For a more detailed analysis, partially magnified XRD patterns are presented in Figure 6. Diffraction peaks at scattering angles of 40, 46 and 67° are indexed to Pt (111), (200) and (220) planes, respectively, and are characteristic peaks of the faced-centered cubic crystalline structure of metallic Pt (no. 04–0802).
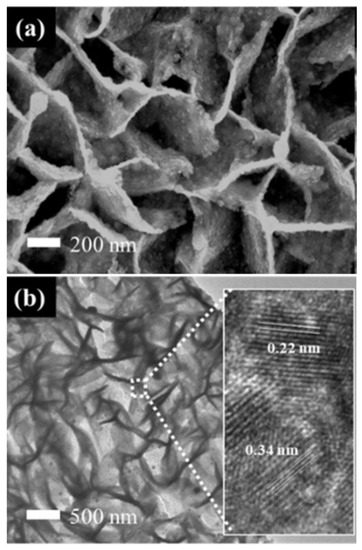
Figure 5.
(a) SEM; and (b) TEM images of the Pt-SnO2@C/CP.
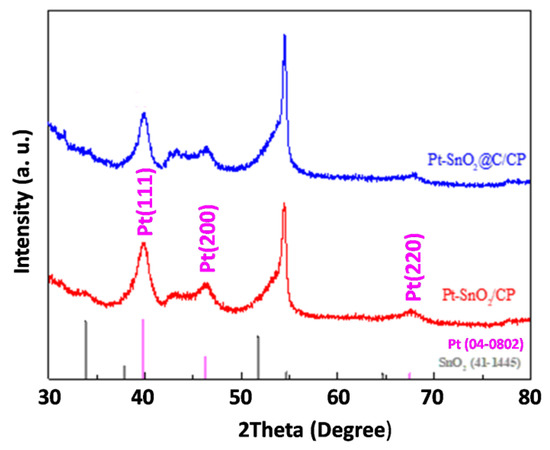
Figure 6.
XRD patterns of Pt-SnO2/CP and Pt-SnO2@C/CP.
The presence of the carbon coating changes the morphology of the Pt, and increases the conductivity of the metal oxide. Figure S6a shows the Nyquist curves of SnO2/CP and SnO2@C/CP at open circuit potential in N2-saturated 0.5 M H2SO4 solution. The measured resistance value includes the resistance of the solution, each component and the internal resistance of the sample. The semiconducting SnO2 supported on CP has a resistance of 0.75 Ω cm2, while the SnO2@C/CP shows a resistance value of 0.64 Ω cm2, which is smaller than that of SnO2/CP. This implies that the carbon coating plays an important role in improving the electrical conductivity of SnO2 [38]. In addition to adequate electrical conductivity, the fuel cell cathode must also exhibit good hydrophobicity to avoid flooding during the operation at high current densities [48]. The prepared Pt-SnO2/CP and Pt-SnO2@C/CP with no hydrophobic treatment show sufficient hydrophobicity similar to the commercial Pt/C (Figure S7). The contact angle of commercial 40 wt.% Pt/C layer is 127.3°, while the SnO2/CP arrays are hydrophilic. After the SnO2/CP substrate was coated with a carbon layer, the hydrophobicity was improved and the contact angle reached 137.8°. This hydrophobicity is even significantly higher than that of the commercial Pt/C. This is probably because that the carbon layer obtained under the synthesis condition may contain the functional groups of long-chain carbon, which endowed the SnO2@C array surface with hydrophobic properties. After depositing Pt, the contact angle of the Pt-SnO2/CP and Pt-SnO2@C/CP reached 124.3 and 134.7°, respectively. These angles are close to, or exceed that of the commercial Pt/C. For the hydrophilic SnO2 support, the existence of Pt spheres may change the hydrophilicity. Different-sized Pt spheres grown on the surface of the SnO2 tend to increase the surface roughness, and as a result, the hydrophilicity of the surface also changes. For the Pt-SnO2@C/CP sample, the support material is hydrophobic and the Pt nanoparticles are uniformly distributed on the surface. This implies that the Pt surface may exhibit hydrophobicity.
Figure 7a compares the XPS spectra of Sn 3d in different samples. The peaks located at 486.8 and 495.3 eV correspond to the binding energies of a Sn–O bond. Figure 7b shows the spectra of O1s, which correspond to that of Sn 3d in these samples. It is worth noting that there is one more peak at the binding energy of 533.4 eV for the SnO2@C/CP composite. This peak could be attributed to O1s of H2O derived from the aqueous mixture after Pt loading. Without the carbon coating, Pt spheres were directly loaded on the SnO2/CP, and the binding energy of Sn-O shifts towards lower binding energy levels. This was caused by the strong interaction between the Pt and SnO2 [49]. The positive shift of the Pt peak in Figure 7c also confirms this result. After the carbon coating, the binding energy of Sn-O shifts towards higher energy levels. According to the literature, this may be due to the formation of highly oxidized Sn-O bonds [47]. The characteristic peaks of the Pt-SnO2@C/CP have a similar binding energy at 487.3 and 495.8 eV to the SnO2@C/CP. Although the presence of the carbon layer the Pt peak still shifts towards higher binding energy, the interaction is still operative between Pt and SnO2. The synergistic effect between catalyst and metal oxide could result in higher catalytic activity [49]. Moreover, from the Pt peak fitting, there are three types of platinum: zero (0); bivalent (II); and tetravalent (IV). By observing the peak area, the Pt catalyst prepared by the room temperature reduction method has less Pt in the oxidation state, while the Pt (0) content has increased relatively, and thus the utilization rate of Pt has improved.
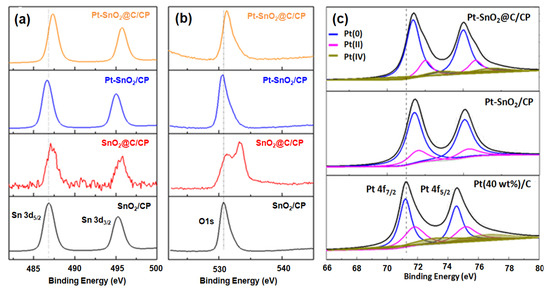
Figure 7.
XPS spectra of: (a) Sn 3d; (b) O 1s; and (c) Pt 4f in SnO2/CP, SnO2@C/CP, Pt-SnO2/CP and Pt-SnO2@C/CP.
All electrochemical data collected for the as-synthesized catalysts were compared to the commercial Pt/C/GDL cathode layers. Figure S8 displays the CV plots for the various electrocatalysts from which ECSAs before and after ADT were determined and shown in Figure 8d. The Pt-SnO2/CP and Pt-SnO2@C/CP have an ECSA of 25.1 and 47.2 m2 g−1, respectively. Pt exists in the form of nanoparticles on the SnO2@C/CP, so the ECSA is higher. This ECSA is close to the commercial Pt/C catalyst, which has an ECSA of 42.0 m2 g−1. In addition, the as-developed Pt-SnO2@C/CP electrocatalyst outperformed many supported Pt catalysts reported in literature with a larger ECSA (Table S1, Supporting Information). However, the Pt-SnO2/CP shows significantly lower ECSA as the Pt spheres range from nanometers to micrometers.
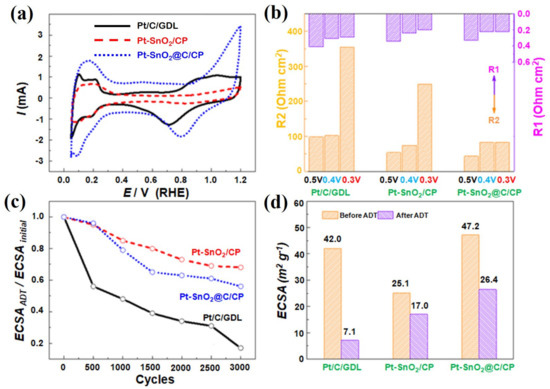
Figure 8.
(a) Cyclic voltammetry (CV) curves; (b) impedance values at different potentials in O2 saturated solution; (c) degradation curves of electrochemical surface area (ECSA); and (d) ECSA before and after accelerated durability testing (ADT) for the Pt/C/GDL, Pt-SnO2/CP and Pt-SnO2@C/CP. R1 represents charge transfer resistance, while R2 represents mass transport resistance.
Because the Pt catalyst grains were developed directly on the support, and it was difficult to strip the catalyst from the integrated electrode for oxygen reduction reaction (ORR) testing, the oxygen reduction activity was evaluated by the ORR peak potential in the CV curves, as shown in Figure 8a. For the commercial Pt/C, the peak potential of oxygen reduction is ca. 0.72 V, while it is ca. 0.83 V for the Pt-SnO2/CP, corresponding to a positive shift of ca. 110 mV. The Pt-SnO2@C/CP catalyst also shows a positive shift of ca. 80 mV in the peak potential, suggesting that the Pt SnO2@C/CP catalyst has improved the catalytic activity for the reduction of oxygen with respect to that of the Pt/C catalyst. The shift of the peak potential is probably attributed to the synergistic effect between the Pt catalyst and metal oxide [48].
Mass transport performance was evaluated by the EIS measurements at potentials of 0.5, 0.4 and 0.3 V in O2 saturated 0.5 M H2SO4 solution. In this potential range, the mass transfer resistance plays a dominant role in the potential losses [50]. Figure S6b–d show the Nyquist curves and Figure 8b displays the charge transfer and mass transport resistance values of the Pt/C/GDL, Pt-SnO2/CP and Pt-SnO2@C/CP in the above-mentioned potential range. The Pt-SnO2/CP and Pt-SnO2@C/CP show lower impedance compared to the commercial Pt/C, particularly in mass transport. As the value of potential decreased, the current increased, and the resistance for the charge transfer decreased, but the resistance for the mass transport increased. When the potential was lowered to 0.3 V, the resistance for the mass transport increased rapidly for the Pt/C/GDL and Pt-SnO2/CP, but interestingly, it also remained unchanged for the Pt-SnO2@C/CP. This is mainly attributed to the ordered structure and the hydrophobic surface, which enhanced the mass transport in the electrochemical process, and thus no significant increase in the mass transport resistance was observed [51].
Figure S8 also shows the CV curves of Pt/C/GD, Pt-SnO2/CP and Pt-SnO2@C/CP after various ADT cycles, from which the degradation trend and the values of ECSA after 3000 ADT cycles are shown in Figure 8c,d, respectively. As the cycling number increases, the ECSA gradually decreases. The ECSA of Pt/C decays rapidly, while the decay in the ECSA for the other two nanostructured catalysts is significantly slow. After 3000 ADT cycles, only 20% of the initial ECSA of the Pt/C remained, while the ECSA remained above 60% for the Pt-SnO2@C/CP flake array structure, and remained at about 70% for the Pt-SnO2/CP. The slower decay of ECSA of the Pt-loaded SnO2-based support arrays is partly due to the enhanced stability of the SnO2 support compared with the pure carbon support. It was reported that the combination of SnO2 and carbon could make catalysts more tolerant to high potential and rich oxygen environment at the cathode [36].
Figure S9 shows the SEM images of the Pt/C/GDL and Pt-SnO2/CP before and after ADT testing. The carbon support of the Pt/C catalysts suffers from corrosion when the catalyst is exposed to long-term stability test conditions of 0.6 to 1.2 V. Carbon as a support is easily oxidized at higher potentials (≥0.8 V), and corrosion proceeds via C + H2O CO2 + 4H+ + 4e− [22]. As shown in Figure S9b, after the ADT testing, the corrosion of carbon caused the surface-supported Pt nanoparticles to migrate and aggregate, leading to the loss of an active surface area. Figure S9d shows the morphology of SnO2 support after the ADT tests. With no carbon coating, the SnO2 flake array is no longer clearly visible, and most of the SnO2 particles appear to have been aggregated. The Pt spheres, however, still exist between the SnO2 flakes, and SnO2 flakes appear to be coated on the surface of the Pt spheres. Due to the blocking effect of SnO2, Pt does not significantly migrate on the surface of SnO2, hence the decay of the active area is mainly due to the coating of SnO2 on the surface of Pt spheres, which reduces the surface-active sites of Pt. When the SnO2 is no longer changed, namely, the SnO2 coating on the surface of Pt spheres does not continue, the active area of the Pt catalyst becomes stable. Interestingly, for the Pt-SnO2@C/CP, the basic shape of the flaky array remains unchanged after the ATD testing. At the same time, the morphology of Pt does not show significant change, as observed from the SEM image shown in Figure 9. The difference before and after 3000 cycles is mainly due to a decrease in the flake array density. There is a large gap in the middle part of the rectangular frame where some parts of the support are lost, and as a result some Pt nanoparticles are also lost. Therefore, partial decay of the electrochemical activity occurs.
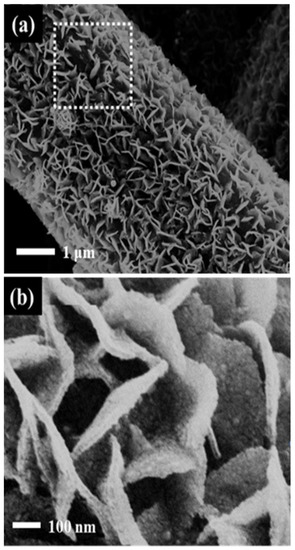
Figure 9.
SEM images of the Pt-SnO2@C/CP after 3000 ADT cycles (a) Low magnification; (b). High magnification.
4. Conclusions
SnO2 flake array structures on CP were synthesized by hydrothermal method, and were further coated by carbon layer using the same method to form flake SnO2@C core-shell flake array. The Pt catalyst was supported on SnO2@C by a facile formic acid reduction method at room temperature. The presence of the carbon layer effectively enhanced the conductive conductivity and electrochemically active area. The improvement in the electrocatalytic activity mainly originated from the synergistic effects between SnO2 support and the carbon layer and Pt catalyst. The ordered array structure provided an effective three-phase reaction zone to accelerate the mass transport. Compared to the commercial Pt/C/GDL, the as-synthesized Pt-SnO2/CP and Pt-SnO2@C/CP showed lower electrochemical impedance in a low potential range. The ADT tests confirmed the better stability of the SnO2 support. This study further provides a facile and controllable method to prepare integrated ordered cathode array with high stability alongside enhanced electrocatalytic activity, which is believed to be helpful for preparing high-performance cathode for low-temperature fuel cells in the future.
Supplementary Materials
The following are available online at https://www.mdpi.com/2079-4991/10/12/2412/s1, Figure S1: SEM images of the as-synthesized SnO2/CP with various magnifications, Figure S2. XRD patterns of CP, SnO2/CP and SnO2@C/CP, Figure S3. SEM images of the Pt-SnO2/CP with various magnifications, Figure S4. EDS spectra of SnO2/CP (a), Pt-SnO2/CP (b) and Pt-SnO2@C/CP (c), Figure S5. XRD patterns of Pt-SnO2/CP and Pt-SnO2@C/CP, Figure S6. Nyqiust plots of SnO2/CP and SnO2@C/CP (a) recorded at open circuit potential in N2 saturated 0.5 M H2SO4 solution, Nyqiust plots of Pt/C/GDL (b), Pt-SnO2/CP (c) and Pt-SnO2@C/CP (d) at the potential of 0.5 V, 0.4 V and 0.3 V in O2-saturated 0.5 M H2SO4 solution, Figure S7. Contact angles of CP (a), SnO2/CP (b), SnO2@C/CP (c), 40 wt%Pt/C/GDL (d), Pt-SnO2/CP (e) and Pt- SnO2@C/CP (f), Figure S8. CV curves recorded in N2-saturated 0.5 M H2SO4 for the Pt/C/GDL (a), Pt-SnO2/CP (b) and Pt-SnO2@C/CP (c) during 3000 ADT cycles, Table S1. Comparison of the ESCA of the Pt-SnO2@C/CP with that reported in literature in acidic solutions, Figure S9. SEM images of the Pt/C/GDL (a, b) and the Pt-SnO2/CP (c, d) before and after ADT.
Author Contributions
Conceptualization, G.L. and Z.Y.; methodology, Z.Y.; software, Z.Y. and M.C.; validation, Z.Y., M.C. and G.L.; formal analysis, Z.Y.; investigation, Z.Y. and M.C.; resources, G.L.; data curation, Z.Y. and M.C.; writing—original draft preparation, Z.Y., G.L. and B.F.; writing—review and editing, G.L. and B.F.; visualization, G.L. and B.F.; supervision, G.L.; project administration, G.L.; and funding acquisition, G.L. All authors have read and agreed to the published version of the manuscript.
Funding
This work was financially supported by the National Natural Science Foundation of China (Grant No. 51704017 and No. 51774028), Nature Science Foundation of Beijing (L172024), NSFC-Liaoning Joint Funding (Grant No. U1508202).
Conflicts of Interest
There are no conflict to declare.
References
- Kim, J.; Kim, S. Obstacles to the Success of Fuel-Cell Electric Vehicles: Are They Truly Impossible to Overcome? IEEE Electrif. Mag. 2018, 6, 48–54. [Google Scholar] [CrossRef]
- Hasa, B.; Vakros, J.; Katsaounis, A. Study of low temperature alcohol electro-reforming. Mater. Today Proc. 2018, 5, 27337–27344. [Google Scholar] [CrossRef]
- Pei, P.; Jia, X.; Xu, H.; Li, P.; Wu, Z.; Li, Y.; Ren, P.; Chen, D.; Huang, S. The recovery mechanism of proton exchange membrane fuel cell in micro-current operation. Appl. Energy 2018, 226, 1–9. [Google Scholar] [CrossRef]
- Wang, C.; Li, W.; Li, Z.; Fang, B. Solar thermal harvesting based on self-doped nanocermet: Structural merits, design strategies and applications. Renew. Sustain. Energy Rev. 2020, 134, 110277. [Google Scholar] [CrossRef]
- Hasa, B.; Martino, E.; Vakros, J.; Trakakis, G.; Galiotis, C.; Katsaounis, A. Effect of Carbon Support on the Electrocatalytic Properties of Pt–Ru Catalysts. Chemelectrochem 2019, 6, 4970–4979. [Google Scholar] [CrossRef]
- Fathabadi, H. Combining a proton exchange membrane fuel cell (PEMFC) stack with a Li-ion battery to supply the power needs of a hybrid electric vehicle. Renew. Energy 2019, 130, 714–724. [Google Scholar] [CrossRef]
- Kim, M.-S.; Fang, B.; Chaudhari, N.K.; Song, M.; Bae, T.-S.; Yu, J.-S. A highly efficient synthesis approach of supported Pt-Ru catalyst for direct methanol fuel cell. Electrochim. Acta 2010, 55, 4543–4550. [Google Scholar] [CrossRef]
- Yu, S.; Song, S.; Li, R.; Fang, B. The lightest solid meets the lightest gas: An overview of carbon aerogels and their composites for hydrogen related applications. Nanoscale 2020, 12, 19536–19556. [Google Scholar] [CrossRef]
- Yiliguma; Tang, Y.; Zheng, G. Colloidal nanocrystals for electrochemical reduction reactions. J. Colloid Interface Sci. 2017, 485, 308–327. [Google Scholar] [CrossRef]
- Wang, Y.-J.; Long, W.; Wang, L.; Yuan, R.; Ignaszak, A.; Fang, B.; Wilkinson, D.P. Unlocking the door to highly active ORR catalysts for PEMFC applications: Polyhedron-engineered Pt-based nanocrystals. Energy Environ. Sci. 2018, 11, 258–275. [Google Scholar] [CrossRef]
- Fang, B.; Chaudhari, N.K.; Kim, M.-S.; Kim, J.H.; Yu, J.-S. Homogeneous Deposition of Platinum Nanoparticles on Carbon Black for Proton Exchange Membrane Fuel Cell. J. Am. Chem. Soc. 2009, 131, 15330–15338. [Google Scholar] [CrossRef]
- Zhang, J.; Tang, S.; Liao, L.; Yu, W. Progress in non-platinum catalysts with applications in low temperature fuel cells. Chin. J. Catal. 2013, 34, 1051–1065. [Google Scholar] [CrossRef]
- Zhang, S.; Yuan, X.-Z.; Hin, J.N.C.; Wang, H.; Friedrich, K.A.; Schulze, M. A review of platinum-based catalyst layer degradation in proton exchange membrane fuel cells. J. Power Sources 2009, 194, 588–600. [Google Scholar] [CrossRef]
- Mi, S.; Cheng, N.; Jiang, H.; Li, C. Porous Pt3Ni with enhanced activity and durability towards oxygen reduction reaction. RSC Adv. 2018, 8, 15344–15351. [Google Scholar] [CrossRef]
- Wang, Y.-J.; Fang, B.; Li, H.; Bi, X.; Wang, H. Progress in modified carbon support materials for Pt and Pt-alloy cathode catalysts in polymer electrolyte membrane fuel cells. Prog. Mater. Sci. 2016, 82, 445–498. [Google Scholar] [CrossRef]
- Wang, Y.-J.; Zhao, N.; Fang, B.; Li, H.; Bi, X.T.; Wang, H. Carbon-Supported Pt-Based Alloy Electrocatalysts for the Oxygen Reduction Reaction in Polymer Electrolyte Membrane Fuel Cells: Particle Size, Shape, and Composition Manipulation and Their Impact to Activity. Chem. Rev. 2015, 115, 3433–3467. [Google Scholar] [CrossRef]
- Shao, Y.; Yin, G.; Gao, Y. Understanding and approaches for the durability issues of Pt-based catalysts for PEM fuel cell. J. Power Sources 2007, 171, 558–566. [Google Scholar] [CrossRef]
- Li, L.; Hu, L.; Li, J.; Wei, Z. Enhanced stability of Pt nanoparticle electrocatalysts for fuel cells. Nano Res. 2015, 8, 418–440. [Google Scholar] [CrossRef]
- Sandström, R.; Ekspong, J.; Annamalai, A.; Sharifi, T.; Klechikov, A.; Wågberg, T. Fabrication of microporous layer–free hierarchical gas diffusion electrode as a low Pt-loading PEMFC cathode by direct growth of helical carbon nanofibers. RSC Adv. 2018, 8, 41566–41574. [Google Scholar] [CrossRef]
- Yoo, S.; Cho, S.H.; Kim, D.; Ih, S.; Lee, S.; Zhang, L.; Li, H.; Lee, J.Y.; Liu, L.; Park, S. 3D PtAu nanoframe superstructure as a high-performance carbon-free electrocatalyst. Nanoscale 2019, 11, 2840–2847. [Google Scholar] [CrossRef]
- Du, S. A Facile Route for Polymer Electrolyte Membrane Fuel Cell Electrodes with in situ Grown Pt Nanowires. J. Power Sources 2010, 195, 289–292. [Google Scholar] [CrossRef]
- Samad, S.; Loh, K.S.; Wong, W.Y.; Lee, T.K.; Sunarso, J.; Chong, S.T.; Daud, W.R.W. Carbon and non-carbon support materials for platinum-based catalysts in fuel cells. Int. J. Hydrogen Energy 2018, 43, 7823–7854. [Google Scholar] [CrossRef]
- Chen, M.; Wang, M.; Yang, Z.; Wang, X. High performance and durability of order-structured cathode catalyst ayer based on TiO2@PANI core-shell nanowire arrays. Appl. Surf. Sci. 2017, 406, 69–76. [Google Scholar] [CrossRef]
- Wang, M.; Chen, M.; Yang, Z.; Liu, G.; Lee, J.K.; Yang, W.; Wang, X. High-performance and durable cathode catalyst layer with hydrophobic C@PTFE particles for low-Pt loading membrane assembly electrode of PEMFC. Energy Convers. Manag. 2019, 191, 132–140. [Google Scholar] [CrossRef]
- Liu, Y.; Shrestha, S.; Mustain, W.E. Synthesis of Nanosize Tungsten Oxide and Its Evaluation as an Electrocatalyst Support for Oxygen Reduction in Acid Media. ACS Catal. 2012, 2, 456–463. [Google Scholar] [CrossRef]
- Tian, Z.Q.; Lim, S.H.; Poh, C.K.; Tang, Z.; Xia, Z.; Luo, Z.; Shen, P.K.; Chua, D.; Feng, Y.P.; Shen, Z.; et al. A Highly Order-Structured Membrane Electrode Assembly with Vertically Aligned Carbon Nanotubes for Ultra-Low Pt Loading PEM Fuel Cells. Adv. Energy Mater. 2011, 1, 1205–1214. [Google Scholar] [CrossRef]
- Xia, Z.; Wang, S.; Li, Y.; Jiang, L.; Sun, H.; Zhu, S.; Su, D.; Sun, G. Vertically oriented polypyrrole nanowire arrays on Pd-plated Nafion® membrane and its application in direct methanol fuel cells. J. Mater. Chem. A 2013, 1, 491–494. [Google Scholar] [CrossRef]
- Fang, B.; Kim, J.H.; Kim, M.-S.; Yu, J.-S. Hierarchical Nanostructured Carbons with Meso–Macroporosity: Design, Characterization, and Applications. Acc. Chem. Res. 2013, 46, 1397–1406. [Google Scholar] [CrossRef]
- Kim, J.; Fang, B.; Kim, M.; Yoon, S.; Bae, T.; Ranade, D.; Yu, J. Facile synthesis of bimodal porous silica and multimodal porous carbon as an anode catalyst support in polymer exchange membrane fuel cell. Electrochim. Acta 2010, 55, 7628–7633. [Google Scholar] [CrossRef]
- Fang, B.; Kim, J.H.; Kim, M.; Yu, J.-S. Ordered Hierarchical Nanostructured Carbon as a Highly Efficient Cathode Catalyst Support in Proton Exchange Membrane Fuel Cell. Chem. Mater. 2009, 21, 789–796. [Google Scholar] [CrossRef]
- Govindarajan, R.; Payoyo, J.; Fang, B.; Bonakdarpour, A.; Wilkinson, D.P. Impact of Carbon Porosity on the Performance of Cathode Microporous Layers in Proton Exchange Membrane Fuel Cells. Fuel Cells 2020, 20, 220–223. [Google Scholar] [CrossRef]
- Debe, M.K.; Maier-Hendricks, S.M.; Vernstrom, G.; Willey, J.; Hamden, M.; Mittelsteadt, C.K.; Capuano, C.; Ayers, K.E.; Anderson, E. Initial Performance and Durability of Ultra-Low Loaded NSTF Electrodes for PEM Electrolyzers. ECS Meet. Abstr. 2012, 159, 165. [Google Scholar] [CrossRef]
- Kim, I.-T.; Choi, M.; Lee, H.-K.; Shim, J. Characterization of methanol-tolerant Pd–WO3 and Pd–SnO2 electrocatalysts for the oxygen reduction reaction in direct methanol fuel cells. J. Ind. Eng. Chem. 2013, 19, 813–818. [Google Scholar] [CrossRef]
- Cognard, G.; Ozouf, G.; Beauger, C.; Berthomé, G.; Riassetto, D.; Dubau, L.; Chattot, R.; Chatenet, M.; Maillard, F. Benefits and limitations of Pt nanoparticles supported on highly porous antimony-doped tin dioxide aerogel as alternative cathode material for proton-exchange membrane fuel cells. Appl. Catal. B Environ. 2017, 201, 381–390. [Google Scholar] [CrossRef]
- Suffner, J.; Kaserer, S.; Hahn, H.; Roth, C.; Ettingshausen, F. Sb-Doped SnO2 Hollow Spheres Offering Micro- and Nanoporosity in Fuel Cell Electrode Structures. Adv. Energy Mater. 2011, 1, 648–654. [Google Scholar] [CrossRef]
- Zhang, N.; Zhang, S.; Du, C.; Wang, Z.-B.; Shao, Y.; Kong, F.; Lin, Y.; Yin, G. Pt/Tin Oxide/Carbon Nanocomposites as Promising Oxygen Reduction Electrocatalyst with Improved Stability and Activity. Electrochim. Acta 2014, 117, 413–419. [Google Scholar] [CrossRef]
- Wang, M.; Fan, L.; Wu, X.; Tian, D.; Cheng, J.; Qiu, Y.; Wu, H.; Guan, B.; Zhang, N.; Sun, K.; et al. Hierarchical mesoporous SnO2 nanosheets on carbon cloth toward enhancing the polysulfides redox for lithium–sulfur batteries. J. Mater. Chem. A 2017, 5, 19613–19618. [Google Scholar] [CrossRef]
- Chen, S.; Xin, Y.; Zhou, Y.; Zhang, F.; Ma, Y.; Zhou, H.; Qi, L. Branched CNT@SnO2 nanorods@carbon hierarchical heterostructures for lithium ion batteries with high reversibility and rate capability. J. Mater. Chem. A 2014, 2, 15582–15589. [Google Scholar] [CrossRef]
- Li, B.; Yan, Z.; Higgins, D.C.; Yang, D.; Chen, Z.; Ma, J. Carbon-supported Pt nanowire as novel cathode catalysts for proton exchange membrane fuel cells. J. Power Sources 2014, 262, 488–493. [Google Scholar] [CrossRef]
- Yao, X.; Su, K.; Sui, S.; Mao, L.; He, A.; Zhang, J.; Du, S. A novel catalyst layer with carbon matrix for Pt nanowire growth in proton exchange membrane fuel cells (PEMFCs). Int. J. Hydrogen Energy 2013, 38, 12374–12378. [Google Scholar] [CrossRef]
- Lu, Y.; Du, S.; Steinberger-Wilckens, R. One-dimensional nanostructured electrocatalysts for polymer electrolyte membrane fuel cells—A review. Appl. Catal. B Environ. 2016, 199, 292–314. [Google Scholar] [CrossRef]
- Sassin, M.; Garsany, Y.; Gould, B.; Swider-Lyons, K. Fabrication Method for Laboratory-Scale High-Performance Membrane Electrode Assemblies for Fuel Cells. Anal. Chem. 2017, 89, 511–518. [Google Scholar] [CrossRef]
- Xia, Z.; Wang, S.; Jiang, L.; Sun, H.; Liu, S.; Fu, X.; Zhang, B.; Su, D.S.; Wang, J.; Sun, G. Bio-inspired Construction of Advanced Fuel Cell Cathode with Pt Anchored in Ordered Hybrid Polymer Matrix. Sci. Rep. 2015, 5, 16100. [Google Scholar] [CrossRef]
- Liu, G.; Wang, Y.-T.; Zhang, J.; Wang, M.; Zhang, C.-J.; Wang, X.-D. Pore-forming technology and performance of MEA for direct methanol fuel cells. J. Chem. Technol. Biotechnol. 2013, 88, 818–822. [Google Scholar] [CrossRef]
- Li, Z.; Lu, C.; Xia, Z.; Zhou, Y.; Luo, Z. X-ray diffraction patterns of graphite and turbostratic carbon. Carbon 2007, 45, 1686–1695. [Google Scholar] [CrossRef]
- Zhang, H.; Zheng, J.; Chao, Y.; Zhang, K.; Zhu, Z. Surface engineering of FeCo-based electrocatalysts supported on carbon paper by incorporating non-noble metals for water oxidation. New J. Chem. 2018, 42, 7254–7261. [Google Scholar] [CrossRef]
- Li, Y.; Zhu, S.; Liu, Q.; Gu, J.; Guo, Z.; Chen, Z.; Feng, C.; Zhang, D.; Moon, W.-J. Carbon-coated SnO2@C with hierarchically porous structures and graphite layers inside for a high-performance lithium-ion battery. J. Mater. Chem. 2012, 22, 2766–2773. [Google Scholar] [CrossRef]
- Yu, S.; Li, X.; Li, J.; Liu, S.; Lu, W.; Shao, Z.; Yi, B. Study on hydrophobicity degradation of gas diffusion layer in proton exchange membrane fuel cells. Energy Convers. Manag. 2013, 76, 301–306. [Google Scholar] [CrossRef]
- Hoque, A.; Higgins, D.C.; Hassan, F.M.; Choi, J.-Y.; Pritzker, M.D.; Chen, Z. Tin oxide—Mesoporous carbon composites as platinum catalyst supports for ethanol oxidation and oxygen reduction. Electrochim. Acta 2014, 121, 421–427. [Google Scholar] [CrossRef]
- Su, K.; Yao, X.; Sui, S.; Wei, Z.; Zhang, J.; Du, S. Ionomer content effects on the electrocatalyst layer with in-situ grown Pt nanowires in PEMFCs. Int. J. Hydrogen Energy 2014, 39, 3219–3225. [Google Scholar] [CrossRef]
- Sun, R.; Xia, Z.; Shang, L.; Fu, X.; Li, H.; Wang, S.; Sun, G. Hierarchically ordered arrays with platinum coated PANI nanowires for highly efficient fuel cell electrodes. J. Mater. Chem. A 2017, 5, 15260–15265. [Google Scholar] [CrossRef]
Publisher’s Note: MDPI stays neutral with regard to jurisdictional claims in published maps and institutional affiliations. |
© 2020 by the authors. Licensee MDPI, Basel, Switzerland. This article is an open access article distributed under the terms and conditions of the Creative Commons Attribution (CC BY) license (http://creativecommons.org/licenses/by/4.0/).