Article

Microwave-Assisted Synthesis of Chalcopyrite/Silver Phosphate Composites with Enhanced Degradation of Rhodamine B under Photo-Fenton Process

1
Department of Chemistry, National Changhua University of Education, 1 Jin-De road, Changhua City 50007, Taiwan
2
Department of Chemistry, University of Wisconsin-Platteville, 1 University Plaza, Platteville, WI 53818-3099, USA
*
Authors to whom correspondence should be addressed.
Nanomaterials 2020, 10(11), 2300; https://doi.org/10.3390/nano10112300
Submission received: 23 October 2020 / Revised: 11 November 2020 / Accepted: 18 November 2020 / Published: 20 November 2020
(This article belongs to the Special Issue Application of Nanomaterials in Photocatalysis)

Abstract

:
A new composite by coupling chalcopyrite (CuFeS2) with silver phosphate (Ag3PO4) (CuFeS2/Ag3PO4) was proposed by using a cyclic microwave heating method. The prepared composites were characterized by scanning and transmission electron microscopy and X-ray diffraction, Fourier-transform infrared, UV–Vis diffuse reflectance spectroscopy, and X-ray photoelectron spectroscopy. Under optimum conditions and 2.5 W irradiation (wavelength length > 420 nm, power density = 0.38 Wcm−2), 96% of rhodamine B (RhB) was degraded by CuFeS2/Ag3PO4 within a 1 min photo-Fenton reaction, better than the performance of Ag3PO4 (25% degradation within 10 min), CuFeS2 (87.7% degradation within 1 min), and mechanically mixed CuFeS2/Ag3PO4 catalyst. RhB degradation mainly depended on the amount of hydroxyl radicals generated from the Fenton reaction. The degradation mechanism of CuFeS2/Ag3PO4 from the photo-Fenton reaction was deduced using a free radical trapping experiment, the chemical reaction of coumarin, and photocurrent and luminescence response. The incorporation of CuFeS2 in Ag3PO4 enhanced the charge separation of Ag3PO4 and reduced Ag3PO4 photocorrosion as the photogenerated electrons on Ag3PO4 were transferred to regenerate Cu2+/Fe3+ ions produced from the Fenton reaction to Cu+/Fe2+ ions, thus simultaneously maintaining the CuFeS2 intact. This demonstrates the synergistic effect on material stability. However, hydroxyl radicals were produced by both the photogenerated holes of Ag3PO4 and the Fenton reaction of CuFeS2 as another synergistic effect in catalysis. Notably, the degradation performance and the reusability of CuFeS2/Ag3PO4 were promoted. The practical applications of this new material were demonstrated from the effective performance of CuFeS2/Ag3PO4 composites in degrading various dyestuffs (90–98.9% degradation within 10 min) and dyes in environmental water samples (tap water, river water, pond water, seawater, treated wastewater) through enhanced the Fenton reaction under sunlight irradiation.

Graphical Abstract

1. Introduction

Recently, concerns have been raised worldwide toward the harm caused by residual organic pollutants in surface water and groundwater, threatening ecosystems and aquatic species [1,2,3]. Among the many sources of water pollution, wastewater from the printing and dyeing industry is a major concern. The decolorization and degradation of most chromophores in dyes are difficult because of their stable aromatic structures, leading to prolonged toxic effects and environmental hazards [4,5,6]. Furthermore, dyes can absorb sunlight and reduce water clarity, preventing photosynthesis in aquatic plants, decreasing dissolved oxygen in water, affecting microbial diversity, and disrupting the self-purification capacity of water [7]. The removal of these deleterious and hazardous pollutants from industrial wastewater has become an urgent environmental need in the world [8].
Many studies have evaluated the removal of organic dyes by using photocatalytic degradation, ideally using sunlight, with the vision of sustainable water treatment. TiO2 is the most widely used photocatalytic semiconductor because of its nontoxic and stable nature, with a relatively low cost and abundant production resulting from a mature manufacturing process [9,10]. However, its absorption and photocatalytic activity depends entirely on ultraviolet light, which restricts its application in large-scale wastewater treatment [11,12,13]. Studies have been attempting to identify efficient sunlight-responsive photocatalysts, and Ag3PO4, with a quantum efficiency of >90%, is considered an excellent candidate that is sunlight responsive [14,15,16]. However, it experiences considerable photocorrosion during photolysis. In addition to the photocatalytic method, Cu/Fe-bearing solids such as chalcopyrite (CuFeS2) have been widely used as catalysts in advanced oxidation processes (AOPs) for wastewater treatment [17,18,19,20,21]. In general, AOPs are based on Fenton’s chemistry, which utilizes hydroxyl radicals produced from the Fenton reaction between H2O2 and Cu+/Fe2+ ions to degrade organic dyes (Equations (1)–(6)) [22,23]. However, the reusability of CuFeS2 is a challenge due to its dissolution during water treatment and the slow kinetics of Fe2+ regeneration:
CuFeS2(s) + 8H2O2 → Fe3+ + Cu2+ + 2SO42− + 8H2O + 2H+
CuFeS2(s) + 16Fe3+ + 8H2O → 17Fe2+ +Cu2+ + 2SO42− + 16H+
CuFeS2(s) + 4O2 → Fe2+ + Cu2+ + 2SO42−
Fe2+ + H2O2 → Fe3+ + OH + OH·
Cu2+ + H2O2 → Cu+ + O2· + 2H+
Cu+ + H2O2 → Cu2+ + OH + OH·
Fe3+ + H2O → Fe(OH)2+ + H+
Fe(OH)2+ + hν → Fe2+ + OH·
To address CuFeS2 reusability, attempts have been made to regenerate the Fenton catalysts with UV and/or visible-light irradiation, known as the photo-Fenton process [19,24,25]. Under UV and/or visible-light irradiation, Fe3+ complexes are formed from the Fenton reaction (Equation (7)) to produce both Fe2+ and hydroxyl radicals (Equation (8)). The photogenerated Fe2+ ions can catalyze the Fenton reaction to form Fe3+, thus demonstrating the recyclability of Fenton catalysts (Equation (4)). For instance, Dotto et al. demonstrated that the prepared citrate–CuFeS2 materials possessed 90% catalytic efficiency for bisphenol A (BPA) degradation with a 15 min photo-Fenton process for its rapid generation of hydroxyl radicals and efficient H2O2 consumption [24]. Dotto et al. also reported that the catalytic efficiency and stability was sustained after four consecutive photoregeneration cycles. However, the preparation of the novel CuFeS2 samples requires a high power and expensive microwave reactor (1400 W, 200 °C, 7 min). In another simpler attempt in material preparation, Pastrana-Martinez et al. used the mineral of CuFeS2 mined from Jendouba, Tunisia, to catalyze tyrosol (TY) degradation by using a UV light-emitting diode (LED)-assisted photo-Fenton reaction [19]. Higher total organic carbon (TOC) conversions (85.0%) and lower iron leaching (0.89 mg·L−1) were attained when the purified CuFeS2 samples were used in the photo-Fenton-like process within 60 min (0.50 mM TY at stoichiometric H2O2 concentrations). However, UV light irradiation is not considered sustainable because it requires a high energy input. The limitations of the methods used in all these studies underline the need to improve the visible-light absorption ability and efficiently boost the degradation performance and stability of CuFeS2. To our knowledge, CuFeS2 coupled with other semiconductors has not been examined in the Fenton process under visible-light irradiation.
Here, we synthesized CuFeS2 coupled with Ag3PO4 (CuFeS2/Ag3PO4) through cyclic microwave heating to address the challenges in material preparation, the stability of materials, and degradation performance. The breakthrough in our synthesis is that CuFeS2/Ag3PO4 could be prepared using a domestic 336 W microwave oven within 12 min. Our previous report indicated that Ag3PO4 is an efficient photocatalyst responsive to visible light and sunlight, so incorporating Ag3PO4 into the CuFeS2 Fenton reaction system might greatly increase the visible-light absorption while improving the regeneration of Fe2+/Cu+ ions. Here, we used CuFeS2/Ag3PO4 composites for the degradation of organic dyes (rhodamine B (RhB), methyl red (MR), rhodamine 6G (R6G), fluorescein, and propidium iodide (PI)). We also proposed that the degradation mechanism of CuFeS2/Ag3PO4 and the reactive species and successfully demonstrated the regeneration of the CuFeS2 catalyst and the application of CuFeS2/Ag3PO4 in the treatment of environmental samples.

2. Materials and Methods

2.1. Preparation of Ag3PO4, CuFeS2, and CuFeS2/Ag3PO4

All chemicals were purchased from Sigma Aldrich (St. Louis, MO, USA) and were of analytical grade and thus used without further purification. First, 0.212 g of AgNO3 was added to 20 mL of deionized water (18.2 MΩ·cm) with stirring. Then, a colorless Ag(NH3)2+ ion solution was produced by adding 6.2 mL of 14 M NH3 solution dropwise into the AgNO3 solution. After 30 min stirring, 3.5 mL of H3PO4 (14.6 M) was used to neutralize the mixed solution to pH 7.0, and the solution was stirred again for 30 min in the dark. The yellow precipitate was filtered and subsequently rinsed with copies of deionized water and anhydrous ethanol. Finally, the as-synthesized Ag3PO4 was dried at 55 °C for 12 h [26].
CuFeS2 was prepared using the cyclic microwave heating method [27]. First, 19.7 mg of CuCl, 25.35 mg of FeCl3, and 48.46 mg of L-cysteine were added to 20 mL of deionized water with stirring for 15 min. Then, the mixed solution underwent 10 cycles of 36 s heating and a 36 s pause in a domestic microwave oven (power: 336 W). After the black precipitate was cooled to room temperature, it was rinsed with deionized water and anhydrous ethanol. Finally, the as-synthesized CuFeS2 was dried at 55 °C for 12 h. Cu2S and Fe2S3 were prepared following similar method without adding FeCl3 and CuCl precursor, respectively. The CuFeS2/Ag3PO4 with a molar ratio of 2.5:1 was prepared as followed: 20 mg of Ag3PO4, 19.7 mg of CuCl, 25.35 mg of FeCl3, and 48.46 mg of L-cysteine were added to 20 mL of deionized water with stirring for 15 min. Then, the mixed solution underwent 10 cycles of 36 s heating and a 36 s pause in a domestic microwave oven (power: 336 W). After the black precipitate was cooled to room temperature, it was rinsed with deionized water and anhydrous ethanol. Finally, the prepared CuFeS2/Ag3PO4 was dried at 55 °C for 12 h and the weight of CuFeS2/Ag3PO4 was 41.7 mg. Thus, the weight percentage of CuFeS2 in CuFeS2/Ag3PO4 was 52%. In this condition, we estimated the weight of CuFeS2 and Ag3PO4 in the CuFeS2/Ag3PO4 was 21.7 mg and 20 mg, respectively. Therefore, the molar ratio of CuFeS2/Ag3PO4 was calculated to be 2.5:1 [27]. In addition, the preparation of CuFeS2/Ag3PO4 with different molar ratios (0.4:1 and 1:1) followed the same method and was prepared by decreasing the adding amounts of CuCl and FeCl3 precursors at 20 mg Ag3PO4.

2.2. Characterization of Ag3PO4, CuFeS2, and CuFeS2/Ag3PO4

The morphological and compositional characteristics of all as-prepared samples were observed with scanning electron microscopy (SEM) on a HITACHI S-4300 (Hitachi, Tokyo, Japan) and transmission electron microscopy (TEM) on a 1200EX II (JEOL, Tokyo, Japan) equipped with a QUANTAX Annular XFlash QUAD FQ5060 (Bruker Nano, Berlin, Germany). The crystallographic texture of the samples was measured through powder X-ray diffraction (XRD) on SMART APEX II (Bruker AXS, Billerica, MA, USA) using Cu Kα radiation (λ = 1.5406 Å). Fourier-transform infrared (FT-IR) spectra were obtained using an Agilent Cary 600 FT-IR spectrometer (Agilent Technologies, Santa Clara, CA, USA). An Evolution 2000UV–Vis spectrophotometer (Thermo Fisher Scientific Inc., Madison, WI, USA) with integrating spheres and reflectance standard material BaSO4 was applied to obtain the UV–Vis diffuse reflectance spectroscopy (DRS). The binding energy of elements was determined through X-ray photoelectron spectroscopy (XPS) on a VG ESCA210 (VG Scientific, West Sussex, UK).

2.3. Degradation Procedure by Using Ag3PO4, CuFeS2, and CuFeS2/Ag3PO4

RhB degradation was used to assess the degradation activity of the prepared samples. The photoreactor PCX-50C (Beijing Perfectlight Technology Co. Ltd., Beijing, China) was equipped with a low-power white LED irradiation (2.5 W, power density = 0.38 W·cm−2, wavelength > 420 nm). For the photo-Fenton reaction, 20 mg of the prepared catalyst samples was added into the RhB solution (20 ppm, 50 mL), and the solution was stirred in the dark for 30 min. Before 10 min, to turn the light on and add H2O2, we measured the absorbance to check the adsorption ability of the prepared samples. Subsequently, the LED lamp was turned on and 200 μL of H2O2 (35%) was added. After given time intervals, 1 mL of suspension was taken, quenched immediately by adding 0.1 mM NaN3 and filtered by a 0.22 μm syringe filter organic membrane to remove the catalyst sample. The concentration of RhB was measured using a Synergy H1 hybrid multimode microplate reader (BioTek Instruments, Winooski, VT, USA) at its characteristic absorption peak of 550 nm. Similar processes were performed for other dyestuffs (MR, R6G, fluorescein, and PI). The RhB degradation (20 ppm, 50 mL) for the photocatalytic and Fenton reactions was performed using the same protocols (20 mg catalysts) as mentioned above, but without the addition of H2O2 and LED light irradiation, respectively. After the experiment, TOC concentration was determined on an Elementar Acquray TOC analyzer (Elementar Analysensysteme GmbH, Langenselbold, Germany) to evaluate the extent of mineralization.

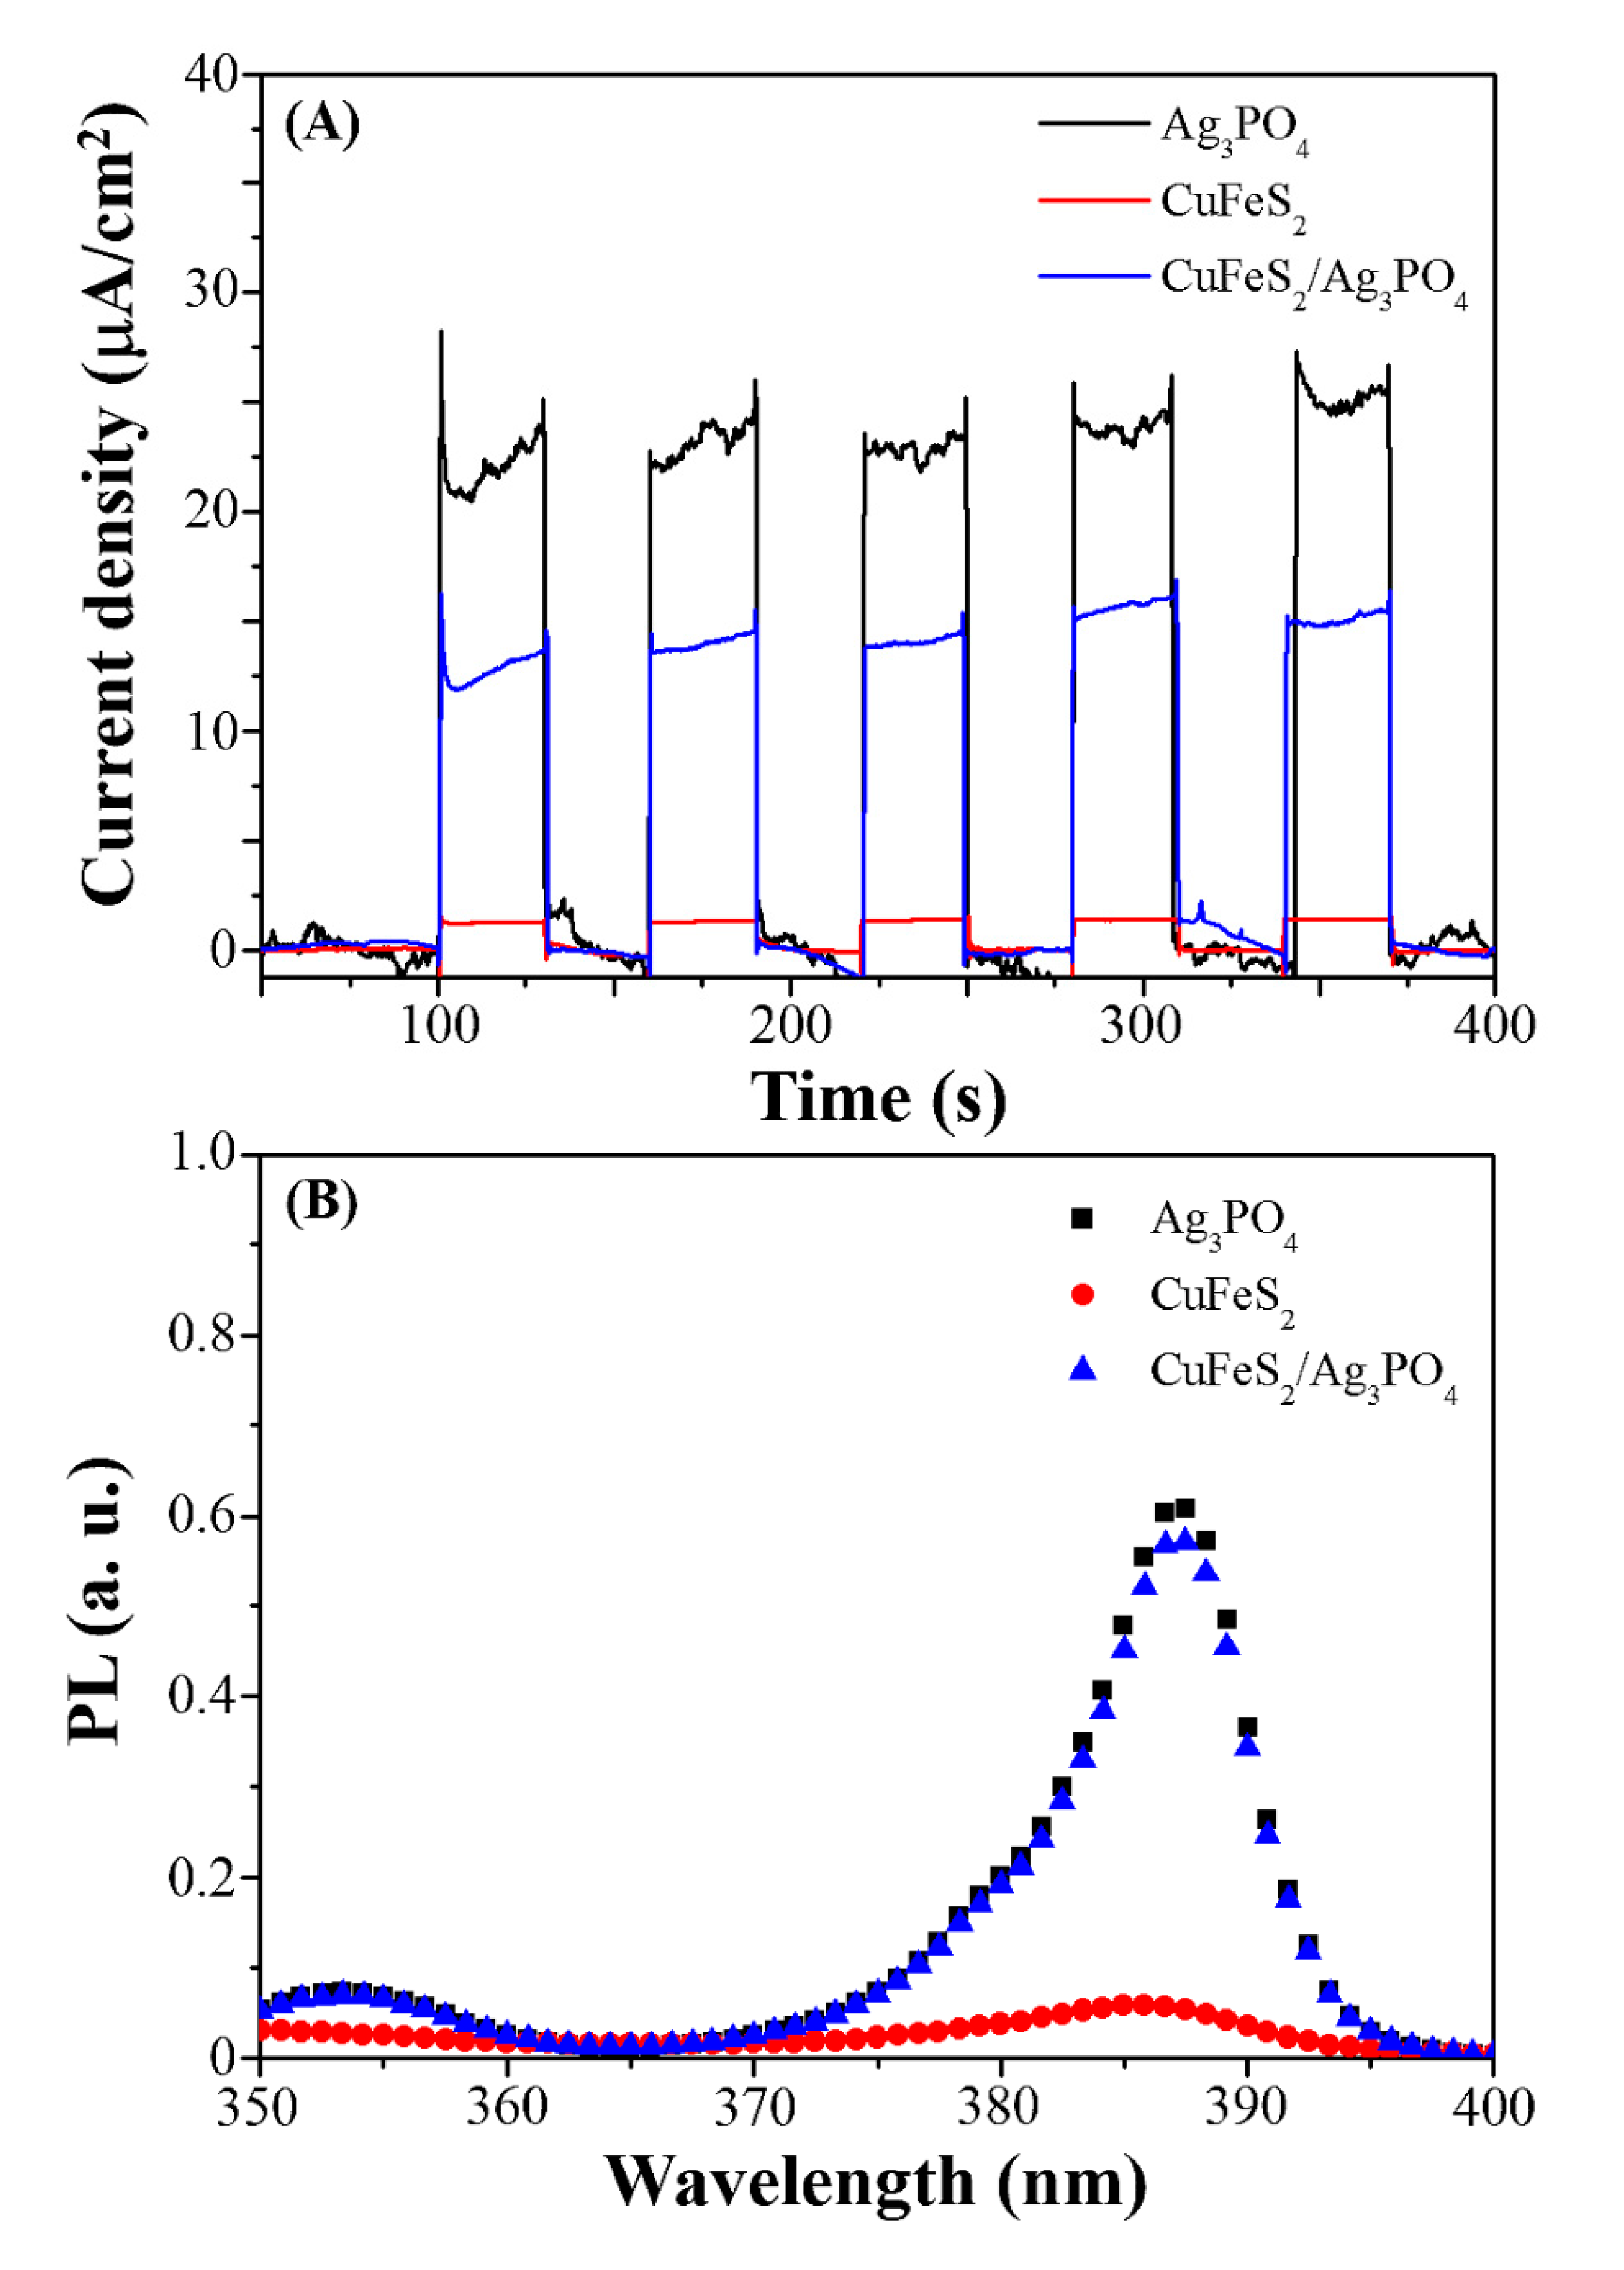
2.4. Evaluation of Charge Separation and Recombination Rate of Ag3PO4, CuFeS2, and CuFeS2/Ag3PO4

The charge separation efficiency and recombination rate of electron–hole pairs for the prepared composites were evaluated according to our earlier reports [28,29,30]. Photocurrent was measured to evaluate the charge separation efficiency of Ag3PO4, CuFeS2, and CuFeS2/Ag3PO4 composites under constant white LED irradiation at 60 s intervals. To determine the recombination rate of electron–hole pairs, the photoluminescence (PL) spectra of samples were obtained using λex = 250 nm with a Varian Cary Eclipse fluorescence spectrophotometer (Agilent Technologies, Santa Clara, CA, USA).

2.5. Free Radical Trapping Experiment of Ag3PO4, CuFeS2, and CuFeS2/Ag3PO4

To investigate the active species generated during RhB degradation over Ag3PO4, CuFeS2, and CuFeS2/Ag3PO4, the trapping experiment was conducted using ethylenediaminetetraacetate (EDTA), tert-butanol (t-BuOH), and p-benzoquinone (BQ) (each 1 mM) as the capturing agent for holes, hydroxyl radicals, and oxygen radicals, respectively. The implemented trapping experimental procedure was identical to the steps mentioned in the degradation section except for the capturing agent being added at each run.

3. Results and Discussion

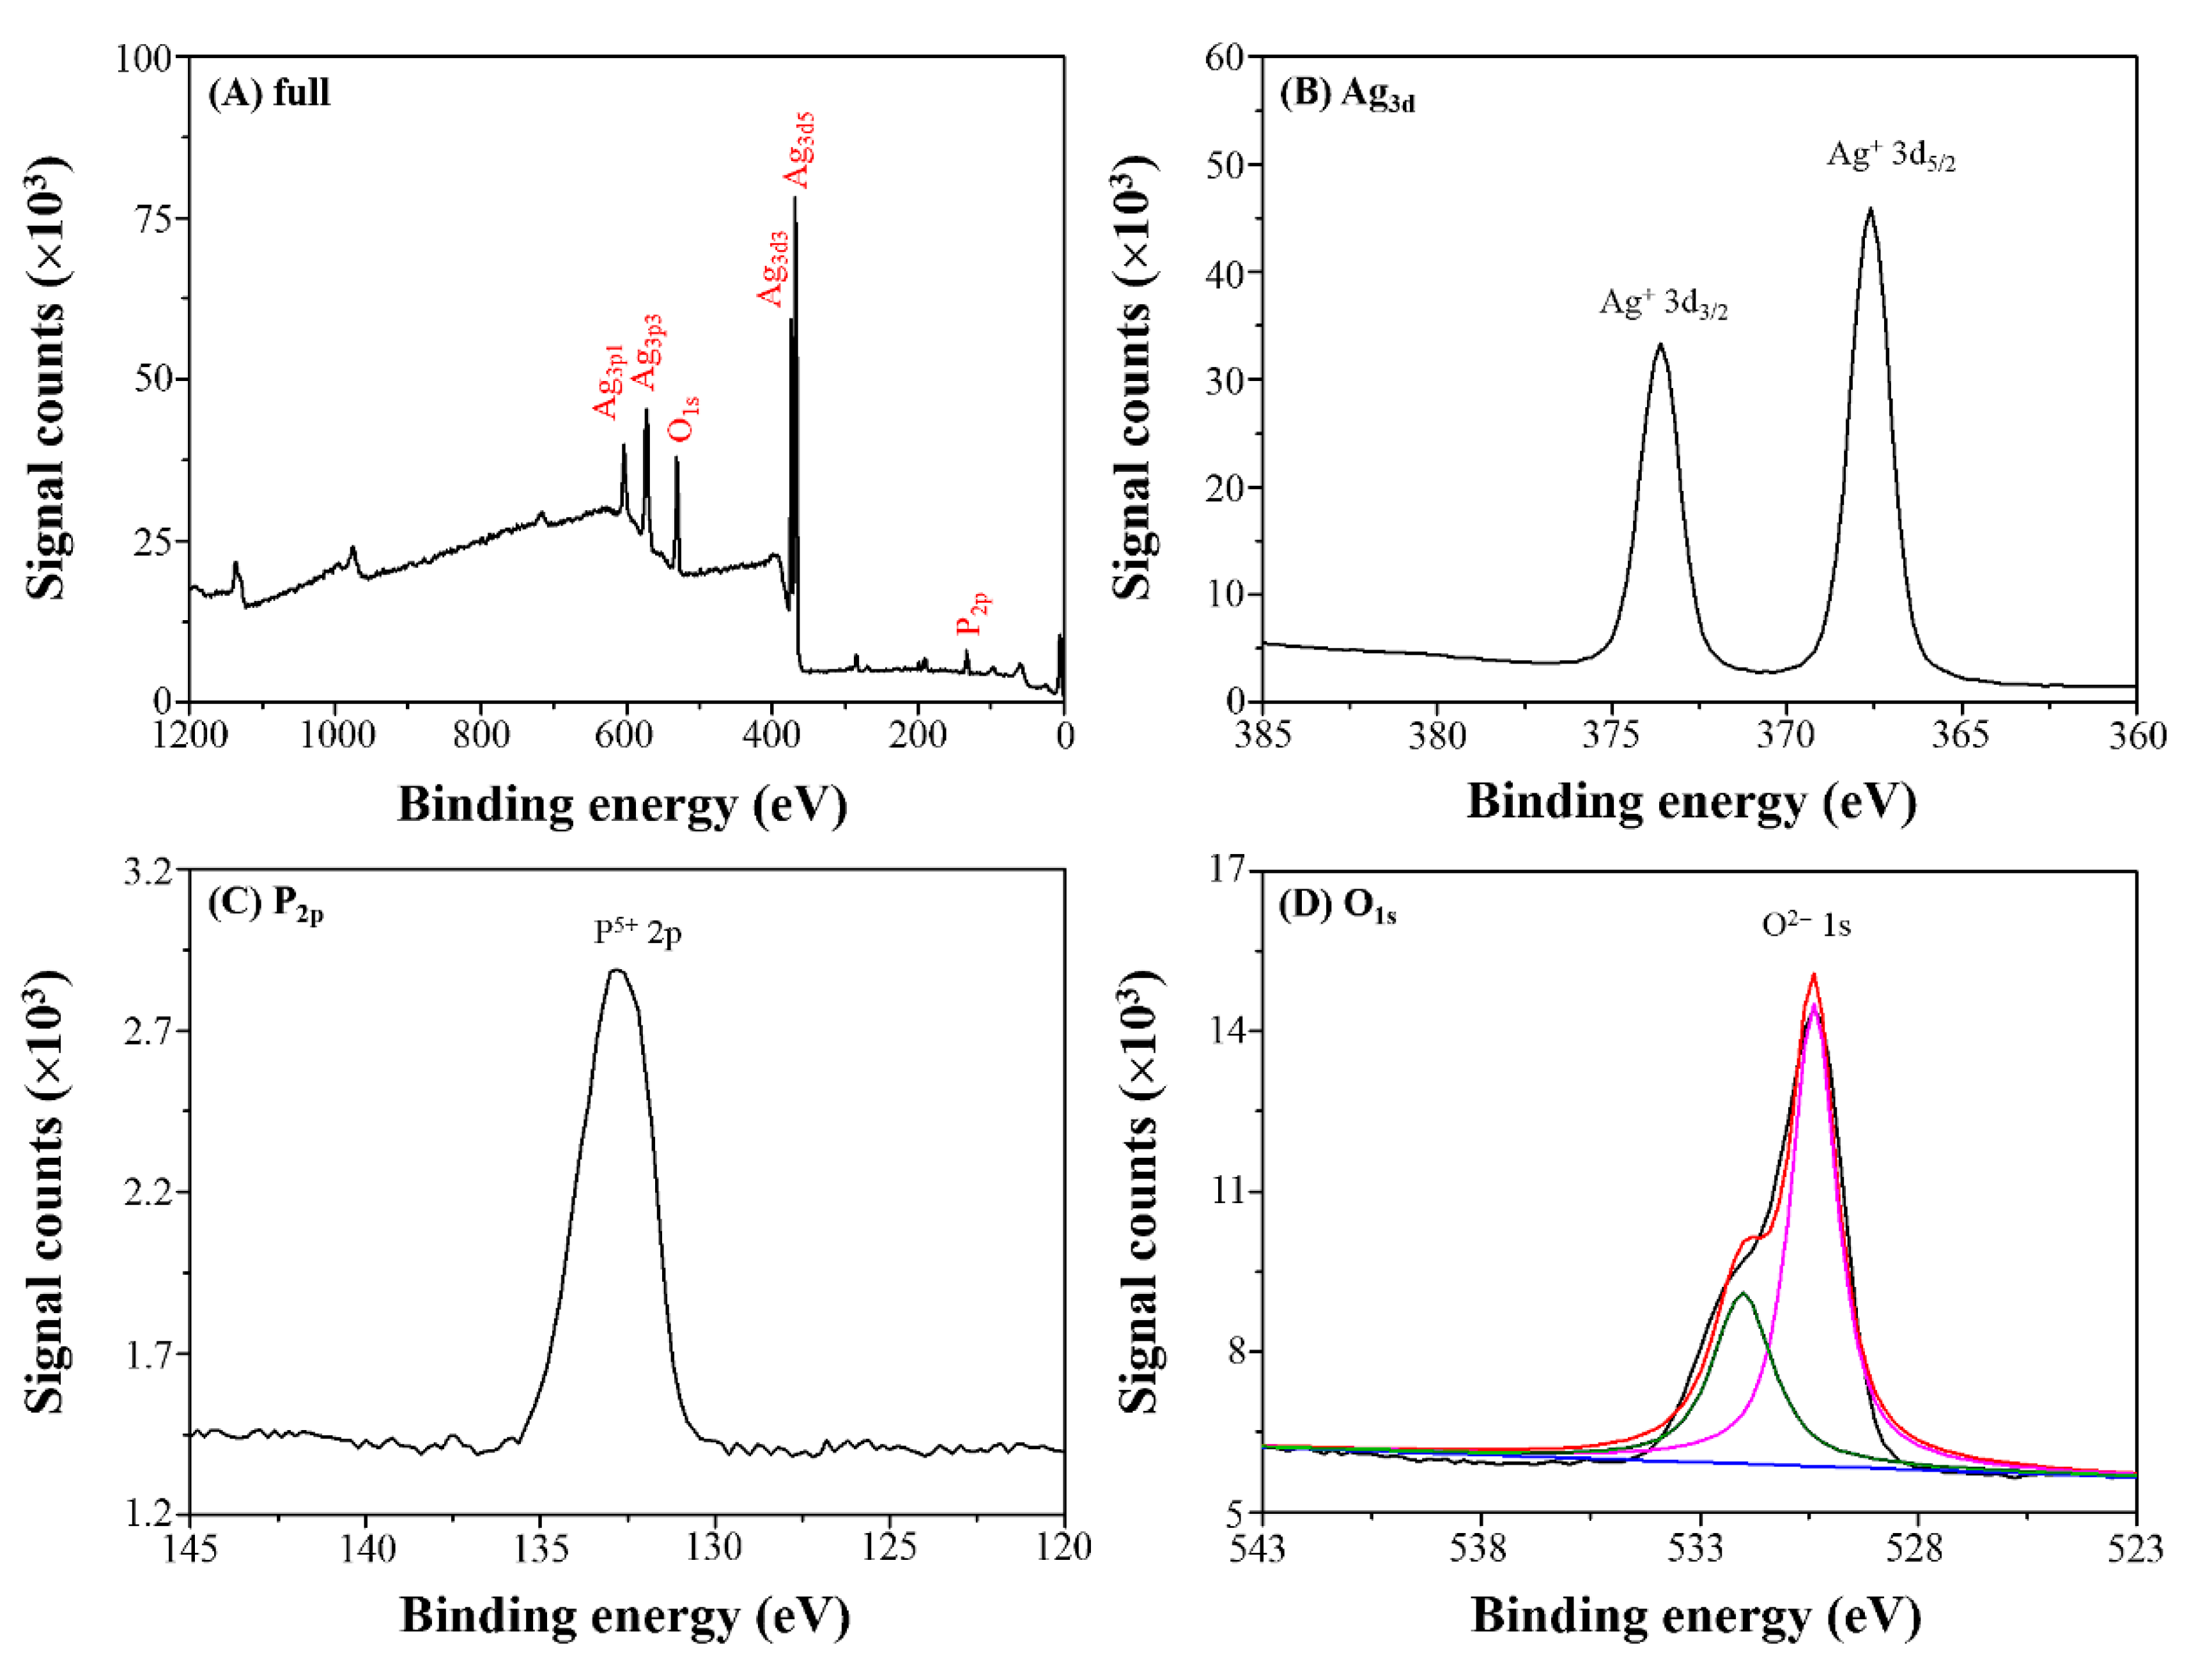
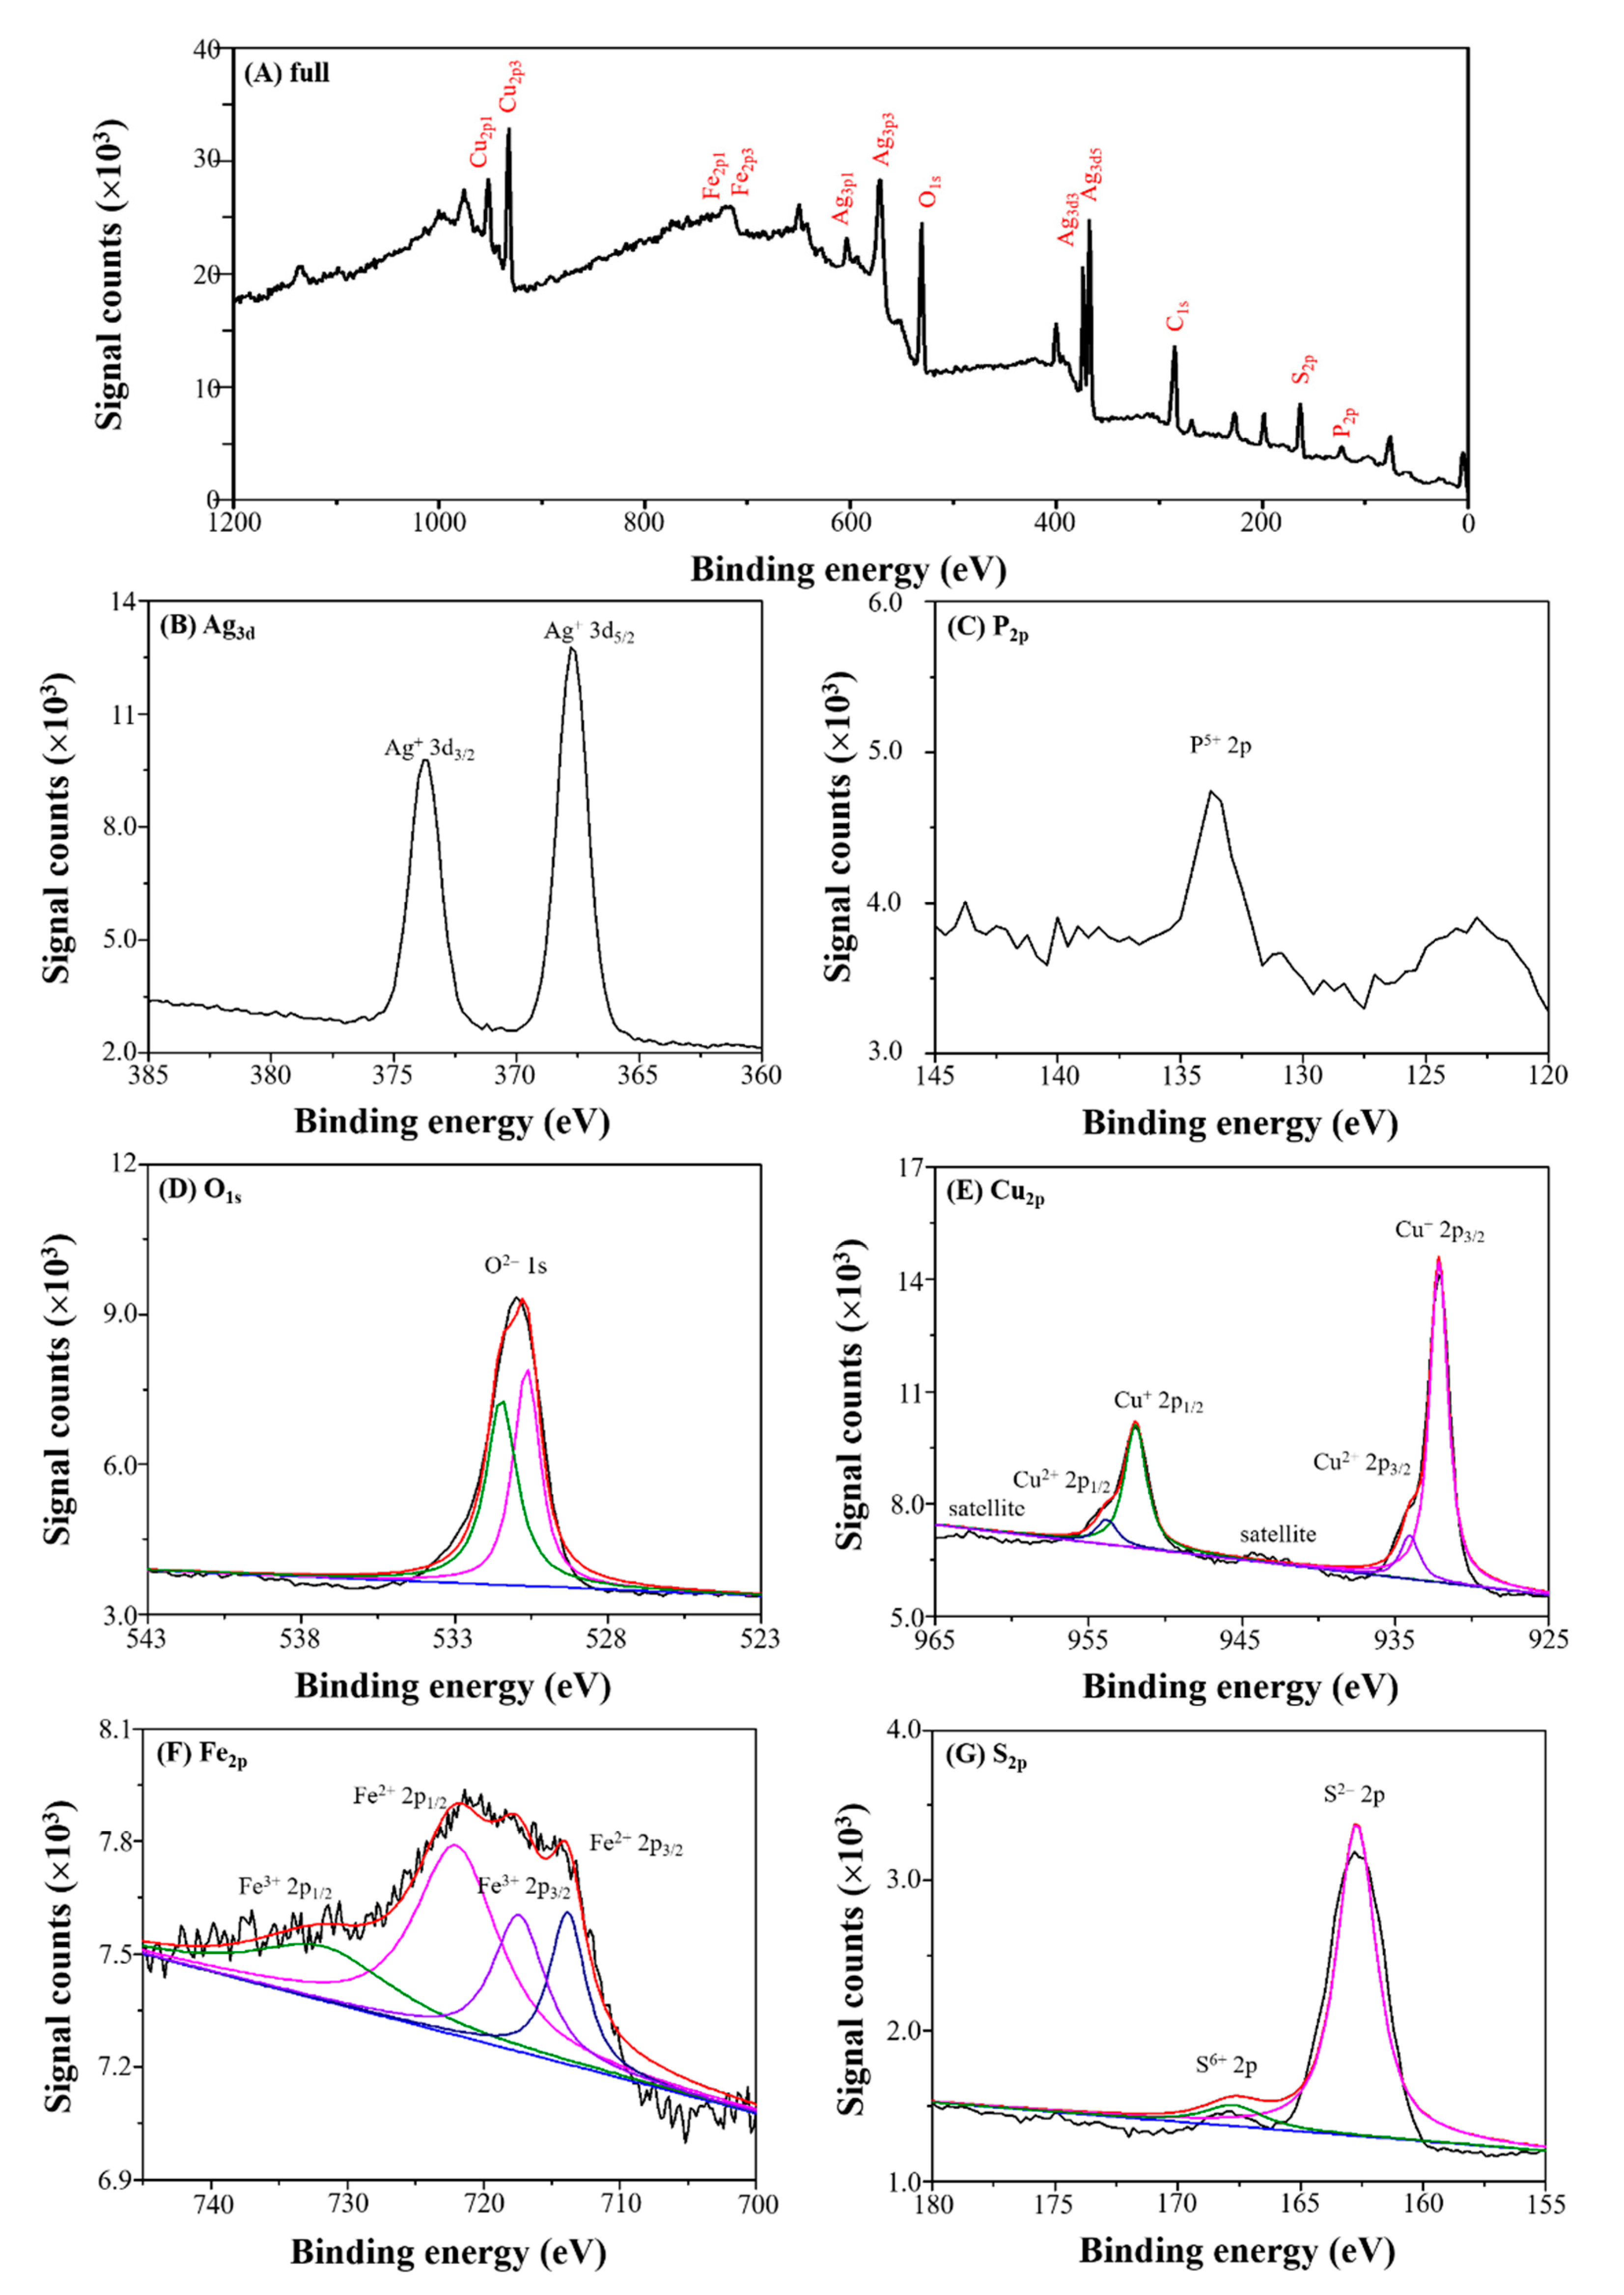
3.1. Morphology and Crystal Phase of Ag3PO4, CuFeS2, and CuFeS2/Ag3PO4

The morphology of the prepared Ag3PO4, CuFeS2, and CuFeS2/Ag3PO4 composites was analyzed through SEM and TEM (Figure 1). As shown in Figure 1, Ag3PO4 appears as tetrapod-like structures, with its four cylindrical arms being approximately 7–10 μm in length and with its average diameter being 2–3 μm. The CuFeS2 crystals appear irregular and sheet-like with sizes of 0.2–2 μm. As for the prepared Ag3PO4/CuFeS2 composites, CuFeS2 sheets were randomly deposited on the Ag3PO4 surface, and this deposition has no effect on the morphology and chemical composition of the Ag3PO4 particles. The corresponding magnified TEM image revealed clear lattice fringes with a d spacing of 0.249 and 0.312 nm, which are in good agreement with the (210) and (112) lattice planes of Ag3PO4 and CuFeS2, respectively. The energy dispersive spectrometer (EDS) spectra of the prepared Ag3PO4, CuFeS2, and CuFeS2/Ag3PO4 composites (Figure 2) confirm the presence of Ag, P, O, Cu, Fe, and S elements in their crystals accordingly. In addition, we also found C element in the presence of CuFeS2 and CuFeS2/Ag3PO4 composites. This is because we used L-cysteine precursor in the preparation of CuFeS2 and CuFeS2/Ag3PO4 composites.
The XRD spectra of the prepared Ag3PO4, CuFeS2, and CuFeS2/Ag3PO4 composites are displayed in Figure 3. From the black curve of Ag3PO4, the diffraction peaks at 21.5°, 30.1°, 33.4°, 36.7°, 42.5°, 48.7°, 53.6°, 55.3°, 57.5°, 62.4°, 65.1°, 70.7°, 72.2°, 74.6°, and 78.2° were identified and assigned to the (110), (200), (210), (211), (220), (310), (222), (320), (321), (400), (330), (420), (421), (332), and (442) faces of the cubic Ag3PO4, respectively (JCPDS No. 06-0505) [26]. The XRD pattern of CuFeS2 is presented in the red curve of Figure 3, and the diffraction peaks at 28.9°, 46.4°, and 56.2° corresponded well to the (112), (220), and (312) faces of the tetragonal chalcopyrite CuFeS2, respectively (JCPDS No. 01-0842) [27]. As a confirmation of good composite quality, the diffraction patterns of the prepared CuFeS2/Ag3PO4 composites match with the patterns of Ag3PO4 and CuFeS2. According to Scherer’s equation, the average crystallite size of Ag3PO4 and CuFeS2 was 55.8 and 43.5 nm, respectively. In addition, they did not change in the CuFeS2/Ag3PO4 composites (Ag3PO4: 57.0 nm, CuFeS2: 46.5 nm).

3.2. Optical Property of Ag3PO4, CuFeS2, and CuFeS2/Ag3PO4

The FT-IR spectra of the prepared Ag3PO4, CuFeS2, and CuFeS2/Ag3PO4 composites are shown in Figure 4. The IR spectrum for Ag3PO4 shows four major peaks located at 560, 1012, 1670, and 3200 cm−1, which corresponded to the PO43− stretching and O–H bending vibration, respectively. The O–H bending in the prepared Ag3PO4 may be attributed from Ag3PO4 adsorbed water from the air. For CuFeS2, it shows three peaks located at 1045, 1640, and 3400 cm−1, which corresponded to the C=S stretching and O–H bending vibration, respectively. The O–H bending in the prepared CuFeS2 may be attributed from CuFeS2 adsorbed water from the air. The C=S stretching in the prepared CuFeS2 may be attributed from the L-cysteine precursor. In addition, the EDS spectra for CuFeS2 and CuFeS2/Ag3PO4 composites also confirmed the presence of C element. For CuFeS2/Ag3PO4 composites, the spectrum exhibited PO43−, C=S, and O–H vibration peaks in the present on their crystals.
To study the optical absorption characteristics of the prepared Ag3PO4, CuFeS2, and CuFeS2/Ag3PO4 composites, UV–Vis DRS was performed, as shown in Figure 5. The absorption band-edge for Ag3PO4, CuFeS2 and CuFeS2/Ag3PO4 is at approximately 525, 427, and 487 nm, respectively. The bandgap energy (Eg) of Ag3PO4 is theoretically estimated to be 2.38 eV using the equation αhν = A(hν − Eg)n/2 (n = 1 for Ag3PO4). Furthermore, the band-edge potentials for the conduction band (CB) and valence band (VB) can be calculated as EVB = χ − EH + 0.5 Eg and ECB = EVB − Eg, respectively; here, χ is the electronegativity of the constituent atom (5.96 eV for Ag3PO4) and EH is the energy of the free electrons relative to the standard hydrogen reduction potential (approximately 4.5 eV). Thus, EVB and ECB of Ag3PO4 can be estimated to be 2.65 and 0.27 eV, respectively.
As another quality assurance method, the XPS analysis of the prepared Ag3PO4, CuFeS2, CuFeS2/Ag3PO4 composites (Figure 6, Figure 7 and Figure 8, full scan) revealed that the prepared composites contained their own elements: Ag, P, O, Cu, Fe, and S. High-resolution XPS revealed Ag3d, P2p, O1s, Cu2p, Fe2p, and S2p in CuFeS2/Ag3PO4 composites (Figure 8B–G, respectively). In Figure 8B, the binding energies are located at 367.8 and 373.3 eV, corresponding to Ag+ 3d5/2 and Ag+ 3d3/2, respectively. Furthermore, the peak at 132.9 eV correspond to P5+ 2p (Figure 8C). O 1s spectra can be deconvoluted into two component peaks of 531.8 and 530.7 eV (Figure 8D). The peak centered at 530.7 eV associated with the O2 in Ag3PO4. The other peak centered at 531.8 eV the presence of –OH group or a water molecule absorbed on the surface of the prepared composites. In Figure 8E, the peaks at 932.3, 934.2, 952.2, and 953.8 eV corresponded to Cu+ 2p3/2, Cu2+ 2p3/2, Cu+ 2p1/2, and Cu2+ 2p1/2, respectively. The peaks at 712.5, 718.2, 722.5, and 731.8 eV corresponded to Fe2+ 2p3/2, Fe3+ 2p3/2, Fe2+ 2p1/2 and Fe3+ 2p1/2, respectively (Figure 8F), whereas that at 162.5 and 167.8 eV corresponded to S2− 2p and S6+ 2p, respectively (Figure 8G).

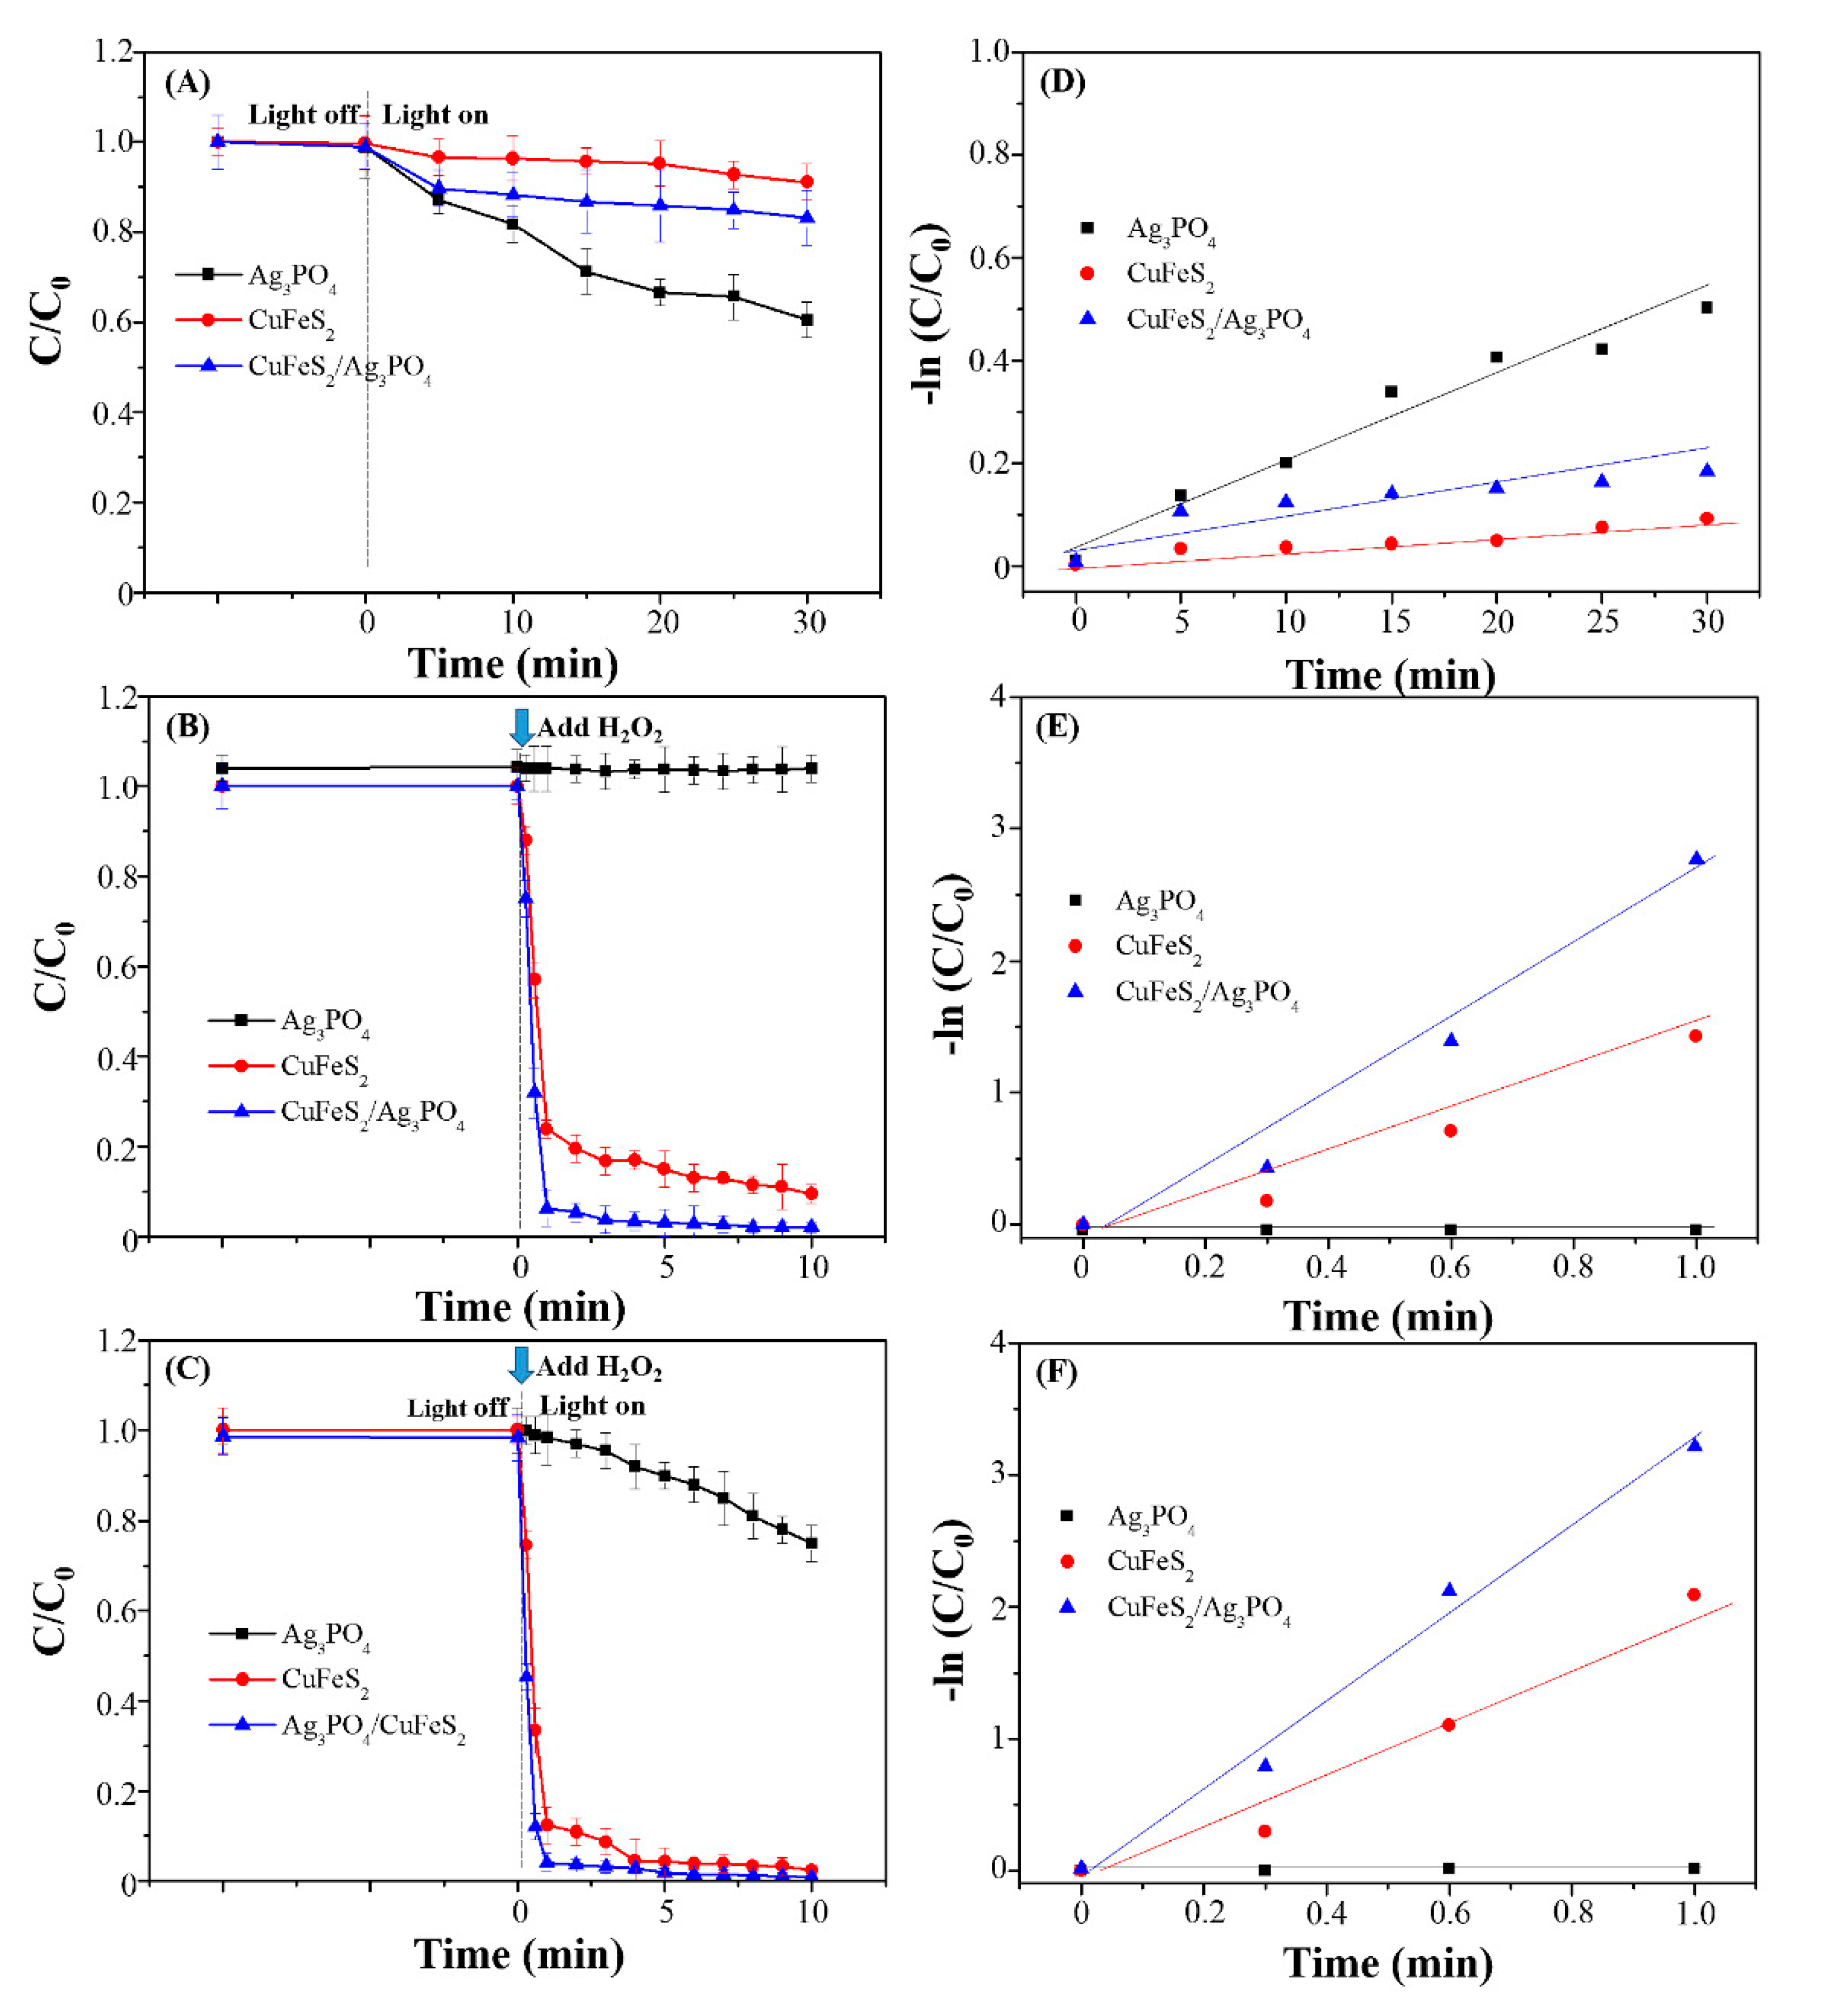
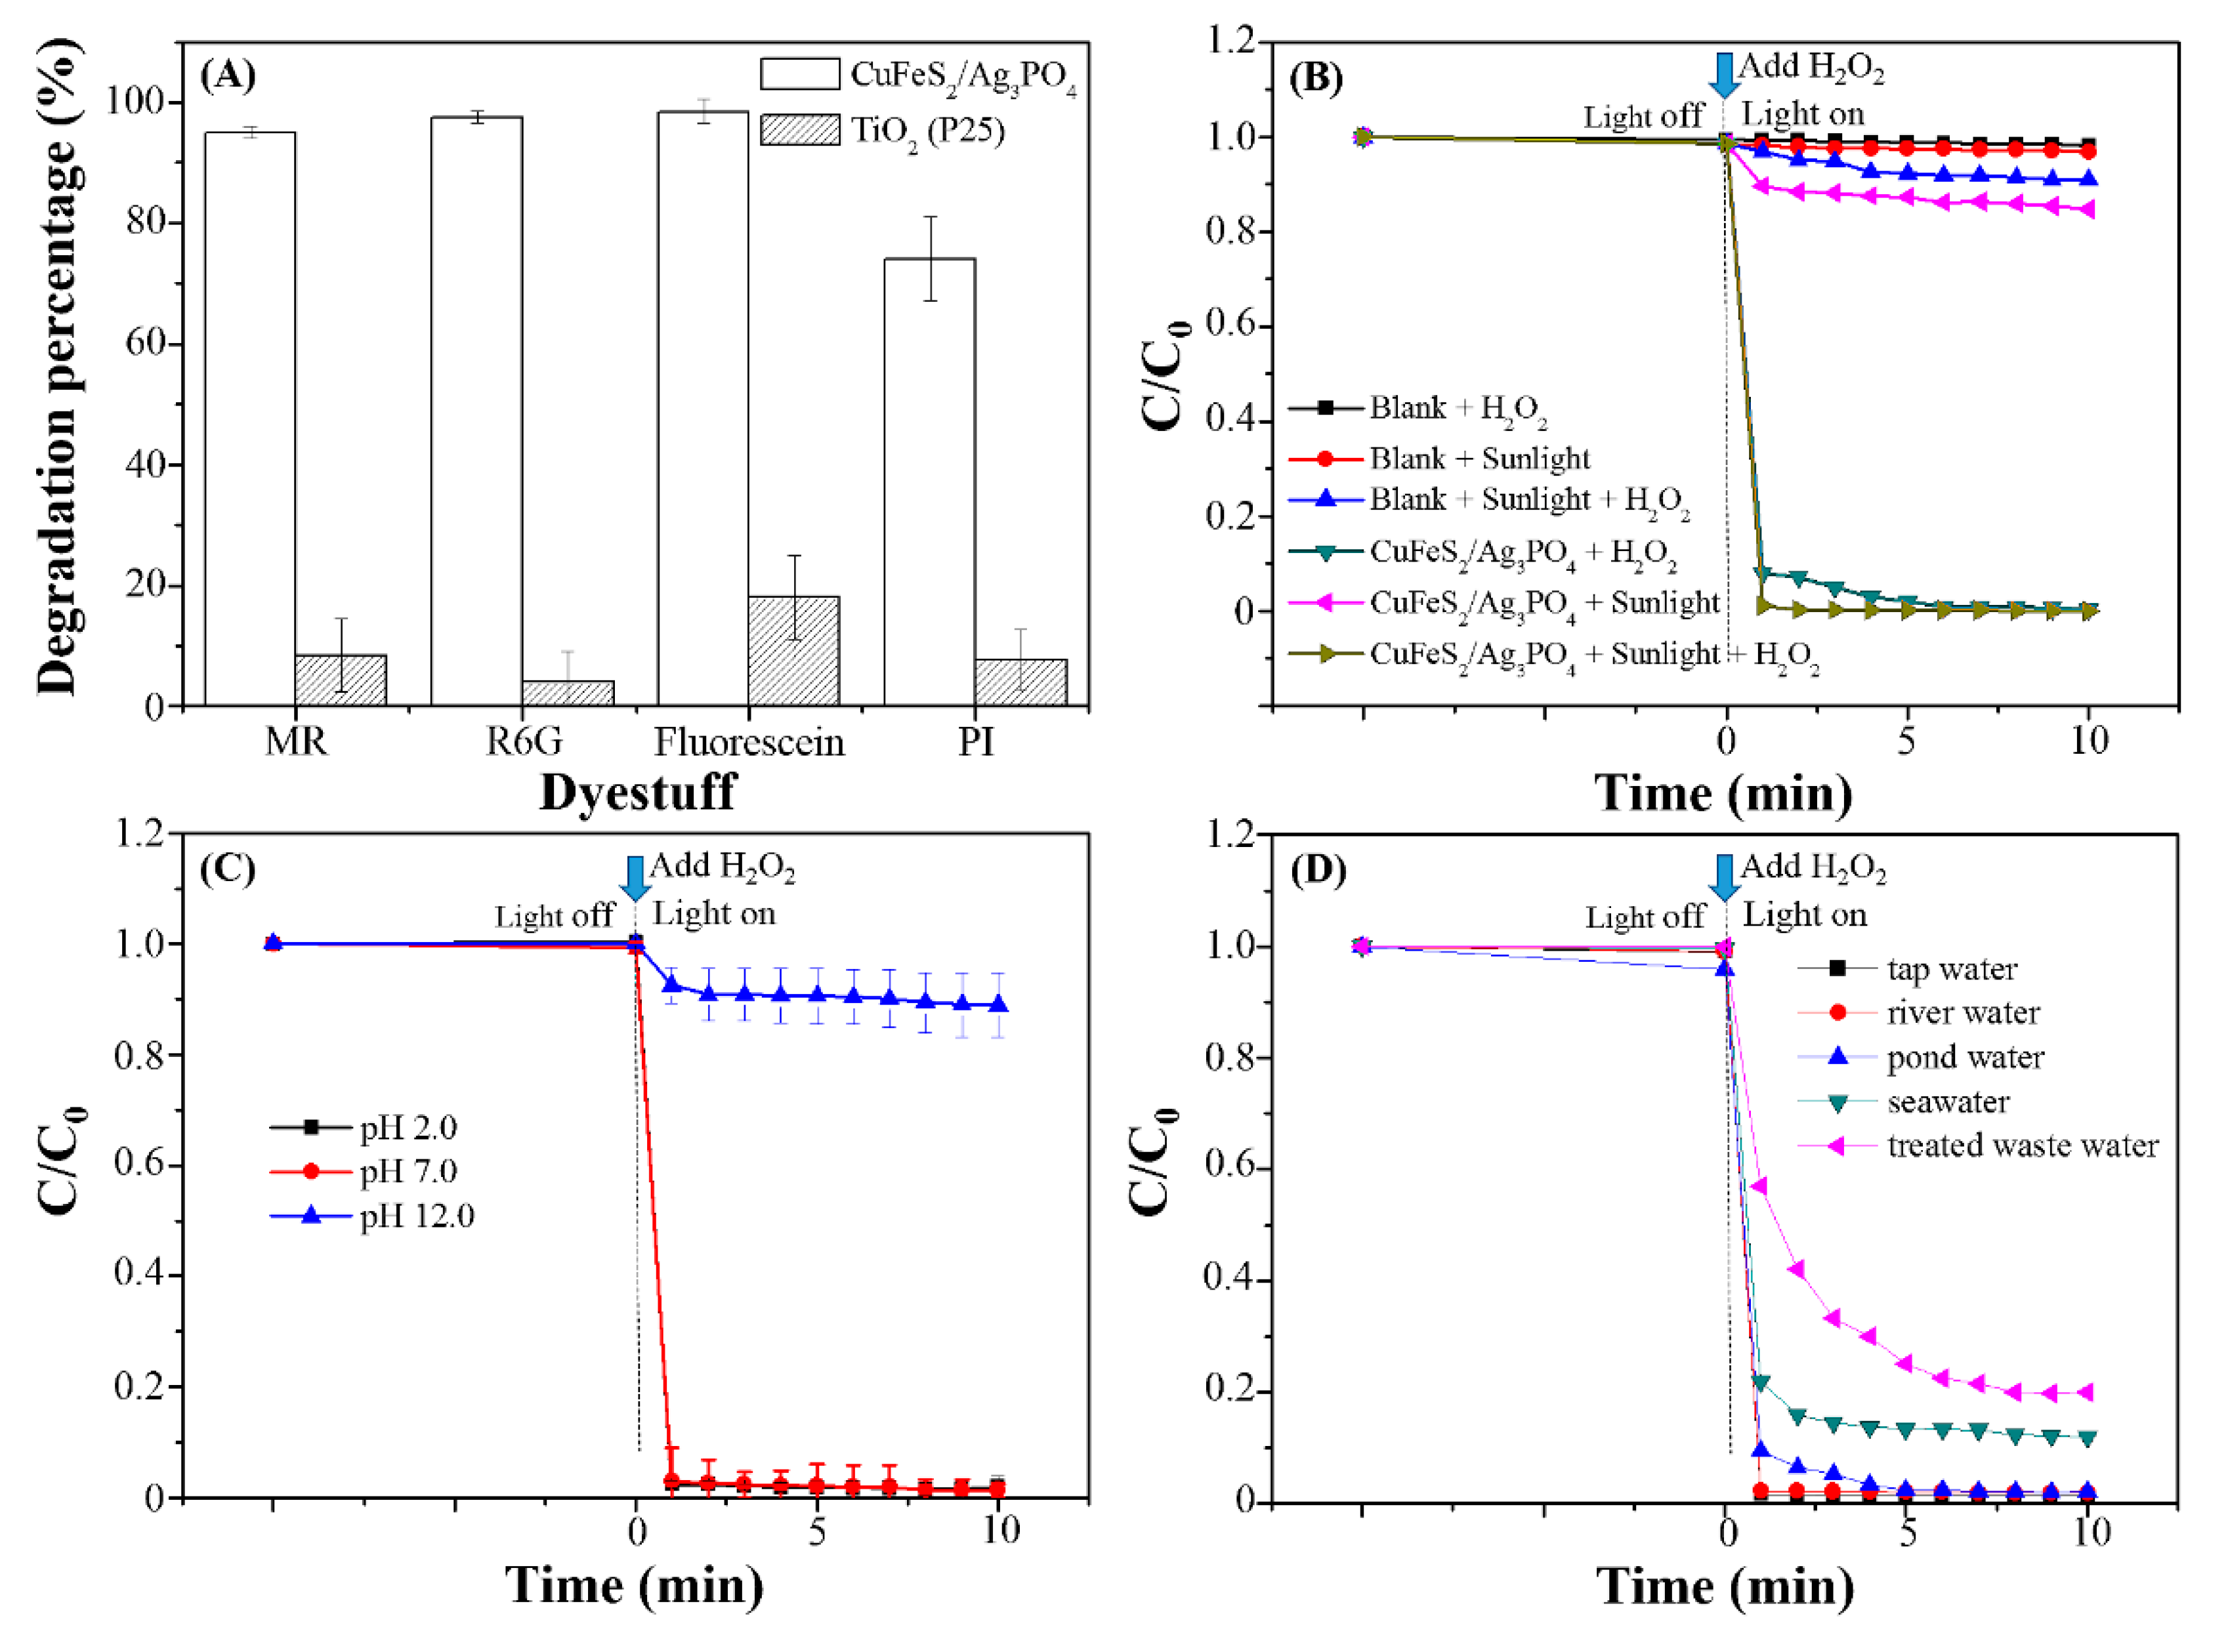
3.3. Degradation Performance of Ag3PO4, CuFeS2, and CuFeS2/Ag3PO4

To evaluate the degradation activity of the prepared Ag3PO4, CuFeS2, and CuFeS2/Ag3PO4 composites, RhB was selected as the target pollutant. Figure 9 shows the concentration ratio (C/C0, where C0 and C represented the RhB concentration at the initial condition and at time t, respectively) of RhB by using Ag3PO4, CuFeS2, and CuFeS2/Ag3PO4 composites under three different degradation conditions: photocatalytic, Fenton, and photo-Fenton. First, under 30 min LED light irradiation (Figure 9A), the degradation efficiencies of RhB in CuFeS2 and CuFeS2/Ag3PO4 are only 8.9% and 16.9%, respectively, whereas the efficiency reaches 39.5% in the presence of Ag3PO4. This suggests that the photocatalytic performance of Ag3PO4 is better than that of CuFeS2 and CuFeS2/Ag3PO4, attributable to the reactive radical formation from the effective photoinduced charge separation for RhB degradation. Nevertheless, these reactive radicals must be determined in a later experiment. CuFeS2/Ag3PO4 is responsive to visible light caused by its diluted amount of Ag3PO4, resulting in a weaker degradation performance than that of pure Ag3PO4. Second, the degradation efficiency of the prepared Ag3PO4, CuFeS2, and CuFeS2/Ag3PO4 composites through the Fenton reaction in the dark was studied (Figure 9B). The RhB concentration barely changes in the presence of Ag3PO4, but the RhB degradation efficiency reaches 76.1% and 93.7% within 1 min in the presence of CuFeS2 and CuFeS2/Ag3PO4, respectively. This is due to the production of hydroxyl radicals that degrade RhB from the oxidation of the Cu+/Fe2+ ions on the CuFeS2 to the formation of Cu2+/Fe3+ ions in the presence of H2O2. Finally, the degradation performance of the prepared Ag3PO4, CuFeS2, and CuFeS2/Ag3PO4 composites was evaluated with the photo-Fenton reaction in the presence of H2O2, and the results are shown in Figure 9C. The degradation efficiency of Ag3PO4 reaches 25% with a 10 min photo-Fenton reaction, whereas that of CuFeS2 reaches 87.7% within 1 min. Notably, the degradation efficiency of CuFeS2/Ag3PO4 reaches 96% within 1 min. Moreover, the relative standard deviation of the degradation performance for three different batches of the prepared composites was less than 9%, indicating the high reproducibility of the preparation methods for the proposed composites. In addition, we also analyzed the degradation performances of Cu2S, Fe2S3, Cu2S/Ag3PO4 and Fe2S3/Ag3PO4 composites. As shown in Figure 10, the RhB degradation efficiency reaches 75.2%, 86.5%, 81.4% and 90.4% within 1 min in the presence of Cu2S, Fe2S3, Cu2S/Ag3PO4 and Fe2S3/Ag3PO4, respectively. These results suggested that the addition of CuFeS2/Ag3PO4 promotes the production of hydroxyl radicals through the photo-Fenton reaction to degrade RhB at a higher efficiency than CuFeS2, Cu2S, Fe2S3 alone, indicating a synergistic effect between CuFeS2 and Ag3PO4. Figure 9D–F showed the corresponded pseudo-first order linear transform of RhB degradation under photocatalytic reaction, Fenton reaction and photo-Fenton reaction by Ag3PO4, CuFeS2, and CuFeS2/Ag3PO4 composites. The apparent rate constants for RhB degradation by Ag3PO4, CuFeS2, and CuFeS2/Ag3PO4 composites are listed in Table 1.
To maximize the degradation performance of CuFeS2/Ag3PO4, the following factors were systematically studied: the molar ratio of CuFeS2 to Ag3PO4, the mechanical mixing of CuFeS2 and Ag3PO4 particles, and the added amounts of H2O2 and CuFeS2/Ag3PO4. Figure 11A presents the plots of the RhB concentration ratio (C/C0) against the reaction time for CuFeS2/Ag3PO4 prepared at different precursor molar ratios from CuFeS2 to Ag3PO4. The degradation efficiency can be visually related to the highest drop in the RhB concentration ratio in the plots during the reaction. The higher molar ratio of the precursors used to make CuFeS2/Ag3PO4 resulted in higher degradation efficiency as the hydroxyl radicals generated from the photo-Fenton reaction dominated the RhB degradation. Above the 2.5:1 ratio, the suspension of excessive black CuFeS2 particles in the CuFeS2/Ag3PO4 solution was observed. This raised a concern as the excessive CuFeS2 particles were not coupled with Ag3PO4 during the synthesis, and they cannot be regenerated during the photolysis. CuFeS2/Ag3PO4 with the molar ratio of 2.5:1 was therefore selected as the optimal condition for this study. The second experiment was performed by mechanically mixing both CuFeS2 and Ag3PO4 particles with the molar ratio of 2.5:1 to prove the synergistic effect within CuFeS2/Ag3PO4 in the enhanced degradation activity (Figure 11B). The degradation efficiency for the mechanically mixed sample with 10 min photocatalytic, Fenton, and photo-Fenton reactions is 4.2%, 83.5%, and 87.7%, respectively—all evidently lower than that for composites formed with cyclic microwave heating (Figure 9). These results strongly suggest that the coupling interaction between CuFeS2 and Ag3PO4 is critical for the significantly enhanced degradation activity of CuFeS2/Ag3PO4 composites. Then, because the amount of H2O2 is key for the photo-Fenton reaction, its content in the degradation process may influence the performance of CuFeS2/Ag3PO4 composites. As shown in Figure 11C, the degradation efficiency increased with an increase in the H2O2 amount up to 200 μL, above which the degradation efficiency decreased, probably because excess reactive radicals react with one another. Thus, we selected 200 μL of H2O2 as the optimum required amount of H2O2. Then, the degradation efficiency at different amounts of CuFeS2/Ag3PO4 composites was evaluated. As shown in Figure 11D, the degradation efficiency increased with an increase in the CuFeS2/Ag3PO4 amount of up to 20 mg, above which the degradation efficiency plateaued. On the basis of this result, 20 mg of CuFeS2/Ag3PO4 was used for further investigations. Finally, the degradation efficiency for a higher RhB concentration at 20 mg CuFeS2/Ag3PO4 was evaluated. As shown in Figure 11E, the degradation efficiency at a higher RhB concentration decreased within 10 min of photo-Fenton reaction. However, the degraded RhB amount was higher at a higher RhB concentration. The results also indicated that the maximum degraded amount of RhB at 20 mg CuFeS2/Ag3PO4 was 54.9 ppm.
According to the literature, deethylation and chromophore cleavage are analogous competitive photodegradation reactions during the photocatalytic decomposition of organic pollutants. Based on the literature, the hypsochromic shifts (blue shift of the maximum absorption band) are attributed to the formation of a series of N-deethylated intermediates of RhB [31,32]. In this study, the absorption at 550 nm for RhB decreased with the increase in the reaction time and exhibited a slight hypochromic shift (dash line in Figure 12A). Therefore, a possible method to degrade RhB is through chromophore cleavage, which can be observed with an insignificant hypochromic shift in the UV–Vis spectra. Another approach to study organic compound degradation is to measure the TOC of the solution before and after the reaction. Figure 12B plots the temporal evolution of TOC content with RhB degradation by CuFeS2/Ag3PO4. Initially, the color vanished in the RhB solution with the photo-Fenton reaction for 1 min; the TOC content decreased to 13.5 ppm (decomposing only 2.17% of the original concentration (13.8 ppm)). The decomposition of RhB with CuFeS2/Ag3PO4 increased to as high as 78.3%, but only 3.0 ppm TOC remained in the solution with a 30 min photo-Fenton reaction. Evidence from both experimental approaches strongly supports RhB chromophore cleavage and CO2 production as the predominant pathways of degradation by CuFeS2/Ag3PO4.

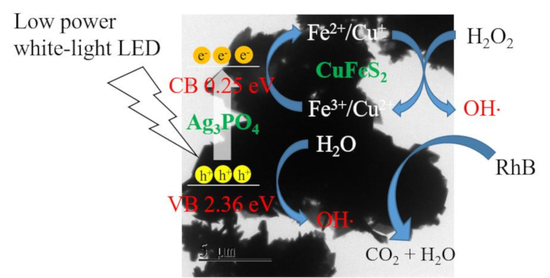
3.4. Degradation Mechanism of Ag3PO4, CuFeS2, and CuFeS2/Ag3PO4

In photodegradation, the rate and the stability of electron–hole pairs generated from the excitation source are critical factors to be considered in the development of ideal photocatalysts. In this study, the separation efficiency and recombination rate of the electron–hole pairs for the prepared Ag3PO4, CuFeS2, and CuFeS2/Ag3PO4 composites were investigated through photocatalytic degradation without any H2O2. Figure 13A shows the photocurrent density of Ag3PO4, CuFeS2, and CuFeS2/Ag3PO4 under LED light irradiation; all samples produced a sharp photocurrent peak on turning the light on and no peak as the light turned off, with photocurrent response during the on/off cycles. Under LED light irradiation, the current density decreased in the following order: Ag3PO4 > CuFeS2/Ag3PO4 > CuFeS2. This result is consistent with the photocatalytic degradation results shown in Figure 9A, indicating that the differences in the photodegradation activity was due to the differences in the optoelectrical properties of selected materials. In addition, the different noise levels and shape forms of the photocurrent density for different composites may be attributed to the different size and morphology of the composites deposited on the fluorine-doped tin oxide (FTO) substrates. As a further experiment, the intensity of PL emission for three materials was measured to quantify the recombination rate of the electron–hole pairs; a lower rate implies a lower luminescence emission intensity and higher photocatalytic activity. Figure 13B presents the PL emission spectra of the prepared Ag3PO4, CuFeS2, and CuFeS2/Ag3PO4 composites at λex = 250 nm. The emission intensity of CuFeS2 was the weakest due to the lowest yield of electron–hole pairs but not due to a low recombination rate. The difference in the emission intensity between Ag3PO4 and CuFeS2/Ag3PO4 is nonsignificant, indicating comparable electron–hole pair recombination rates. This demonstrates the ability of CuFeS2/Ag3PO4 to generate electron–hole pairs with a low recombination rate, providing critical information to understand the mechanism discussed later.
As a key mechanistic study, the active species involved in the degradation reaction were identified systematically using the free radical trapping experiments (Figure 14). EDTA, BQ, and t-BuOH were used as holes, oxygen radicals, and hydroxyl radical scavengers, respectively. After adding EDTA to the reaction mixture, RhB degradation in Ag3PO4 samples was inhibited, indicating that holes are the major species involved in the photo-Fenton degradation (Figure 14A). In contrast to the Ag3PO4 sample, RhB degradation in CuFeS2 and CuFeS2/Ag3PO4 composites with the photo-Fenton reaction was inhibited by adding t-BuOH, indicating that hydroxyl radicals are the major active species (Figure 14B,C).
Hydroxyl radical production was further detected using the fluorescent luminescence (FL) technique to study the photo-Fenton reaction. The FL emission spectra, excited at 370 nm in the coumarin solution in the absence and presence of the prepared samples, were evaluated for 10 min of irradiation. Figure 15 shows that an FL signal was observed at 460 nm for each sample and that the maximum FL intensity was observed in CuFeS2/Ag3PO4. This suggests that CuFeS2/Ag3PO4 produced the highest amount of hydroxyl radicals among these three materials, thereby leading to more chemical reactions with coumarin to generate fluorescence [33]. Hence, the hydroxyl radical was considered the direct reactive oxidation species in the CuFeS2/Ag3PO4 composites for RhB degradation. Moreover, CuFeS2/Ag3PO4 composites with maximal degradation activity produced excess reactive hydroxyl radicals than CuFeS2, which is consistent with the previously discussed results.
On the basis of the results described above, the degradation mechanisms of the Ag3PO4, CuFeS2, and CuFeS2/Ag3PO4 in the photo-Fenton reaction were proposed (Scheme 1). For Ag3PO4, the electron–hole pairs are generated under LED irradiation (Scheme 1A). The electrons could not form the oxygen radicals because of their higher position in the standard redox potential of oxygen/oxygen radical (0.13 V) than the CB potential (0.27 V). The photogenerated hole can produce the hydroxyl radical because the oxidation potential of the hydroxyl radical (1.99 V) is lower than the VB potential of Ag3PO4 (2.65 V). However, the recombination rate in Ag3PO4 is too fast to produce sufficient hydroxyl radicals by the holes. Thus, the holes are responsible for RhB degradation. The poor charge separation of CuFeS2 limits its ability to generate electron–hole pairs, but it is effective in generating hydroxyl radicals through the Fenton reaction (Scheme 1B). However, the Fenton reaction causes an increase in the oxidation state of Cu and Fe within the CuFeS2 solids, alters the crystal structure, and notably, weakens the integrity of the CuFeS2 solids. This is the main reason CuFeS2 is hardly reused in water treatment. When Ag3PO4 couples with CuFeS2 to form the CuFeS2/Ag3PO4 composites, the photogenerated electrons can be easily captured by the oxidized Fe3+/Cu2+ on the surface of CuFeS2, leading to the regeneration of Fe2+/Cu+ at the CuFeS2/Ag3PO4 interface (Scheme 1C). As a strong synergistic effect, the formation of hydroxyl radicals through the Fenton reaction on CuFeS2 and photogenerated hole on Ag3PO4 is favored to enhance the degradation activity and stability of CuFeS2/Ag3PO4 composites. In addition, we considered that the degradation mechanism for the prepared Fe2S3/Ag3PO4 and Cu2S/Ag3PO4 composites was similar to that of CuFeS2/Ag3PO4 composites. However, the degree of the charge separation efficiency, recombination rate of electron–hole pairs and the amount of the major reactive species were slight different, resulting in different degradation performance as shown in Figure 10.

3.5. Stability and Practical Applications of CuFeS2/Ag3PO4

The stability of the catalyst is an essential parameter for the development of practical water treatment applications. To investigate the stability of the prepared Ag3PO4, CuFeS2, and CuFeS2/Ag3PO4 composites, the results of cyclic RhB degradation tests were evaluated (shown in Figure 16A); in each cycle, RhB and H2O2 were reintroduced into the catalyst. In this study, RhB degradation by Ag3PO4 and CuFeS2/Ag3PO4 after ten cycles maintained a similar degradation efficiency (15.3% to 14% after ten cycles for Ag3PO4; 99.6% to 91.3% after ten cycles for CuFeS2/Ag3PO4), whereas that by CuFeS2 resulted in a considerable loss of efficiency (from 97.5% to 15.0% after ten cycles). Furthermore, the corresponding XRD results (Figure 16B) suggest a negligible change in the phase structure of Ag3PO4 and CuFeS2/Ag3PO4 samples after the repeated reactions, indicating the good stability of the samples. However, the initial phase structure of CuFeS2 disappeared after three reaction cycles. The SEM image shown in Figure 16D displays that the morphology of the CuFeS2 sample changed from an irregular sheet to spherical shape, indicating that the Fenton reaction caused structural and chemical change for CuFeS2 when it is used alone. Unlike CuFeS2, the comparison of SEM images for Ag3PO4 and CuFeS2/Ag3PO4 composites before and after reaction cycles only showed a slight change of morphology (Figure 16C,E). Evidently, the stability of CuFeS2 in the CuFeS2/Ag3PO4 composite improved considerably because of its coupling with Ag3PO4 nanoparticles as the photogenerated electrons in the CB of Ag3PO4 reduce Fe3+/Cu2+ ions and keep them intact in CuFeS2/Ag3PO4. This prevented the structural disintegration of CuFeS2 during the Fenton reaction, effectively demonstrating its reusability for catalysis.
To assess the practical applications of CuFeS2/Ag3PO4, various organic dyes (MR, M6G, fluorescein, and PI) were degraded (Figure 17A). Compared with TiO2 (P25), CuFeS2/Ag3PO4 exhibited excellent degradation efficiency toward all selected dyestuffs, with nearly 95% degradation achieved within 10 min (except PI with only 78.5% degradation efficiency). In addition, the degradation performance of CuFeS2/Ag3PO4 under sunlight irradiation was evaluated from November to December 2019 from 11:00 a.m. to 2:00 p.m. daily at the National Changhua University of Education, Changhua, Taiwan. As shown in Figure 17B, sunlight-induced RhB degradation in the absence and presence of CuFeS2/Ag3PO4 was very poor without H2O2. However, using the sunlight-assisted Fenton reaction for RhB degradation achieved nearly 98.9% degradation efficiency within 1 min. This is because the combined UV and visible light in sunlight hastened the production of hydroxyl radicals in the presence of H2O2 and CuFeS2/Ag3PO4. With the promise of the sunlight-assisted Fenton reaction, the pH effect in the water samples on the degradation performance of CuFeS2/Ag3PO4 was also investigated. As shown in Figure 17C, the degradation efficiency decreased at pH 12.0 because the Fenton reaction was considerably hindered at a high pH as Fe2+ cations form inactive porphyrin ferryl complexes (FeO2+) in the alkaline solution [24]. Finally, the prepared CuFeS2/Ag3PO4 composites were used to degrade RhB in the environmental water samples (Figure 17D). CuFeS2/Ag3PO4 exhibited excellent degradation efficiency through the photo-Fenton reaction for RhB degradation, with nearly 90% degradation within 1 min. A notable difference in the degradation time for RhB was observed for the seawater and treated wastewater samples (90% and 80% degradation within 10 min, respectively) compared with the other environmental water samples (100% degradation within 10 min) probably because of the presence of anions or radical scavengers in the seawater and treated wastewater samples that reduced the degradation activity of CuFeS2/Ag3PO4. Nevertheless, the studies on the environmental water samples strongly support the benefits of this newly developed CuFeS2/Ag3PO4-based photo-Fenton water treatment option.

4. Conclusions

The currently prepared CuFeS2/Ag3PO4 composites exhibited higher RhB degradation efficiency through the photo-Fenton reaction than did Ag3PO4 and CuFeS2 alone. This high enhancement in the degradation efficiency was attributed to the synergistic effect in material stability and the hydroxyl radical production. The constituent Ag3PO4 in the newly developed composite not only provides the visible-light absorption ability in degrading organic compounds but also acts as a rich electron source to stabilize the crystal structure of CuFeS2 under light irradiation. Consequently, Cu2+/Fe3+ ions produced by the Fenton reaction can be reduced and regenerated into Cu+/Fe2+ ions, and the reactive hydroxyl radicals partially from the photogenerated holes of Ag3PO4 and predominantly from the Fenton reaction of CuFeS2 can be continuously produced to degrade organic compounds. The CuFeS2/Ag3PO4 composite has several attractive features not realized in the other reported photo-Fenton reactions (Table 2). First, the prepared CuFeS2/Ag3PO4 composite had 96% RhB degradation performance under low-power white LED illumination within 1 min. In addition, various dyestuffs (MR, R6G, fluorescein, and PI) with 95% degradation efficiency could be achieved. Through sunlight-assisted Fenton reaction, the RhB degradation efficiency was further improved to 98.9%. For the recycling used ability, the CuFeS2/Ag2PO4 composite is stable enough to be reused through the input of sustainable energy source. Hence, this study discovered the synergistic catalysis CuFeS2/Ag3PO4 and successfully demonstrates the application of the sunlight-assisted Fenton reaction on environmental water samples. The current findings can be used for the applications of advanced oxidation technology in wastewater treatment in the future.

Author Contributions

Conceptualization, S.-A.C. and Y.-W.L.; methodology, Y.-W.L.; software, Y.-W.L.; validation, S.-A.C., and T.W.; formal analysis, S.-A.C. and Y.-W.L.; investigation, S.-A.C.; resources, Y.-W.L.; data curation, S.-A.C. and P.-Y.W.; writing—original draft preparation, Y.-W.L.; writing—review and editing, T.W. and Y.-W.L.; visualization, Y.-W.L.; supervision, Y.-W.L.; project administration, Y.-W.L.; funding acquisition, Y.-W.L. All authors have read and agreed to the published version of the manuscript.

Funding

This study was supported by the Ministry of Science and Technology of Taiwan under contract (MOST 109-2113-M-018-002).

Conflicts of Interest

The authors declare no conflict of interest.

References

  1. Fernandez-Llamazares, A.; Garteizgogeascoa, M.; Basu, N.; Brondizio, E.S.; Cabeza, M.; Martinez-Alier, J.; McElwee, P.; Reyes-Garcia, V. A state-of-the-art review of indigenous peoples and environmental pollution. Integr. Environ. Assess. Manag. 2020, 16, 324–341. [Google Scholar] [CrossRef] [PubMed] [Green Version]
  2. Kurwadkar, S. Occurrence and distribution of organic and inorganic pollutants in groundwater. Water Environ. Res. 2019, 91, 1001–1008. [Google Scholar] [CrossRef] [PubMed] [Green Version]
  3. Rasheed, T.; Bilal, M.; Nabeel, F.; Adeel, M.; Iqbal, H.M.N. Environmentally-related contaminants of high concern: Potential sources and analytical modalities for detection, quantification, and treatment. Environ. Int. 2019, 122, 52–66. [Google Scholar] [CrossRef] [PubMed]
  4. Muszynski, P.; Brodowska, M.S.; Paszko, T. Occurrence and transformation of phenoxy acids in aquatic environment and photochemical methods of their removal: A review. Environ. Sci. Pollut. Res. 2020, 27, 1276–1293. [Google Scholar] [CrossRef] [PubMed] [Green Version]
  5. Taghipour, S.; Hosseini, S.M.; Ataie-Ashtiani, B. Engineering nanomaterials for water and wastewater treatment: Review of classifications, properties and applications. New J. Chem. 2019, 43, 7902–7927. [Google Scholar] [CrossRef]
  6. Javaid, R.; Qazi, U.Y. Catalytic oxidation process for the degradation of synthetic dyes: An overview. Int. J. Environ. Res. Public Health 2019, 16, 2066. [Google Scholar] [CrossRef] [Green Version]
  7. Singh, P.; Borthakur, A. A review on biodegradation and photocatalytic degradation of organic pollutants: A bibliometric and comparative analysis. J. Clean Prod. 2018, 196, 1669–1680. [Google Scholar] [CrossRef]
  8. Wang, J.M.; Shih, Y.E.; Wang, P.Y.; Yu, Y.H.; Su, J.F.; Huang, C.P. Hazardous waste treatment technologies. Water Environ. Res. 2019, 91, 1177–1198. [Google Scholar] [CrossRef]
  9. Riaz, S.; Park, S.J. An overview of TiO2-based photocatalytic membrane reactors for water and wastewater treatments. J. Ind. Eng. Chem. 2020, 84, 23–41. [Google Scholar] [CrossRef]
  10. Al-Mamun, M.R.; Kader, S.; Islam, M.S.; Khan, M.Z.H. Photocatalytic activity improvement and application of UV-TiO2 photocatalysis in textile wastewater treatment: A review. J. Environ. Chem. Eng. 2019, 7, 103248. [Google Scholar] [CrossRef]
  11. Kanan, S.; Moyet, M.A.; Arthur, R.B.; Patterson, H.H. Recent advances on TiO2-based photocatalysts toward the degradation of pesticides and major organic pollutants from water bodies. Catal. Rev. Sci. Eng. 2020, 62, 1–65. [Google Scholar] [CrossRef]
  12. Tsang, C.H.A.; Li, K.; Zeng, Y.X.; Zhao, W.; Zhang, T.; Zhan, Y.J.; Xie, R.J.; Leung, D.Y.C.; Huang, H.B. Titanium oxide based photocatalytic materials development and their role of in the air pollutants degradation: Overview and forecast. Environ. Int. 2019, 125, 200–228. [Google Scholar] [CrossRef] [PubMed]
  13. Wetchakun, K.; Wetchakun, N.; Sakulsermsuk, S. An overview of solar/visible light-driven heterogeneous photocatalysis for water purification: TiO2- and ZnO-based photocatalysts used in suspension photoreactors. J. Ind. Eng. Chem. 2019, 71, 19–49. [Google Scholar] [CrossRef]
  14. Morales, M.A.; Fernandez-Cervantes, I.; Agustin-Serrano, R.; Ruiz-Salgado, S.; Sampedro, M.P.; Varela-Caselis, J.L.; Portillo, R.; Rubio, E. Ag3PO4 microcrystals with complex polyhedral morphologies diversity obtained by microwave-hydrothermal synthesis for MB degradation under sunlight. Results Phys. 2019, 12, 1344–1356. [Google Scholar] [CrossRef]
  15. Zhang, J.; Liu, X.; Liu, Q.W.; Licao, Y.Q.; Liu, G.D.; Shi, X.H. Z-scheme AgSCN/Ag3PO4/C3N4 heterojunction with excellent photocatalytic degradation of ibuprofen. Ceram. Int. 2020, 46, 106–113. [Google Scholar] [CrossRef]
  16. Ge, M.; Li, Z.L. Recent progress in Ag3PO4-based all-solid-state Z-scheme photocatalytic systems. Chin. J. Catal. 2017, 38, 1794–1803. [Google Scholar] [CrossRef]
  17. Bi, Z.H.; Li, Z.H.; Yan, L.F. Catalytic oxidation of lignin to dicarboxylic acid over the CuFeS2 nanoparticle catalyst. Green Process. Synth. 2018, 7, 306–315. [Google Scholar] [CrossRef]
  18. Labiadh, L.; Ammar, S.; Karnali, A.R. Oxidation/mineralization of AO7 by electro-Fenton process using chalcopyrite as the heterogeneous source of iron and copper catalysts with enhanced degradation activity and reusability. J. Electroanal. Chem. 2019, 853, 113532. [Google Scholar] [CrossRef]
  19. Ltaief, A.H.; Pastrana-Martinez, L.M.; Ammar, S.; Gadri, A.; Faria, J.L.; Silva, A.M.T. Mined pyrite and chalcopyrite as catalysts for spontaneous acidic pH adjustment in Fenton and LED photo-Fenton-like processes. J. Chem. Technol. Biotechnol. 2018, 93, 1137–1146. [Google Scholar] [CrossRef]
  20. Nie, W.S.; Mao, Q.H.; Ding, Y.B.; Hu, Y.; Tang, H.Q. Highly efficient catalysis of chalcopyrite with surface bonded ferrous species for activation of peroxymonosulfate toward degradation of bisphenol A: A mechanism study. J. Hazard. Mater. 2019, 364, 59–68. [Google Scholar] [CrossRef]
  21. Xu, X.J.; Tang, D.D.; Cai, J.H.; Xi, B.D.; Zhang, Y.; Pi, L.; Mao, X.H. Heterogeneous activation of peroxymonocarbonate by chalcopyrite (CuFeS2) for efficient degradation of 2,4-dichlorophenol in simulated groundwater. Appl. Catal. B Environ. 2019, 251, 273–282. [Google Scholar] [CrossRef]
  22. Zhu, Y.P.; Zhu, R.L.; Xi, Y.F.; Zhu, J.X.; Zhu, G.Q.; He, H.P. Strategies for enhancing the heterogeneous Fenton catalytic reactivity: A review. Appl. Catal. B Environ. 2019, 255, 117739. [Google Scholar] [CrossRef]
  23. Zhang, M.H.; Dong, H.; Zhao, L.; Wang, D.X.; Meng, D. A review on Fenton process for organic wastewater treatment based on optimization perspective. Sci. Total Environ. 2019, 670, 110–121. [Google Scholar] [CrossRef] [PubMed]
  24. Salla, J.D.; Martinello, K.D.; Dotto, G.L.; Garcia-Diaz, E.; Javed, H.; Alvarez, P.J.J.; Foletto, E.L. Synthesis of citrate-modified CuFeS2 catalyst with significant effect on the photo-Fenton degradation efficiency of bisphenol a under visible light and near-neutral pH. Colloid Surf. A Physicochem. Eng. Asp. 2020, 595, 124679. [Google Scholar] [CrossRef]
  25. Zhang, J.B.; Sun, X.H.; Gao, Q.J.; Wang, H.X.; Liang, D.X.; Liu, Z.M.; Han, G.T.; Jiang, W. Degradation of organic dyes over regenerative Fe3O4/CuFeS2/biomass composite column. Chem. J. Chin. Univ. Chin. 2019, 40, 425–430. [Google Scholar]
  26. Wei, T.T.; Wu, T.; Lin, Y.W. Controlled synthesis of Ag3PO4 microparticles with different morphologies and their photocatalytic degradation of rhodamine B under white light-emitting diode irradiation. Micro Nano Lett. 2019, 14, 363–366. [Google Scholar] [CrossRef]
  27. Rajaji, U.; Murugan, K.; Chen, S.M.; Govindasamy, M.; Chen, T.W.; Lin, P.H.; Prabha, P.L. Graphene oxide encapsulated 3D porous chalcopyrite (CuFeS2) nanocomposite as an emerging electrocatalyst for agro-hazardous (methyl paraoxon) detection in vegetables. Compos. Part B Eng. 2019, 160, 268–276. [Google Scholar] [CrossRef]
  28. Wang, C.Y.; Wu, T.H.; Lin, Y.W. Preparation and characterization of bismuth oxychloride/reduced graphene oxide for photocatalytic degradation of rhodamine B under white-light light-emitting-diode and sunlight irradiation. J. Photochem. Photobiol. A Chem. 2019, 371, 355–364. [Google Scholar] [CrossRef]
  29. Huang, C.W.; Wu, M.Y.; Lin, Y.W. Solvothermal synthesis of Ag hybrid BiPO4 heterostructures with enhanced photodegradation activity and stability. J. Colloid Interface Sci. 2017, 490, 217–225. [Google Scholar] [CrossRef]
  30. Huang, C.K.; Wu, T.; Huang, C.W.; Lai, C.Y.; Wu, M.Y.; Lin, Y.W. Enhanced photocatalytic performance of BiVO4 in aqueous AgNO3 solution under visible light irradiation. Appl. Surf. Sci. 2017, 399, 10–19. [Google Scholar] [CrossRef]
  31. Hu, X.F.; Mohamood, T.; Ma, W.H.; Chen, C.C.; Zhao, J.C. Oxidative decomposition of rhodamine B dye in the presence of VO2+ and/or Pt(IV) under visible light irradiation: N-deethylation, chromophore cleavage, and mineralization. J. Phys. Chem. B 2006, 110, 26012–26018. [Google Scholar] [CrossRef] [PubMed]
  32. Qu, P.; Zhao, J.C.; Shen, T.; Hidaka, H. TiO2-assisted photodegradation of dyes: A study of two competitive primary processes in the degradation of RB in an aqueous TiO2 colloidal solution. J. Mol. Catal. A Chem. 1998, 129, 257–268. [Google Scholar] [CrossRef]
  33. Huang, T.Y.; Chen, Y.J.; Lai, C.Y.; Lin, Y.W. Synthesis, characterization, enhanced sunlight photocatalytic properties, and stability of Ag/Ag3PO4 nanostructure-sensitized BiPO4. RSC Adv. 2015, 5, 43854–43862. [Google Scholar] [CrossRef]
  34. Bansal, P.; Verma, A.; Mehta, C.; Sangal, V.K. Potential use of waste foundry sand in dual process (photocatalysis and photo-Fenton) for the effective removal of phenazone from water: Slurry and fixed-bed approach. J. Environ. Manag. 2019, 233, 793–801. [Google Scholar] [CrossRef] [PubMed]
  35. Bansal, P.; Verma, A. N, Ag co-doped TiO2 mediated modified in-situ dual process (modified photocatalysis and photo-Fenton) in fixed-mode for the degradation of Cephalexin under solar irradiations. Chemosphere 2018, 212, 611–619. [Google Scholar] [CrossRef] [PubMed]
  36. Bansal, P.; Verma, A. Synergistic effect of dual process (photocatalysis and photo-Fenton) for the degradation of Cephalexin using TiO2 immobilized novel clay beads with waste fly ash/foundry sand. J. Photochem. Photobiol. A Chem. 2017, 342, 131–142. [Google Scholar] [CrossRef]
  37. Lima, M.J.; Silva, C.G.; Silva, A.M.T.; Lopes, J.C.B.; Dias, M.M.; Faria, J.L. Homogeneous and heterogeneous photo-Fenton degradation of antibiotics using an innovative static mixer photoreactor. Chem. Eng. J. 2017, 310, 342–351. [Google Scholar] [CrossRef]
Figure 1. SEM and TEM images of (A) Ag3PO4; (B) CuFeS2; and (C) CuFeS2/Ag3PO4 composites.
Nanomaterials 10 02300 g001
Figure 2. EDS spectra of (A) Ag3PO4; (B) CuFeS2; and (C) CuFeS2/Ag3PO4 composites.
Nanomaterials 10 02300 g002
Figure 3. XRD patterns of different samples: Ag3PO4 (black); CuFeS2 (red); and CuFeS2/Ag3PO4 composites (blue).
Nanomaterials 10 02300 g003
Figure 4. FT-IR spectra of different samples: Ag3PO4 (black); CuFeS2 (red); and CuFeS2/Ag3PO4 composites (blue).
Nanomaterials 10 02300 g004
Figure 5. (A) UV–Vis diffuse reflectance spectroscopy (DRS) spectra and (B) Tauc’s plots of different samples: Ag3PO4 (black), CuFeS2 (red), and CuFeS2/Ag3PO4 composites (blue).
Nanomaterials 10 02300 g005
Figure 6. XPS spectra of Ag3PO4: (A) full scan; (B) Ag3d; (C) P2p; and (D) O1s. Deconvolution of XPS peak for O1s element represented in different color line.
Nanomaterials 10 02300 g006
Figure 7. XPS spectra of CuFeS2: (A) full scan; (B) Cu2p; (C) Fe2p; and (D) S2p. Deconvolution of XPS peaks for Cu2p, Fe2p and S2p elements represented in different color line.
Nanomaterials 10 02300 g007
Figure 8. XPS spectra of CuFeS2/Ag3PO4: (A) full scan; (B) Ag3d; (C) P2p; (D) O1s; (E) Cu2p; (F) Fe2p; and (G) S2p. Deconvolution of XPS peaks for O1s, Cu2p, Fe2p and S2p elements represented in different color line.
Nanomaterials 10 02300 g008
Figure 9. (A) Photocatalytic reaction; (B) fenton reaction; and (C) photo-Fenton reaction for RhB degradation by different samples: Ag3PO4 (black), CuFeS2 (red), and CuFeS2/Ag3PO4 composites (blue). The pseudo-first order linear transform of RhB degradation under (D) photocatalytic reaction, (E), Fenton reaction and (F) photo-Fenton reaction by different samples: Ag3PO4 (black), CuFeS2 (red), and CuFeS2/Ag3PO4 composites (blue).
Nanomaterials 10 02300 g009
Figure 10. Photo-Fenton reaction for RhB degradation by different samples: (A) Cu2S (black) and Fe2S3 (red); and (B) Cu2S/Ag3PO4 (black) and Fe2S3/Ag3PO4 (red) composites.
Nanomaterials 10 02300 g010
Figure 11. Degradation of RhB under different conditions: (A) different molar ratios of CuFeS2 to Ag3PO4; (B) different degradation procedures using the mechanical mixing of Ag3PO4 and CuFeS2 particles; (C) different amounts of H2O2 by CuFeS2/Ag3PO4 composites; (D) different amounts of CuFeS2/Ag3PO4 composites; and (E) different amounts of RhB.
Nanomaterials 10 02300 g011
Figure 12. (A) Temporal evolution of UV–Vis spectra of RhB and (B) the corresponding total organic carbon (TOC) content of RhB degradation by the prepared CuFeS2/Ag3PO4 composites through the photo-Fenton reaction. Top image: photographs of the RhB solution under the photo-Fenton reaction at different irradiation time.
Nanomaterials 10 02300 g012
Figure 13. (A) Photocurrent density and (B) the photoluminescence (PL) spectra of different samples: Ag3PO4 (black), CuFeS2 (red), and CuFeS2/Ag3PO4 composites (blue).
Nanomaterials 10 02300 g013
Figure 14. Free radical trapping experiment of (A) Ag3PO4, (B) CuFeS2, and (C) CuFeS2/Ag3PO4 composites. Ethylenediaminetetraacetate (EDTA), tert-butanol (t-BuOH), and p-benzoquinone (BQ) (each 1 mM) were scavengers for holes, oxygen radicals, and hydroxyl radicals, respectively.
Nanomaterials 10 02300 g014
Figure 15. FL spectra of the different samples in the coumarin solution measured at λex = 370 nm (each sample was illuminated for 10 min under visible light). Ag3PO4 (red), CuFeS2 (blue), and CuFeS2/Ag3PO4 composites (olive).
Nanomaterials 10 02300 g015
Scheme 1. Transition of electrons and holes in the different degradation system of (A) Ag3PO4, (B) CuFeS2, and (C) CuFeS2/Ag3PO4.
Nanomaterials 10 02300 sch001
Figure 16. (A) Degradation efficiency under a 10 min reaction time for the recycle used test, (B) XRD patterns, and (CE) the corresponding SEM images of the third used samples: Ag3PO4 (black), CuFeS2 (red), and CuFeS2/Ag3PO4 composites (blue).
Nanomaterials 10 02300 g016
Figure 17. Photo-Fenton reaction of (A) different dyestuff by CuFeS2/Ag3PO4 composites and P25; (B) different degradation procedures in the absence and presence of CuFeS2/Ag3PO4 under sunlight irradiation; (C) different pH; and (D) different environmental water samples for RhB degradation by CuFeS2/Ag3PO4.
Nanomaterials 10 02300 g017
Table 1. Pseudo-first-order rate constants for rhodamine B (RhB) degradation by Ag3PO4, CuFeS2, and CuFeS2/Ag3PO4 composites at different conditions.
SeriesDegradation ModePseudo-First-Order Kinetic Equationk(min−1)R2
Ag3PO4Photocatalytic reactiony = 0.016x + 0.0480.0160.96
Fenton reactiony = 0.0026x + 0.00880.00260.92
Photo-Fenton reactiony = 0.0047x + 0.0550.00470.80
CuFeS2Photocatalytic reactiony = 0.0007x − 0.0390.00070.72
Fenton reactiony = 1.5x − 0.161.50.93
Photo-Fenton reactiony = 2.8x − 0.292.80.94
CuFeS2/Ag3PO4Photocatalytic reactiony = 0.018x − 0.00150.0180.94
Fenton reactiony = 2.2x − 0.1562.20.99
Photo-Fenton reactiony = 3.3x − 0.03223.30.97
Table 2. Comparison of the degradation performance and practical applications using the photo-Fenton reaction.
SamplesPreparationDegradation PerformanceSunlight IrradiationTargetRef.
Citrate–CuFeS2Microwave heating90% degradation (0.2 g catalyst/50 ppm BPA) within 15 min (4 W fluorescent lamp)-BPA[24]
FS–TiO2 diskDip-coating method95% degradation (50 ppm phenazone (PNZ)) within 180 min (36 W UV light)95% degradation of 50 ppm PNZ within 90 minPNZ[34]
Mined CuFeS2Milling process85% TOC conversion (1.0 g catalyst/0.5 mM tyrosol (TY)) within 60 min (10 W UV LED light)-TY[19]
Fe–N–Ag–TiO2 clay beadSurface impregnation method-77% degradation of 50 ppm cephalexin (CEX) within 60 min CEX[35]
FS/FA/TiO2 clay beadDip-coating method89% degradation (50 ppm CEX) within 4 h (36 W UV light)94% degradation (50 ppm CEX) within 3.5 h CEX[36]
Fe2O3–TiO2 filmSol–gel method80% degradation (10 ppm ciprofloxacin (CIPRO), sulfamethoxazole (SMX), and trimethoprim (TMP) mixture) within 240 min by a solar simulator (Solarbox Model 1500e)-CIPRO, SMX, TMP[37]
CuFeS2/Ag3PO4Cyclic microwave heating96% degradation (20 mg catalyst/20 ppm RhB) within 1 min (2.5 W white-light LED)99.8% degradation (0.15 g catalyst/15 ppm MB) within 6 min RhB, MR, R6G, Fluorescein, PI, phenolThis study
Publisher’s Note: MDPI stays neutral with regard to jurisdictional claims in published maps and institutional affiliations.

