Synthesis, Characterization, and Assessment of a CeO2@Nanoclay Nanocomposite for Enhanced Oil Recovery

 , ,
, ,
Abstract
1. Introduction
2. Materials and Methods
2.1. Materials
2.1.1. Crude Oil
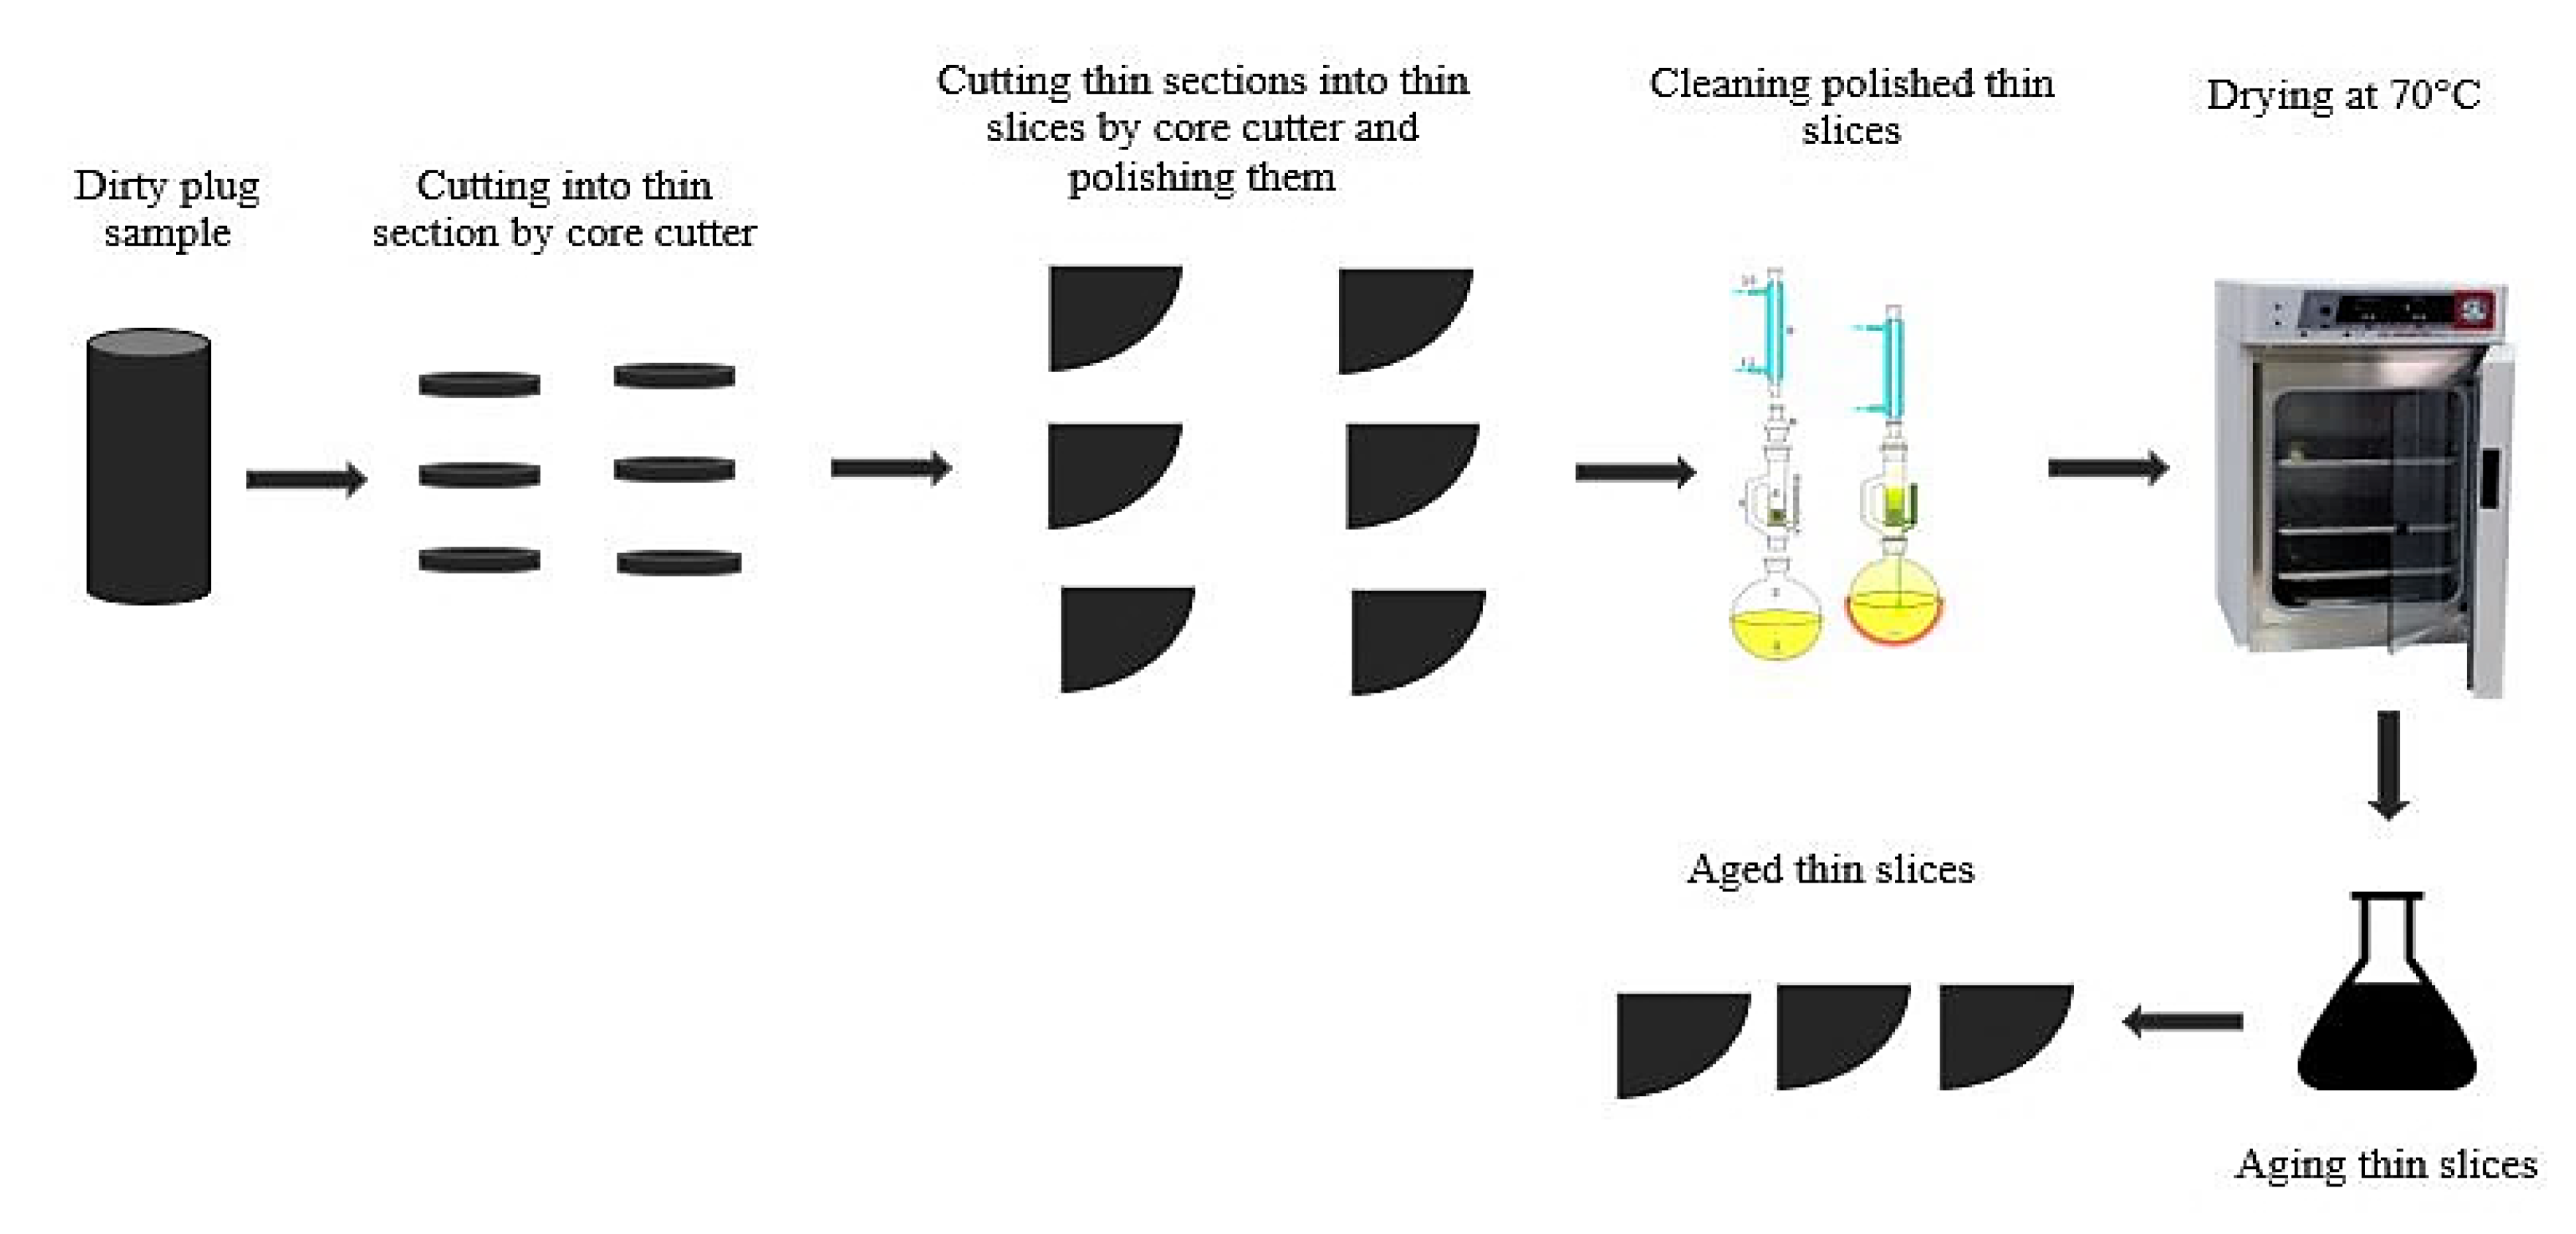
2.1.2. Reservoir Rock Samples
2.1.3. Aqueous Phase
2.2. Synthesis of CeO2@Nanoclay Nanocomposite
2.2.1. Preparation of the Plant Extract
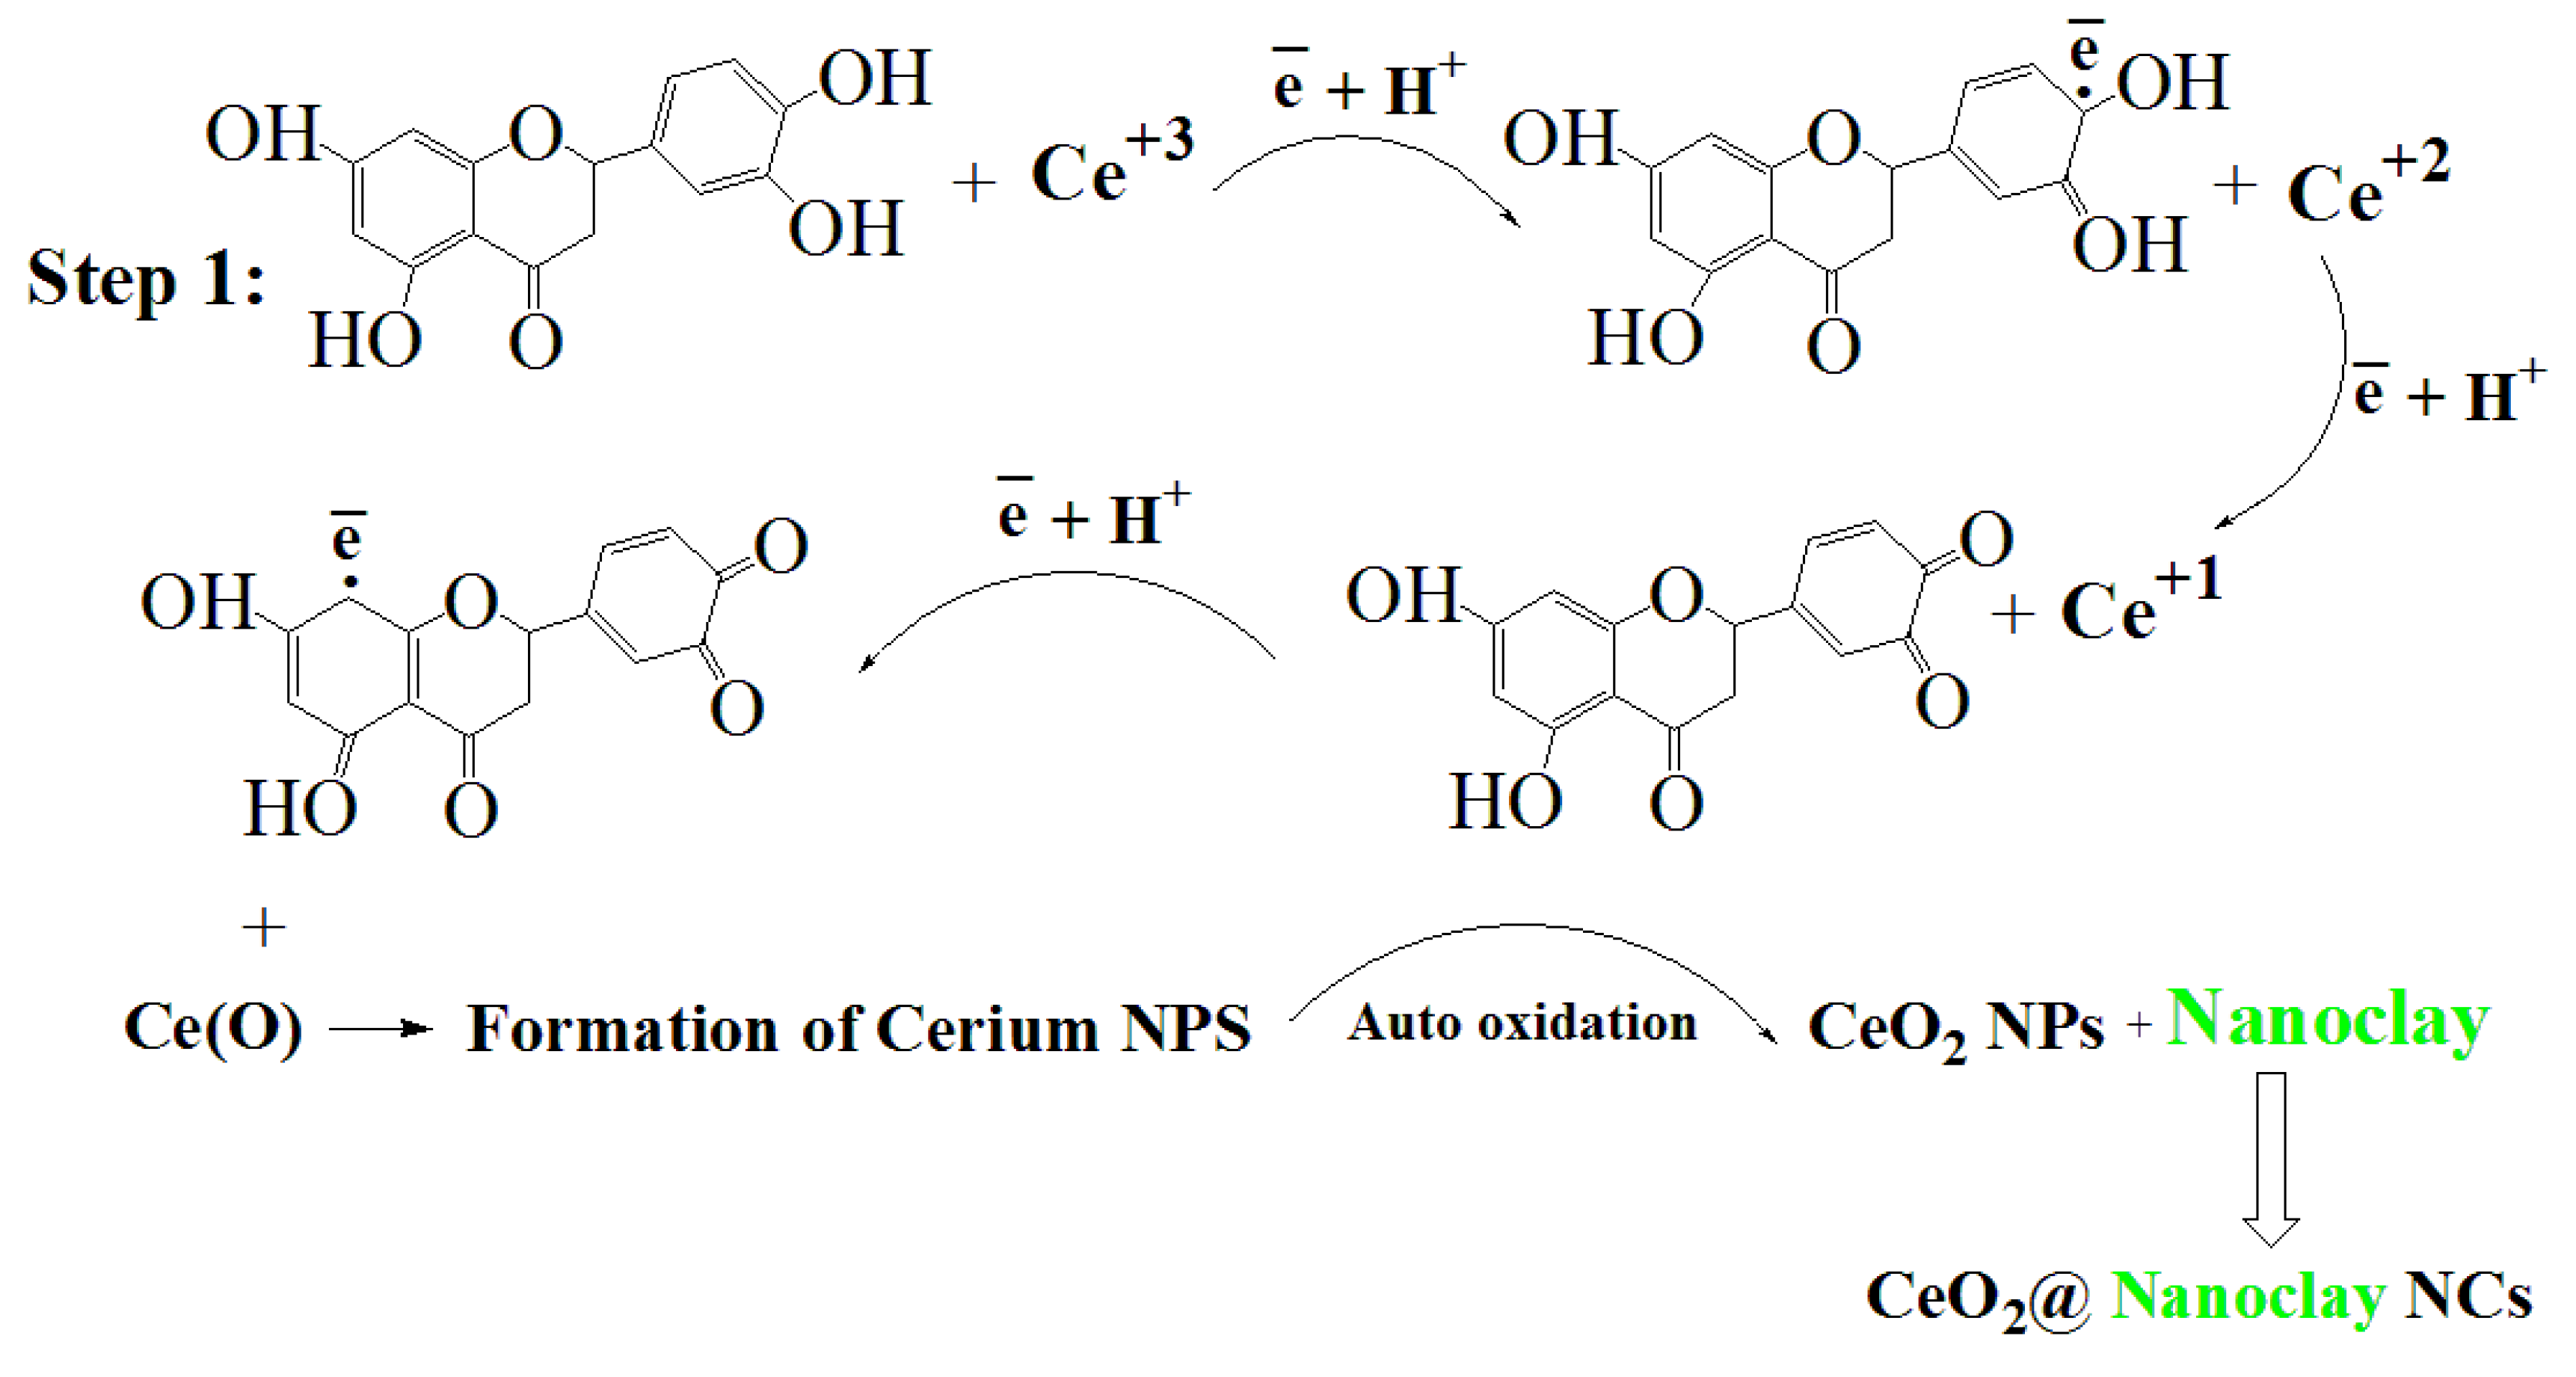
2.2.2. Synthesis of CeO2@Nanoclay NCs
2.3. Nanofluid Preparation
3. Evaluation of the Nanofluids
3.1. IFT Measurement
3.2. Contact Angle Measurement
4. Results and Discussion
4.1. Nanocomposite Characterization
4.1.1. X-ray Diffraction Characterization Test (XRD)
4.1.2. Fourier-Transform Infrared Spectroscopy Characterization Test (FTIR)
4.1.3. Field Emission Scanning Electron Microscopy Characterization Test (FESEM)
4.1.4. Thermogravimetric Analysis (TGA)
4.1.5. Energy-Dispersive X-ray Spectroscopy (EDS) and EDX MAP
4.2. Nanofluid Properties
4.2.1. Density
4.2.2. pH
4.2.3. Viscosity
4.2.4. Conductivity
4.2.5. Zeta Potential
4.2.6. IFT
4.2.7. Wettability Measurement
5. Summary and Conclusions
- (1)
- Based on the XRD test results, the morphology of the novel CeO2@nanoclay NC is calcined and CeO2 is the predominant phase in the substance. The governed peaks at angles of 29.15°, 48.05°, and 56.9° are related to CeO2 crystallography planes of (111), (220), and (311), respectively. A cubic fluorite structure was also identified for CeO2 using the standard data.
- (2)
- The infrared spectrum (FTIR) of the synthesized NC (CeO2@nanoclay) was recorded in the wavenumber range of 400–4000 cm−1. The large broad bands at 3409 cm−1 and 3626 cm−1 are attributed to the stretching vibration of O–H in OH groups. The absorption peaks of approximately 1641 cm−1 were attributed to the bending vibration of the C=C stretching.
- (3)
- FESEM revealed that the surface morphology of the NC has a layer sheet morphology of CeO2/SiO2 nanocomposite and the particle sizes are approximately 20 to 26 nm.
- (4)
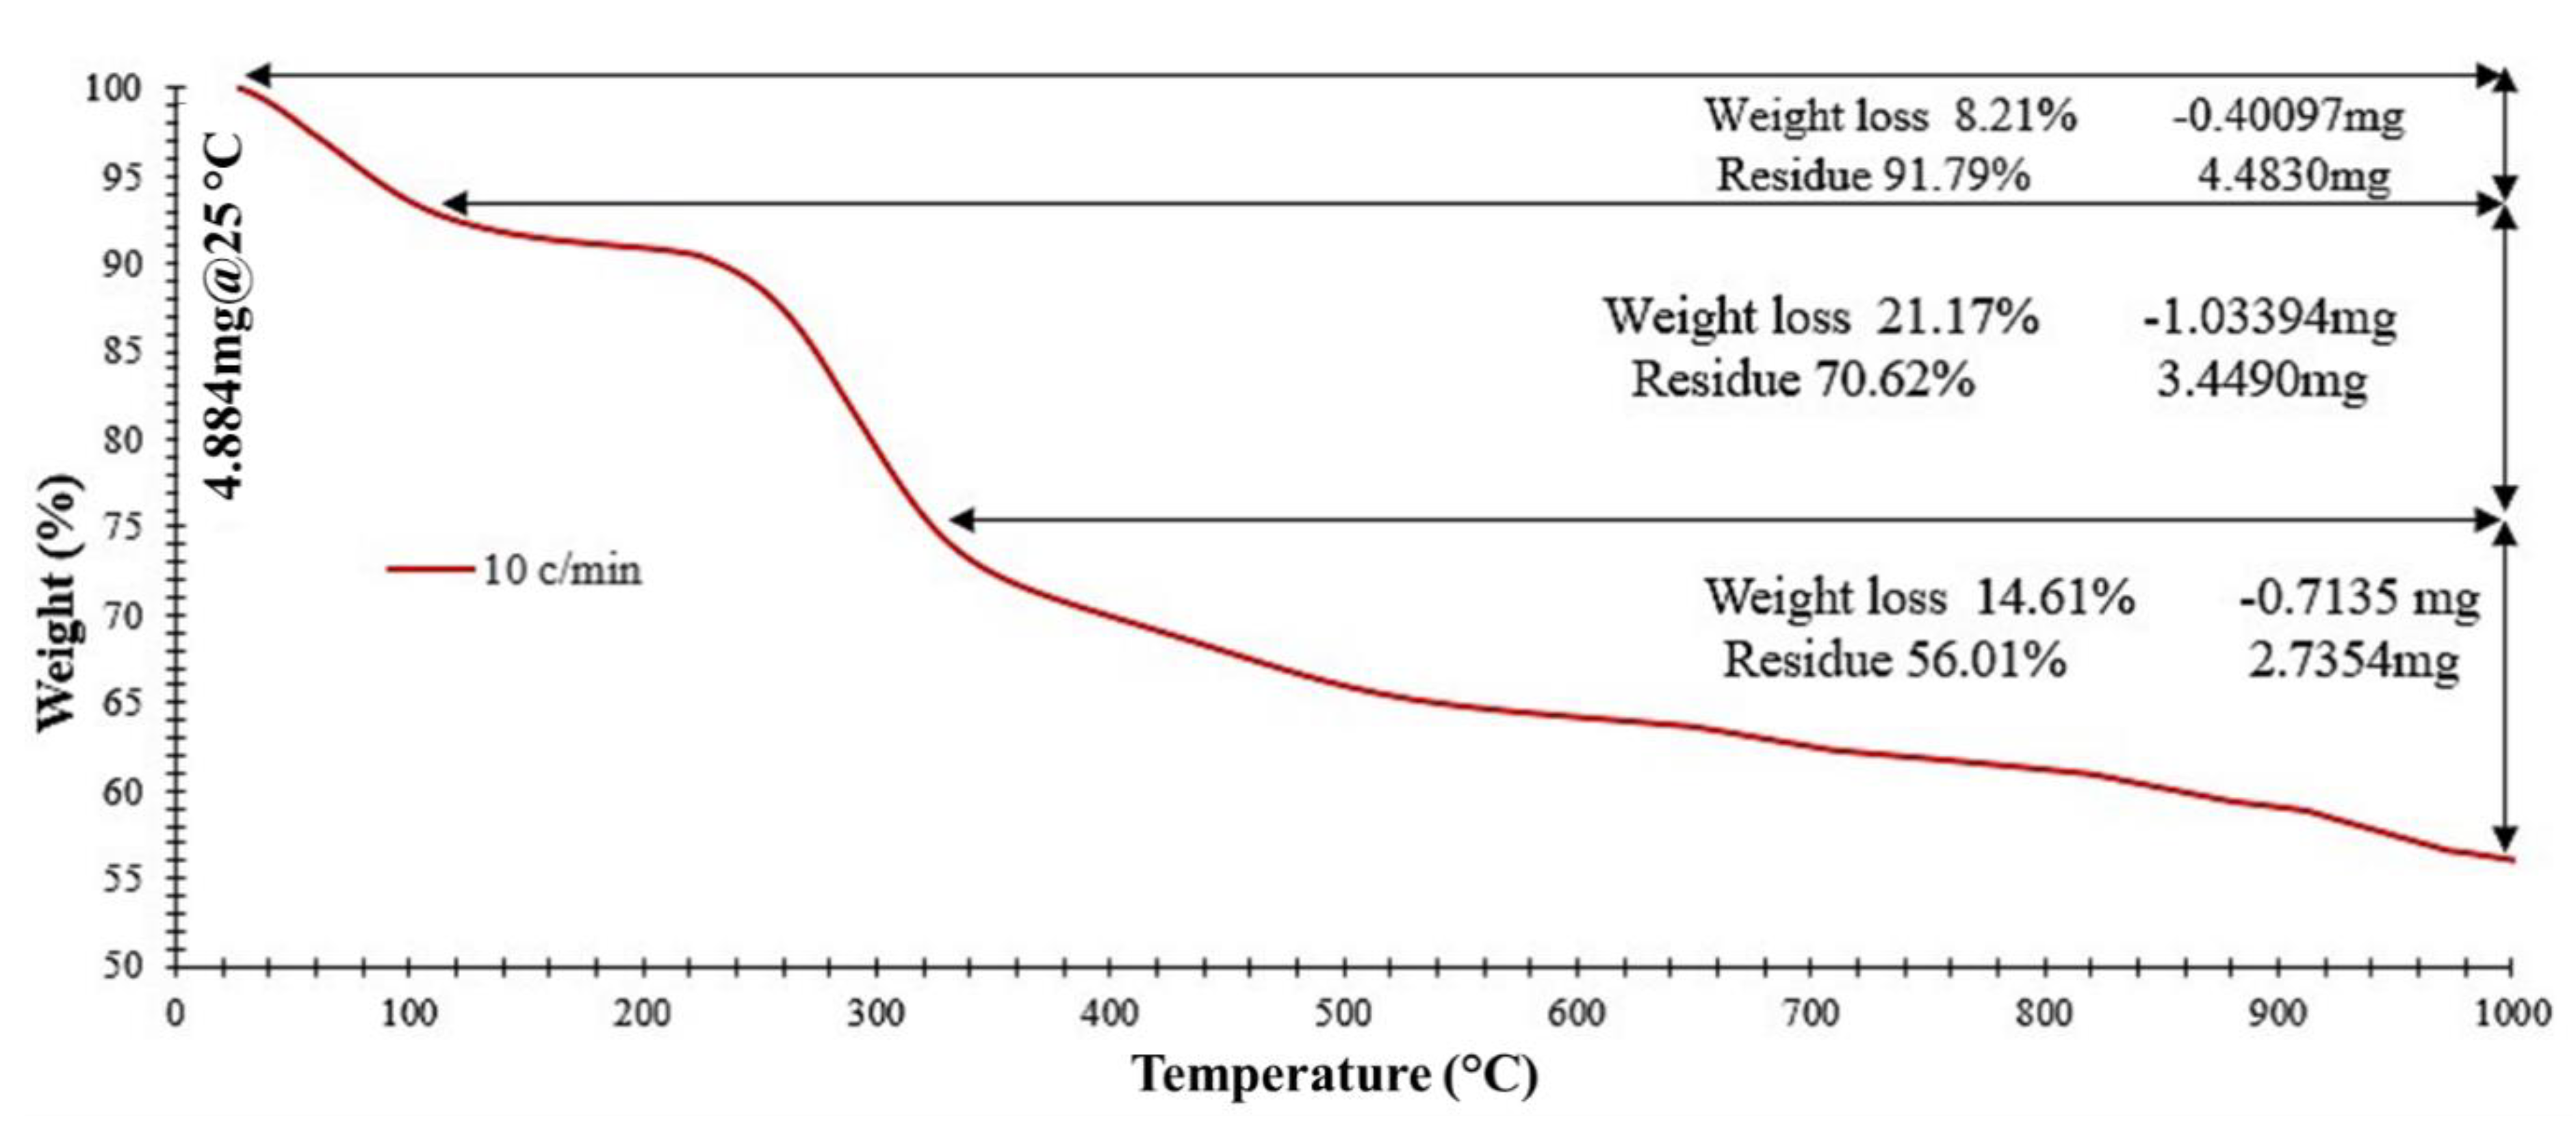
- TGA analysis results shows that the novel NC has a low weight loss (8.21%) and high stability at 90 °C which is a typical upper bound temperature in petroleum reservoirs.
- (5)
- EDS analysis confirm presence of O, Si, and Ce in the novel NC. Atomic and weight analysis of O, Si, and Ce of the NC are determined as (79.47%, 20.32%, and 0.225%) and (67.91%, 30.48%, and 1.61%), respectively.
- (6)
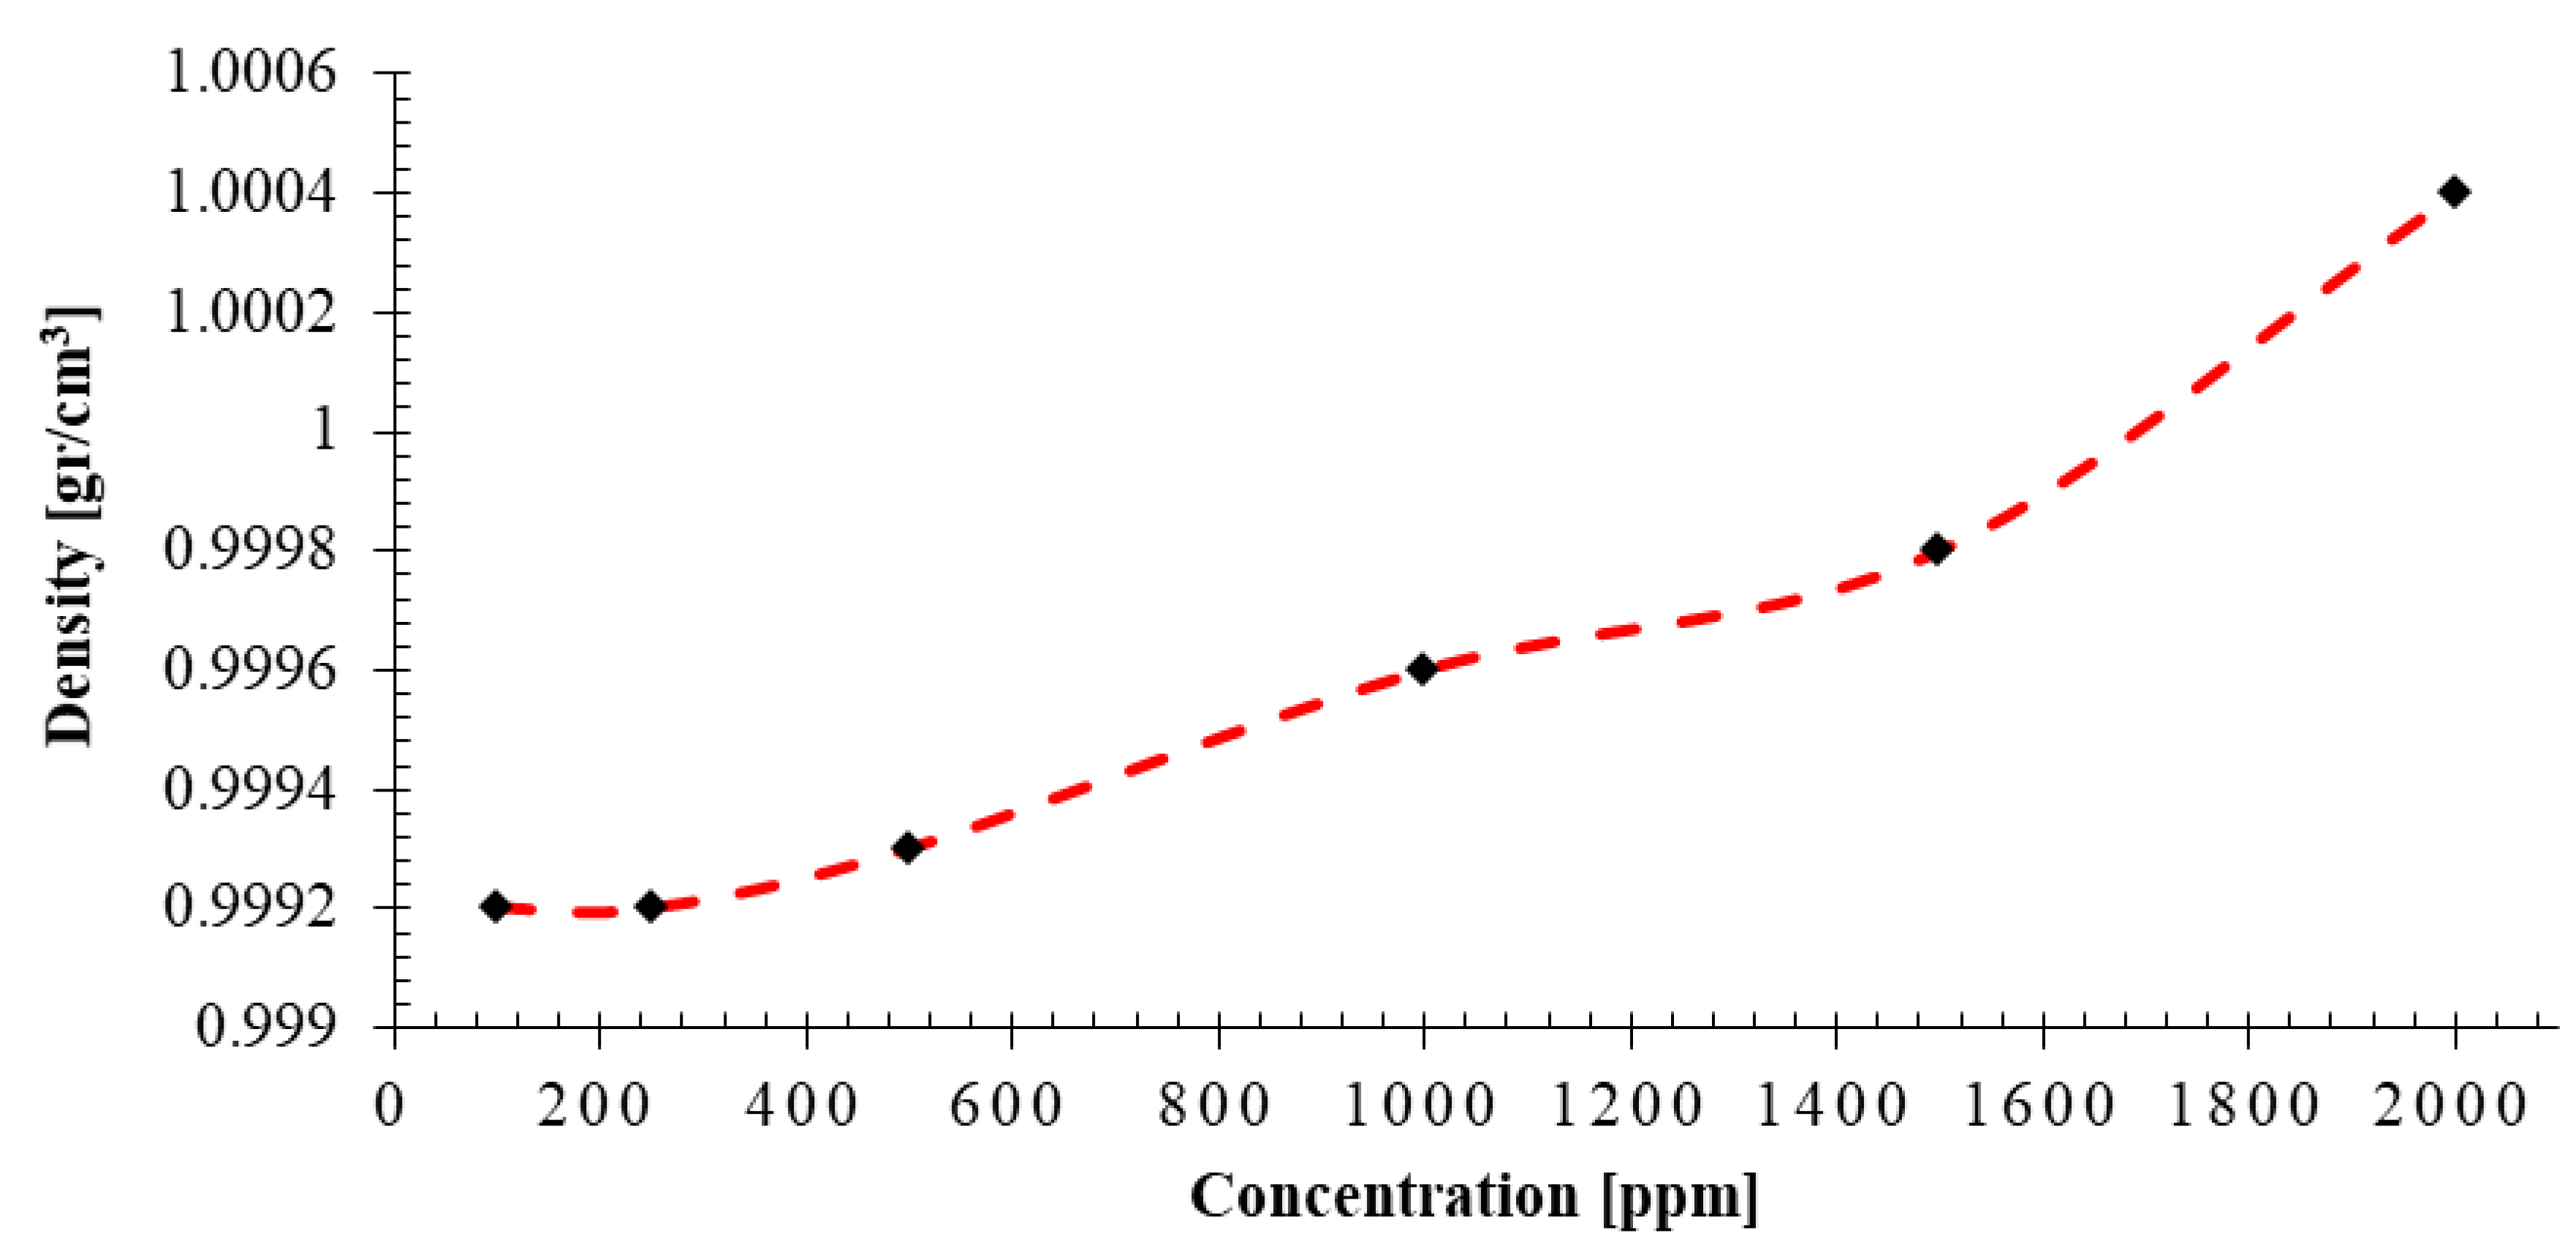
- Density of the prepared nanofluids are on the range of 0.9992 and 1.0004 g/cm3. The solution density increases with increase in concentration of the NC. The pH values of the prepared nanofluids at different concentrations ranges from 5.95 to 6.64. It seems that NC concentration does not affect the pH of the nanofluids much. The viscosity the nanofluid ranges from 1.3 cP to 1.4 cP and it changes very little with increase in concentration of the novel NC.
- (7)
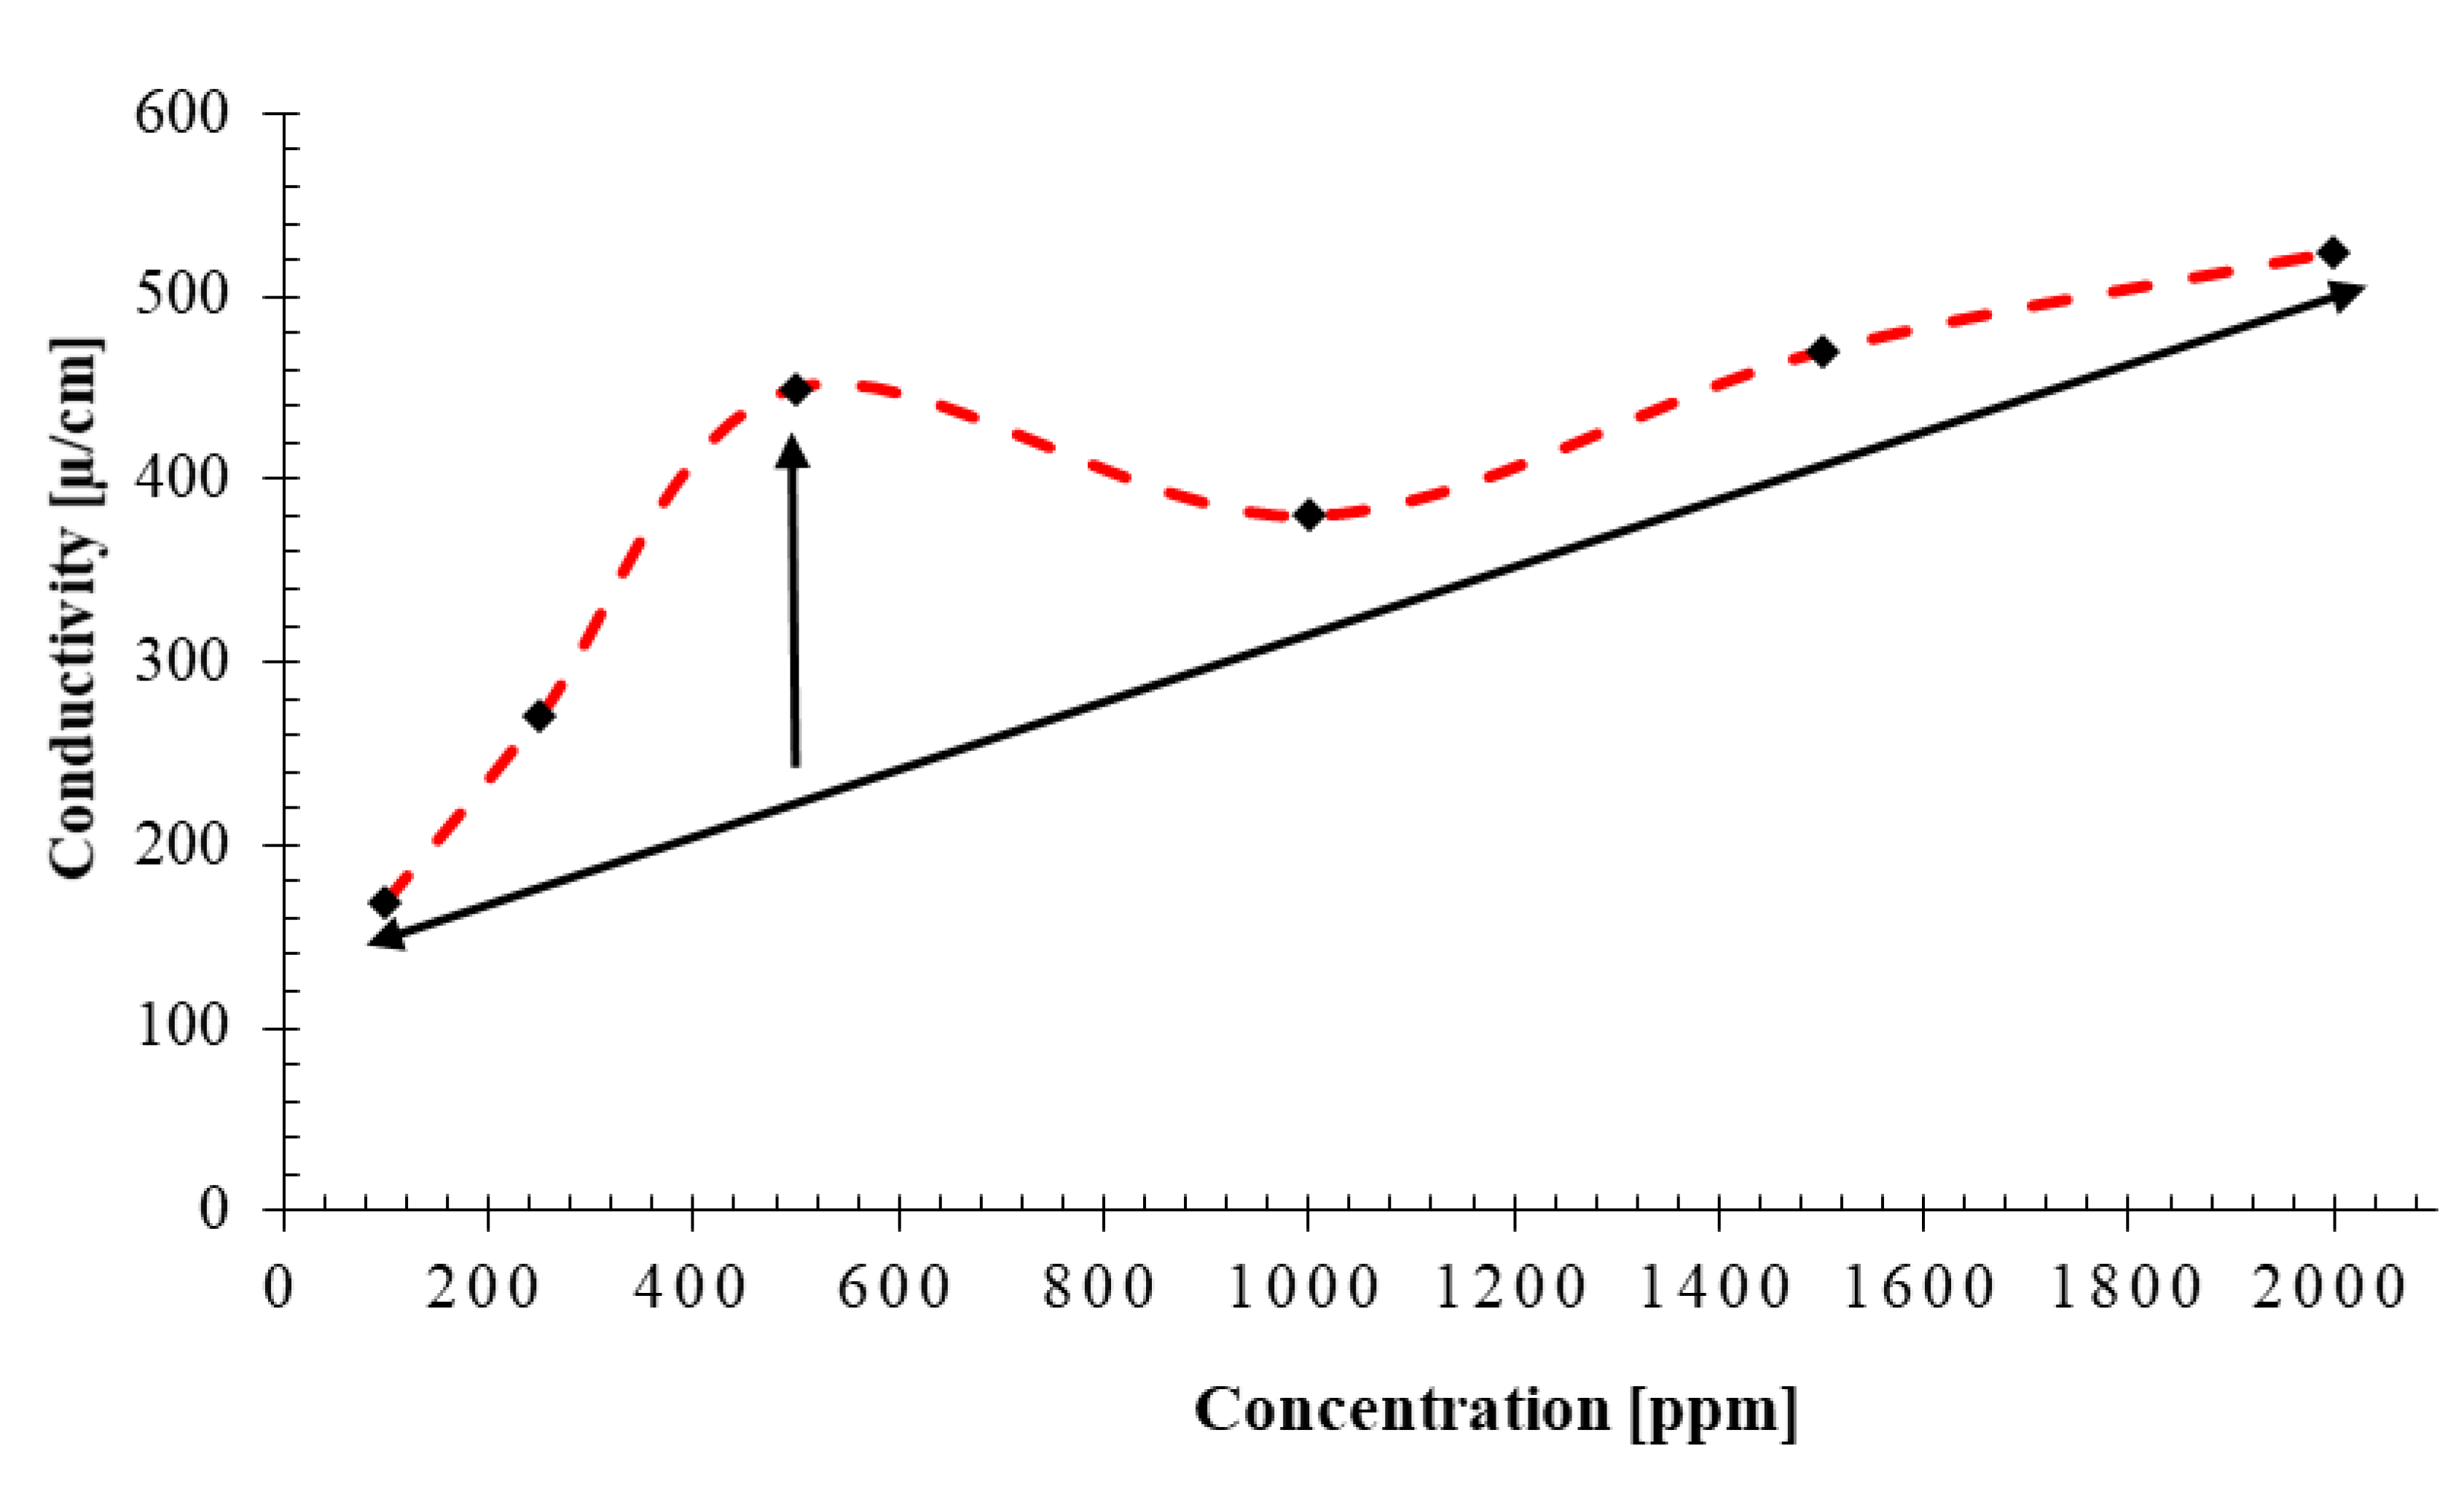
- The minimum and maximum conductivity of 169 μS/cm and 524 μS/cm are recoreded for concentrations of 100 ppm and 2000 ppm, respectively. An abnormally high conductivity of 480 μS/cm is recorded for the nanofluid with NC concentration of 500 ppm which matches the critical micelle concentration or CMC point determined. The measured zeta potential peaks at the concentration of 500 ppm which is a sign of stabilty of the nanofluid.
- (8)
- The IFT values measured for the nanofluids prepared with concentrations of 100, 250, 500, 1000, 1500, and 2000 ppm of the NC determined as 28, 24, 17, 23, 24, and 26 mN/m, respectively. The largest drop in IFT is observed for the nanofluid prepared with a concentration of 500 ppm. This concentration of nanocomposite can be considered as the optimum concentration for preparation of nanofluids to maximize IFT reduction. IFT of the deionized water and crude oil was measured as 35 mN/m; while, the optimum concentration provides a 17 mN/m reduction in IFT. In other words, the nanofluid prepared by using this novel NC is able to reduce the IFT by 48.5%.
- (9)
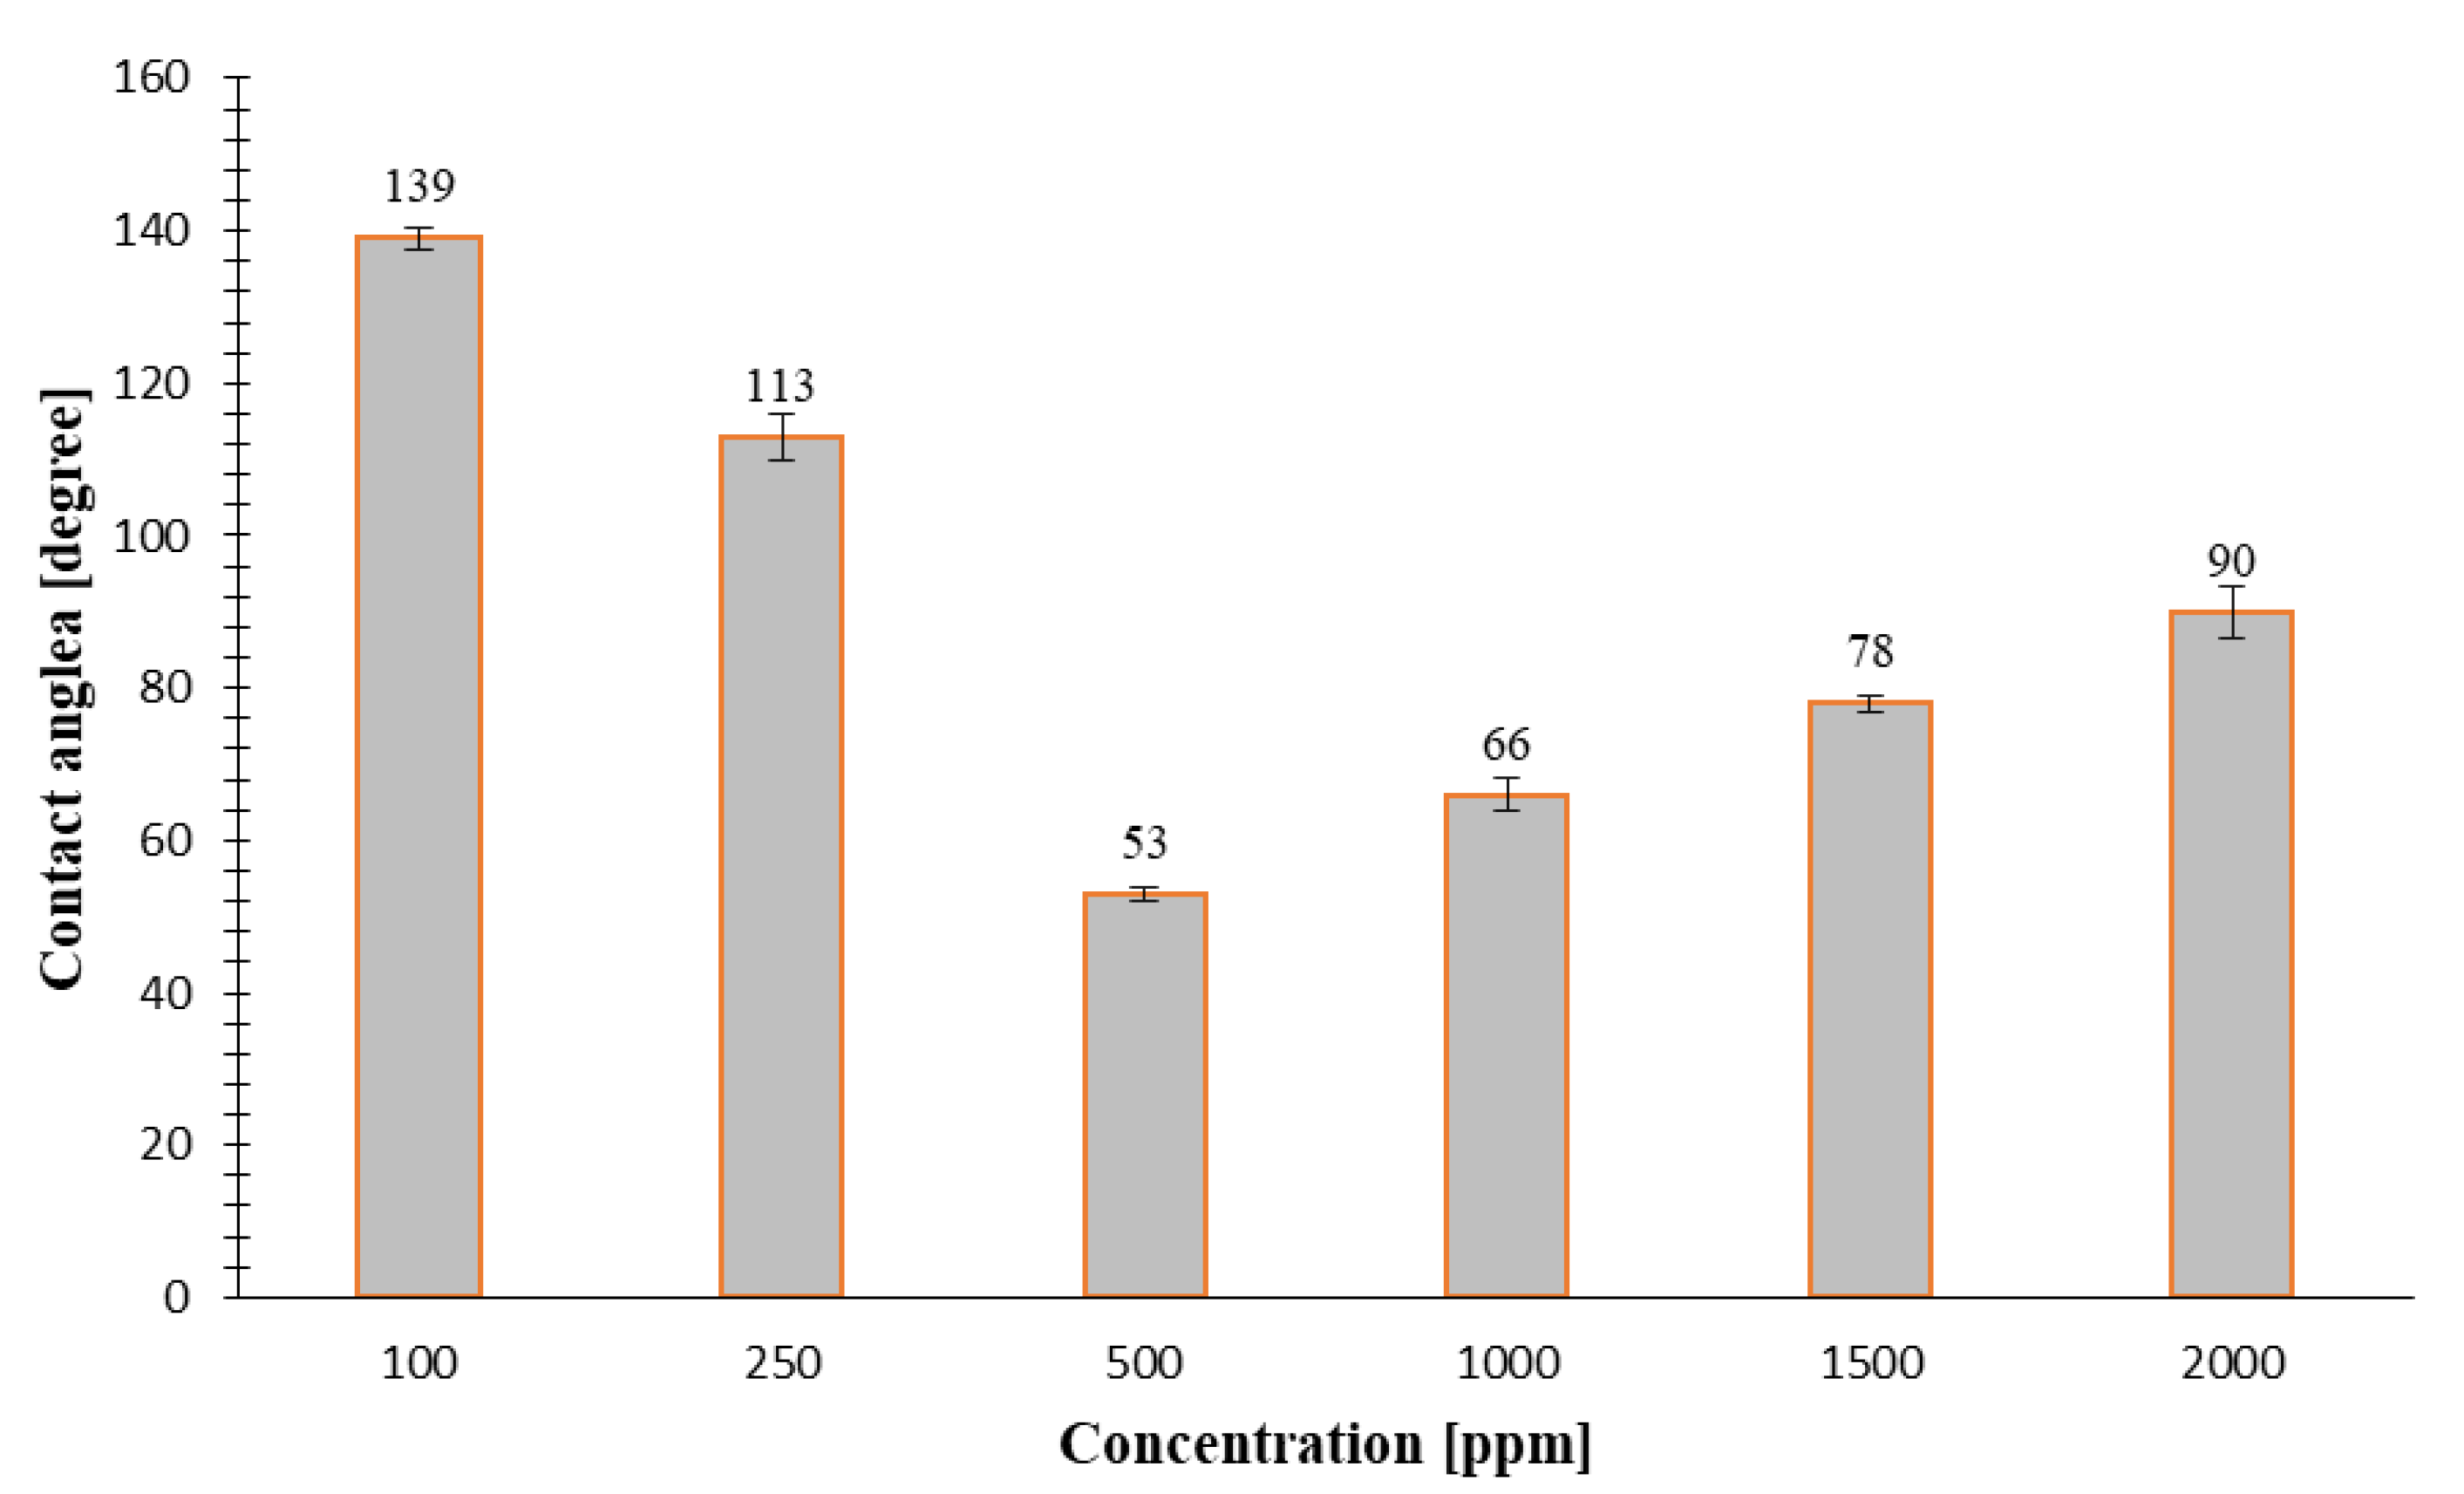
- For concentrations of 100, 250, 500, 1000, 1500, and 2000 ppm a tangential angle of contact of 139°, 113°, 53°, 66°, 78°, and 90° for the carbonate samples and 137°, 123°, 90°, 87°, 75°, and 69° for the sandstone samples was measured using the sessile drop method, respectively. The nanoflud prepared with 500 ppm NC altered the contact angle of carbonate rock sample from 139° to 53° (i.e., to more water-wet). This can be considered as an optimum concentration to achieve the highest weattability alteration of initial wettability conditions of carbonates towards a more water wet state. In sandstone rock samples, the rock wettability changes towards a more water wet state with increase in concentration of the NC used for preparation of the nanofluids (from 137° to 69°).
Author Contributions
Funding
Acknowledgments
Conflicts of Interest
References
- IEA. World Energy Outlook 2019; IEA: Paris, France, 2019; Available online: https://www.iea.org/reports/world-energy-outlook-2019 (accessed on 13 November 2020).
- Mohammadi, M.; Riahi, S. Experimental investigation of water incompatibility and rock/fluid and fluid/fluid interactions in the absence and presence of scale inhibitors. SPE J. 2020, 25, 2615–2631. [Google Scholar] [CrossRef]
- Green, D.W.; Willhite, G.P. Enhanced Oil Recovery; SPE textbook series; Society of Petroleum Engineers: Richardson, TX, USA, 1998. [Google Scholar]
- Sinaga, F.T.H.; Napitupulu, F.H.; Nur, T.B. Hydrogen gas production simulation utilizing empty fruit bunch of oil palm pyrolysis unit by steam methane reforming process. J. Phys. Conf. Ser. 2020, 1566, 012125. [Google Scholar] [CrossRef]
- Mohanty, K.; Chandrasekhar, S. Wettability alteration with brine composition in high temperature carbonate reservoirs. In Proceedings of the SPE Annual Technical Conference and Exhibition, New Orleans, LA, USA, 30 September–2 October 2013. [Google Scholar]
- Naik, S.; You, Z.; Bedrikovetsky, P. Productivity index enhancement by wettability alteration in two-phase compressible flows. J. Nat. Gas Sci. Eng. 2018, 50, 101–114. [Google Scholar] [CrossRef]
- Instrumental characterization of montmorillonite Clay by FT-IR and XRD from JKUAT farm, in the Republic of Kenya. Chem. Mat. Res. 2015, 7, 43–49.
- Zhang, P.; Tweheyo, A.M.T.; Austad, T. Wettability alteration and improved oil recovery in chalk: The effect of calcium in the presence of sulfate. Energy Fuels 2006, 20, 2056–2062. [Google Scholar] [CrossRef]
- Negin, C.; Ali, S.; Xie, Q. Application of nanotechnology for enhancing oil recovery—A review. Petroleum 2016, 2, 324–333. [Google Scholar] [CrossRef]
- Kazemzadeh, Y.; Parsaei, R.; Riazi, M. Experimental study of asphaltene precipitation prediction during gas injection to oil reservoirs by interfacial tension measurement. Colloids Surf. A Physicochem. Eng. Asp. 2015, 466, 138–146. [Google Scholar] [CrossRef]
- Cheraghian, G.; Hendraningrat, L. A review on applications of nanotechnology in the enhanced oil recovery part B: Effects of nanoparticles on flooding. Int. Nano Lett. 2016, 6, 1–10. [Google Scholar] [CrossRef]
- Lai, N.; Li, S.; Liu, L.; Li, Y.; Li, J.; Zhao, M. Synthesis and rheological property of various modified nano-SiO2/AM/AA hyperbranched polymers for oil displacement. Russ. J. Appl. Chem. 2017, 90, 480–491. [Google Scholar] [CrossRef]
- Gbadamosi, A.O.; Junin, R.; Manan, M.A.; Yekeen, N.; Junin, R.; Oseh, J.O. Recent advances and prospects in polymeric nanofluids application for enhanced oil recovery. J. Ind. Eng. Chem. 2018, 66, 1–19. [Google Scholar] [CrossRef]
- Yang, Y.; Cheng, T.; Wu, H.; You, Z.; Shang, D.; Hou, J. Enhanced oil recovery using oleic acid modified titania nanofluids: Underlying mechanisms and oil-displacement performance. Energy Fuels 2020, 34, 5813–5822. [Google Scholar] [CrossRef]
- Manshad, A.K.; Rezaei, M.; Moradi, S.; Nowrouzi, I.; Mohammadi, A.H. Wettability alteration and interfacial tension (IFT) reduction in enhanced oil recovery (EOR) process by ionic liquid flooding. J. Mol. Liq. 2017, 248, 153–162. [Google Scholar] [CrossRef]
- Khademolhosseini, R.; Jafari, A.J.; Shabani, M. Micro scale investigation of enhanced oil recovery using nano/bio materials. Procedia Mater. Sci. 2015, 11, 171–175. [Google Scholar] [CrossRef]
- Bera, A.; Belhaj, H. Application of nanotechnology by means of nanoparticles and nano-dispersions in oil recovery—A comprehensive review. J. Nat. Gas Sci. Eng. 2016, 34, 1284–1309. [Google Scholar] [CrossRef]
- Hendraningrat, L.; Torsaeter, O. Metal oxide-based nanoparticles: Revealing their potential to enhance oil recovery in different wettability systems. Appl. Nanosci. 2014, 5, 181–199. [Google Scholar] [CrossRef]
- Assef, Y.; Arab, D.; Pourafshary, P. Application of nanofluid to control fines migration to improve the performance of low salinity water flooding and alkaline flooding. J. Pet. Sci. Eng. 2014, 124, 331–340. [Google Scholar] [CrossRef]
- Lager, A.; Webb, K.J.; Collins, I.R.; Richmond, D.M. LoSal enhanced oil recovery: Evidence of enhanced oil recovery at the reservoir scale. In Proceedings of the SPE Symposium on Improved Oil Recovery, Tulsa, Oklahoma, USA, 20–23 April 2008; Society of Petroleum Engineers (SPE): Richardson, TX, USA, 2008. [Google Scholar]
- Sun, X.; Zhang, Y.; Chen, G.; Gai, Z. Application of nanoparticles in enhanced oil recovery: A critical review of recent progress. Energies 2017, 10, 345. [Google Scholar] [CrossRef]
- Shamilov, V.; Babayev, E.; Kalbaliyeva, E.; Shamilov, F. Polymer nanocomposites for enhanced oil recovery. Mater. Today: Proc. 2017, 4, S70–S74. [Google Scholar] [CrossRef]
- Zheng, C.; Cheng, Y.; Wei, Q.; Li, X.; Zhang, Z. Suspension of surface-modified nano-SiO2 in partially hydrolyzed aqueous solution of polyacrylamide for enhanced oil recovery. Colloids Surf. A Physicochem. Eng. Asp. 2017, 524, 169–177. [Google Scholar] [CrossRef]
- Yousefvand, H.; Jafari, A.J. Enhanced Oil Recovery Using Polymer/nanosilica. Procedia Mater. Sci. 2015, 11, 565–570. [Google Scholar] [CrossRef]
- Luo, P.; Luo, W.; Li, S. Effectiveness of miscible and immiscible gas flooding in recovering tight oil from Bakken reservoirs in Saskatchewan, Canada. Fuel 2017, 208, 626–636. [Google Scholar] [CrossRef]
- Bennetzen, M.V.; Mogensen, K. Novel applications of nanoparticles for future enhanced oil recovery. In Proceedings of the International Petroleum Technology Conference, Kuala Lumpur, Malaysia, 10–12 December 2014. [Google Scholar]
- Moghaddam, R.N.; Bahramian, A.; Fakhroueian, Z.; Karimi, A.; Arya, S. Comparative study of using nanoparticles for enhanced oil recovery: Wettability alteration of carbonate rocks. Energy Fuels 2015, 29, 2111–2119. [Google Scholar] [CrossRef]
- Cheraghian, G.; Nezhad, S.S.K.; Kamari, M.; Hemmati, M.; Masihi, M.; Bazgir, S. Effect of nanoclay on improved rheology properties of polyacrylamide solutions used in enhanced oil recovery. J. Pet. Explor. Prod. Technol. 2014, 5, 189–196. [Google Scholar] [CrossRef]
- Delshad, M.; Kim, D.H.; Magbagbeola, O.A.; Huh, C.; Pope, G.A.; Tarahhom, F. Mechanistic interpretation and utilization of viscoelastic behavior of polymer solutions for improved polymer-flood efficiency. In Proceedings of the SPE Symposium on Improved Oil Recovery, Tulsa, OK, USA, 20–23 April 2008. [Google Scholar]
- Alomair, O.A.; Matar, K.M.; AlSaeed, Y.H. Nanofluids application for heavy oil recovery. In Proceedings of the SPE Asia Pacific Oil & Gas Conference and Exhibition, Adelaide, Australia, 14–16 October 2014. [Google Scholar]
- Wu, W.; He, Q.; Jiang, C. Magnetic iron oxide nanoparticles: Synthesis and surface functionalization strategies. Nanoscale Res. Lett. 2008, 3, 397–415. [Google Scholar] [CrossRef] [PubMed]
- Shah, R.D. Application of nanoparticle saturated injectant gases for EOR of heavy oils. In Proceedings of the SPE Annual Technical Conference and Exhibition, New Orleans, LA, USA, 4–7 October 2009. [Google Scholar]
- Yuan, B.; Moghanloo, R.G.; Zheng, D. Enhanced oil recovery by combined nanofluid and low salinity Water flooding in multi-layer heterogeneous reservoirs. In Proceedings of the SPE Annual Technical Conference and Exhibition, Dubai, UAE, 26–28 September 2016. [Google Scholar]
- Roustaei, A.; Moghadasi, J.; Bagherzadeh, H.; Shahrabadi, A. An experimental investigation of polysilicon nanoparticles’ recovery efficiencies through changes in interfacial tension and wettability alteration. In Proceedings of the SPE International Oilfield Nanotechnology Conference and Exhibition, Noordwijk, The Netherlands, 12–14 June 2012. [Google Scholar]
- Seid Mohammadi, M.; Moghadasi, J.; Naseri, S. An experimental investigation of wettability alteration in carbonate reservoir using γ-Al2O3 nanoparticles. Iran. J. Oil Gas Sci. Technol. 2014, 3, 18–26. [Google Scholar]
- Ragab, A.M.S.; Hannora, A.E. A Comparative investigation of nano particle effects for improved oil recovery—Experimental work. In Proceedings of the SPE Kuwait Oil & Gas Show and Conference, Mishref, Kuwait, 11–14 October 2015. [Google Scholar]
- Maghzi, A.; Kharrat, R.; Mohebbi, A.; Ghazanfari, M.H. The impact of silica nanoparticles on the performance of polymer solution in presence of salts in polymer flooding for heavy oil recovery. Fuel 2014, 123, 123–132. [Google Scholar] [CrossRef]
- Kapusta, S.; Balzano, L.; Te Riele, P. Nanotechnology applications in oil and gas exploration and production. In Proceedings of the IPTC 2011: International Petroleum Technology Conference, Bangkok, Thailand, 7 February 2012; European Association of Geoscientists & Engineers: Houten, The Netherlands, 2012. [Google Scholar]
- Bahraminejad, H.; Khaksar Manshad, A.; Riazi, M.; Ali, J.A.; Sajadi, S.M.; Keshavarz, A. CuO/TiO2/PAM as a novel introduced hybrid agent for water—Oil interfacial tension and wettability optimization in chemical enhanced oil recovery. Energy Fuels 2019, 33, 10547–10560. [Google Scholar] [CrossRef]
- Nowrouzi, I.; Manshad, A.K.; Mohammadi, A.H. Effects of TiO2, MgO and γ-Al2O3 nano-particles on wettability alteration and oil production under carbonated nano-fluid imbibition in carbonate oil reservoirs. Fuel 2020, 259, 116110. [Google Scholar] [CrossRef]
- Trache, D.; Thakur, V.K.; Boukherroub, R. Cellulose nanocrystals/graphene hybrids—A promising new class of materials for advanced applications. Nanomaterials 2020, 10, 1523. [Google Scholar] [CrossRef]
- Ateş, B.; Koytepe, S.; Ulu, A.; Gurses, C.; Thakur, V.K. Chemistry, structures, and advanced applications of nanocomposites from biorenewable resources. Chem. Rev. 2020, 120, 9304–9362. [Google Scholar] [CrossRef]
- Long, Y.; Wang, R.; Zhu, B.; Huang, X.; Leng, Z.; Chen, L.; Song, F. Enhanced oil recovery by a suspension of core-shell polymeric nanoparticles in heterogeneous low-permeability oil reservoirs. Nanomaterials 2019, 9, 600. [Google Scholar] [CrossRef] [PubMed]
- Aadland, R.C.; Akarri, S.; Heggset, E.B.; Syverud, K.; Torsæter, O. A core flood and microfluidics investigation of nanocellulose as a chemical additive to water flooding for EOR. Nanomaterials 2020, 10, 1296. [Google Scholar] [CrossRef] [PubMed]
- Mehrabianfar, P.; Malmir, P.; Soulgani, B.S.; Hashemi, A. Study on the optimization of the performance of preformed particle gel (PPG) on the isolation of high permeable zone. J. Pet. Sci. Eng. 2020, 195, 107530. [Google Scholar] [CrossRef]
- Bila, A.; Stensen, J.A.; Torsæter, O. Experimental investigation of polymer-coated silica nanoparticles for enhanced oil recovery. Nanomaterials 2019, 9, 822. [Google Scholar] [CrossRef] [PubMed]
- Franco, C.A.; Giraldo, L.J.; Candela, C.H.; Bernal, K.M.; Villamil, F.; Montes, D.; Lopera, S.H.; Franco, C.A.; Cortés, F.B. Design and tuning of nanofluids applied to chemical enhanced oil recovery based on the surfactant–nanoparticle–brine interaction: From laboratory experiments to oil field application. Nanomaterials 2020, 10, 1579. [Google Scholar] [CrossRef]
- Li, S.; Ng, Y.H.; Lau, H.C.; Torsæter, O.; Stubbs, L.P. Experimental investigation of stability of silica nanoparticles at reservoir conditions for enhanced oil recovery applications. Nanomaterials 2020, 10, 1522. [Google Scholar] [CrossRef]
- Adil, M.; Lee, K.; Zaid, H.M.; Manaka, T. Role of phase dependent dielectric properties of alumina nanoparticles in electromagnetic assisted enhanced oil recovery. Nanomaterials 2020, 10, 1975. [Google Scholar] [CrossRef]
- Rezaei, A.; Abdollahi, H.; Derikvand, Z.; Hemmati-Sarapardeh, A.; Mosavi, A.; Nabipour, N. Insights into the effects of pore size distribution on the flowing behavior of carbonate rocks: Linking a nano-based enhanced oil recovery method to rock typing. Nanomaterials 2020, 10, 972. [Google Scholar] [CrossRef]
- Medina, O.E.; Gallego, J.; Arias-Madrid, D.; Cortés, F.B.; Franco, C.A. Optimization of the load of transition metal oxides (Fe2O3, Co3O4, NiO and/or PdO) onto CeO2 nanoparticles in catalytic steam decomposition of n-C7 asphaltenes at low temperatures. Nanomaterials 2019, 9, 401. [Google Scholar] [CrossRef]
- Medina, O.E.; Gallego, J.; Restrepo, L.G.; Cortés, F.B.; Franco, C.A. Influence of the Ce4+/Ce3+ Redox-couple on the cyclic regeneration for adsorptive and catalytic performance of NiO-PdO/CeO2±δ nanoparticles for n-C7 asphaltene steam gasification. Nanomaterials 2019, 9, 734. [Google Scholar] [CrossRef]
- Pérez-Robles, S.; Matute, C.A.; Lara, J.R.; Lopera, S.H.; Cortés, F.B.; Franco, C.A. Effect of nanoparticles with different chemical nature on the stability and rheology of acrylamide sodium acrylate copolymer/chromium (III) acetate gel for conformance control operations. Nanomaterials 2019, 10, 74. [Google Scholar] [CrossRef] [PubMed]
- Di Sacco, F.; Pucci, A.; Raffa, P. Versatile multi-functional block copolymers made by atom transfer radical polymerization and post-synthetic modification: Switching from volatile organic compound sensors to polymeric surfactants for water rheology control via hydrolysis. Nanomaterials 2019, 9, 458. [Google Scholar] [CrossRef] [PubMed]
- Kamaei, E.; Manshad, A.K.; Shadizadeh, S.R.; Ali, J.A.; Keshavarz, A. Effect of the wettability alteration on the cementation factor of carbonate rocks using Henna extract. Materialia 2019, 8, 100440. [Google Scholar] [CrossRef]
- Eslahati, M.; Mehrabianfar, P.; Isari, A.A.; Bahraminejad, H.; Manshad, A.K.; Keshavarz, A. Experimental investigation of Alfalfa natural surfactant and synergistic effects of Ca2+, Mg2+, and SO42− ions for EOR applications: Interfacial tension optimization, wettability alteration and imbibition studies. J. Mol. Liq. 2020, 310, 113123. [Google Scholar] [CrossRef]
- Aadland, R.C.; Jakobsen, T.D.; Heggset, E.B.; Torsæter, O.; Simon, S.; Paso, K.G.; Syverud, K.; Torsæter, O. High temperature core flood investigation of nanocellulose as a green additive for enhanced oil recovery. Nanomaterials 2019, 9, 665. [Google Scholar] [CrossRef] [PubMed]
- Rueda, E.; Akarri, S.; Torsæter, O.; Moreno, R.B. Experimental investigation of the effect of adding nanoparticles to polymer flooding in water-wet micromodels. Nanomaterials 2020, 10, 1489. [Google Scholar] [CrossRef] [PubMed]
- Dong, M.W. Instruments & applications. How hot is that pepper? Quantifying capsaicinoids with chromatography. Todays Chem. Work 2000, 9, 17–22. [Google Scholar]
- Nwokem, C.O. Determination of capsaicin content and pungency level of five different Fresh and Dried Chilli Peppers. N. Y. Sci. J. 2017, 61, 11–16. [Google Scholar] [CrossRef]
- Bello, I.; Boboye, B.E.; Akinyosoye, F.A. Phytochemical screening and antibacterial properties of selected Nigerian long pepper (Capsicum frutescens) fruits. Afr. J. Microbiol. Res. 2015, 9, 2067–2078. [Google Scholar] [CrossRef]
- Khan, N.; Aziz, K. Comparative study of sports competitive anxiety and sports achievement motivation between basketball players and all India intervarsity running events athletes. Int. J. Modern Chem. Appl. Sci. 2015, 2, 235–237. [Google Scholar]
- Kumar, A.; Dixit, C.K. Methods for characterization of nanoparticles. In Advances in Nanomedicine for the Delivery of Therapeutic Nucleic Acids; Woodhead Publishing: Sawston, UK, 2017; pp. 43–58. [Google Scholar]
- Farahmandjou, M.; Zarinkamar, M.; Firoozabadi, T.P. Synthesis of Cerium Oxide (CeO2) nanoparticles using simple CO-precipitation method. Rev. Mex. de Física 2016, 62, 496–499. [Google Scholar]
- Tok, A.I.Y.; Boey, F.Y.C.; Dong, Z.; Sun, X. Hydrothermal synthesis of CeO2 nano-particles. J. Mater. Process. Technol. 2007, 190, 217–222. [Google Scholar] [CrossRef]
- Vieillard, P.; Tajeddine, L.; Gailhanou, H.; Blanc, P.; Lassin, A.; Gaboreau, S. Thermo-analytical techniques on MX-80 montmorillonite: A way to know the behavior of water and its thermodynamic properties during hydration–dehydration processes. Pharm. Anal. Acta 2015, 7, 1000462. [Google Scholar] [CrossRef]
- Abramov, A.; Keshavarz, A.; Iglauer, S. Wettability of fully hydroxylated and alkylated (001) α-quartz surface in carbon dioxide atmosphere. J. Phys. Chem. C 2019, 123, 9027–9040. [Google Scholar] [CrossRef]
- Fu, A.; Gu, W.; Larabell, C.; Alivisatos, A.P. Semiconductor nanocrystals for biological imaging. Curr. Opin. Neurobiol. 2005, 15, 568–575. [Google Scholar] [CrossRef]
- Nowakowski, P.; Villain, S.; Aguir, K.; Guerin, J.; Kopia, A.; Kusinski, J.; Guinneton, F.; Gavarri, J. Microstructure and electrical properties of RuO2–CeO2 composite thin films. Thin Solid Films 2010, 518, 2801–2807. [Google Scholar] [CrossRef]
- Kumar, E.; Selvarajan, P.; Muthuraj, D. Preparation and characterization of polyaniline/cerium dioxide (CeO2) nanocomposite via in situ polymerization. J. Mater. Sci. 2012, 47, 7148–7156. [Google Scholar] [CrossRef]
- Harlem, G.; Picaud, F.; Giradet, C.; Micheau, O. Nano-Carriers for Drug Delivery: Nanoscience and Nanotechnology in Drug Delivery; Elsevier: Amsterdam, The Netherlands, 2019. [Google Scholar]
- Shnoudeh, A.J.; Hamad, I.; Abdo, R.W.; Qadumii, L.; Jaber, A.Y.; Surchi, H.S.; Alkelany, S.Z. Synthesis, characterization, and applications of metal nanoparticles. In Biomaterials and Bionanotechnology; Academic Press: Massachusetts, CA, USA, 2019; pp. 527–612. [Google Scholar]
- Jalil, R.R.; Hussein, H. Influence of nano fluid on interfacial tension oil/water and wettability alteration of limestone. IOP Conf. Ser. Mater. Sci. Eng. 2019, 518, 062004. [Google Scholar] [CrossRef]
- Nowrouzi, I.; Manshad, A.K.; Mohammadi, A.H. Effects of dissolved binary ionic compounds and different densities of brine on interfacial tension (IFT), wettability alteration, and contact angle in smart water and carbonated smart water injection processes in carbonate oil reservoirs. J. Mol. Liq. 2018, 254, 83–92. [Google Scholar] [CrossRef]
- Chengara, A.; Nikolov, A.D.; Wasan, D.T.; Trokhymchuk, A.; Henderson, D. Spreading of nanofluids driven by the structural disjoining pressure gradient. J. Colloid Interface Sci. 2004, 280, 192–201. [Google Scholar] [CrossRef]
- Zargar, G.; Arabpour, T.; Manshad, A.K.; Ali, J.A.; Sajadi, S.M.; Keshavarz, A.; Mohammadi, A.H. Experimental investigation of the effect of green TiO2/Quartz nanocomposite on interfacial tension reduction, wettability alteration, and oil recovery improvement. Fuel 2020, 263, 116599. [Google Scholar] [CrossRef]
- Ali, J.; Manshad, A.K.; Imani, I.; Sajadi, S.M.; Keshavarz, A. Greenly synthesized magnetite@ SiO2@ xanthan nanocomposites and its application in enhanced oil recovery: IFT reduction and wettability alteration. Arab. J. Sci. Eng. 2020, 45, 7751–7761. [Google Scholar] [CrossRef]
- Ali, J.A.; Ali, J.A.; Manshad, A.K.; Mohammadi, A.H. Recent advances in application of nanotechnology in chemical enhanced oil recovery: Effects of nanoparticles on wettability alteration, interfacial tension reduction, and flooding. Egypt. J. Pet. 2018, 27, 1371–1383. [Google Scholar] [CrossRef]
- Moradi, S.; Isari, A.A.; Bachari, Z.; Mahmoodi, H. Combination of a new natural surfactant and smart water injection for enhanced oil recovery in carbonate rock: Synergic impacts of active ions and natural surfactant concentration. J. Pet. Sci. Eng. 2019, 176, 1–10. [Google Scholar] [CrossRef]
- Nowrouzi, I.; Manshad, A.K.; Mohammadi, A.H. Effects of concentration and size of TiO2 nano-particles on the performance of smart water in wettability alteration and oil production under spontaneous imbibition. J. Pet. Sci. Eng. 2019, 183, 106357. [Google Scholar] [CrossRef]
- Ali, J.A.; Kolo, K.; Manshad, A.K.; Stephen, K.; Keshavarz, A. Modification of LoSal water performance in reducing interfacial tension using green ZnO/SiO2 nanocomposite coated by xanthan. Appl. Nanosci. 2018, 9, 397–409. [Google Scholar] [CrossRef]
- Najimi, S.; Nowrouzi, I.; Manshad, A.K.; Farsangi, M.H.; Hezave, A.Z.; Ali, J.A.; Keshavarz, A.; Mohammadi, A.H. Investigating the effect of [C8Py][Cl] and [C18Py][Cl] ionic liquids on the water/oil interfacial tension by considering Taguchi method. J. Pet. Explor. Prod. Technol. 2019, 9, 2933–2941. [Google Scholar] [CrossRef]
- Asl, H.F.; Zargar, G.; Manshad, A.K.; Takassi, M.A.; Ali, J.A.; Keshavarz, A. Effect of SiO2 nanoparticles on the performance of L-Arg and L-Cys surfactants for enhanced oil recovery in carbonate porous media. J. Mol. Liq. 2020, 300, 112290. [Google Scholar] [CrossRef]
- Asl, H.F.; Zargar, G.; Manshad, A.K.; Takassi, M.A.; Ali, J.A.; Keshavarz, A. Experimental investigation into l-Arg and l-Cys eco-friendly surfactants in enhanced oil recovery by considering IFT reduction and wettability alteration. Pet. Sci. 2019, 17, 105–117. [Google Scholar] [CrossRef]
- Manshad, A.; Ali, J.; Imani, I.; Tayeb, N.; Keshavarz, A. Green synthesize of CuO@ Fe3O4@ xantan nanocomposites and its application in enhanced oil recovery by considering IFT and wettability behaviors. Micro Nano Lett. 2020, 15, 550–555. [Google Scholar] [CrossRef]
- Al-Anssari, S.; Barifcani, A.; Keshavarz, A.; Iglauer, S. Impact of nanoparticles on the CO2-brine interfacial tension at high pressure and temperature. J. Colloid Interface Sci. 2018, 532, 136–142. [Google Scholar] [CrossRef] [PubMed]
- Alizadeh, A.H.; Keshavarz, A.; Haghighi, M. Flow rate effect on two-phase relative permeability in Iranian carbonate rocks. In Proceedings of the SPE Middle East Oil and Gas Show and Conference, Manama, Bahrain, 11–14 March 2007; Society of Petroleum Engineers: Richardson, TX, USA, 2007. [Google Scholar]


| Year [Reference] | Author | Material | Result |
|---|---|---|---|
| 2001 [30] | Alomair et al. | SiO2, Al2O3, and NiO | SiO2 and NiO NPs have the highest and lowest effect on IFT reduction, respectively. The low IFT reduction by NiO NPs is attributed to the high adsorption of the NiO NPs on the rock surface. |
| 2008 [31] | Jiang et al. | Fe2O3/Fe3O4 | Iron Oxide can increase the RF up to 82.5% under laboratory conditions. |
| 2009 [32] | Shah et al. | CuO NP | Can increase oil recovery from heavy oil reservoirs. |
| 2010 [33] | Yuan et al. | Polymeric microspheres and nanospheres | Can reduce the water cut and increase the sweep efficiency and oil recovery. |
| 2012 [34] | Bagherzadeh et al. | MgO, Al2O3, CeO2, CNT, SiO2, TiO2, CaCO3, ZrO2 | Applied in both carbonate and sandstone core samples. CaCo3 and SiO2 generally had the highest recovery factor. MgO nanoparticles can prevent fines migration. |
| 2013 [18] | Hendraningrat et al. | Al2O3, TiO2, SiO2 | Nanofluids containing Al2O3 can change the wettability of sandstone cores from oil-wet to water-wet. TiO2 can alter the wettability of quartz plate to water-wet better than Al2O3 and SiO2. |
| 2015 [34] | Roustaei et al. | Nanofluid with SiO2 NPs | SiO2 NPs can be considered as potential wettability modifiers. |
| 2014 [35] | Mohsen Seid Mohammadi et al. | γ-AL2O3 | ϒ-AL2O3 adsorption on calcite surface can alter the wettability from an oil-wet to a water-wet and increase the RF from 11.25% to 65%. |
| 2015 [36] | Adel et al. | Al2O3 and SiO2 and nanofluid | IFT reduction occurs when each of the NPs are added to the brine. Al2O3 nanofluid had higher IFT compared to SiO2. Hence, Al2O3 has a lower potential to produce more oil compared to SiO2. |
| 2015 [37] | Maghzi et al. | SiO2 NPs | SiO2 NPs can change the wettability from oil-wet to water-wet irrespective of the oil viscosity. |
| 2016 [38] | Kapusta et al. | SiO2 | SiO2 can alter the wettability of an oil-wet and mixed-wet calcite layer. The NP adsorption occurs on the surface and it is irreversible. |
| 2016 [19] | Assef et al. | MgO on LoSal water flooding | Adding MgO NPs into a low salinity solution leads to more positive zeta potential in the porous medium. |
| 2019 [39] | Bahraminejad et al. | CuO/TiO2/PAM | This nanocomposite can reduced water−oil IFT by about 46% at a low concentration of 200 ppm and can change the wettability of carbonate rocks from oil-wet to strongly water-wet (from 151° to 14.7°). |
| 2020 [40] | Nowrouzi et al. | TiO2, MgO, γ-Al2O3 | TiO2 NPs can change the wettability from oil-wet to water-wet and increase the recovery factor up to 75.93%. |
| Component | C1 | C2 | C3 | iC4 | nC4 | iC5 | nC5 | C6 | C7 | C8 | C9 | C10 | C11 | C12+ | Total |
|---|---|---|---|---|---|---|---|---|---|---|---|---|---|---|---|
| Molar % | 0.00 | 0.08 | 0.73 | 0.72 | 2.22 | 1.10 | 1.10 | 8.66 | 9.32 | 6.60 | 7.14 | 5.36 | 5.01 | 51.96 | 100.0 |
| Molecular weight (MW) = 247 Molecular weight of C+12 = 380 Specific gravity of C12 +@ 15.55 °C = 0.9369 Saturation pressure of reservoir fluid @ 60.6 °C = 14.04 MPa | SARA analysis of oil sample | ||||||||||||||
| Saturates (%) | Aromatics (%) | Resins (%) | Asphaltene (%) | ||||||||||||
| 45 | 32 | 5 | 8 | ||||||||||||
| NC Concentration [ppm] | Zeta Potential (mv) | pH | Viscosity (cP) | Conductivity (µs/cm) | Density (g/cm3) | IFT (mN/m) |
|---|---|---|---|---|---|---|
| 100 | −20.8 | 6.56 | 1.3 | 169 | 0.9992 | 28 |
| 250 | −20.7 | 6.25 | 1.33 | 270 | 0.9992 | 24 |
| 500 | −27.1 | 6.07 | 1.41 | 480 | 0.9993 | 17 |
| 1000 | −20.7 | 5.95 | 1.38 | 380 | 0.9996 | 23 |
| 1500 | −20 | 6.01 | 1.41 | 470 | 0.9998 | 24 |
| 2000 | −16.9 | 6.64 | 1.40 | 524 | 1.0004 | 26 |
| Nano Fluid Concentration (ppm) | Initial CA | Final CA of Carbonate | Final CA of Sandstone |
|---|---|---|---|
| 100 | Carbonate 150 |  139 |  137 |
| Sandstone 140 | |||
| 250 | Carbonate 150 |  113 |  123 |
| Sandstone 140 | |||
| 500 | Carbonate 150 |  53 |  90 |
| Sandstone 140 | |||
| 1000 | Carbonate 150 |  66 |  87 |
| Sandstone 140 | |||
| 1500 | Carbonate 150 |  78 |  75 |
| Sandstone 140 | |||
| 2000 | Carbonate 150 |  90 |  69 |
Publisher’s Note: MDPI stays neutral with regard to jurisdictional claims in published maps and institutional affiliations. |
© 2020 by the authors. Licensee MDPI, Basel, Switzerland. This article is an open access article distributed under the terms and conditions of the Creative Commons Attribution (CC BY) license (http://creativecommons.org/licenses/by/4.0/).
Share and Cite
Javad Nazarahari, M.; Khaksar Manshad, A.; Moradi, S.; Shafiei, A.; Abdulazez Ali, J.; Sajadi, S.M.; Keshavarz, A. Synthesis, Characterization, and Assessment of a CeO2@Nanoclay Nanocomposite for Enhanced Oil Recovery. Nanomaterials 2020, 10, 2280. https://doi.org/10.3390/nano10112280
Javad Nazarahari M, Khaksar Manshad A, Moradi S, Shafiei A, Abdulazez Ali J, Sajadi SM, Keshavarz A. Synthesis, Characterization, and Assessment of a CeO2@Nanoclay Nanocomposite for Enhanced Oil Recovery. Nanomaterials. 2020; 10(11):2280. https://doi.org/10.3390/nano10112280
Chicago/Turabian StyleJavad Nazarahari, Mohammad, Abbas Khaksar Manshad, Siyamak Moradi, Ali Shafiei, Jagar Abdulazez Ali, S. Mohammad Sajadi, and Alireza Keshavarz. 2020. "Synthesis, Characterization, and Assessment of a CeO2@Nanoclay Nanocomposite for Enhanced Oil Recovery" Nanomaterials 10, no. 11: 2280. https://doi.org/10.3390/nano10112280
APA StyleJavad Nazarahari, M., Khaksar Manshad, A., Moradi, S., Shafiei, A., Abdulazez Ali, J., Sajadi, S. M., & Keshavarz, A. (2020). Synthesis, Characterization, and Assessment of a CeO2@Nanoclay Nanocomposite for Enhanced Oil Recovery. Nanomaterials, 10(11), 2280. https://doi.org/10.3390/nano10112280