Surface-Enhanced Raman Scattering-Based Lateral-Flow Immunoassay


Abstract
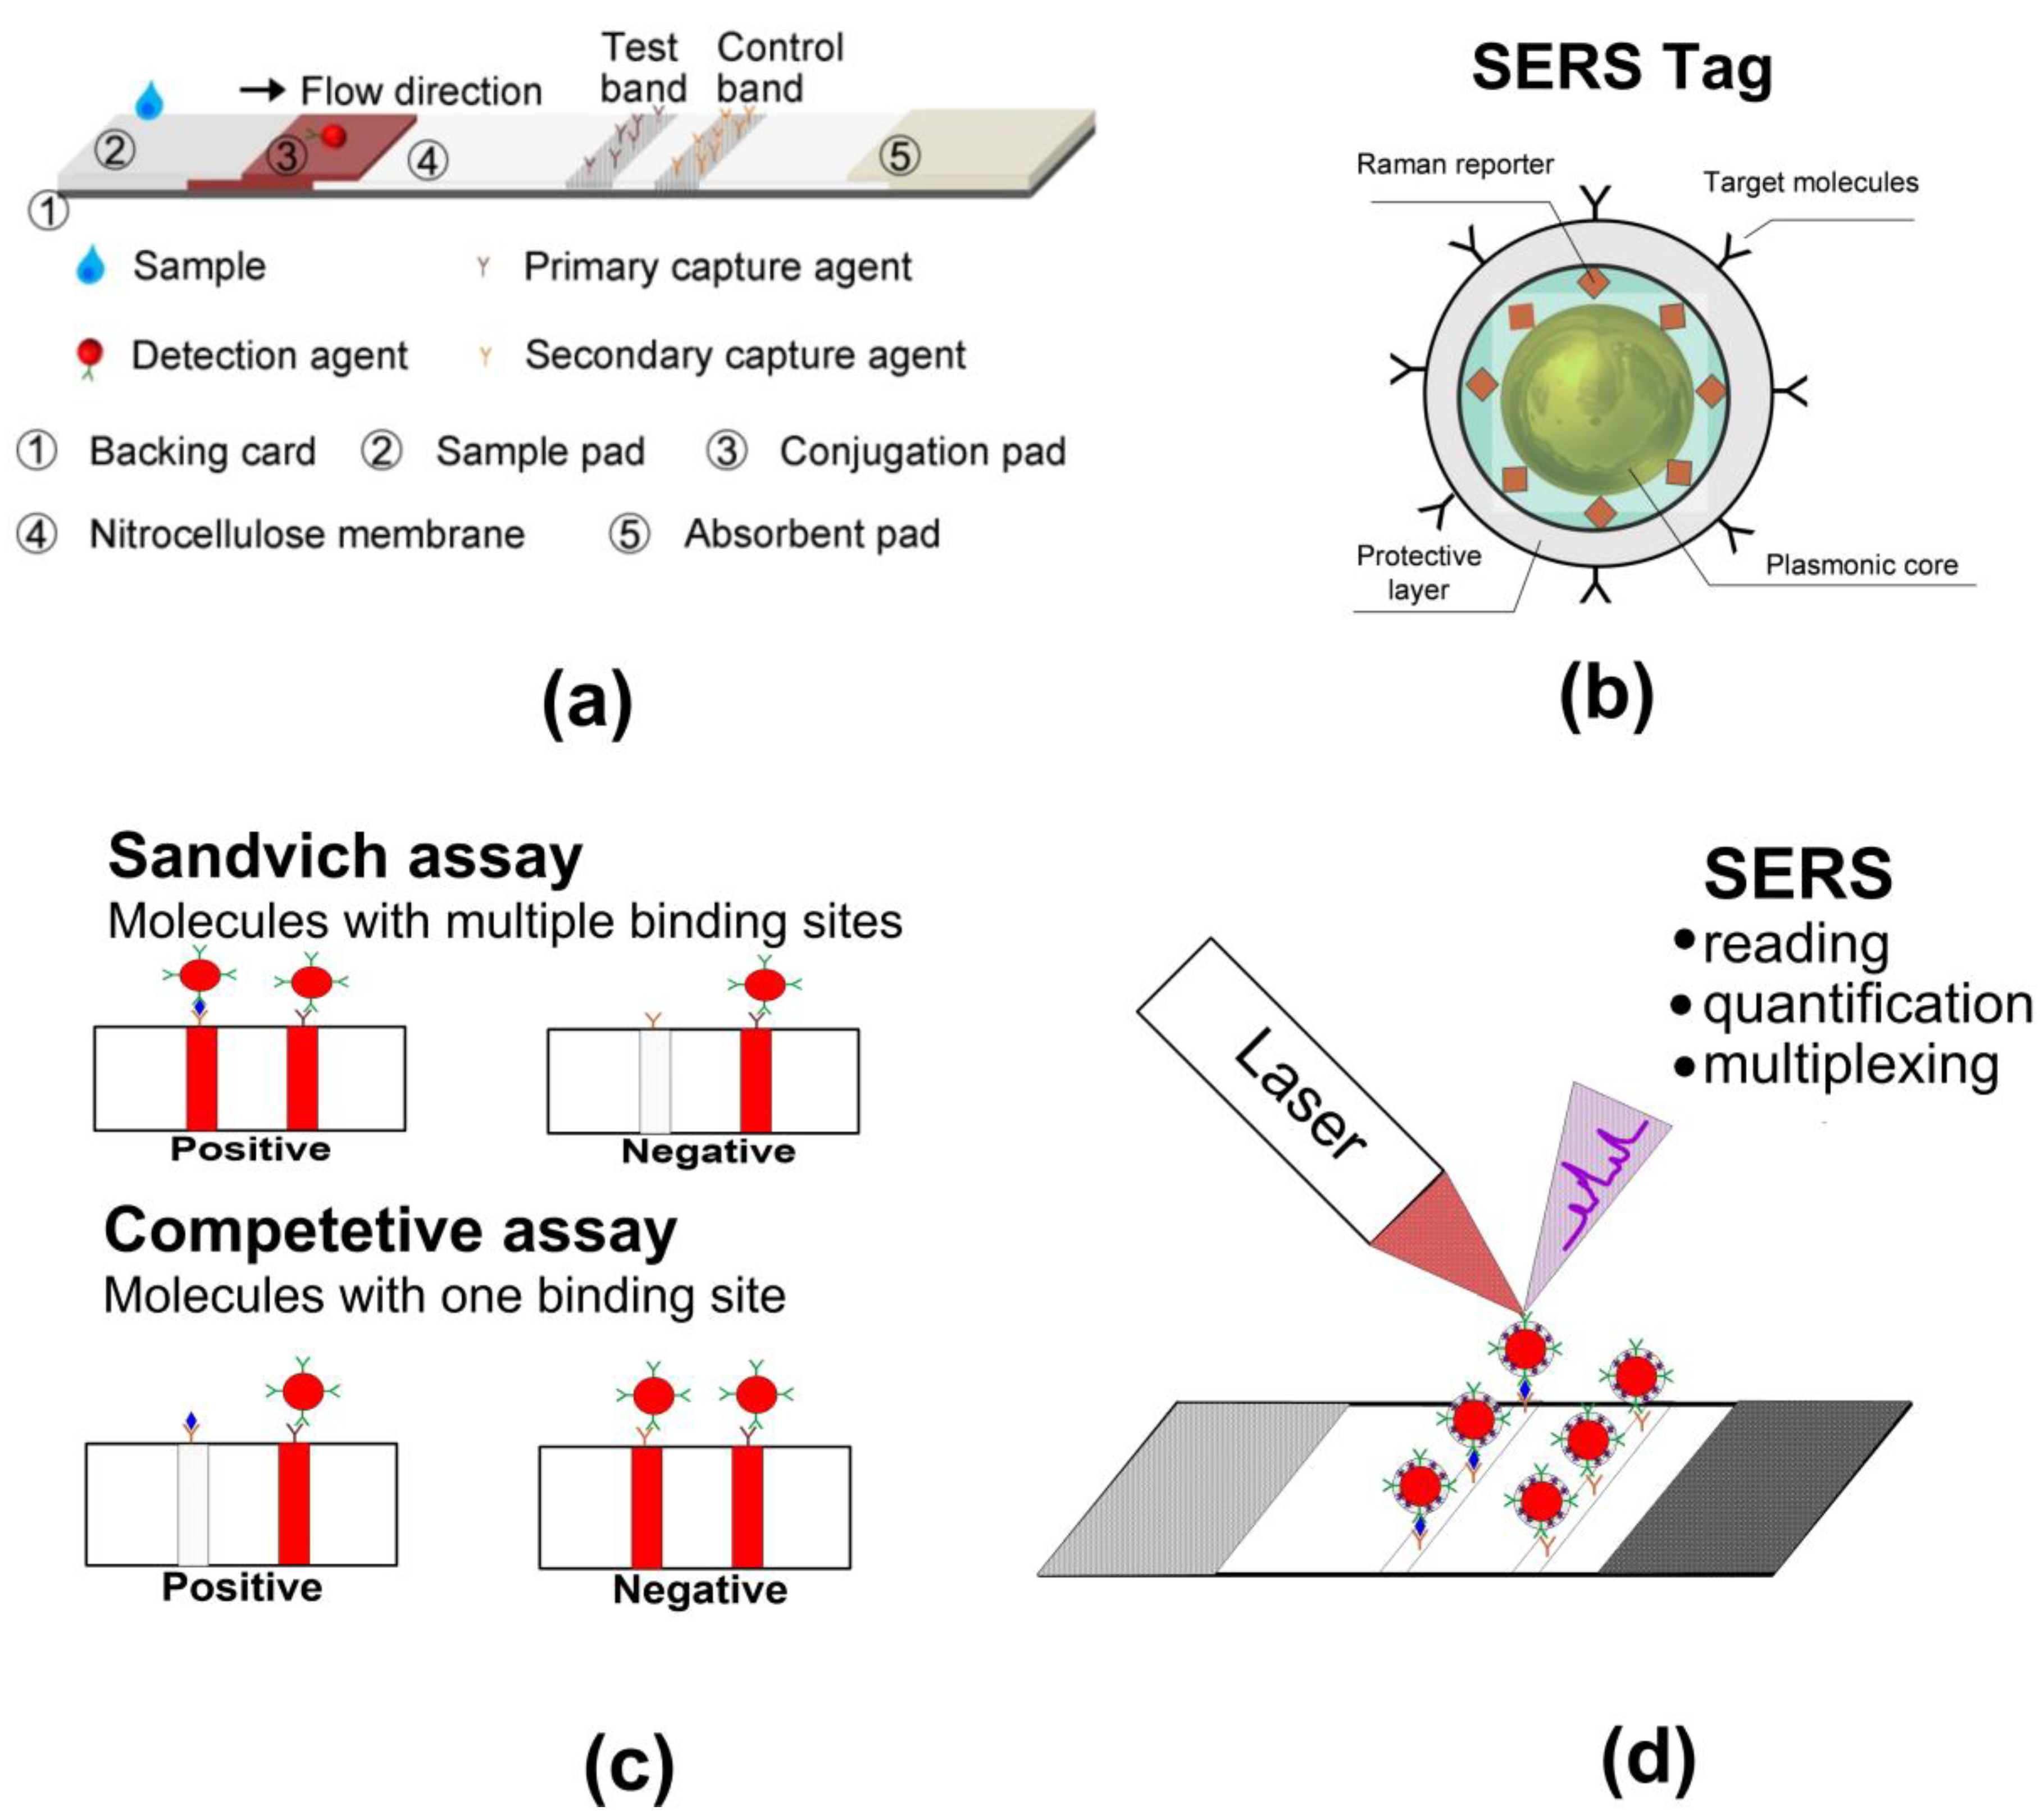
1. Introduction
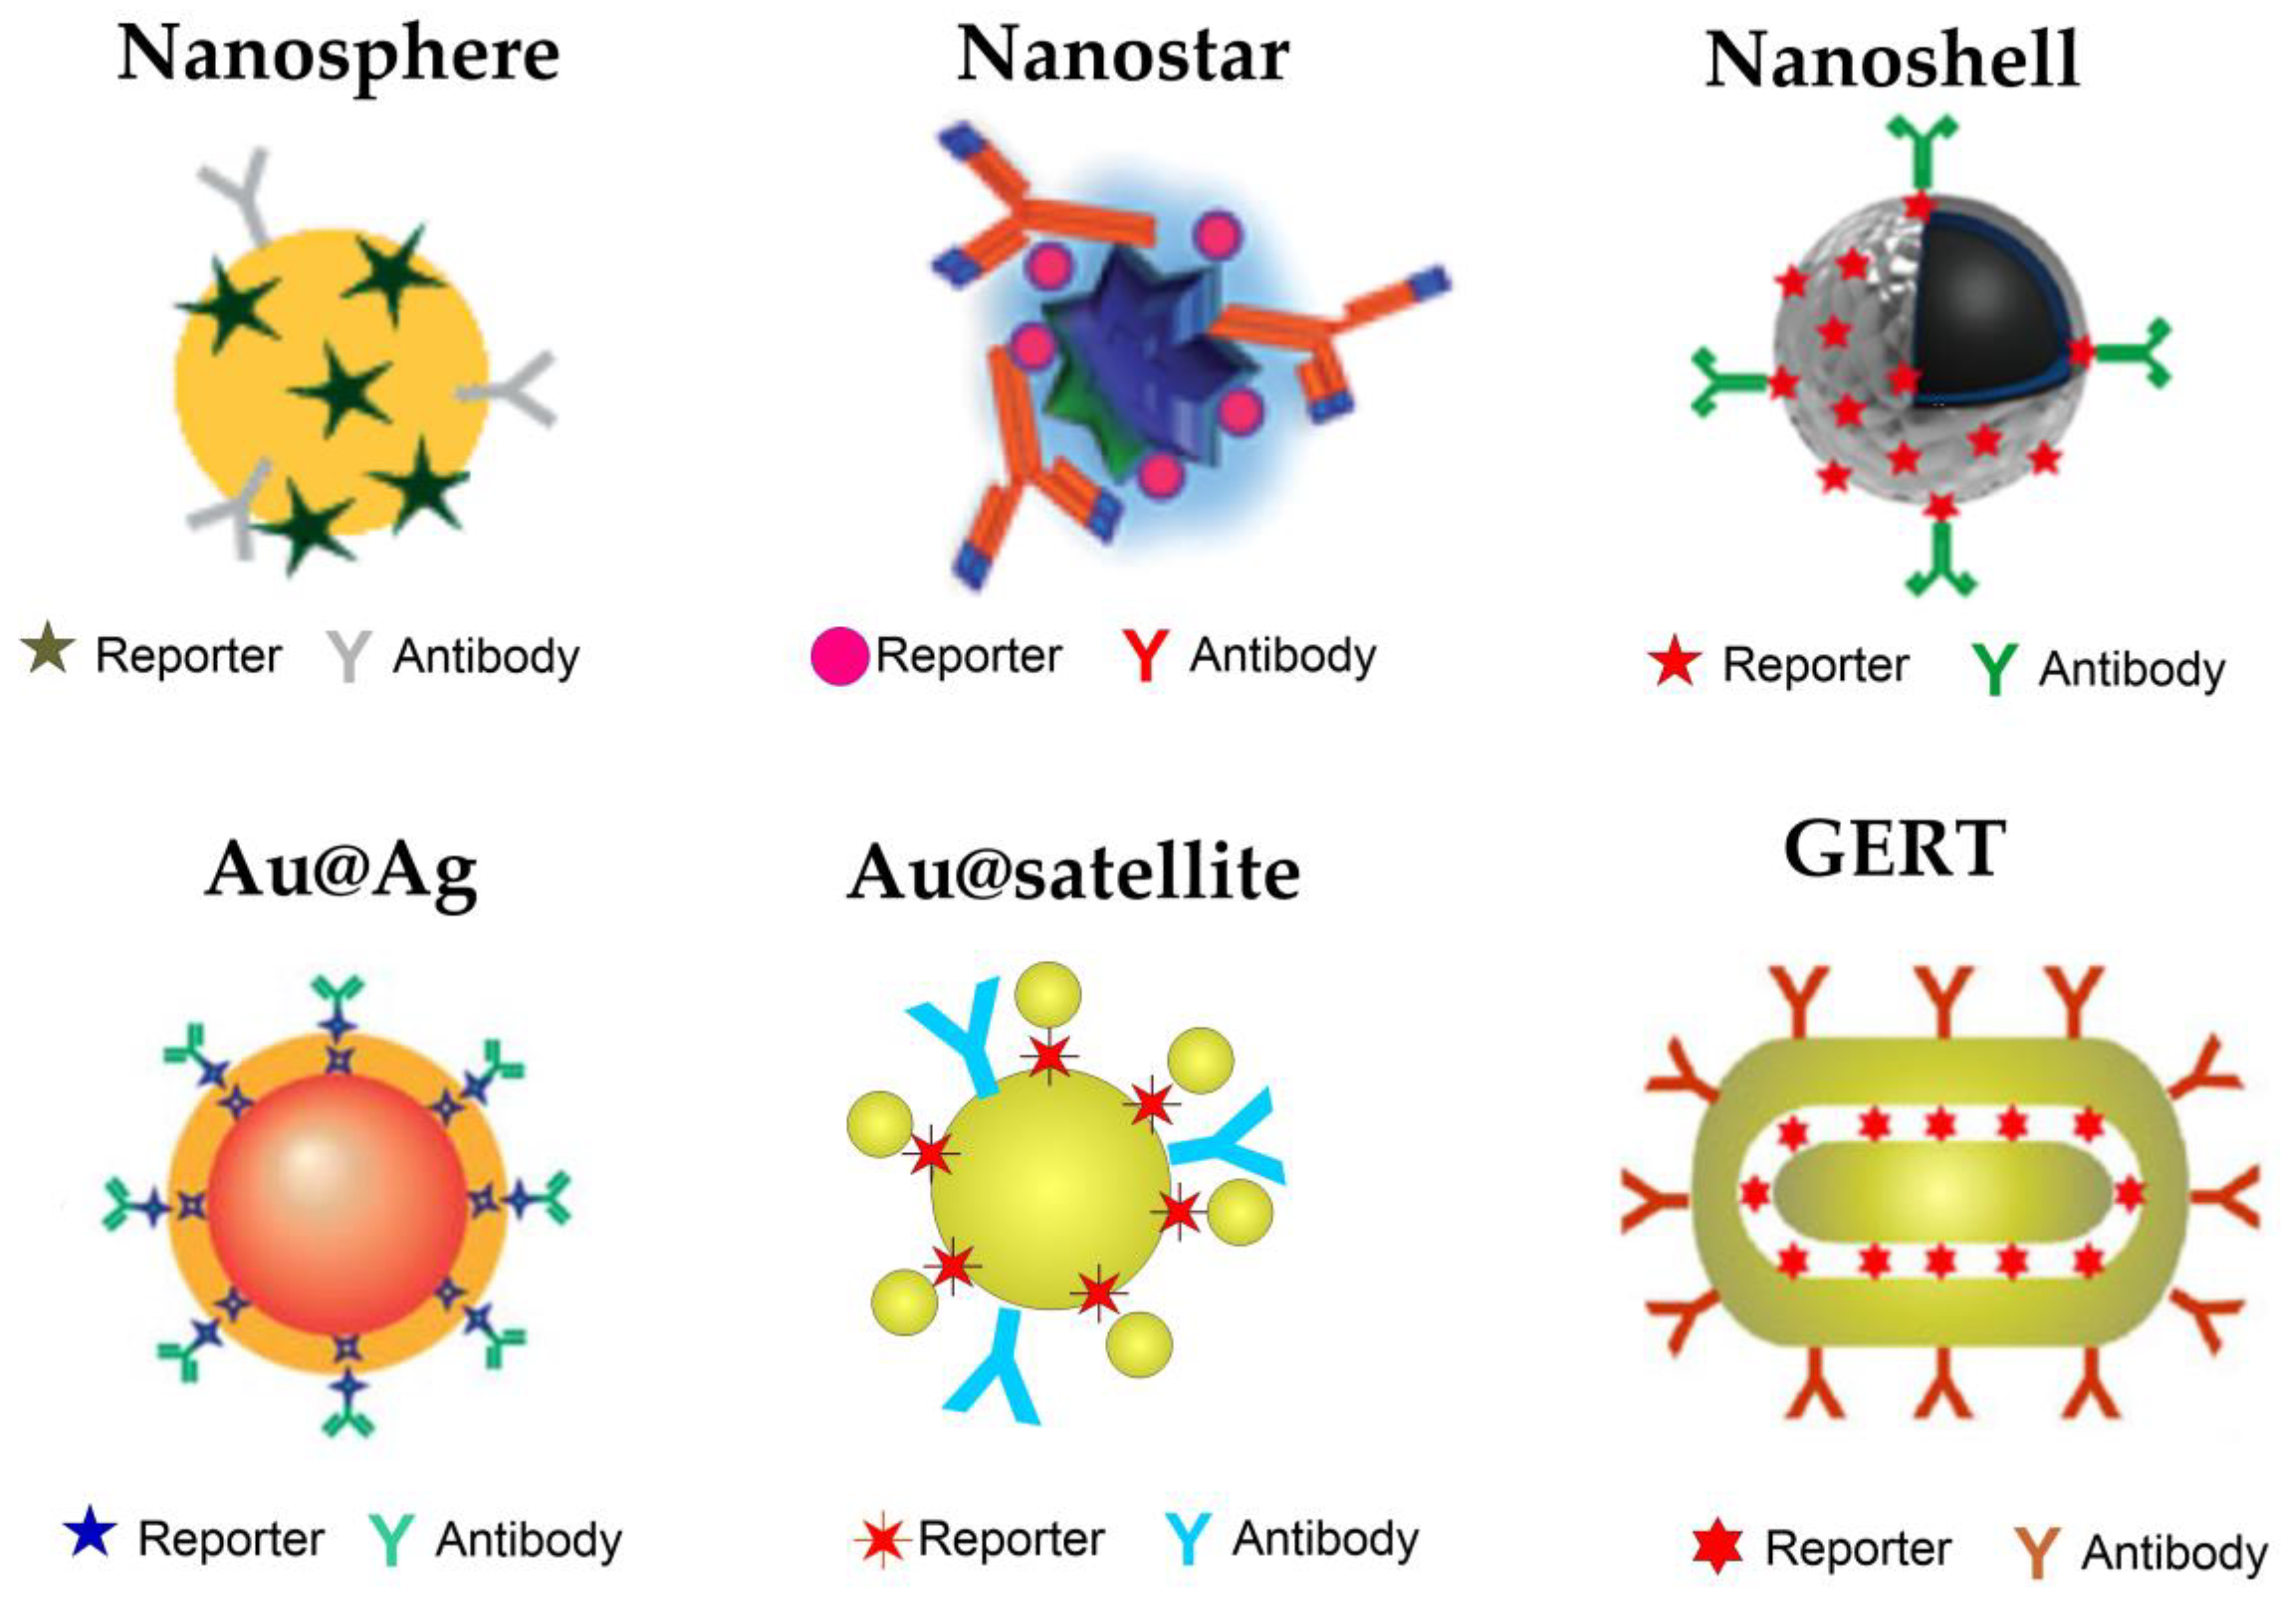
2. SERS Tags for LFIA
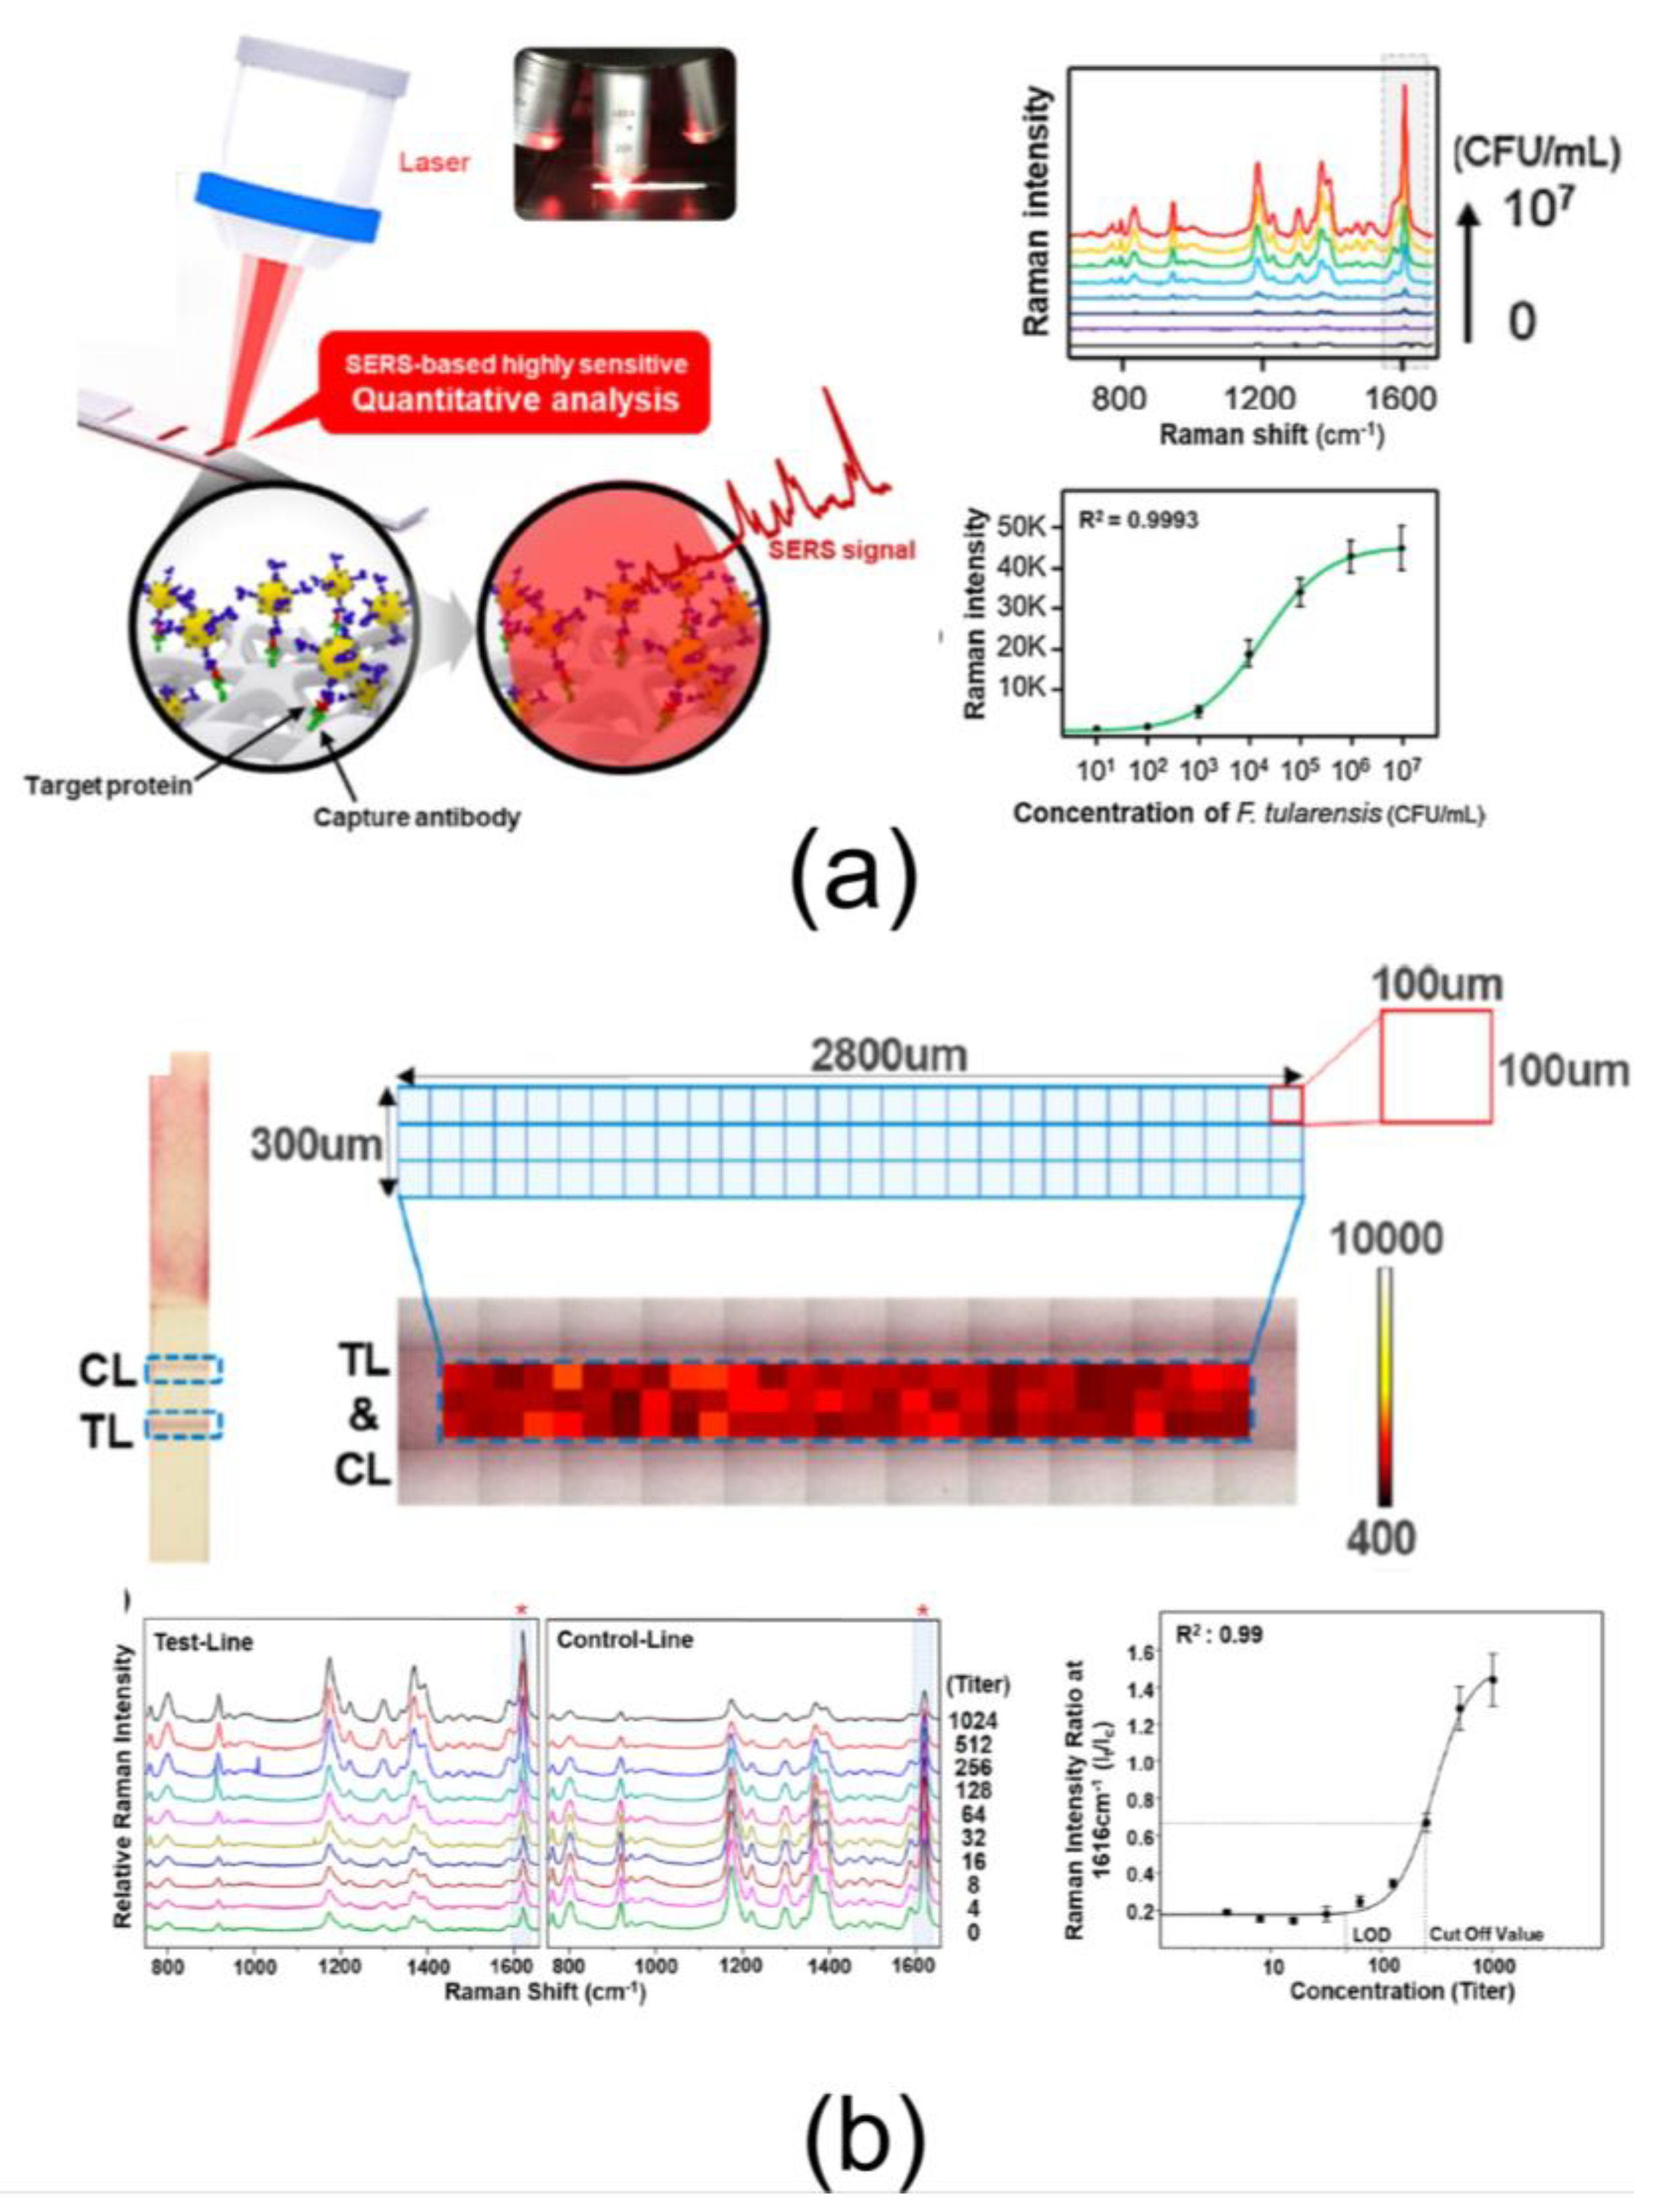
3. SERS Signal Accumulation and Data Processing
4. Limit of Detection for SERS LFIA
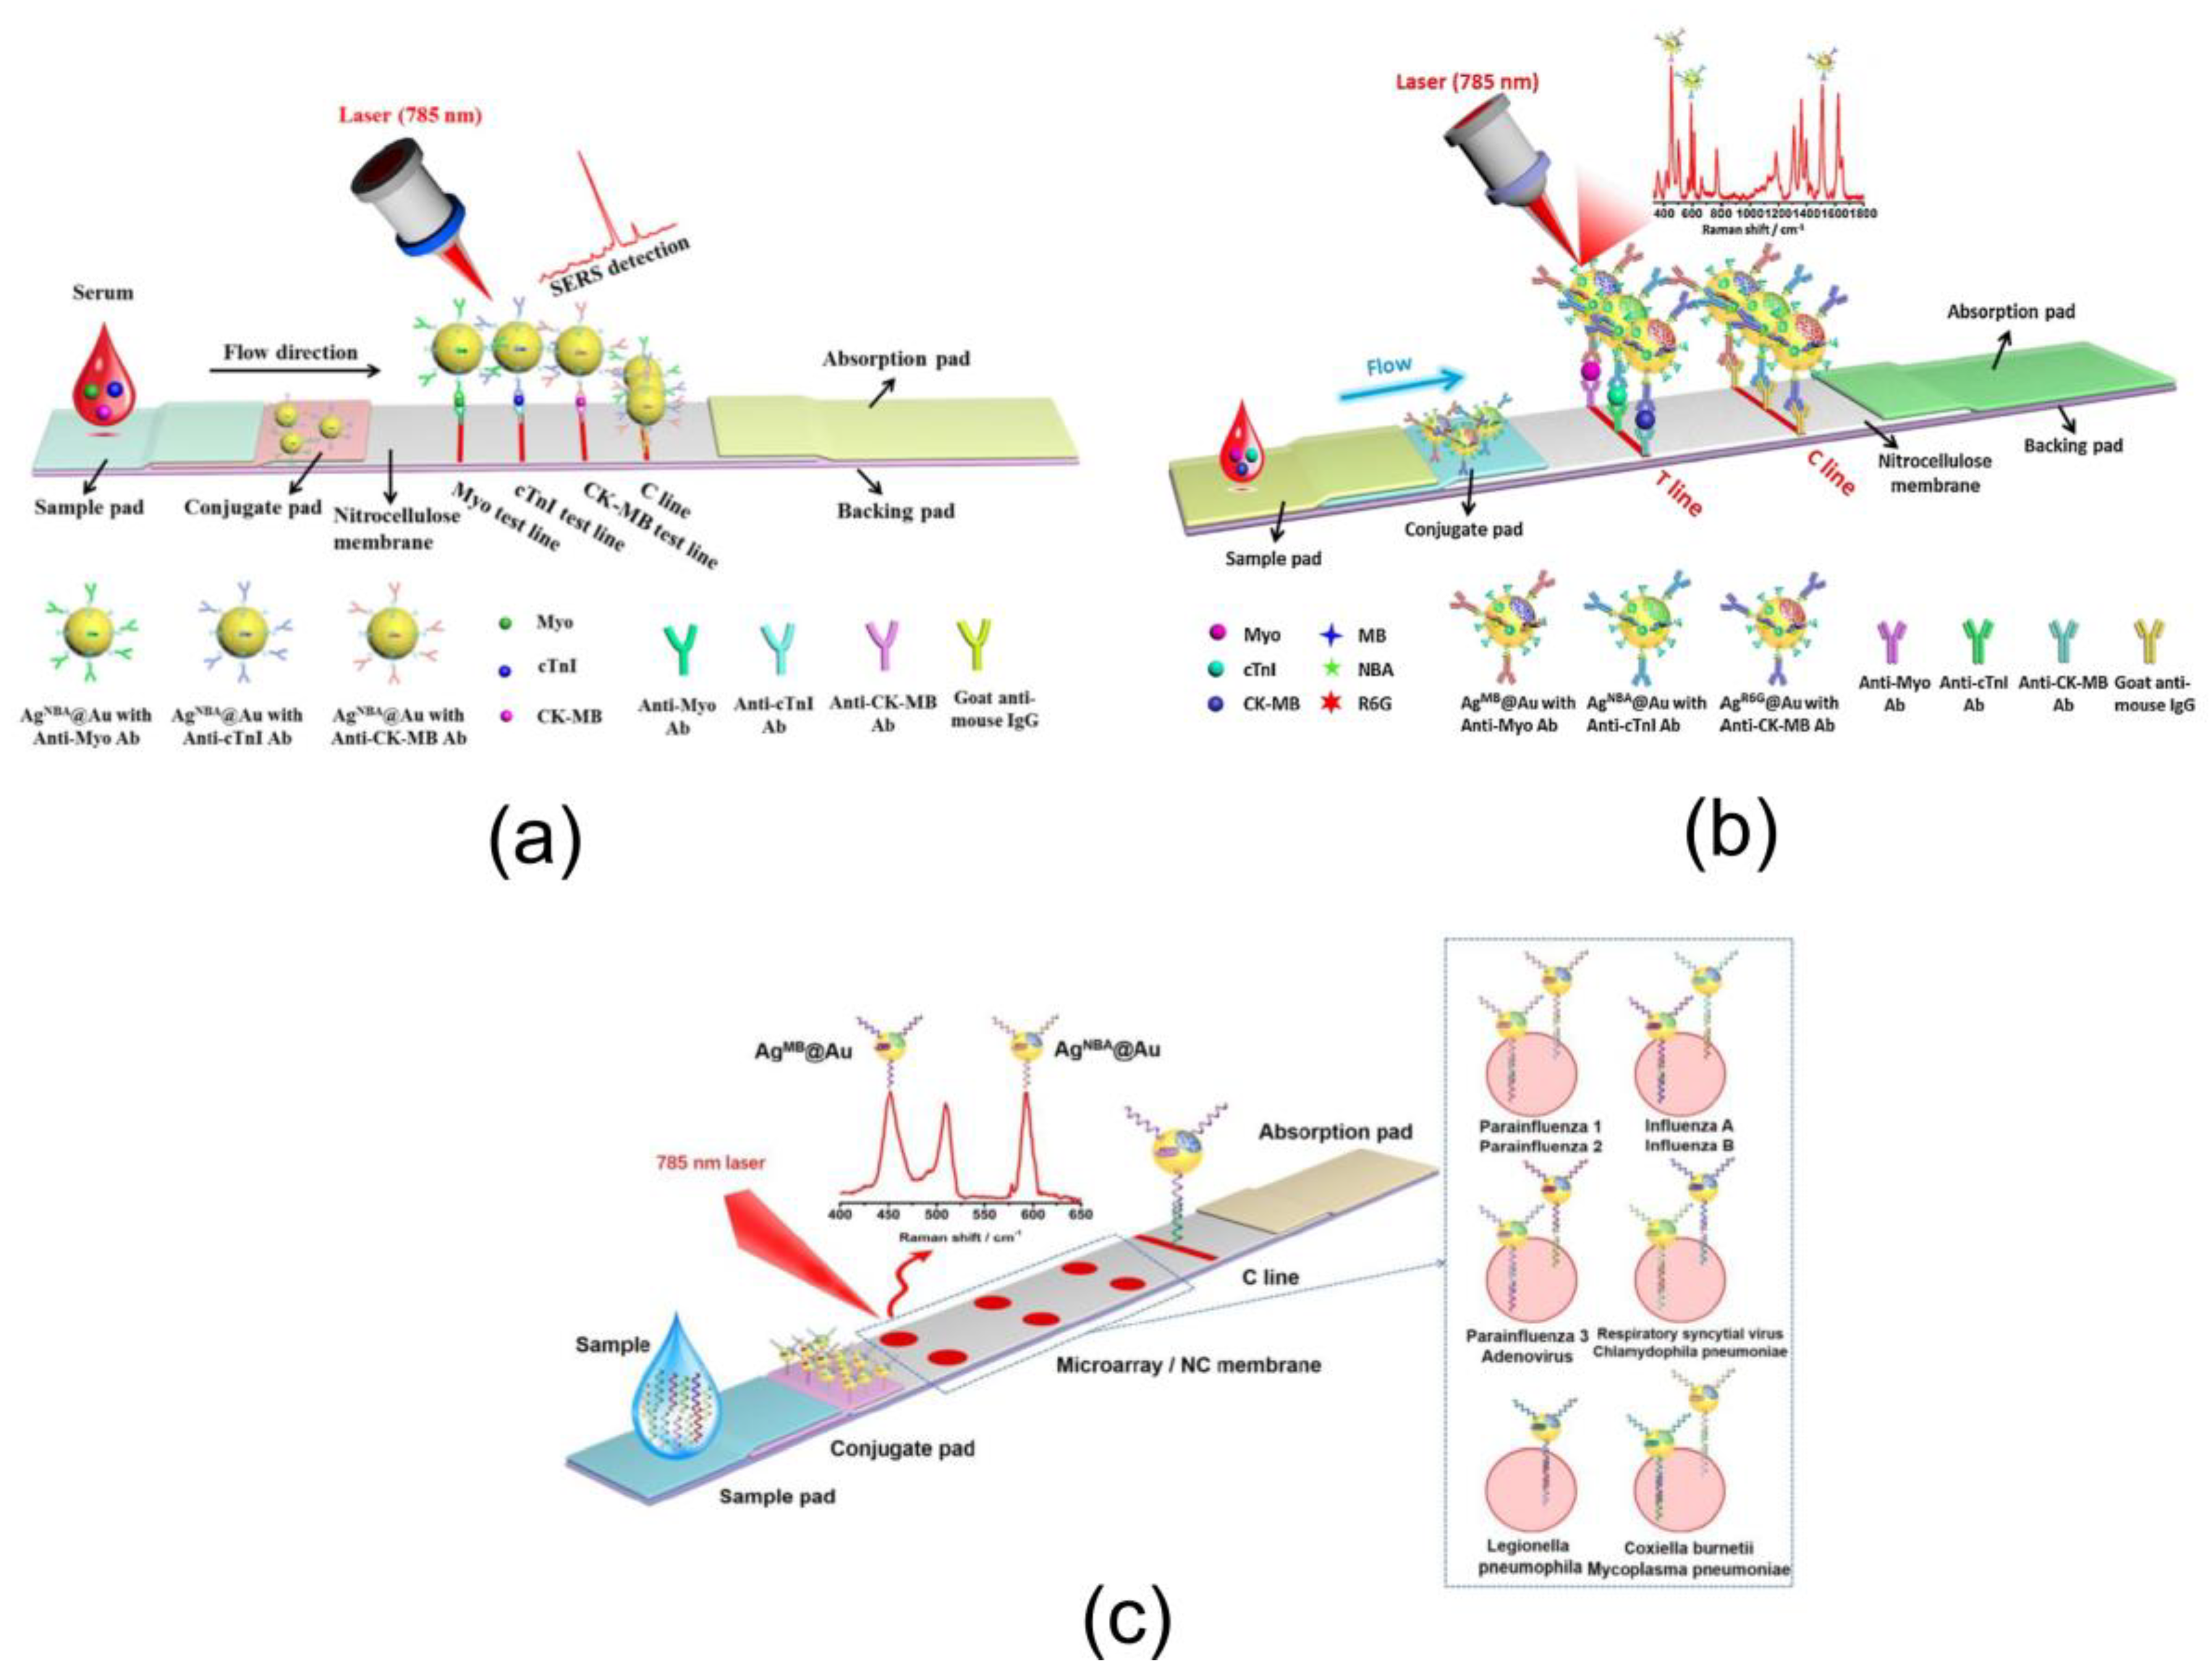
5. Multiplex Biomarker Detection
6. Conclusions
Author Contributions
Funding
Acknowledgments
Conflicts of Interest
References
- Osikowicz, G.; Beggs, M.; Brookhart, P.; Caplan, D.; Ching, S.; Eck, P.; Gordon, J.; Richerson, R.; Sampedro, S.; Stimpson, D. One-step chromatographic immunoassay for qualitative determination of choriogonadotropin in urine. Clin. Chem. 1990, 36, 1586. [Google Scholar] [CrossRef] [PubMed]
- Verheijen, R.; Stouten, P.; Cazemier, G.; Haasnoot, W. Development of a one step strip test for the detection of sulfadimidine residues. Analyst 1998, 123, 2437–2441. [Google Scholar] [CrossRef] [PubMed]
- Kim, H.; Chung, D.R.; Kang, M. A new point-of-care test for diagnosis of infectious diseases based on multiplex lateral flow immunoassay. Analyst 2019, 144, 2460–2466. [Google Scholar] [CrossRef] [PubMed]
- Guo, J.; Chen, S.; Guo, J.; Ma, X. Nanomaterial labels in lateral flow immunoassays for point-of-care-testing. J. Mater. Sci. Technol. 2020, 60, 90–104. [Google Scholar] [CrossRef]
- Li, F.; You, M.; Li, S.; Hue, J.; Liu, C.; Gonge, Y.; Yang, H.; Xu, F. Paper-based point-of-care immunoassays: Recent advances and emerging trends. Biotechnol. Adv. 2020, 39, 107442. [Google Scholar] [CrossRef]
- Bishop, J.D.; Hsieh, H.V.; Gasperino, D.J.; Weig, B.H. Sensitivity enhancement in lateral flow assays: A systems perspective. Lab Chip 2019, 19, 2486–2499. [Google Scholar] [CrossRef]
- Hristov, D.R.; Rodriguez-Quijada, C.; Gomez-Marquez, J.; Hamad-Schifferli, K. Designing paper-based immunoassays for biomedical applications. Sensors 2019, 19, 554. [Google Scholar] [CrossRef]
- Ye, H.; Liu, Y.; Zhan, L.; Liu, Y.; Qin, Z. Signal amplification and quantification on lateral flow assays by laser excitation of plasmonic nanomaterials. Theranostics 2020, 10, 4359–4373. [Google Scholar] [CrossRef]
- Dykman, L.; Khlebtsov, N. Gold nanoparticles in biomedical applications: Recent advances and perspectives. Chem. Soc. Rev. 2012, 41, 2256–2282. [Google Scholar] [CrossRef]
- Wang, P.; Lin, Z.H.; Su, X.; Tang, Z.H. Application of Au based nanomaterials in analytical science. Nano Today 2017, 12, 64–97. [Google Scholar] [CrossRef]
- Khlebtsov, B.N.; Tumskiy, R.S.; Burov, A.M.; Pylaev, T.E.; Khlebtsov, N.G. Quantification of nanoparticle numbers in the test zone of lateral flow immunoassay strips. ACS Appl. Nano Mater. 2019, 2, 5020–5028. [Google Scholar] [CrossRef]
- Urusov, A.E.; Zherdev, A.V.; Dzantiev, B.B. Towards lateral flow quantitative assays: Detection approaches. Biosensors 2019, 9, 89. [Google Scholar] [CrossRef] [PubMed]
- Nelis, J.L.D.; Tsagkaris, A.S.; Dillon, M.J.; Hajslova, J.; Elliott, C.T. Smartphone-based optical assays in the food safety field. TrAC Trends Anal. Chem. 2020, 129, 115934. [Google Scholar] [CrossRef] [PubMed]
- Li, X.; Yang, F.; Wong, J.X.; Yu, H.-Z. Integrated smartphone-app-chip system for on-site parts-per-billion-level colorimetric quantitation of aflatoxins. Anal. Chem. 2017, 89, 8908–8916. [Google Scholar] [CrossRef]
- Wang, Y.; Yan, B.; Chen, L. SERS Tags: Novel optical nanoprobes for bioanalysis. Chem. Rev. 2013, 113, 1391–1428. [Google Scholar] [CrossRef]
- Wang, Z.H.; Zong, S.H.; Wu, l.; Zhu, D.; Cui, Y. SERS-activated platforms for immunoassay: Probes, encoding methods, and applications. Chem. Rev. 2017, 117, 7910–7963. [Google Scholar] [CrossRef]
- Khlebtsov, B.N.; Burov, A.M.; Bratashov, D.N.; Tumskiy, R.S.; Khlebtsov, N.G. Petal-like gap-enhanced Raman tags with controllable structures for high-speed Raman imaging. Langmuir 2020, 36, 5546–5553. [Google Scholar] [CrossRef]
- Doering, W.E.; Piotti, M.E.; Natan, M.J.; Freeman, R.G. SERS as a foundation for nanoscale, optically detected biological labels. Adv. Mater. 2007, 19, 3100–3108. [Google Scholar] [CrossRef]
- Choi, S.; Hwang, J.; Lee, S.; Lim, D.W.; Joo, H.; Choo, J. Quantitative analysis of thyroid-stimulating hormone (TSH) using SERS-based lateral flow immunoassay. Sens. Actuat. B Chem. 2017, 240, 358–364. [Google Scholar] [CrossRef]
- Fu, X.; Cheng, Z.; Yu, J.; Choo, P.; Chen, L.; Choo, J. A SERS-based lateral flow assay biosensor for highly sensitive detection of HIV-1DNA. Biosens. Bioelectron. 2016, 78, 530–537. [Google Scholar] [CrossRef]
- Gao, X.; Zheng, P.; Kasani, S.; Wu, S.; Yang, F.; Lewis, S.; Nayeem, S.; Engler-Chiurazzi, E.; Wigginton, J.; Simpkins, J.W.; et al. Paper-based surface-enhanced Raman scattering lateral flow strip for detection of neuron-specific enolase in blood plasma. Anal. Chem. 2017, 89, 10104–10110. [Google Scholar] [CrossRef] [PubMed]
- Ilhan, H.; Guven, B.; Dogan, U.; Torul, H.; Evran, S.; Çetin, D.; Suludere, Z.; Saglam, N.; Boyaci, I.H.; Tamer, U. The coupling of immunomagnetic enrichment of bacteria with paper-based platform. Talanta 2019, 201, 245–252. [Google Scholar] [CrossRef] [PubMed]
- Jeon, J.; Lee, S.H.; Joung, Y.; Kim, K.; Choi, N.; Choo, J. Improvement of reproducibility and thermal stability of surface-enhanced Raman scattering-based lateral flow assay strips using silica-encapsulated gold nanoparticles. Sens. Actuat. B Chem. 2020, 321, 128521. [Google Scholar] [CrossRef]
- Lee, S.H.; Hwang, J.; Kim, K.; Jeon, J.; Lee, S.; Ko, J.; Lee, J.; Kang, M.; Chung, D.R.; Choo, J. Quantitative serodiagnosis of scrub typhus using surface-enhanced Raman scattering-based lateral flow assay platforms. Anal. Chem. 2019, 91, 12275–12282. [Google Scholar] [CrossRef] [PubMed]
- Li, Y.; Tang, S.; Zhang, W.; Cui, X.; Zhang, Y.; Jin, Y.; Zhang, X.; Chen, Y. A surface-enhanced Raman scattering-based lateral flow immunosensor for colistin in raw milk. Sens. Actuat. B Chem. 2019, 282, 703–711. [Google Scholar] [CrossRef]
- Pissuwan, D.; Gazzana, C.; Mongkolsuk, S.; Cortie, M.B. Single and multiple detections of foodborne pathogens by gold nanoparticle assays. WIREs Nanomed. Nanobiotechnol. 2020, 12, e1584. [Google Scholar] [CrossRef] [PubMed]
- Rong, Z.; Xiao, R.; Xing, S.; Xiong, G.; Yu, Z.; Wang, L.; Jia, X.; Wang, K.; Wang, S.; Cong, Y. SERS-based lateral flow assay for quantitative detection of C-reactive protein as an early bio-indicator of radiation-induced inflammatory response in nonhuman primates. Analyst 2018, 143, 2115–2121. [Google Scholar] [CrossRef]
- Stambach, N.R.; Carr, S.A.; Cox, C.R.; Voorhees, K.J. Rapid detection of listeria by bacteriophage amplification and sers-lateral flow immunochromatography. Viruses 2015, 7, 6631–6641. [Google Scholar] [CrossRef]
- Wang, Y.; Sun, J.; Hou, Y.; Zhang, C.; Li, D.; Li, H.; Yang, M.; Fan, C.; Sun, B. A SERS-based lateral flow assay biosensor for quantitative and ultrasensitive detection of interleukin-6 in unprocessed whole blood. Biosens. Bioelectron. 2019, 141, 111432. [Google Scholar] [CrossRef]
- Wang, Y.; Hou, Y.; Li, H.; Yang, M.; Zhao, P.; Sun, B. A SERS-based lateral flow assay for the stroke biomarker S100-β. Microchim. Acta 2019, 186, 548. [Google Scholar] [CrossRef]
- Wang, R.; Kim, K.; Choi, N.; Wang, X.; Lee, J.; Jeon, J.H.; Rhie, G.; Choo, J. Highly sensitive detection of high-risk bacterial pathogens using SERS-based lateral flow assay strips. Sens. Actuat. B Chem. 2018, 270, 72–79. [Google Scholar] [CrossRef]
- Wu, Z. Simultaneous detection of listeria monocytogenes and salmonella typhimurium by a sers-based lateral flow immunochromatographic assay. Food Analyt. Meth. 2019, 12, 1086–1091. [Google Scholar] [CrossRef]
- Dzantiev, B.B.; Byzova, N.A.; Urusov, A.E.; Zherdev, A.V. Immunochromatographic methods in food analysis (Review). TrAC Trends Anal. Chem. 2014, 55, 81–93. [Google Scholar] [CrossRef]
- Khlebtsov, B.N.; Bratashov, D.N.; Khlebtsov, N.G. Tip-functionalized au@ag nanorods as ultrabright surface-enhanced Raman scattering probes for bioimaging in off-resonance mode. J. Phys. Chem. C 2018, 122, 17983–17993. [Google Scholar] [CrossRef]
- Liang, J.; Liu, H.; Lan, C.; Fu, Q.; Huang, C.; Luo, Z.; Jiang, T.; Tang, Y. Silver nanoparticle enhanced Raman scattering-based lateral flow immunoassays for ultra-sensitive detection of the heavymetal chromium. Nanotechnology 2014, 25, 495501. [Google Scholar] [CrossRef]
- Hwang, J.; Lee, S.; Choo, J. Application of a sers-based lateral flow immunoassay strip for rapid and sensitive detection of staphylococcal enterotoxin B. Nanoscale 2016, 8, 11418–11425. [Google Scholar] [CrossRef] [PubMed]
- Liu, X.; Yang, X.; Li, K.; Liu, H.; Xiao, R.; Wang, W.; Wang, C.; Wang, S. Fe3O4@Au SERS tags-based lateral flow assay for simultaneous detection of serum amyloid A and C-reactive protein in unprocessed blood sample. Sens. Actuat. B. Chem. 2020, 320, 128350. [Google Scholar] [CrossRef]
- Wang, C.; Wang, C.; Wang, X.; Wang, K.; Zhu, Y.; Rong, Z.; Wang, W.; Xiao, R.; Wang, S. Magnetic SERS strip for sensitive and simultaneous detection of respiratory viruses. ACS Appl. Mater. Interfaces 2019, 11, 19495–19505. [Google Scholar] [CrossRef]
- Lin, L.-K.; Stanciu, L.A. Bisphenol A detection using gold nanostars in a surface-enhanced Raman scattering improved lateral flow immunochromatographic assay. Sens. Act. B Chem. 2018, 276, 222–229. [Google Scholar] [CrossRef]
- Sánchez-Purrà, M.; Carré-Camps, M.; de Puig, H.; Bosch, I.; Gehrke, L.; Hamad-Schiffer, K. Surface-enhanced Raman spectroscopy-based sandwich immunoassays for multiplexed detection of zika and dengue viral biomarkers. ACS Infect. Dis. 2017, 3, 767–776. [Google Scholar] [CrossRef]
- Maneeprakorn, W.; Bamrungsap, S.; Apiwat, C.; Wiriyachaiporn, N. Surface-enhanced Raman scattering based lateral flow immunochromatographic assay for sensitive influenza detection. RSC Adv. 2016, 6, 112079–112085. [Google Scholar] [CrossRef]
- Fu, X.; Chu, Y.; Zhao, K.; Li, J.; Deng, A. Ultrasensitive detection of the β-adrenergic agonist brombuterol by a SERS-based lateral flow immunochromatographic assay using flower-like gold-silver core-shell nanoparticles. Microchim. Acta 2017, 184, 1711–1719. [Google Scholar] [CrossRef]
- Ma, Y.; Liu, H.; Chen, Y.; Gu, C.; Wei, G.; Jiang, T. Improved lateral flow strip based on hydrophilic-hydrophobic SERS substrate for ultra-sensitive and quantitative immunoassay. Appl. Surf. Sci. 2020, 529, 147121. [Google Scholar] [CrossRef]
- He, D.; Wu, Z.; Cui, B.; Xu, E.; Jin, Z. Establishment of a dual mode immunochromatographic assay for Campylobacter jejuni detection. Food Chem. 2019, 289, 708–713. [Google Scholar] [CrossRef] [PubMed]
- Jia, X.; Wang, C.; Rong, Z.; Li, J.; Wang, K.; Qie, Z.; Xiao, R.; Wang, S. Dual dye-loaded Au@Ag coupled to a lateral flow immunoassay for the accurate and sensitive detection of Mycoplasma pneumoniae infection. RSC Adv. 2018, 8, 21243–21251. [Google Scholar] [CrossRef]
- Liu, H.-B.; Du, X.-J.; Zang, Y.-X.; Li, P.; Wang, S. SERS-based lateral flow strip biosensor for simultaneous detection of listeria monocytogenes and salmonella enterica serotype enteritidis. J. Agric. Food Chem. 2017, 65, 10290–10299. [Google Scholar] [CrossRef] [PubMed]
- Liu, H.-B.; Chen, C.-Y.; Zhang, C.-N.; Du, X.-J.; Li, P.; Wang, S.H. Functionalized AuMBA@Ag nanoparticles as an optical and SERS dual probe in a lateral flow strip for the quantitative detection of Escherichia coli O157:H7. J. Food Sci. 2019, 84, 2916–2924. [Google Scholar] [CrossRef]
- Sun, J.; Zhao, Y.; Hou, Y.; Li, H.; Yang, M.; Wang, Y.; Sun, B. Multiplexed electrochemical and SERS dual-mode detection of stroke biomarkers: Rapid screening with high sensitivity. New J. Chem. 2019, 43, 13381–13387. [Google Scholar] [CrossRef]
- Wang, J.; Chen, Q.; Jin, Y.; Zhang, X.; He, L.; Zhang, W.; Chen, Y. Surface enhanced Raman scattering-based lateral flow immunosensor for sensitive detection of aflatoxin M1 in urine. Anal. Chim. Acta 2020, 1128, 184–192. [Google Scholar] [CrossRef]
- Xiao, M.; Xie, K.; Dong, X.; Wang, L.; Huang, C.; Xu, F.; Xiao, W.; Jin, M.; Huang, B.; Tang, Y. Ultrasensitive detection of avian influenza A (H7N9) virus using surface-enhanced Raman scattering-based lateral flow immunoassay strips. Anal. Chim. Acta 2019, 1053, 139–147. [Google Scholar] [CrossRef]
- Zhang, W.; Tang, S.; Jin, Y.; Yang, C.; He, L.; Wang, J.; Chen, Y. Multiplex SERS-based lateral flow immunosensor for the detection of major mycotoxins in maize utilizing dual Raman labels and triple test lines. J. Hazard. Mater. 2020, 393, 122348. [Google Scholar] [CrossRef] [PubMed]
- Zhang, D.; Huang, L.; Liu, B.; Ni, H.; Sun, L.; Su, E.; Chen, H.; Gu, Z.; Zhao, X. Quantitative and ultrasensitive detection of multiplex cardiac biomarkers in lateral flow assay with core-shell SERS nanotags. Biosens. Bioelectron. 2018, 106, 204–211. [Google Scholar] [CrossRef] [PubMed]
- Zhang, D.; Huang, L.; Liu, B.; Su, E.; Chen, H.-Y.; Gu, Z.; Zhao, X. Quantitative detection of multiplex cardiac biomarkers with encoded SERS nanotags on a single T line in lateral flow assay. Sens. Actuat. B Chem. 2018, 277, 502–509. [Google Scholar] [CrossRef]
- Zhang, D.; Huang, L.; Liu, B.; Ge, Q.; Dong, J.; Zhao, X. Rapid and ultrasensitive quantification of multiplex respiratory tract infection pathogen via lateral flow microarray based on SERS nanotags. Theranostics 2019, 9, 4849–4859. [Google Scholar] [CrossRef]
- Shen, H.; Xie, K.; Huang, L.; Wang, L.; Ye, J.; Xiao, M.; Ma, L.; Jia, A.; Tang, Y. A novel SERS-based lateral flow assay for differential diagnosis of wildtype pseudorabies virus and gE-deleted vaccine. Sens. Actuat. B Chem. 2019, 282, 152–157. [Google Scholar] [CrossRef]
- Bai, T.; Wang, M.; Cao, M.; Zhang, J.; Zhang, K.; Zhou, P.; Liu, Z.; Liu, Y.; Guo, Z.; Lu, X. Functionalized Au@Ag-Au nanoparticles as an optical and SERS dual probe for lateral flow sensing. Anal. Bioanal. Chem. 2018, 410, 2291–2303. [Google Scholar] [CrossRef]
- Khlebtsov, B.; Khanadeev, V.; Khlebtsov, N. Surface-enhanced Raman scattering inside Au@Ag core/shell nanorods. Nano Res. 2016, 9, 2303–2318. [Google Scholar] [CrossRef]
- Cho, H.; Das, M.; Bhandari, P.; Irudayaraj, J. High performance immunochromatographic assay combined withsurface enhanced Raman spectroscopy. Sens. Actuators B 2015, 213, 209–214. [Google Scholar] [CrossRef]
- Tran, V.; Walkenfort, B.; König, M.; Salehi, M.; Schlücker, S. Rapid, quantitative and ultrasensitive POCT: Design of a portable SERS reader for lateral flow assays in clinical chemistry. Angew. Chem. 2019, 58, 442–446. [Google Scholar] [CrossRef]
- Lim, D.-K.; Jeon, K.-S.; Hwang, J.-H.; Kim, H.; Kwon, S.; Shu, Y.D.; Nam, J.-M. Highly uniform and reproducible surface-enhanced Raman scattering from dNA-tailorable nanoparticles with 1-nm interior gap. Nat. Nanotechnol. 2011, 6, 452–460. [Google Scholar] [CrossRef]
- Khlebtsov, B.N.; Bratashov, D.N.; Byzova, N.A.; Dzantiev, B.B.; Khlebtsov, N.G. SERS-based lateral flow immunoassay of troponin I by using gap-enhanced Raman tags. Nano Res. 2019, 12, 413–420. [Google Scholar] [CrossRef]
- Ye, Z.; Lin, L.; Tan, Z.; Zeng, Y.-J.; Ruan, S.; Ye, J. Sub-100 nm multi-shell bimetallic gap-enhanced Raman tags. Appl. Surf. Sci. 2019, 487, 1058–1067. [Google Scholar] [CrossRef]
- Fu, X.; Wen, J.; Li, J.; Lin, H.; Liu, Y.; Zhuang, X.; Tiana, C.; Chen, L. Highly sensitive detection of prostate cancer specific PCA3 mimic DNA using SERS-based competitive lateral flow assay. Nanoscale 2019, 11, 15530–15536. [Google Scholar] [CrossRef] [PubMed]
- Lu, L.; Yu, J.; Liu, X.; Yang, X.; Zhou, Z.; Jin, Q.; Xiao, R.; Wang, C. Rapid, quantitative and ultra-sensitive detection of cancer biomarker by a SERRS-based lateral flow immunoassay using bovine serum albumin coated Au nanorods. RSC Adv. 2020, 10, 271–281. [Google Scholar] [CrossRef]
- Park, H.J.; Yang, S.C.H.; Choo, J. Early diagnosis of influenza virus a using surface-enhanced Raman scattering-based lateral flow assay. Bull. Korean Chem. Soc. 2016, 37, 2019–2024. [Google Scholar] [CrossRef]
- Xiao, R.; Lu, L.; Rong, Z.; Wang, C.; Peng, Y.; Wang, F.; Wang, J.; Sun, M.; Dong, J.; Wang, D.; et al. Portable and multiplexed lateral flow immunoassay reader based on SERS for highly sensitive point-of-care testing. Biosens. Bioelectron. 2020, 168, 112524. [Google Scholar] [CrossRef]
- Shi, Q.; Huang, J.; Sun, Y.; Yin, M.; Hu, M.; Hu, X. Utilization of a lateral flow colloidal gold immunoassay strip based on surface-enhanced Raman spectroscopy for ultrasensitive detection of antibiotics in milk. Spectrochim. Acta A Mol. Biomol. Spectrosc. 2018, 197, 107–113. [Google Scholar] [CrossRef]
- Wang, X.; Choi, N.; Cheng, Z.; Ko, J.; Chen, L.; Choo, J. Simultaneous detection of dual nucleic acids using a SERS-based lateral flow biosensor. Anal. Chem. 2017, 89, 1163–1169. [Google Scholar] [CrossRef]
- Xi, J.; Yu, Q. The development of lateral flow immunoassay strip tests based on surface enhanced Raman spectroscopy coupled with gold nanoparticles for the rapid detection of soybean allergen β-conglycinin. Spectrochim. Acta A Mol. Biomol. Spectrosc. 2020, 241, 118640. [Google Scholar] [CrossRef]
- Hasić, S.; Kiseljaković, E.; Jadrić, R.; Radovanović, J.; Winterhalter-Jadrić, M. Cardiac troponin I: The gold standard in acute myocardial infarction diagnosis. Bosnian. J. Basic Med. Sci. 2003, 3, 41–44. [Google Scholar] [CrossRef]
- Xu, Y.; Zhang, X.; Luan, C.; Wang, H.; Chen, B.; Zhao, Y. Hybrid hydrogel photonic barcodes for multiplex detection of tumor markers. Biosens. Bioelectron. 2017, 87, 264–270. [Google Scholar] [CrossRef] [PubMed]
- Zou, Z.; Yang, H.; Yan, Q.; Qi, P.; Qing, Z.H.; Zheng, J.; Xu, X.; Zhang, L.; Feng, F.; Yang, R. Synchronous screening of multiplexed biomarkers of Alzheimer’s disease by a length-encoded aerolysin nanoporeintegrated triple-helix molecular switch. Chem. Commun. 2019, 55, 6433–6436. [Google Scholar] [CrossRef] [PubMed]
- Huang, L.; Tian, S.; Zhao, W.; Liu, K.; Ma, X.; Guo, J. Multiplexed Detection of Biomarkers in Lateral-Flow Immunoassays. Analyst 2020, 145, 2828–2840. [Google Scholar] [CrossRef] [PubMed]


| Antigen | SERS Tag | Colorimetric LOD | SERS LFIA LOD | Reference |
|---|---|---|---|---|
| Cardiac TrI | Au@Au-Ag@NBA | 5 ng/mL | 0.09 ng/mL | [56] |
| FluB antigen | Au-satelite@MBA | 8 µg/mL | 0.0085 µg/mL | [58] |
| Thyroid-stimulating hormone | AuNP@MGITC | 1.5 µIU/mL | 0.025 µIU/mL | [19] |
| HIV-1 DNA | AuNP@MGITC | 80 pg/mL | 8 pg/mL | [20] |
| Neuron-specific Enolase | Au nanostar@MBA | 50 ng/mL | 0.08 ng/mL | [21] |
| Brombuterol | Au nanoflower@MBA | 12 pg/mL | 0.15 pg/mL | [42] |
| PCA3 mimic DNA | AuNP@MGITC | 3 pM | 3 fM | [63] |
| Staphylococcal enterotoxin B | Au nanoshells@MGITC | 10 ng/mL | 0.001 ng/mL | [36] |
| E. coli | AuNP@DNTB | N/A | 0.52 CFU/mL | [22] |
| Human IgM | Au-Ag@DNTB | 10 ng/mL | 0.1 ng/mL | [45] |
| Cardiac TrI | GERT@NBT | 3 ng/mL | 0.1 ng/mL | [61] |
| Colistin | AuNP@DNTB | 10 ng/mL | 0.10 ng/mL | [25] |
| Chromium | AgNP@MBA | 10−4 M | 10−7 M | [35] |
| Bisphenol A | Au nanostar@ATP | 1 ppb | 0.073 ppb | [39] |
| Listeria monocytogenes, Salmonella enterica | Au-Ag@MBA | N/A | 19 and 27 CFU/mL | [46] |
| Escherichia coli O157:H7 | Au-Ag@MBA | 5 × 10⁵ CFU/mL | 5 × 10⁴ CFU/mL | [47] |
| Serum amyloid A, C-reactive protein | Fe3O4-Au nanoshells@DNTB | 5 ng/mL, 0.5 ng/mL | 0.1 and 0.01 ng/mL | [37] |
| AFP antigen | AuNr@DNTB | 1 ng/mL | 0.1 ng/mL | [64] |
| Recombinant nucleoprotein H1N1 | Au nanostars@ATP | 67 ng/mL | 6.7 ng/mL | [41] |
| Influenza virus A | AuNP@MGITC | 5 × 10⁴ pfu/mL | 1.9 × 10⁴ pfu/mL | [65] |
| C-reactive protein | Au-Ag@DNTB | 1 ng/mL | 0.01 ng/mL | [27] |
| Zika and dengue viral biomarkers | Au nanostar@MBA, Au nanostar@MBE | 10 ng/mL, 50 ng/mL | 0.72 and 7.67 ng/mL | [40] |
| Wild-type pseudorabies virus | Au-Ag@ATP | 81 ng/mL | 5 ng/mL | [55] |
| Neomycin | AuNP@ATP | N/A | 0.216 pg/m | [67] |
| Listeria | commercial SERS-S440 Nanotags | 6 × 10⁷ pfu/mL | 6 × 10⁶ pfu/mL | [28] |
| NSE and S100-b stroke biomarkers | Au-Ag@MBA, Au-Ag@NBA | N/A | 0.01 and 0.05 ng/mL | [48] |
| Human chorionic gonadotropin | Au-satelite@NT | 25 mIU/mL | 1.6 mIU/mL | [59] |
| H1N1 and HAdV viruses | Fe3O4-Ag nanoshells@DNTB | 104 and 103 pfu/mL | 50 and 10 pfu/mL | [38] |
| Kaposi’s sarcoma-associated herpesvirus and bacillary angiomatosis | AuNP@MGITC | 10 pM | 0.043 and 0.074 pM | [68] |
| Interleukin-6 | AuNP@DNTB | 5 ng/mL | 5 pg/mL | [29] |
| Stroke biomarker S100-β | Au nanoshells@DNTB | 50 pg/mL | 5 pg/mL | [30] |
| aflatoxin M1 | Au-Ag@DNTB | N/A | 1.7 pg/mL | [49] |
| Y. pestis, F. tularensis, and B. anthracis | AuNP@MGITC | 10,000 CFU/mL | 43.4, 45.8, and 357 CFU/mL | [31] |
| β-conglycinin | AuNP@ATP | 1 µg/mL | 32 ng/mL | [69] |
| Influenza A (H7N9) | Au-Ag@ATP | 0.08 hemagglutinating units | 0.0018 hemagglutinating units | [50] |
| Human chorionic gonadotropin | GERT@BDT | 25 mIU/mL | 0.7 mIU/mL | [62] |
| Myo, cTnI, and CK-MB | Ag-Au@NBA | 1 ng/mL | 3.2, 0.44, and 0.55 pg/mL | [52] |
| CK-MB, cTnI, and Myo | Ag-Au@NBA, Ag-Au@R6G Ag-Au@MB | N/A | 0.93, 0.89, and 4.2 pg/mL | [53] |
| Different respiratory viruses | Au-Ag@NBA | 1 pM | 0.030–0.041 pM | [54] |
| AFP, CEA, and PSA | AuNR@DTNB | 10 ng/mL | 0.01 ng/mL | [66] |
Publisher’s Note: MDPI stays neutral with regard to jurisdictional claims in published maps and institutional affiliations. |
© 2020 by the authors. Licensee MDPI, Basel, Switzerland. This article is an open access article distributed under the terms and conditions of the Creative Commons Attribution (CC BY) license (http://creativecommons.org/licenses/by/4.0/).
Share and Cite
Khlebtsov, B.; Khlebtsov, N. Surface-Enhanced Raman Scattering-Based Lateral-Flow Immunoassay. Nanomaterials 2020, 10, 2228. https://doi.org/10.3390/nano10112228
Khlebtsov B, Khlebtsov N. Surface-Enhanced Raman Scattering-Based Lateral-Flow Immunoassay. Nanomaterials. 2020; 10(11):2228. https://doi.org/10.3390/nano10112228
Chicago/Turabian StyleKhlebtsov, Boris, and Nikolai Khlebtsov. 2020. "Surface-Enhanced Raman Scattering-Based Lateral-Flow Immunoassay" Nanomaterials 10, no. 11: 2228. https://doi.org/10.3390/nano10112228
APA StyleKhlebtsov, B., & Khlebtsov, N. (2020). Surface-Enhanced Raman Scattering-Based Lateral-Flow Immunoassay. Nanomaterials, 10(11), 2228. https://doi.org/10.3390/nano10112228