1. Introduction
Magnetic nanoparticle hyperthermia (MNH) is a method that has been developed to cure localized cancer as an addition to the existing methods to cure cancer, such as chemotherapy and radiotherapy [
1,
2,
3,
4]. MNH can treat the disease by injecting magnetic nanoparticles at the tumor site and allowing them to heat the localized tumors with the use of an external alternating magnetic field (AMF). The AMF causes the nanoparticles to absorb energy from the applied field and causes them to heat up, destroying the cancer cells within the therapeutic temperature range of 42–46 °C [
4,
5,
6,
7,
8,
9]. If the temperature goes beyond this range, heat-induced shock might occur, which could also damage healthy cells. Therefore, in the case of MNH using iron oxide nanoparticles with a Curie temperature (Tc) much higher than 42 °C, the regulation of energy absorption is achieved, for instance, by decreasing the field amplitude when 42 °C is reached. In order to overcome this issue, the Curie temperature (T
C) of the injected nanoparticles maybe in this temperature range in order for the energy absorption to decrease and thus reduce the effect of overheating [
9,
10]. Then the heat will automatically stop due to the ferromagnetic to paramagnetic transition. This is called self-regulating magnetic hyperthermia. The purpose of this study was to synthesize biocompatible magnetic materials that have unique magnetic properties within the safety limit of the magnetic field, its frequency, and temperature. Herein, we synthesized Ni-Cu nanoparticles with a T
C of 27–77 °C (300–350 K). Ni-Cu bimetallic nanoparticles have attracted attention due to their superior electronic and magnetic properties at various temperatures [
10,
11,
12,
13,
14,
15]. Depending on the concentration of copper, the Ni-Cu system may demonstrate ferromagnetic or paramagnetic properties. In addition, due to their enhanced resistance to corrosion and their superior chemical and physical stability, researchers commonly use Ni-Cu alloys as thermocouple strips, resistances in electrical applications, heat resistant wires, etc. [
11]. A recent study demonstrated the use of carbon nanotubes incorporated with Ni-Cu nanoparticles for the generation of hydrogen gas [
12]. Moreover, since Ni-Cu bimetallic nanoparticles are chemically stable, biocompatible, and demonstrate the desired magnetic properties, they are perfect candidates for targeted drug delivery for cancer diagnosis and therapy [
12,
13]. An important application of Ni-Cu magnetic nanoparticles is in cancer therapeutics as materials for hyperthermia treatment [
6]. Magnetic nanoclusters, which contain small groups of individual nanoparticles, can show ferromagnetic behavior with a T
C in the therapeutic temperature range and enhanced dispersion in solution under an applied AC field. This will lead to homogeneous energy absorption by the particles in solution, revealing high heating power known as the specific absorption rate (SAR) under the safety limit of an AC field of 5 × 10
9 A/(ms), which is defined by
f xH0, where
f is the frequency and
H0 the field amplitude [
16,
17,
18,
19,
20]. Ni-Cu alloys are usually synthesized in the bulk form. However, a few strategies, such as mechanical synthesis, hydrothermal, electrodeposition, pulsed deposition, and microwave methods, have been employed to synthesize these systems in the nano-form [
5,
6,
10,
11,
12]. Among them, the sol–gel method is a groundbreaking and straightforward technique to create such compounds, but most of this published work did not succeed in overcoming the barrier in in vivo studies due to the agglomeration of those particles in solutions and their weak magnetic properties that led to insufficient heating power to destroy the cancer cells [
13,
14].
In this study, we synthesized Ni-Cu nanoparticles by a sol–gel wet chemical process followed by annealing. The Ni-Cu nanoparticles presented demonstrated an improved dispersion in solution, providing an enhanced heating power under an applied AC magnetic field compared to previous work in Ni-Cu systems [
11,
12,
13,
14,
15]. The morphology and composition of the nanoparticles were observed using a transmission electron microscope (TEM), scanning electron microscope (SEM), and X-ray diffraction (XRD). Lastly, the magnetic properties and the in vitro cytotoxicity of the prepared nanoparticles were assessed to evaluate their potential use in magnetic hyperthermia therapy.
2. Materials and Methods
All the materials used to synthesize the Ni-Cu nanoparticles were obtained from Thermo Fisher Scientific (Rochester, NY, USA). Following the sol–gel method by Stergar et al. [
12], our samples were synthesized by mixing and stirring 0.2 g of copper (I) chloride and 0.8 g of nickel (II) acetate tetra-hydrate in 150 mL of ethanol at 70 °C. Parallel to this mixture, 1.0 g of sodium hydroxide dissolved in 50 mL of distilled water and 2.5 g of sodium citrate dissolved in 75 mL of distilled water were added slowly to the mixture for 1–2 min separately. After that, a solution of 2 mL of hydrazine mixed with 0.5 mL of distilled water was added to the mixture without further heating. Then 1.5 g of sodium borohydride dissolved in 15 mL of distilled water were added into the mixture while stirring for 30 min. The samples were collected by using filter paper and afterwards several ethanol wash steps were performed. Then part of the as-made sample was annealed at 300 °C for 1, 2, 3, 6, or 10 h. Subsequently, the crystal structure of the samples was measured by an X-ray diffractometer (P-Analytical X’PERT MPD instrument) (Malvern Panalytical Ltd., Malvern, UK) and the particle morphology by scanning electron microscopy (FESEM JEOL6340 electron microscope) and transmission electron microscopy (HTEM) (JEOL-JEM-1230). A vibrating sample magnetometer (VSM) (Quantum Design, 3T Versalab) was used to study the magnetic properties. The feasibility of hyperthermia of 5 mg Ni-Cu nanoparticles dispersed in 1 mL of water was measured by using a G2-D5 Series Multi-mode 1500W Driver from Nanoscale Biomagnetics. Each sample solution was placed into a G2-D5 coil, where the alternating magnetic field and frequencies were applied. The induced temperature of the solution was measured and recorded using a fiber optic sensor. Cytotoxicity assays were performed in human triple-negative breast cancer MDA-MB231 cells acquired from the American Tissue Culture Collection (ATCC). The MDA-MB231 cells were cultured by using DMEM culture media (from Corning) supplemented with 10% heat-inactivated fetal bovine serum (Hyclone) and 1× antibiotics; 100 U/mL penicillin, and 100 μg/mL streptomycin (Life Technologies). Before preparing any experiment, the cell viability was measured by using the propodeum iodide exclusion assay and flow cytometry, as previously detailed. Only cultures with a viability of 95% or higher were used [
21]. Consistently, the cells were incubated at 37 °C under a humidified 5% carbon dioxide (CO
2) atmosphere using a typical water-jacketed incubator. The cytotoxicity analysis was performed by using the differential nuclear staining (DNS) assay [
22,
23]. Cells growing exponentially, around 60–70% confluence, were collected and seeded on a 96-well plate format at a density of between 2500 and 10,000 cells/well in 100 µl of culture media, followed by overnight incubation. Subsequently, the cells were exposed for 1, 2, 3, and 6 days to a concentration gradient of magnetic nanoparticles. At each indicated incubation time, cells were stained with 1 µg/mL of Hoechst and propidium iodide (PI) reagents, incubated for 2 h, and analyzed via an IN Cell 2000 bio imager system. In addition, untreated cells and solvent-treated (PBS) cells, as well as 1 mM H
2O
2-treated cells incubated for 24 h, were included as a positive control of cytotoxicity. Four contiguous images were acquired per well, forming 2 × 2 montages with a 10× objective with two individual fluorescent channels (Hoechst and PI emission signals). Image acquisition and segmentation were achieved by using the IN Cell Analyzer 2000 bioimager system and the IN Cell Analyzer Workstation 3.2 software (GE Healthcare, Pittsburg, PA, USA), respectively, to obtain both the living and dead cell subpopulations per individual well [
24,
25]. The results are depicted as an average, with their corresponding standard deviation, to denote the experimental (biological and technical) variability. A two-tailed paired Student’s
t-test was utilized to define the statistical significance of the two experimental samples.
3. Results and Discussion
The Ni-Cu nanoparticles were synthesized by using a wet chemistry method with a 4:1 Ni:Cu precursor ratio, as discussed before. The sample was then annealed at 300 °C for 1, 2, 3, 6, or 10 h, in order to obtain the required magnetic order. The XRD pattern (
Figure S1) of the as-made sample shows a mixture of face centered cubic (FCC) structures for Ni
0.2Cu
3.8 (Cu-rich phase, Ref. JCPDS 98-062-8549) as the major phase and an FCC structure of Ni
3.68Cu
0.32 (Ni-rich phase, Ref. JCPDS 98-062-8545) as a minor phase. By annealing at 300 °C for 1, 2, 3, 6, or 10 h, the ratio of Ni
3.68Cu
0.32 (Ni-rich phase) to Ni
0.2Cu
3.8 (Cu-rich phase) changed. With annealing, the Cu-rich phase increased at the expense of the Ni-rich phase. Using the Gaussian peak analysis, we estimated the ratio of Ni-rich to Cu-rich phases to be 59 to 41%, 54 to 46%, 52 to 48%, 51.8 to 48.2%, 52.6 to 47.4%, and 49 to 51% for the as-made and annealed samples at 300 °C for 1, 2, 3, 6, and 10 h, respectively. The width of the characteristic diffraction peaks was affected by the average crystalline size (D) of the particles, which was calculated using the Scherrer equation [
6] (D = 0.93λ/Δ2θ cosθ, where λ is the wavelength of the applied radiation (Cu Ka), Δ2θ is the full width at half maximum of the diffraction peak, and θ is the Bragg angle), for all the samples, as shown in
Figure S1. The average crystalline size of the Ni-rich phase increased from 3 nm to 9–10 nm with increasing annealing time, while the average size of the Cu-rich phase was nearly constant at 28–30 nm.
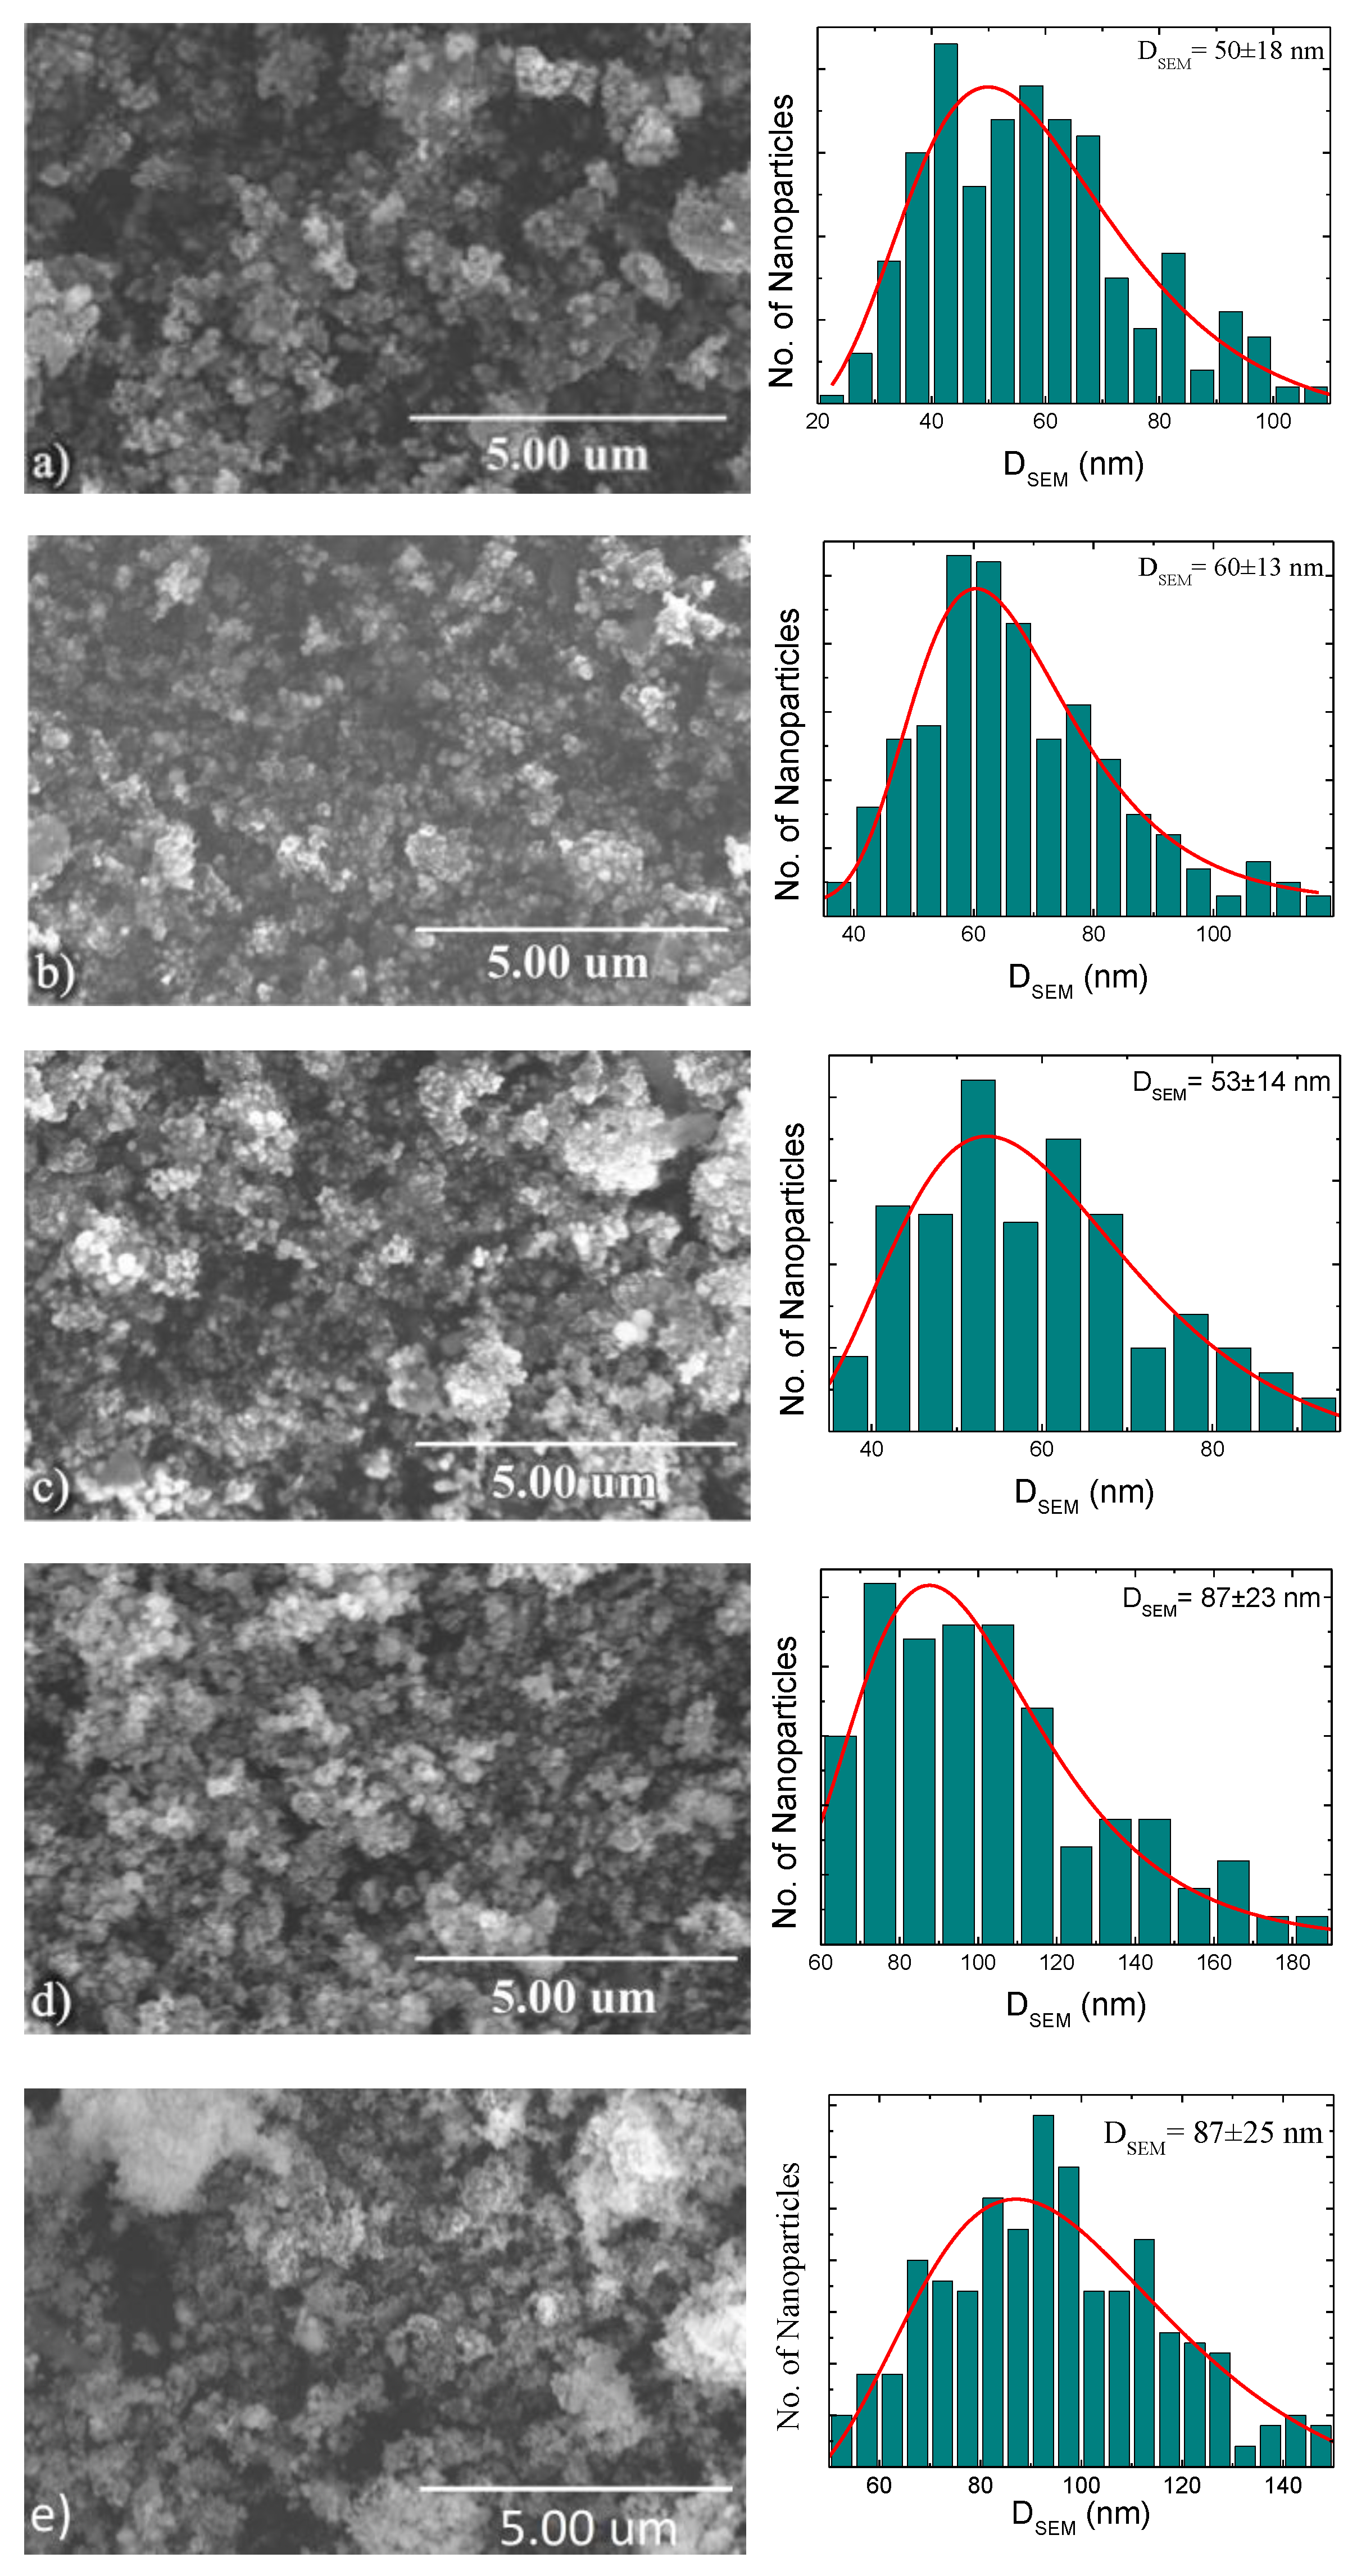
Both scanning and transmission electron microscopy (SEM and TEM) were used to study the morphology of the formed nanoparticles.
Figure 1 shows SEM images of the particle sizes and their distribution. We believe that these SEM sphere-like particles are particle clusters consisting of smaller nanoparticles (the resolution of our SEM images is in the range of 20–30 nm). The cluster size distribution calculated from the SEM images yields sizes of 50 ± 18, 60 ± 13, 53 ± 14, 87 ± 23, and 87 ± 25 nm for as-made and annealed samples at 300 °C for 1, 3, 6, and 10 h, respectively. It is clear from
Figure 1 that the as-made, annealed samples for 1 and 3 h show a narrower size distribution with a standard deviation of less than 50 % among all the samples. Therefore, a narrower size distribution leads to the disaggregation of the nanoparticles in solution, producing a homogeneous heat distribution when they are injected to the cells. On the other hand, for the 6 and 10 h annealed samples, a more flat and spread out distribution suggests that the particles deviated significantly from their mean value. As can be seen in
Figure 2, TEM images confirm the formation of clusters, showing bigger particles containing smaller nanoparticles, both in the as-made and annealed samples.
To understand the magnetic properties of the synthesized Ni-Cu nanoparticles, hysteresis loops at 300 K with an external magnetic field up to 3T were measured, as shown in
Figure 3a. It is clear from
Figure 3a (insets) that the presence of remnant magnetization (
Mr) and coercivity (
Hc) for the as-made and annealed samples revealed ferromagnetic-like behavior at room temperature for a significant fraction of the Ni-Cu nanoparticles, which is attributed mostly to the Ni-rich phase. Moreover, the samples show saturation magnetization (M
S) of 16, 14, 20, 19, 20, and 18 emu/g for the as-made and annealed samples of 1, 2, 3, 6, and 10 h, respectively. In
Figure 3a (right inset),
Hc shows an increase with annealing time up to 2 h, then slightly decreases for longer annealing times, following the size dependence of Ni-rich particles on annealing time. As seen from
Figure 3b, the samples show an observable increase in
Ms when increasing the annealing time from 1 to 2 h, then it almost saturates at longer annealing times. By using the XRD data on the estimated ratio of the Ni-rich/Cu-rich (magnetic/non-magnetic) phases’ dependence on annealing time, as shown in
Figure 3b, one can estimate the normalized saturation magnetization based on the amount of Ni-rich magnetic phase.
Figure 3b confirms that the samples show observable increases in normalized
Ms for the Ni-rich phase with increasing annealing time from 1 to 2 h, then it almost saturates at longer annealing times. Based on the XRD and SEM data, each particle contains a group of small nanoparticles (clusters), which may show a superparamagnetic-like behavior. To further understand this behavior, the
M vs. T data in zero-field-cooled (ZFC) and field-cooled (FC) samples were measured at 200 Oe from 50 to 400 K (
Figure S2).
Figure S2 shows broad peaks in the ZFC data, suggesting a distribution of blocking temperature (
TB) corresponding to the maxima of ZFC curves in the range between 196 K and 260 K;
TB depends on the particle volume and anisotropy constant (
KV = 25kBTB, where
K is the magnetic anisotropy, V is the volume of the particles, and k
B is the Boltzmann constant [
16,
17]). The data show clearly that the average blocking temperature increases with the annealing time, consistent with the observations that the grain size of the Ni-rich phase increases with annealing time. These observations can explain the increase in
Ms with annealing time. The as-made Ni-rich clusters are very small and most of them are superparamagnetic and this explains the smaller value of
Ms; with annealing, the Ni-rich particles get bigger and their magnetization is larger. Moreover, since we have a mixture of superparamagnetic and ferromagnetic particles, it was difficult to determine the exact value of T
C. Therefore, we estimated it using the Curie–Weiss law [
26], revealing values in the range of 300–350 K for all the samples.
In contrast to all the previous measurements of powder samples, to test the feasibility of Ni-Cu nanoparticles for the hyperthermia treatment of cancer, each nanoparticle sample was dispersed in a water solution with a 5 mg/mL concentration; due to the small size of the nanoparticles, they were highly dispersed in their water solutions. Then, each nanoparticle solution was subjected to an AC magnetic field at different amplitudes
H and frequency
f, from 100 to 500 Oe and 144, 164, and 304 kHz, respectively. Using a fiber optic sensor, measurements of temperature versus the exposure time (
T-t) were recorded, as shown in
Figure S3a–f, at different fields
H of 100–500 Oe and at a frequency
f of 144 kHz. Measurements were done at 164 and 304 kHz and can be found in the
Supplementary Materials of this paper (Figures S4 and S5). It can be observed that the figures only portray the magnetic field intensities at which heating occurred and the last one, where there was no heating, as a reference. It can be observed that increasing the amplitude
H and
f of the applied AC field leads to higher temperatures due to the faster rotation of the magnetic moments and the nanoparticles themselves. To be specific, the data can be analyzed in the format of rising temperature with time (dT/dt) under an applied AC magnetic field at different
H and
f (
Figure S6a–c). It is clear from
Figure S6 that dT/dt increases when
H and
f increase. The annealed sample for 2 h shows the highest increase in dT/dt to be 1.7 °C/min at 400 Oe and 304 kHz. Therefore, we can determine the exposure time and control the hyperthermia process by knowing dT/dt of the used nanoparticles. For example, in order to use the annealed sample of 2 h for hyperthermia, it will take 25 min to reach 42 °C and then start to kill the cancer cells. In addition, we have observed that the T-t curves (
Figures S3–S5) start to saturate after reaching a critical temperature, which will stop the heating automatically due to the ferromagnetic–paramagnetic transition. This property of the nanoparticles makes them self-regulated heat mediators for hyperthermia.
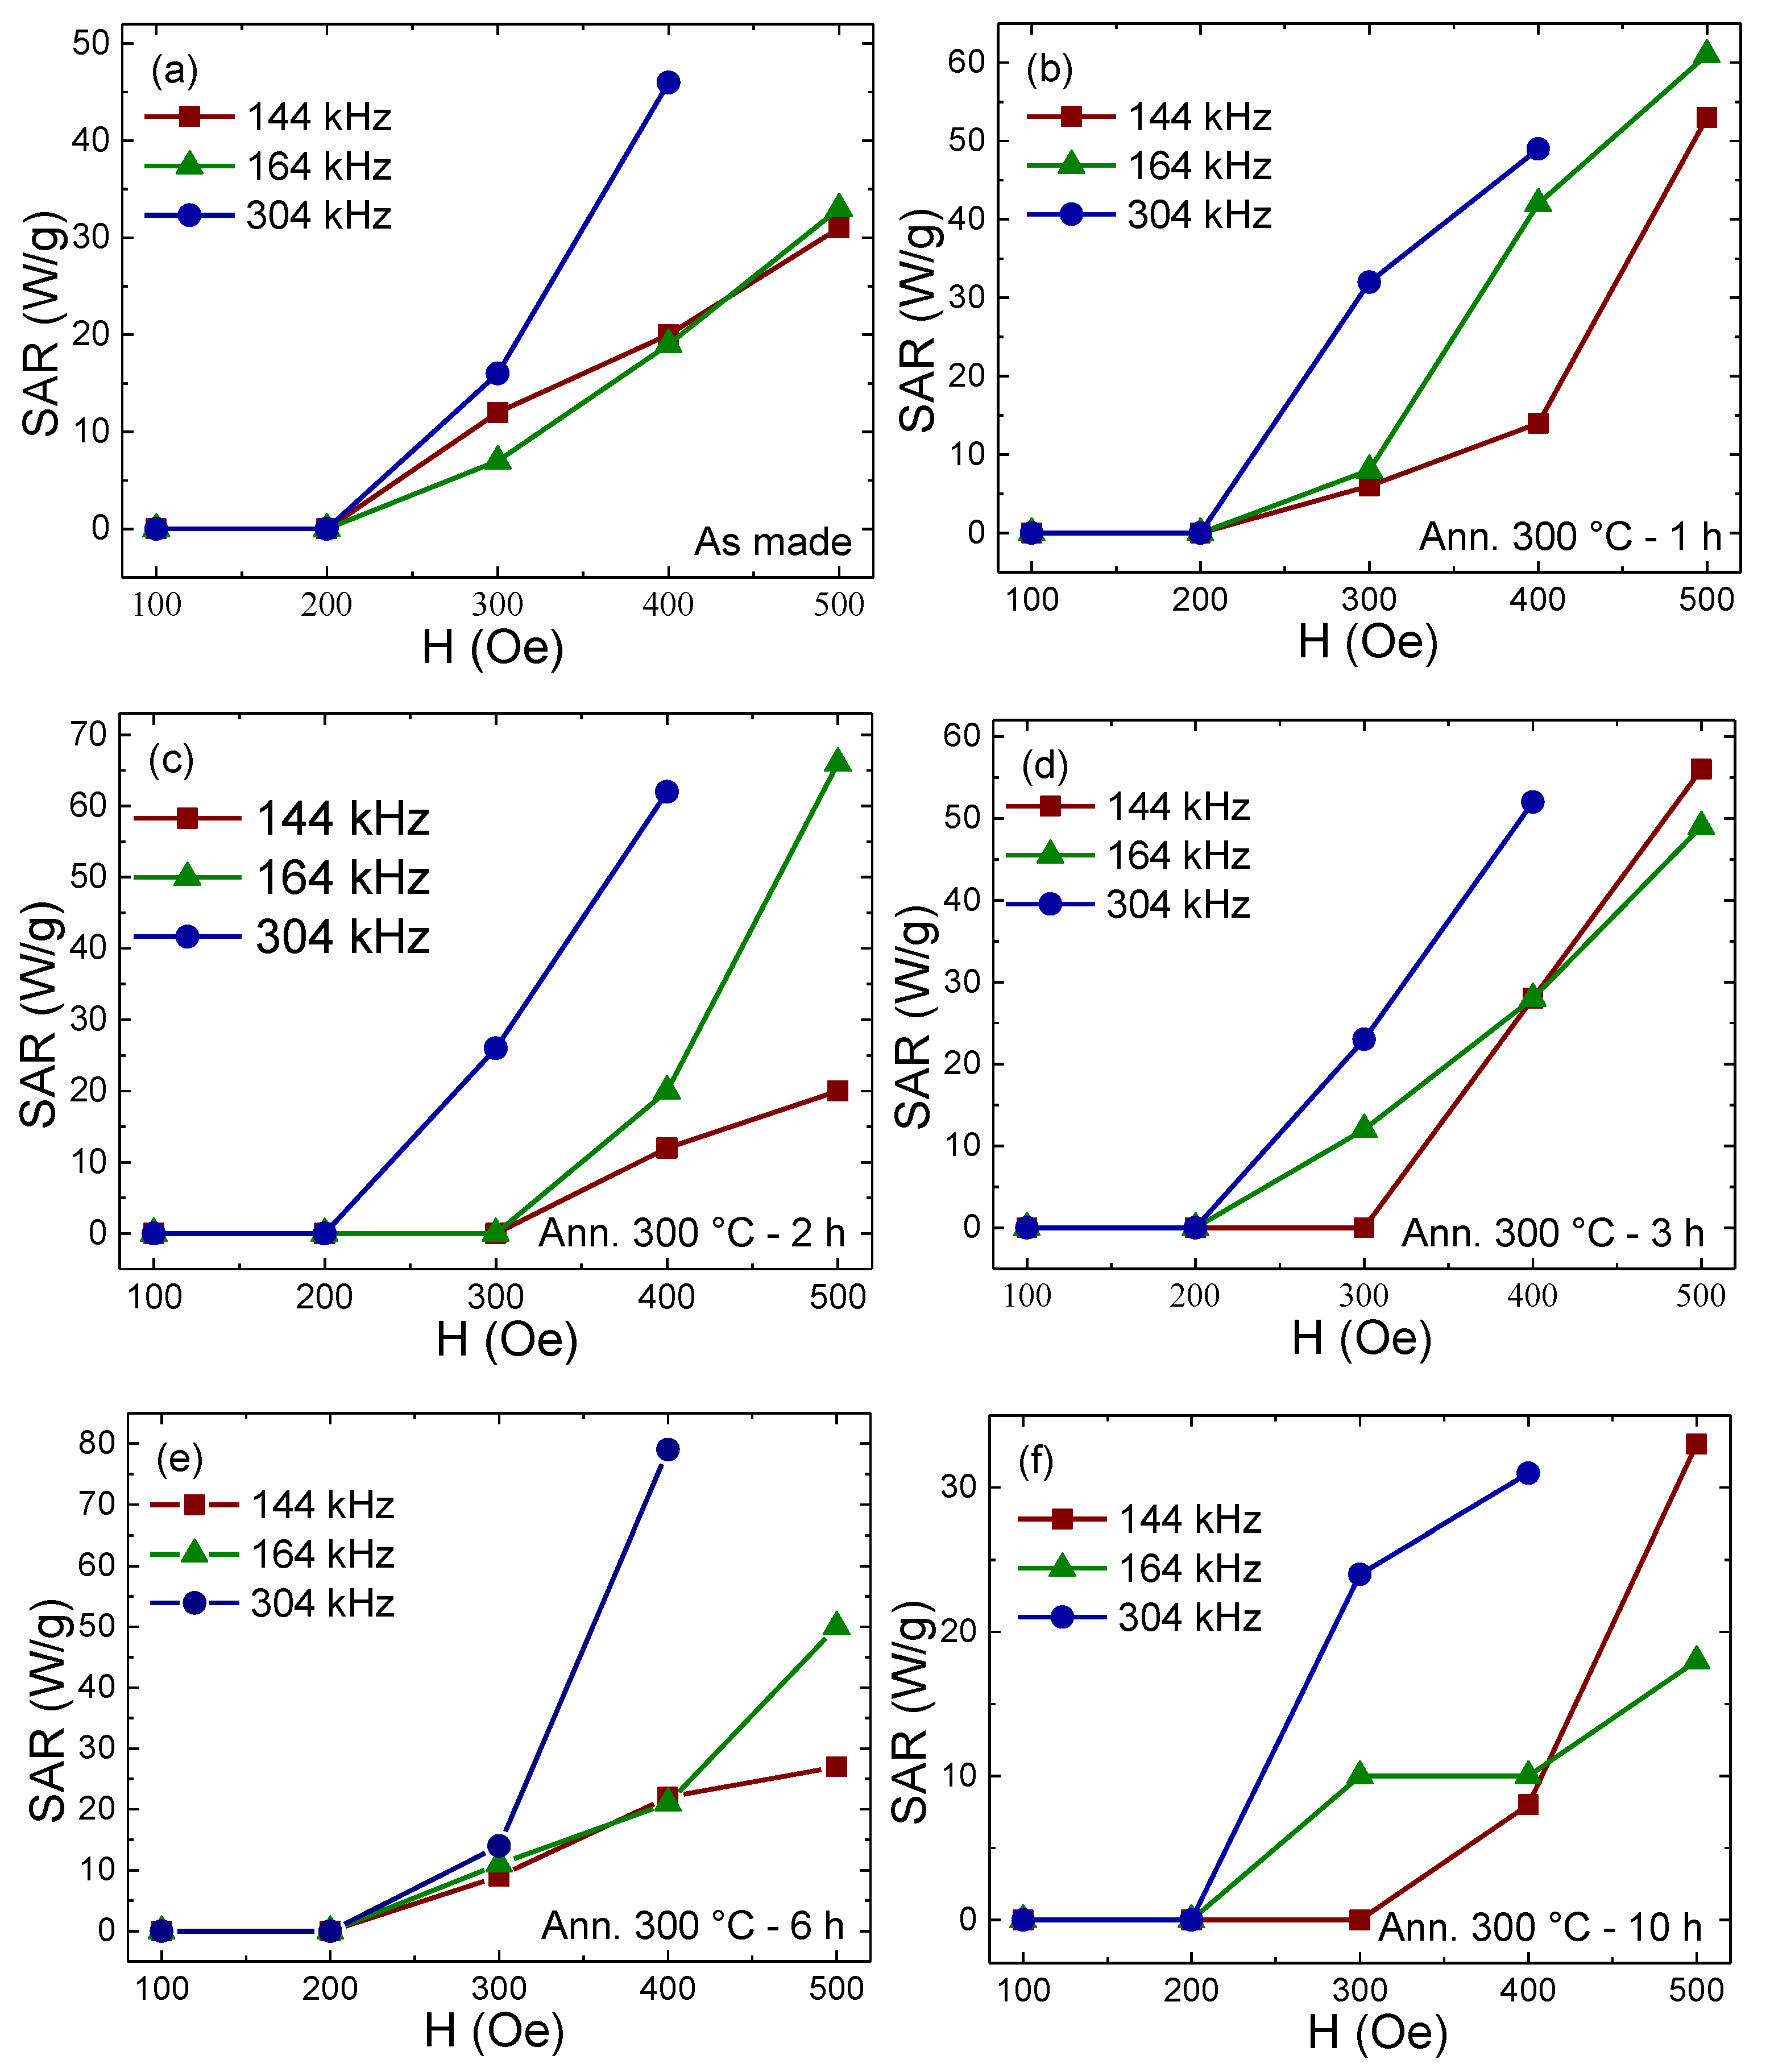
The induced heating power per unit mass of the sample, known as specific absorption rate (SAR), was calculated from the initial slope of T-t curves (
Figures S3–S5) [
6,
7,
8].
Figure 4 shows the dependence of the samples’ SAR on the applied AC magnetic fields
H at different frequencies
f. It is clear that the annealed sample of 6 h yields the highest SAR, with 80 W/g when submitted to an AC magnetic field of 400 Oe (about 30 kA/m) and 304 kHz, consistent with the larger value of Hc. The other SAR values at lower fields and frequencies also generate enough heat, which matches the aim of this work to produce enough heat to kill the cancer cells under the safety limit of the AMF. These values are higher than those for all the published research of Ni-Cu nanoparticles [
14]. In addition, the SAR values of the Ni-Cu system are lower than those of Fe or Fe
3O
4 due to the lower magnetization of Ni-Cu compared to those of strongly magnetic nanoparticles; however, the Ni-Cu system has self-regulating properties that do not exist in those strongly magnetic particles. Nevertheless, in future work, the SAR values can be further enhanced by surface functionalization of the nanoparticles that will lead to higher nanoparticle dispersion [
14].
To explore the cytotoxic properties of these Ni-Cu nanoparticles in biological tissues, we exposed human breast cancer MDA-MB231 cells to a concentration gradient of the nanoparticles with a size of 53 nm, which were annealed at 300 °C for 3 h, to review their cytotoxic effects (
Figure 5).
The potential cytotoxic activity of Ni-Cu nanoparticles (sample with a size of 53 nm and annealed at 300 °C for 3 h) against human triple-negative breast cancer MDA-MB231 cells was performed by using the live-cell differential nuclear staining (DNS) assay via a high-throughput screening strategy. As shown in
Figure 5, the Ni-Cu nanoparticles (sample with size of 53 nm and annealed at 300 °C for 3 h) exhibited non-toxic activity on cancer cells for low concentrations of 12.5 and 25 μg/mL for 1 to 6 days of incubation. Moreover, the cytotoxic values were similar to those observed for untreated and solvent control cells (<5%); almost no cytotoxicity was detected. In higher concentrations, such as 50 and 100 μg/mL, a cytotoxic effect was seen (
Figure 5). When 50 µg/mL of the Ni-Cu sample were added to the cells, after 3 days of incubation, 24.6% of the cells were dead, whereas when 100 µg/mL were added to the cells, the cytotoxic effect was detected earlier at 1 day of incubation, with 15.4% dead cells. This toxic effect was significantly more accentuated when the nanoparticles were incubated for 6 days, with 88.1% dead cells (
p < 0.00004). These results demonstrate that the newly synthesized Ni-Cu nanoparticles are inoffensive to the cell environment at low concentrations (12.5 to 25 μg/mL), which make them attractive for their potential use in magnetic hyperthermia.

 ,
, 

