Article

Low Working Temperature of ZnO-MoS2 Nanocomposites for Delaying Aging with Good Acetylene Gas-Sensing Properties

1
State Key Laboratory of Power Transmission Equipment & System Security and New Technology, Chongqing University, Chongqing 400044, China
2
School of Electrical Engineering, Chongqing University, Chongqing 400044, China
3
School of Electrical Engineering, Zhengzhou University, Zhengzhou 450001, China
4
School of Materials Science and Engineering, Chongqing University, Chongqing 400044, China
*
Authors to whom correspondence should be addressed.
Nanomaterials 2020, 10(10), 1902; https://doi.org/10.3390/nano10101902
Submission received: 8 September 2020 / Revised: 19 September 2020 / Accepted: 21 September 2020 / Published: 23 September 2020
(This article belongs to the Special Issue State-of-the-Art Nanomaterials and Nanotechnology in China)

Abstract

:
The long-term stability and the extension of the use time of gas sensors are one of the current concerns. Lowering the working temperature is one of the most effective methods to delay aging. In this paper, pure MoS2 and ZnO-MoS2 nanocomposites were successfully prepared by the hydrothermal method, and the morphological characteristics were featured by scanning electron microscopy (SEM), X-ray diffraction (XRD), transmission electron microscopy (TEM) and X-ray photoelectron spectroscopy (XPS). Pure MoS2 and ZnO-MoS2 nanocomposites, as a comparison, were used to study the aging characteristic. The sensing properties of the fabricated gas sensors with an optimal molar ratio ZnO-MoS2 (Zn:Mo = 1:2) were recorded, and the results exhibit a high gas-sensing response and good repeatability to the acetylene detection. The working temperature was significantly lower than for pure MoS2. After aging for 40 days, all the gas-sensing response was relatively attenuated, and pure MoS2 exhibits a faster decay rate and lower gas-sensing response than nanocomposites. The better gas-sensing characteristic of nanocomposites after aging was possibly attributed to the active interaction between ZnO and MoS2.

1. Introduction

In a high-voltage power system, power transformers mainly work for electricity generation and transmission with high expense [1]. It is critical to ensure the safety and reliability of power transformers during the operation for industrial production [2,3]. At present, oil-immersed power transformers are mainly popular in China [4,5]. Hydrocarbons in the insulating oil will decompose following thermal or electrical failure, causing the C–H bond and C–C bond breaking and forming gas molecules [6,7,8,9]. Therefore, dissolved gas analysis (DGA), as a diagnostic method for potential faults, is effective in oil-immersed power transformers. Meanwhile, the optimal operating temperature of gas sensors is usually 200–500 °C, which will not only cause high-energy power consumption but will also cause the growth of oxide grains in long-term use. This is the major factor causing long-term stability [10,11,12,13]. Matsuura et al. [14] found that SnO2 operating at 550 °C for 20 days can cause its grains sizes growing from 22.1 nm to 23.5 nm. Korotcenkov et al. [15] hold the opinion that the change in grain size will change crystal planes, which will affect the conductivity of the gas-sensing layer and the adsorption and desorption rate of reducing gas on the surface of gas-sensing materials. Thus, it is urgent to fabricate a gas sensor with low-energy consumption, low working temperature and long-term stability [16,17,18,19].
In the past few decades, many investigations have pointed out that molybdenum sulfide (MoS2) and other two-dimensional nanomaterials are developing rapidly, stably and controllably because of its unique properties with widely applying in optical and electronic devices, especially in gas sensors [20,21,22,23]. Therefore, MoS2, as a narrow-band-gap material, is beneficial to the development of low-energy-consumption gas sensors [24]. Recently, it has been reported that MoS2 can improved the gas-sensing performances via compounding with metal oxide semiconductors (MOSs) such as MoO3, ZnO, and SnO2. Meanwhile, zinc oxide (ZnO), as a typical n-type MOSs with a direct wide band gap (Eg ≈ 3.37 eV) and exciton binding energy (~60 meV), has superior sensing properties, due to its high mobility of carriers, good chemical and thermal stability [25,26]. Wu et al. [27] successfully prepared ZnO-MoS2 n-p heterojunction nanostructures with an extremely high gas-sensing response of 3050%, and the detection limit is 5 μL/L to 50 μL/L H2. Kumar et al. [28] proposed the use of MoS2-MoO3 n-n homojunction micronanoflowers for the effective detection of ethanol gas at room temperature, which achieved a good response to 10~100 μL/L ethanol under low-energy consumption.
Nowadays, stability is a key parameter in the long-term development of gas sensors. The stability of the sensor is divided into two types: One is that, when gas sensors are working in operating conditions such as a high temperature and toxic gas, the stability will be reduced. The other is that, when the sensor is in a normal storage state, changes in ambient humidity and temperature fluctuations will also affect the stability of the sensor. External factors can be caused by improving engineering methods, such as drift compensation, selecting the correct gas system components, adding additional filters and temperature stabilization devices, etc., to eliminate sensor stability problems [29]. For internal causes, calcination and annealing after heating treatment can be used to improve its stability [30]. Doping with other MOSs or compounding composite oxide can also increase the stability of gas sensors [19]. Ultraviolet radiation during the gas-sensing test can also improve stability by lowering the operating temperature [31].
In this study, we prepare the pure MoS2 and ZnO-MoS2 with four different molar ratios by the hydrothermal method and fabricate planar gas sensors. Next, we measure the temperature characteristics, concentration characteristics, and response–recovery characteristics of these gas sensors to C2H2 gas before and after aging in a dark vacuum environment. Compared with pure MoS2, ZnO-MoS2 nanocomposites have a better gas-sensing response and can work at a lower working temperature. Hence, the gas sensors fabricated by ZnO-MoS2 nanocomposites can greatly improve gas-sensing properties with better long-term stability. In addition, the mechanism that enables nanocomposite materials to reduce the working temperature for gas sensors to delay aging will be explained in detail in the next section.

2. Experimental Section

2.1. Materials

Sodium molybdate dihydrate (Na2MoO4·2H2O), thiourea (NH2CSNH2), citric acid monohydrate (C6H8O7·H2O), zinc chloride (ZnCl2), sodium hydroxide (NaOH), deionized water and absolute ethanol were purchased from Chuandong Chemical Co., Ltd. (Chongqing, China). To ensure the purity for the prepared gas-sensing materials, all the experimental reagents are analytical reagents and the liquid is pure solvent.

2.2. Materials Synthesis

Synthesis of pure MoS2. Firstly, 2 mmol of Na2MoO4·2H2O and 9 mmol of NH2CSNH2 were dissolved in 70 mL deionized water and stirred for 1 h. Next, 10 mmol of PVP was added into the solution with stirring for 0.5 h to get a clear precursor solution. Subsequently, the precursor solution was transferred in a sealed autoclave with a stainless-steel shell at 200 °C for 21 h in an oven. The black powder was collected after the autoclave cooled to room temperature and washed several times with absolute ethanol and deionized water. Then, put the black powder in a vacuum oven at 60 °C dry for 12 h. Finally, the pure MoS2 was obtained.
Synthesis of ZnO-MoS2 Nanocomposites: Four different molar ratios of ZnO-MoS2 nanocomposites were synthesized by the two-step hydrothermal method. Firstly, 1 mmol MoS2 prepared in the above steps was dissolved in 40 mL deionized water with constantly stirring for 10 min. Then, the solution was ultra-sonicated for 10 min to ensure even suspension. Next, 0.1, 0.2, 0.5, and 1 mmol ZnCl2 were added separately into the above suspension with 2 mmol NaOH. With constantly stirring for 0.5 h, black uniform precursor liquid was collected, and then transferred to Teflon-lined, stainless-steel autoclave at 180 °C for 16 h. The obtained black powder was washed three times with deionized water and absolute ethanol. Then, dry it at 60 °C for 12 h. Finally, the four kinds molar ratios products were labelled as S1 (Zn:Mo = 1:10), S2 (Zn:Mo = 1:5), S3 (Zn:Mo = 1:2), S4 (Zn:Mo = 1:1).

2.3. Characterization

The XRD data of samples were analyzed by X-ray diffraction (XRD, Japanese Rigaku D/max-1200 X-ray diffractometer, Tokyo, Japan) with Cu-Kα ray radiation (λ = 0.154 nm) in the range of 5°~70° at a scanning speed of 2°/min. Material micro-morphology data were acquired by using scanning electron microscopy (SEM) with an FEI Nova 400 field emission scanning electron microscope (FE-SEM, FEI, Hillsboro, MI, USA) and using transmission electron microscopy (TEM, ZEISS, LIBRA 200, Jena, Germany). X-ray photoelectron spectroscopy (XPS, ESCALAB 250 Xi, Waltham, MA, USA) with Al-Kα ray radiation source was used to confirm element composition and chemical valence, and the detection step is set to 0.05 eV and the working current is 20 mA. All the data were corrected based on the C 1 s electron binding energy.

2.4. Fabrication of Gas Sensor

The fabricated planar sensor is shown in Figure 1, MoS2 and ZnO-MoS2 were coated on it, respectively, to measure its gas-sensing performance. Firstly, 1 and 6 pins of the sensor base constructions in Figure 1b were soldered with testing electrodes, and 2 and 5 pins were welded with heating electrodes. Next, 20 mg ZnO-MoS2 nanocomposites were mixed with absolute ethanol and terpineol with a 2:1 volume ratio in a 5 mL test tube and then sonicated for 10 min to obtain a homogeneous suspension. Subsequently, the coated side of the gas-sensing materials in Figure 1a was evenly coated with suspension liquid. Finally, gas sensors were put in a vacuum oven at 60 °C for 12 h to dry. The planar gas sensors were fabricated successfully after the suspension was dried, and the gas-sensing materials were attached to the substrate with the form of a film.

2.5. Gas-Sensing Measurements

Gas distribution and measurements were included in the gas-sensing process. The RCS 2000-A gas distribution system (Kingsun Electronics Co., Ltd., Beijing, China) contained eight inlet channels and one outlet channel. The basic principle of gas distribution process is to use a sophisticated mass flow controllers (MFCs) to control the gas flow and dilute the target gas to the target concentration with the carrier gas. A CGS-8 TP intelligent gas-sensing analysis system was used to test and analyze gas. The volume of the cylindrical assembled by opaque latex tube air cavity is 100 mL. The flow diagram of the entire gas-sensing test process was shown in Figure 2. The characteristic parameters during the testing process are roughly as follows: resistance in air (Ra), resistance in reducing gas (Rg), gas-sensing response (Ra/Rg), optimal working temperature, detection limit, response–recovery time.
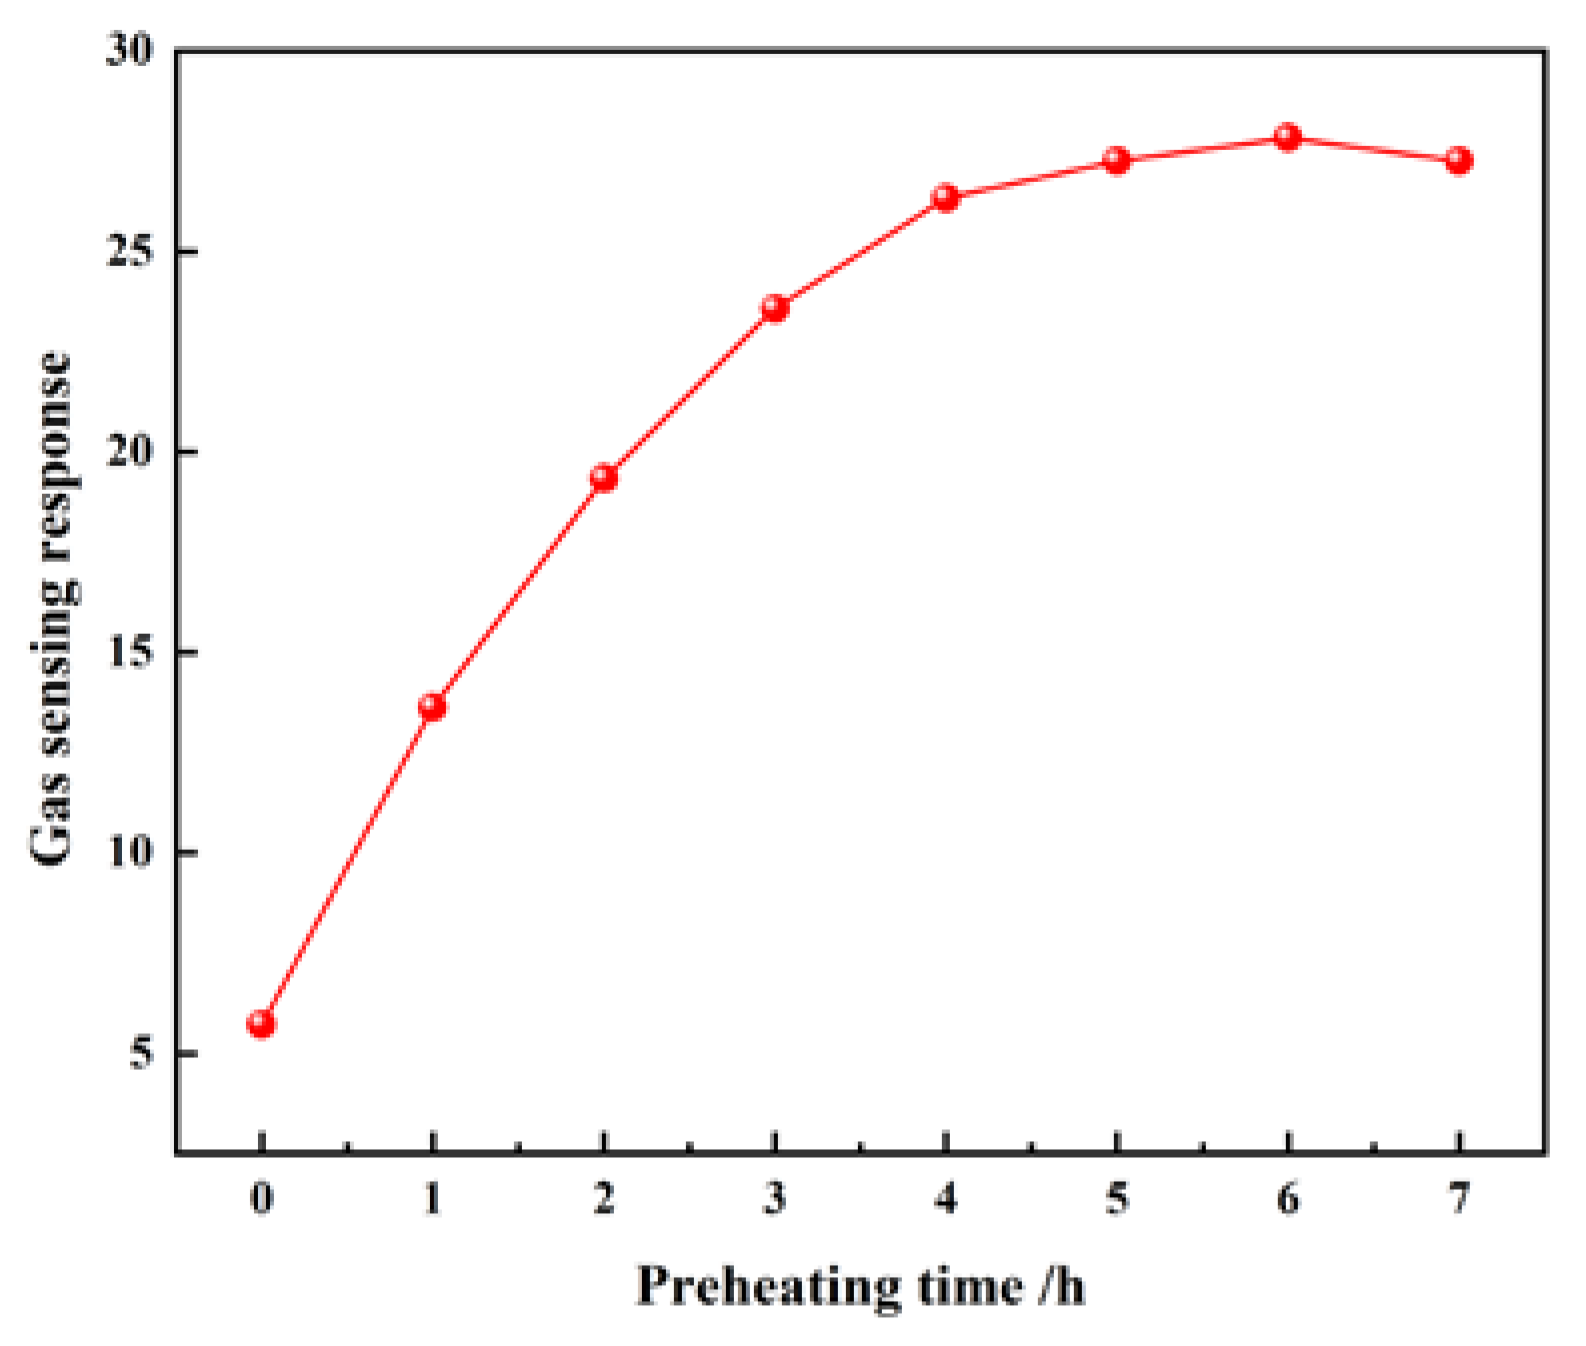
Before the gas-sensing test, it is necessary to preheat the material to optimize the aging experiment. The preprocessing experiment selected S3 at 15 μL/L of C2H2, and the results were shown in the Figure 3. The aging experiment was conducted in a dark vacuum environment. The gas-sensing response in this paper was defined as Ra/Rg, which Ra and Rg were the resistances of gas sensors in air and the C2H2 gas, respectively.

3. Results and Discussion

3.1. Morphology and Structure

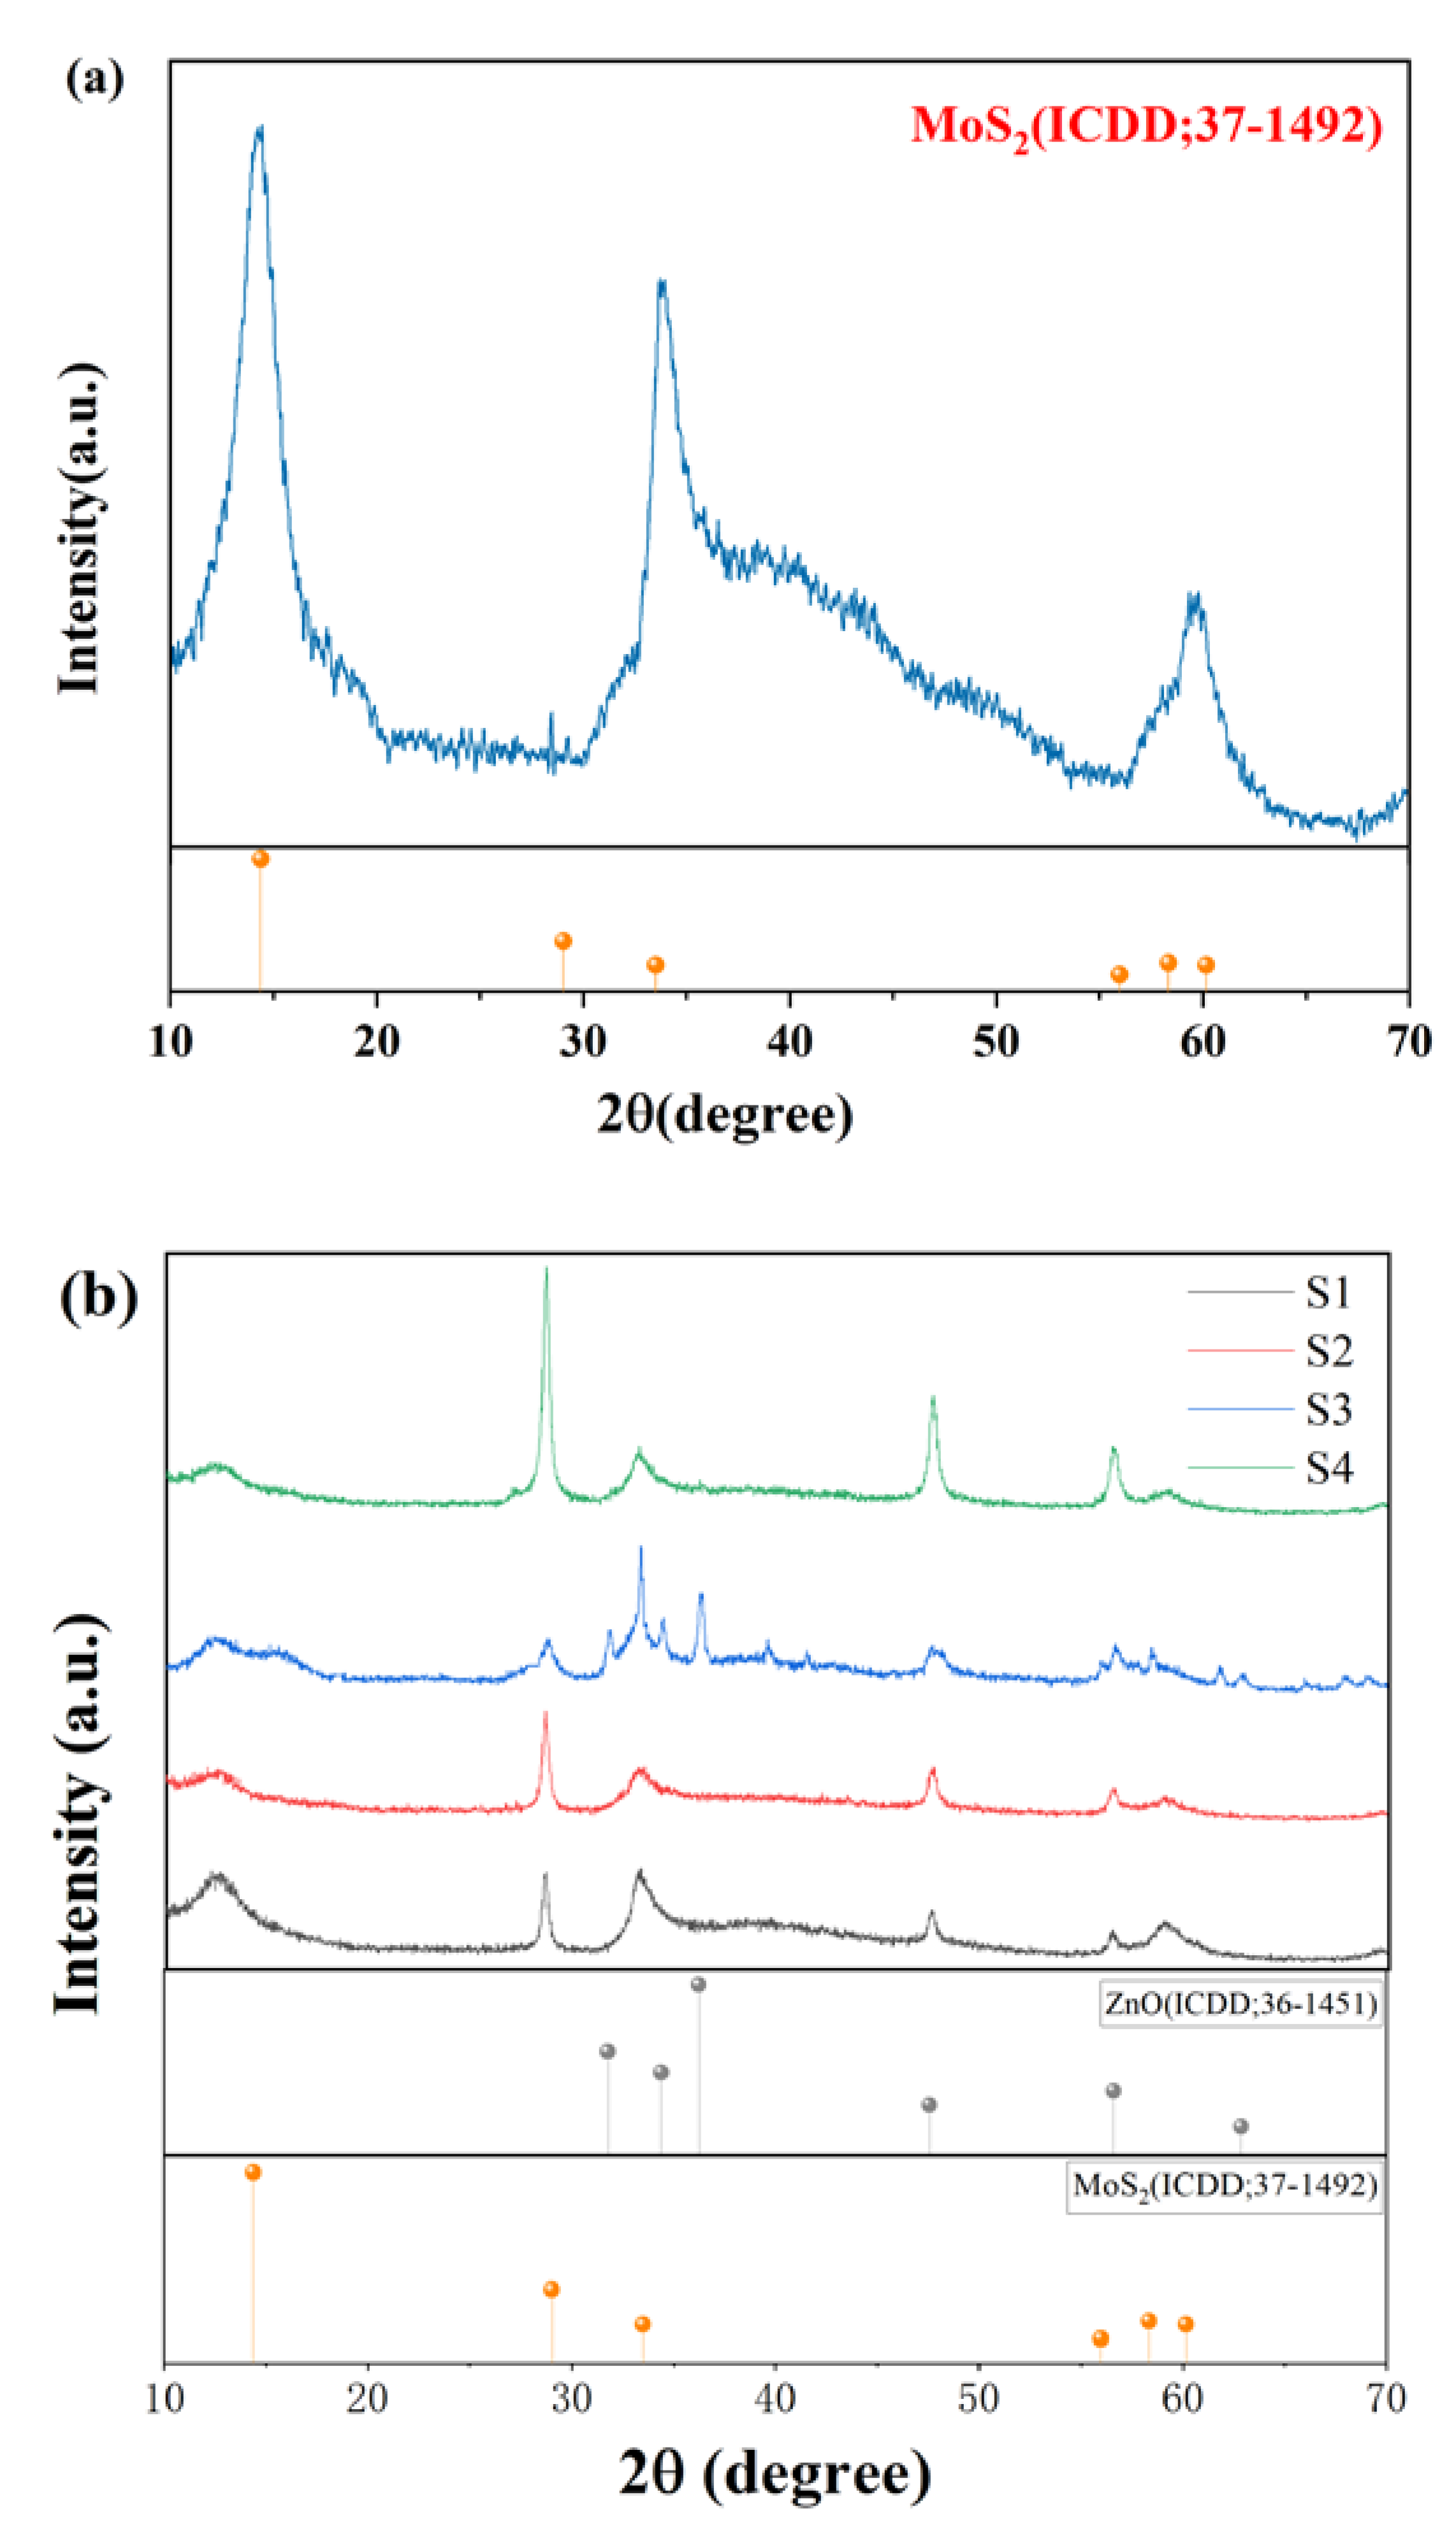
XRD patterns of pure MoS2 and four proportions of ZnO-MoS2 nanocomposites are shown in Figure 4. It can be seen that all diffraction peaks of ZnO-MoS2 nanocomposites remain highly consistent, which indicates the crystal structures of MoS2 do not change with the addition of ZnO particles. Meanwhile, the diffraction peaks of ZnO are not very obvious, but still are highly consistent with the standard hexagonal ZnO pattern (JCPDS No. 36-1451). It shows that only ZnO particles are deposited during the compounding process, indicating that no impurities are introduced. In contrast, it can be found that the diffraction peaks of MoS2 are more obvious but present a typical amorphous bun shape with poor crystallinity, which is a common problem for two-dimensional materials. The six peaks at 14.38°, 29.03°, 33.51°, 55.98°, 58.33° and 60.15° of MoS2 are greatly indexed as the standard MoS2 pattern (JCPDS No. 37-1492) with little impurities, indicating the black powders are MoS2.
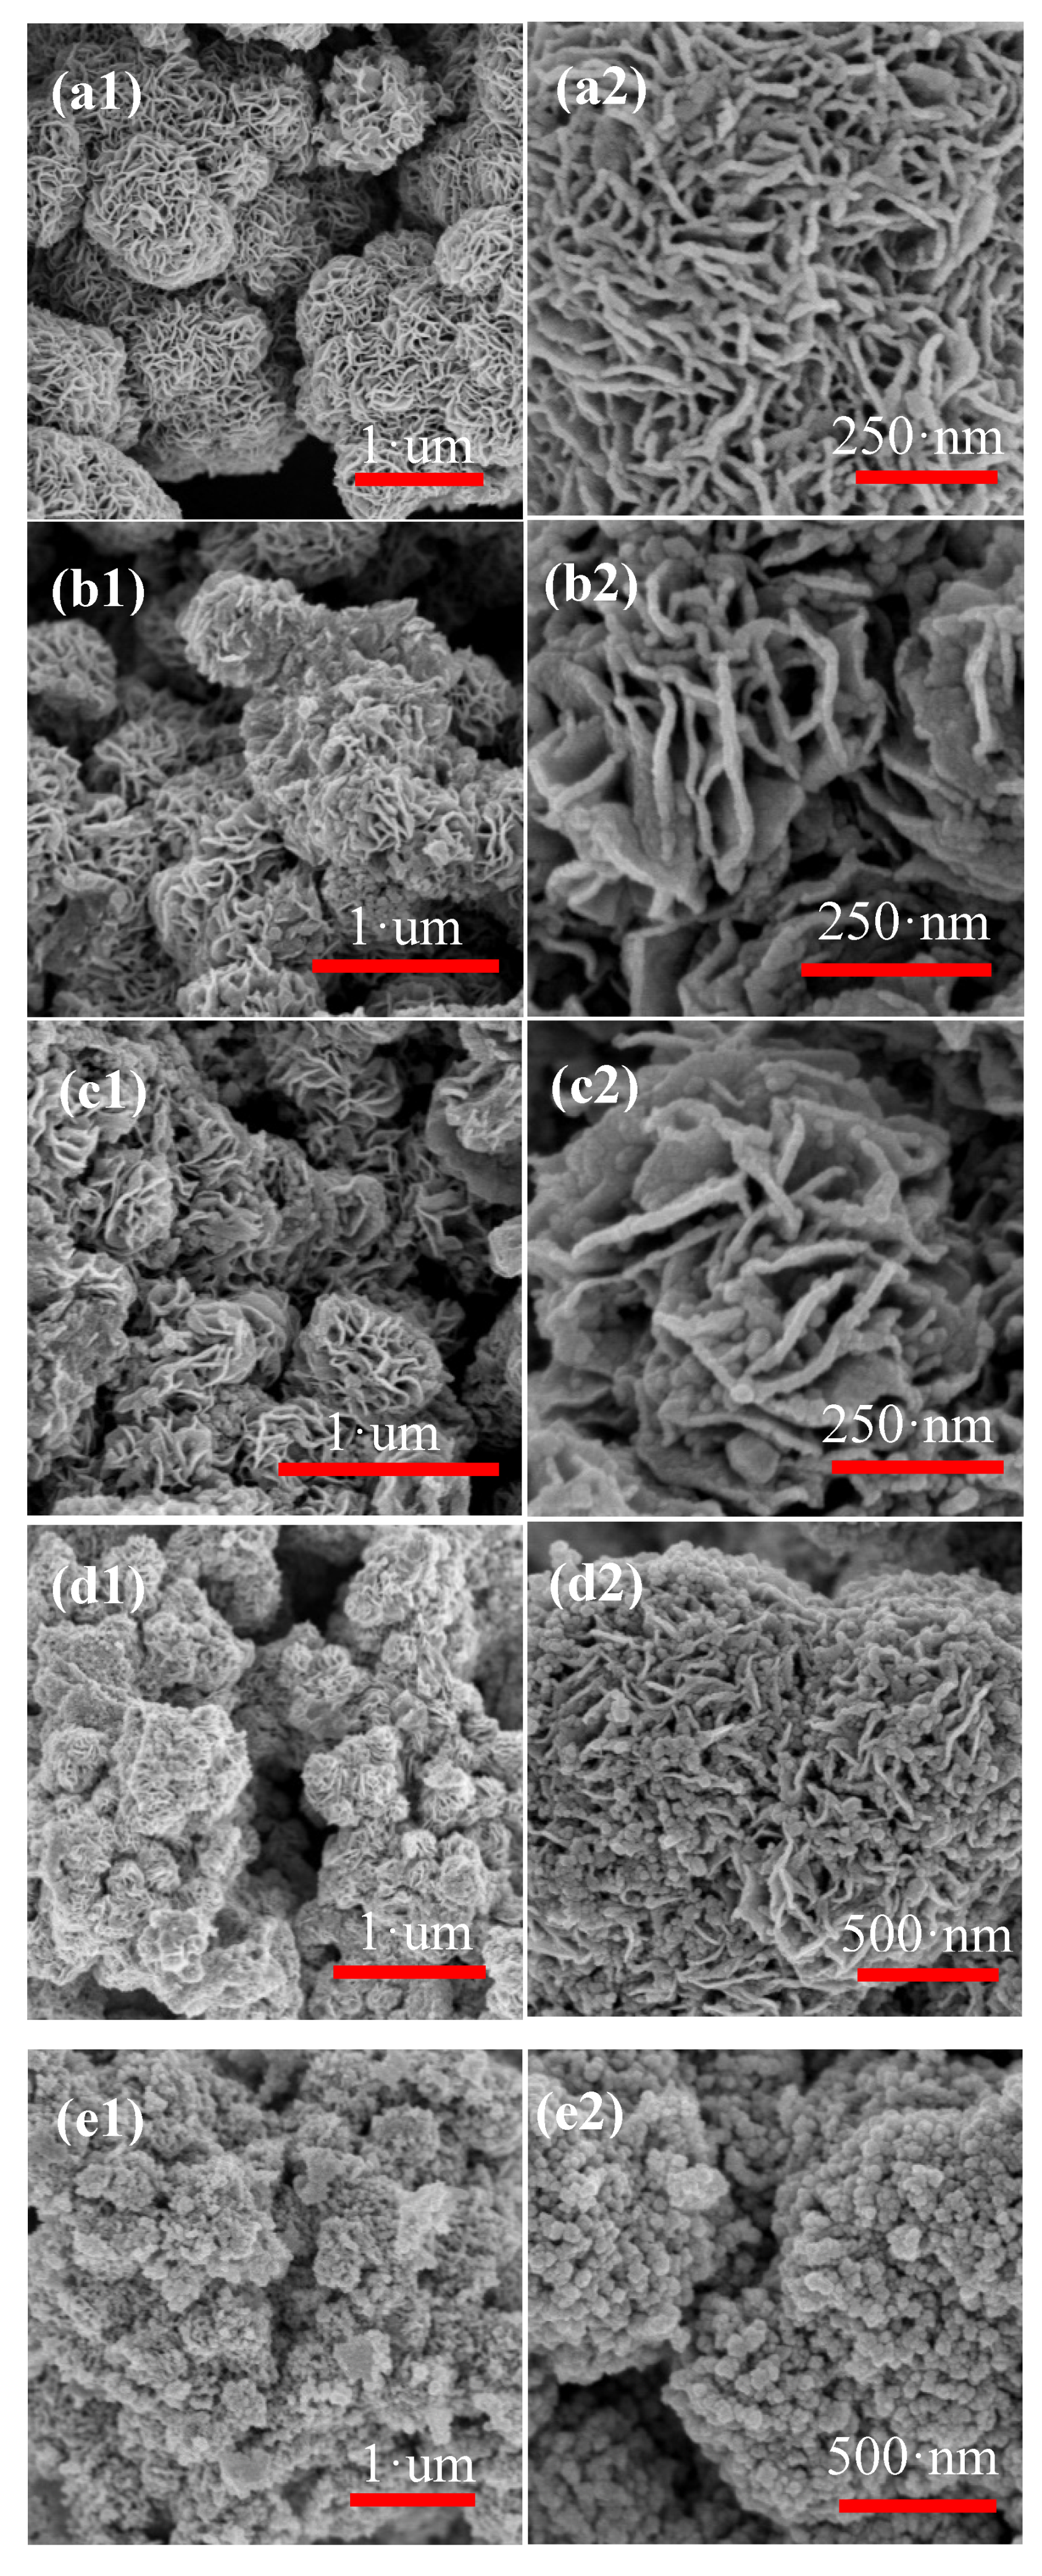
Figure 5 shows SEM images of pure MoS2 and four different ratios of ZnO-MoS2 nanocomposites. It can be seen that pure MoS2 are flower-like structures with good uniformity in Figure 5a1. The diameter of a single MoS2 crystal formed by numerous sheet-like MoS2 with uniform thickness is about 700 nm observed in the high magnification image (Figure 5a2), and there are large porosities among the sheet-like MoS2. Figure 5b–e show four different composite ratio ZnO-MoS2 nanocomposites, which show that these particle sizes have little change in the range from 0.5 to 1.0 μm with excellent uniformity. In the high resolution, it can be more evidently found the number of ZnO particles increases in the pores and on the outer surfaces of MoS2 nanosheets with the addition of Zn for sample S2 and S3. Additionally, for the sample S4, ZnO particles have completely wrapped the MoS2, causing the particle shape change from flower-like to stacked spherical particles. Therefore, with the increase in doping concentration, the uniformity is getting better, but too high doping concentration will change the particle shape. Sample S3 with optimal doping concentration was selected for the next characterization test.
It can be seen that the TEM patterns of ZnO-MoS2 nanocomposites are sphere-like in the central black area with a little light dots in Figure 6a, which means that the internal structure of the composites is not a solid sphere, and there are still pores among MoS2 nanosheets. The lighter area around nanocomposites is composed of ZnO wrapped in the MoS2 nanosheets, which further proves the good uniformity. The HRTEM analysis of the MoS2 nanosheets presents irregular lattice fringes with 0.67 nm (Figure 6b) that corresponds to the MoS2 (002) crystal plane. Figure 6c can clearly show regular and orderly lattice fringe spacing that is 0.281 nm corresponds to the ZnO (110) plane and 0.248 nm to the ZnO (101) plane.
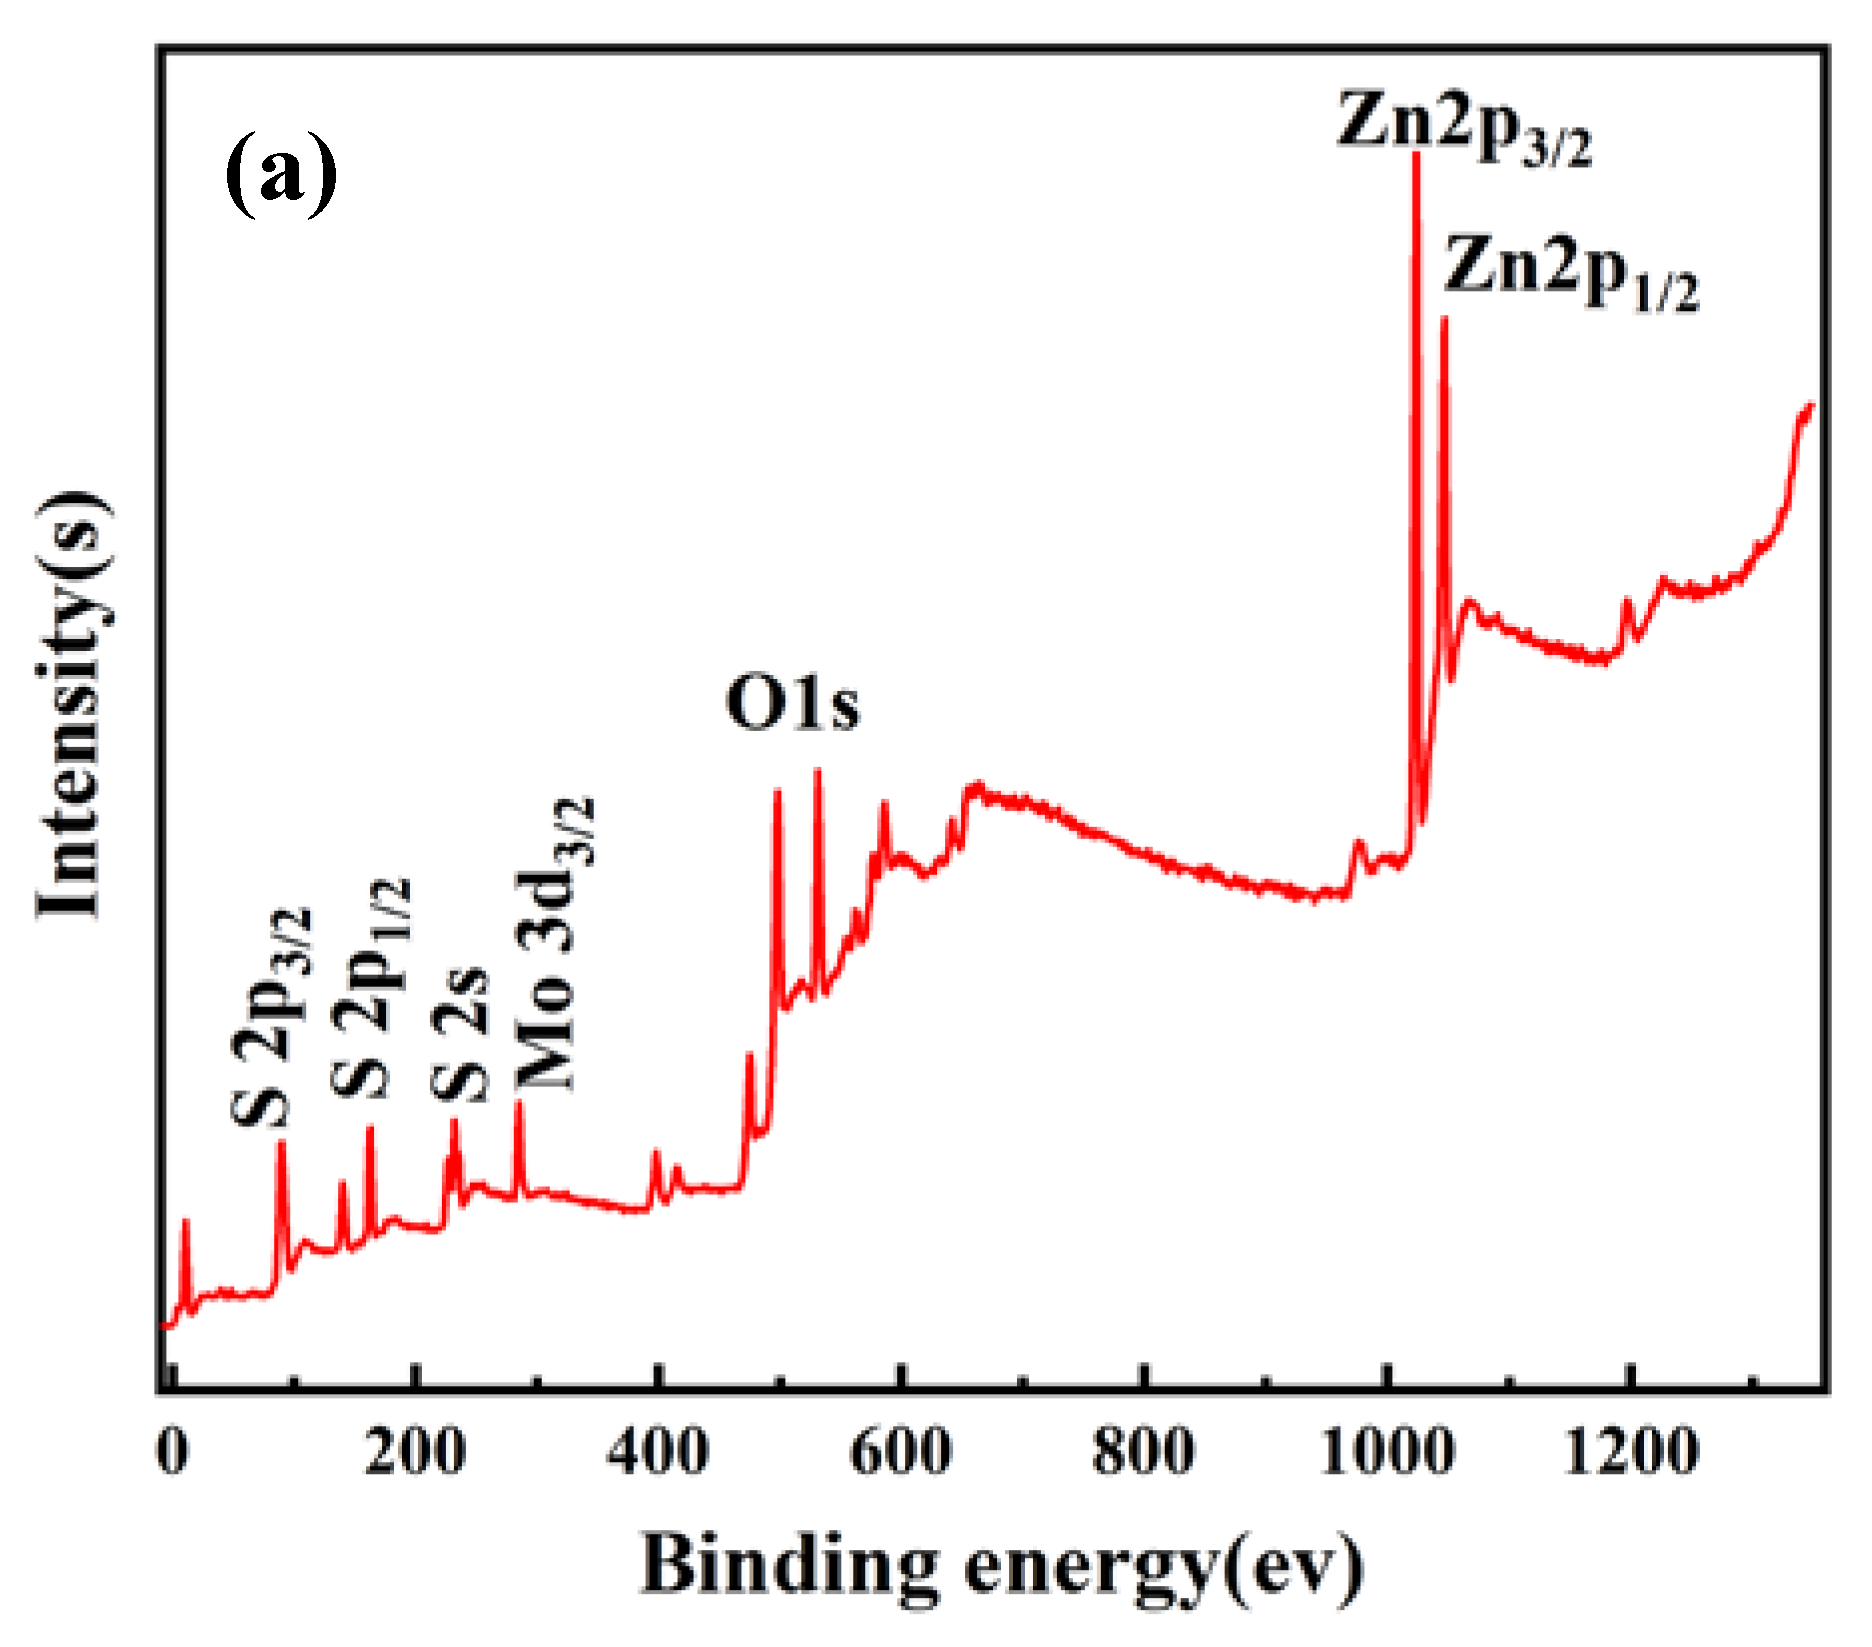
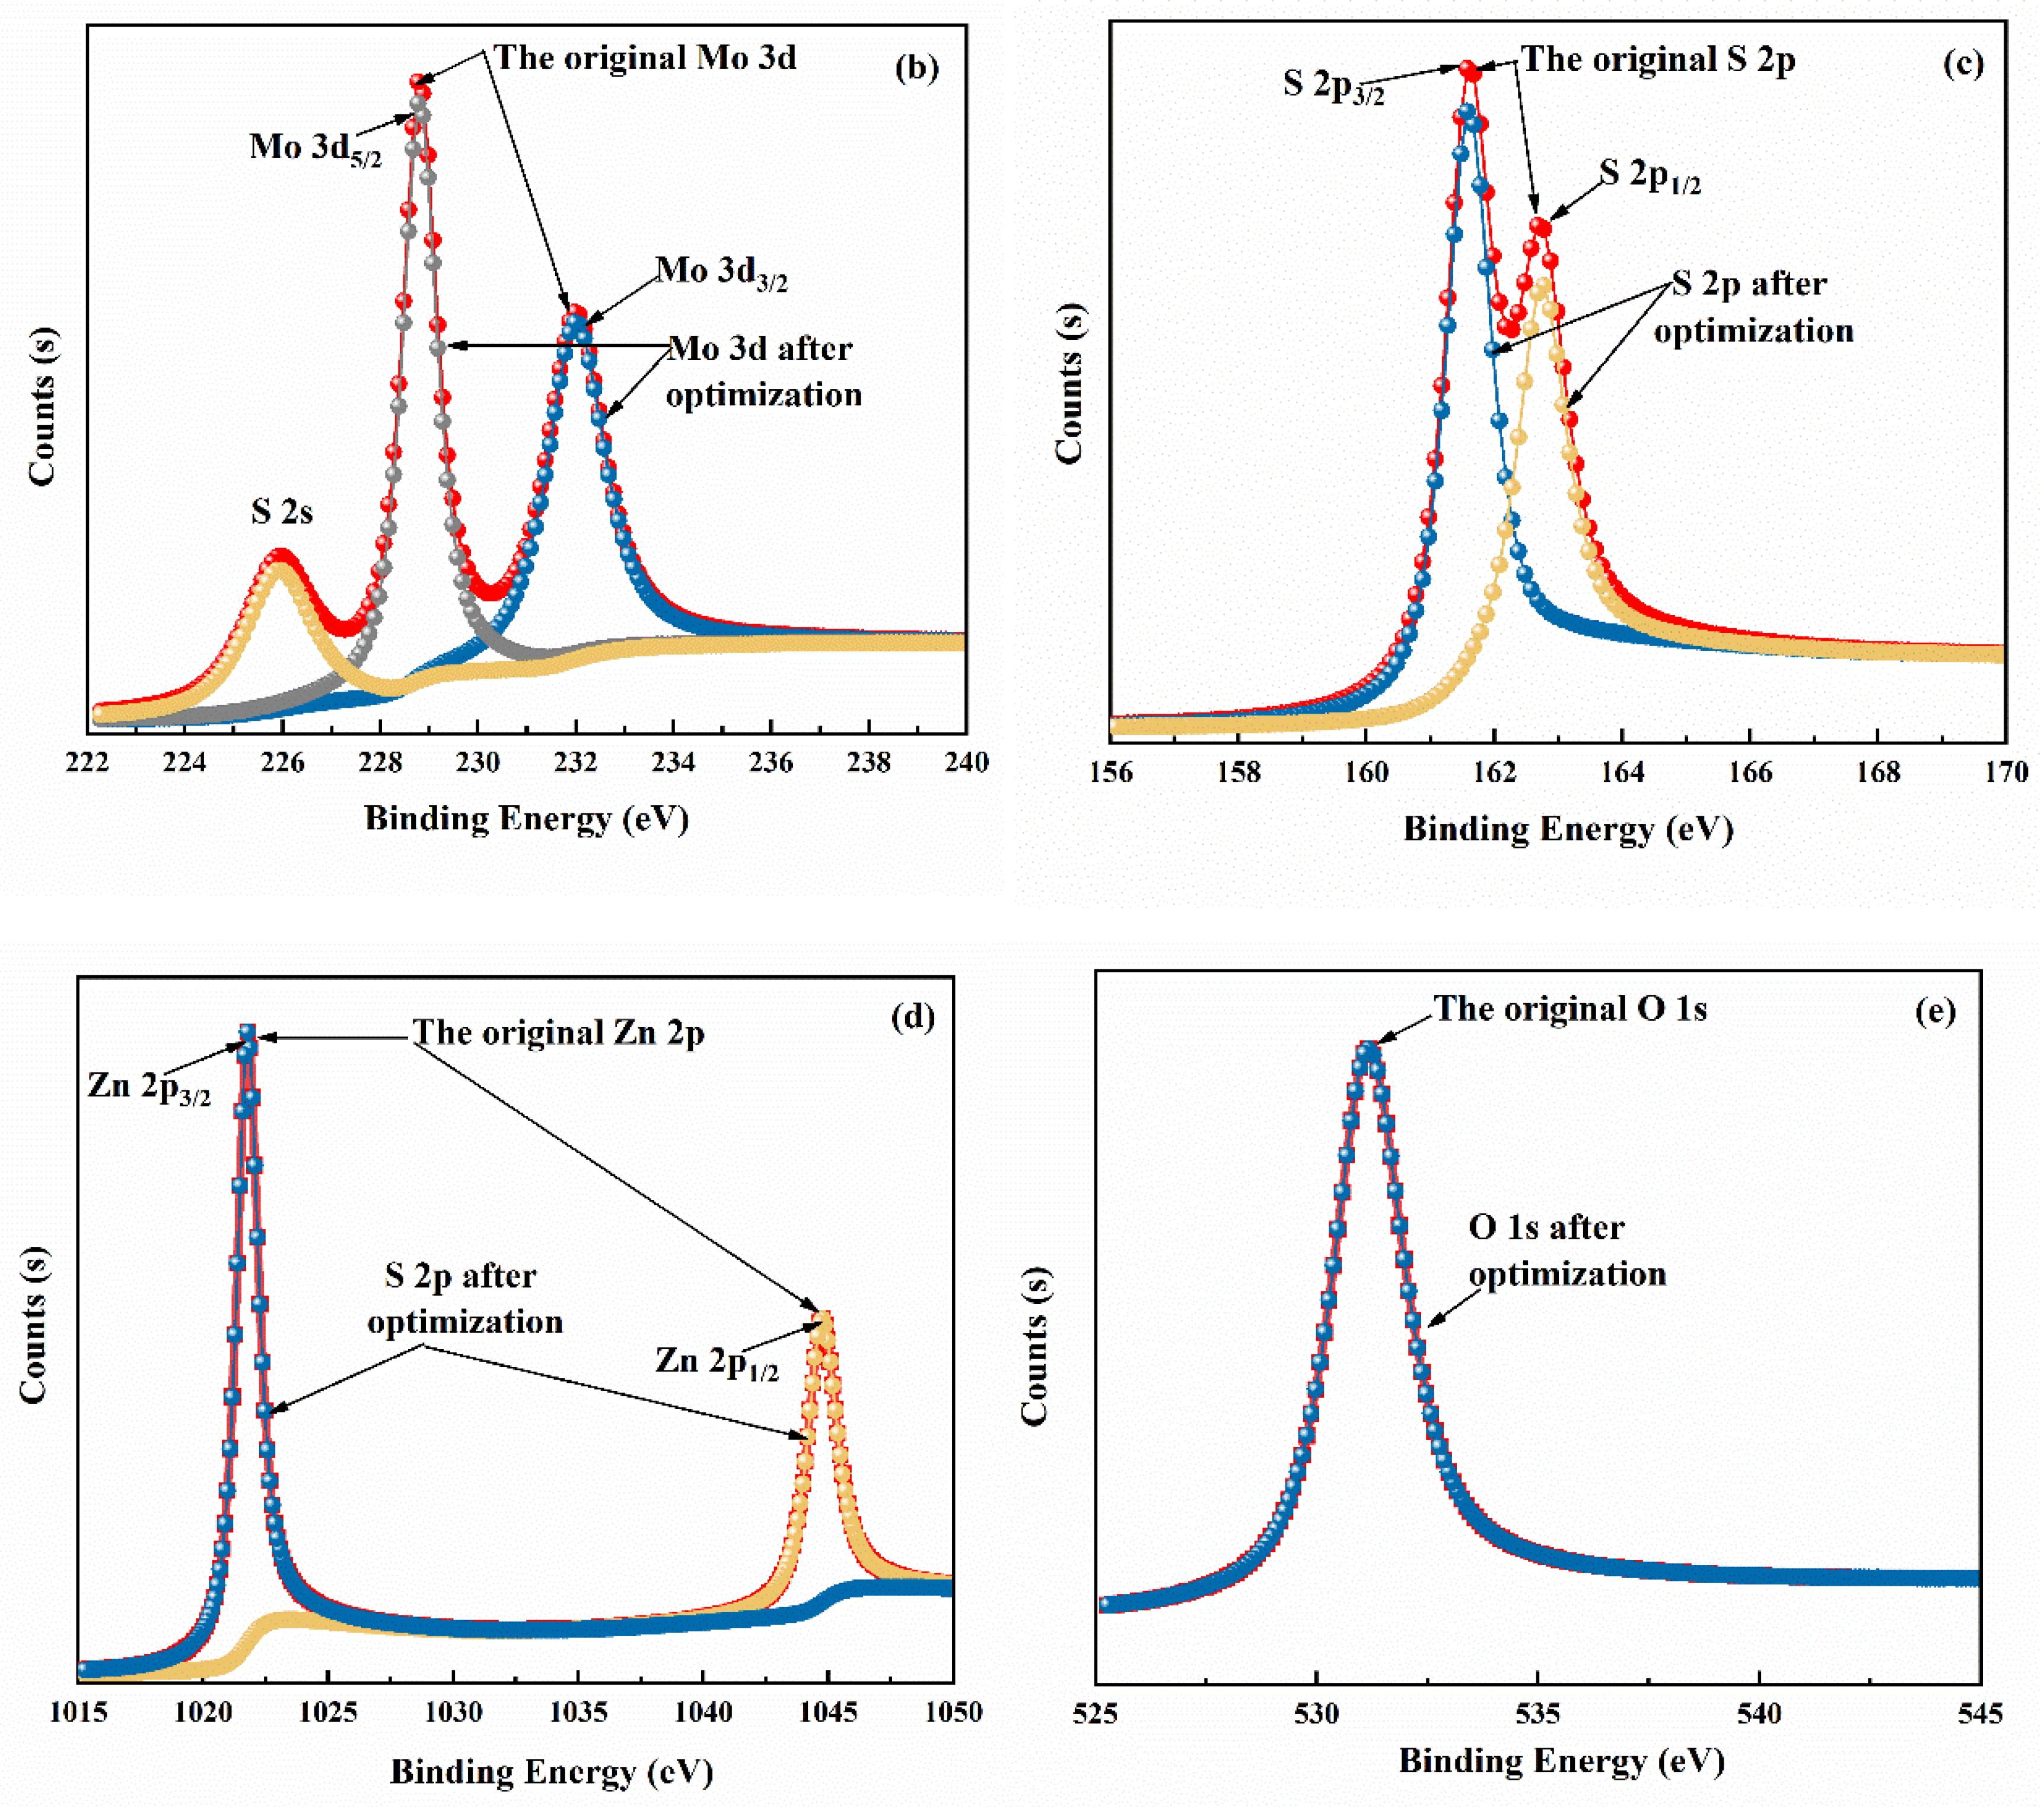
To characterize the elements and valence in the nanocomposites, the sample S3 is further studied with XPS spectroscopy. As shown in Figure 7a, it can be found that there are three peaks and two of the peaks at 232.3 and 229.1 eV are caused by the binding energy of Mo 3 d3/2 and Mo 3 d5/2, respectively, which proves the existence of Mo+4. The peaks appearing in Figure 7b are located at 163.2 and 161.7 eV are attributed to the S 2 p1/2 and S 2 p3/2 of S−2, respectively. The two peaks in Figure 7c located at 1045.0 and 1022.7 eV are in agreement with Zn 2 p1/2 and Zn 2 p3/2 of Zn+2. Figure 7d is the XPS data of oxygen with the binding energy of 531.9 eV, which is attributed to the O 1 s of O−2. Therefore, four characterization methods proved that the ZnO nanoparticles were well doped in the MoS2 with little impurities.

3.2. Gas-Sensing and Aging Characteristics

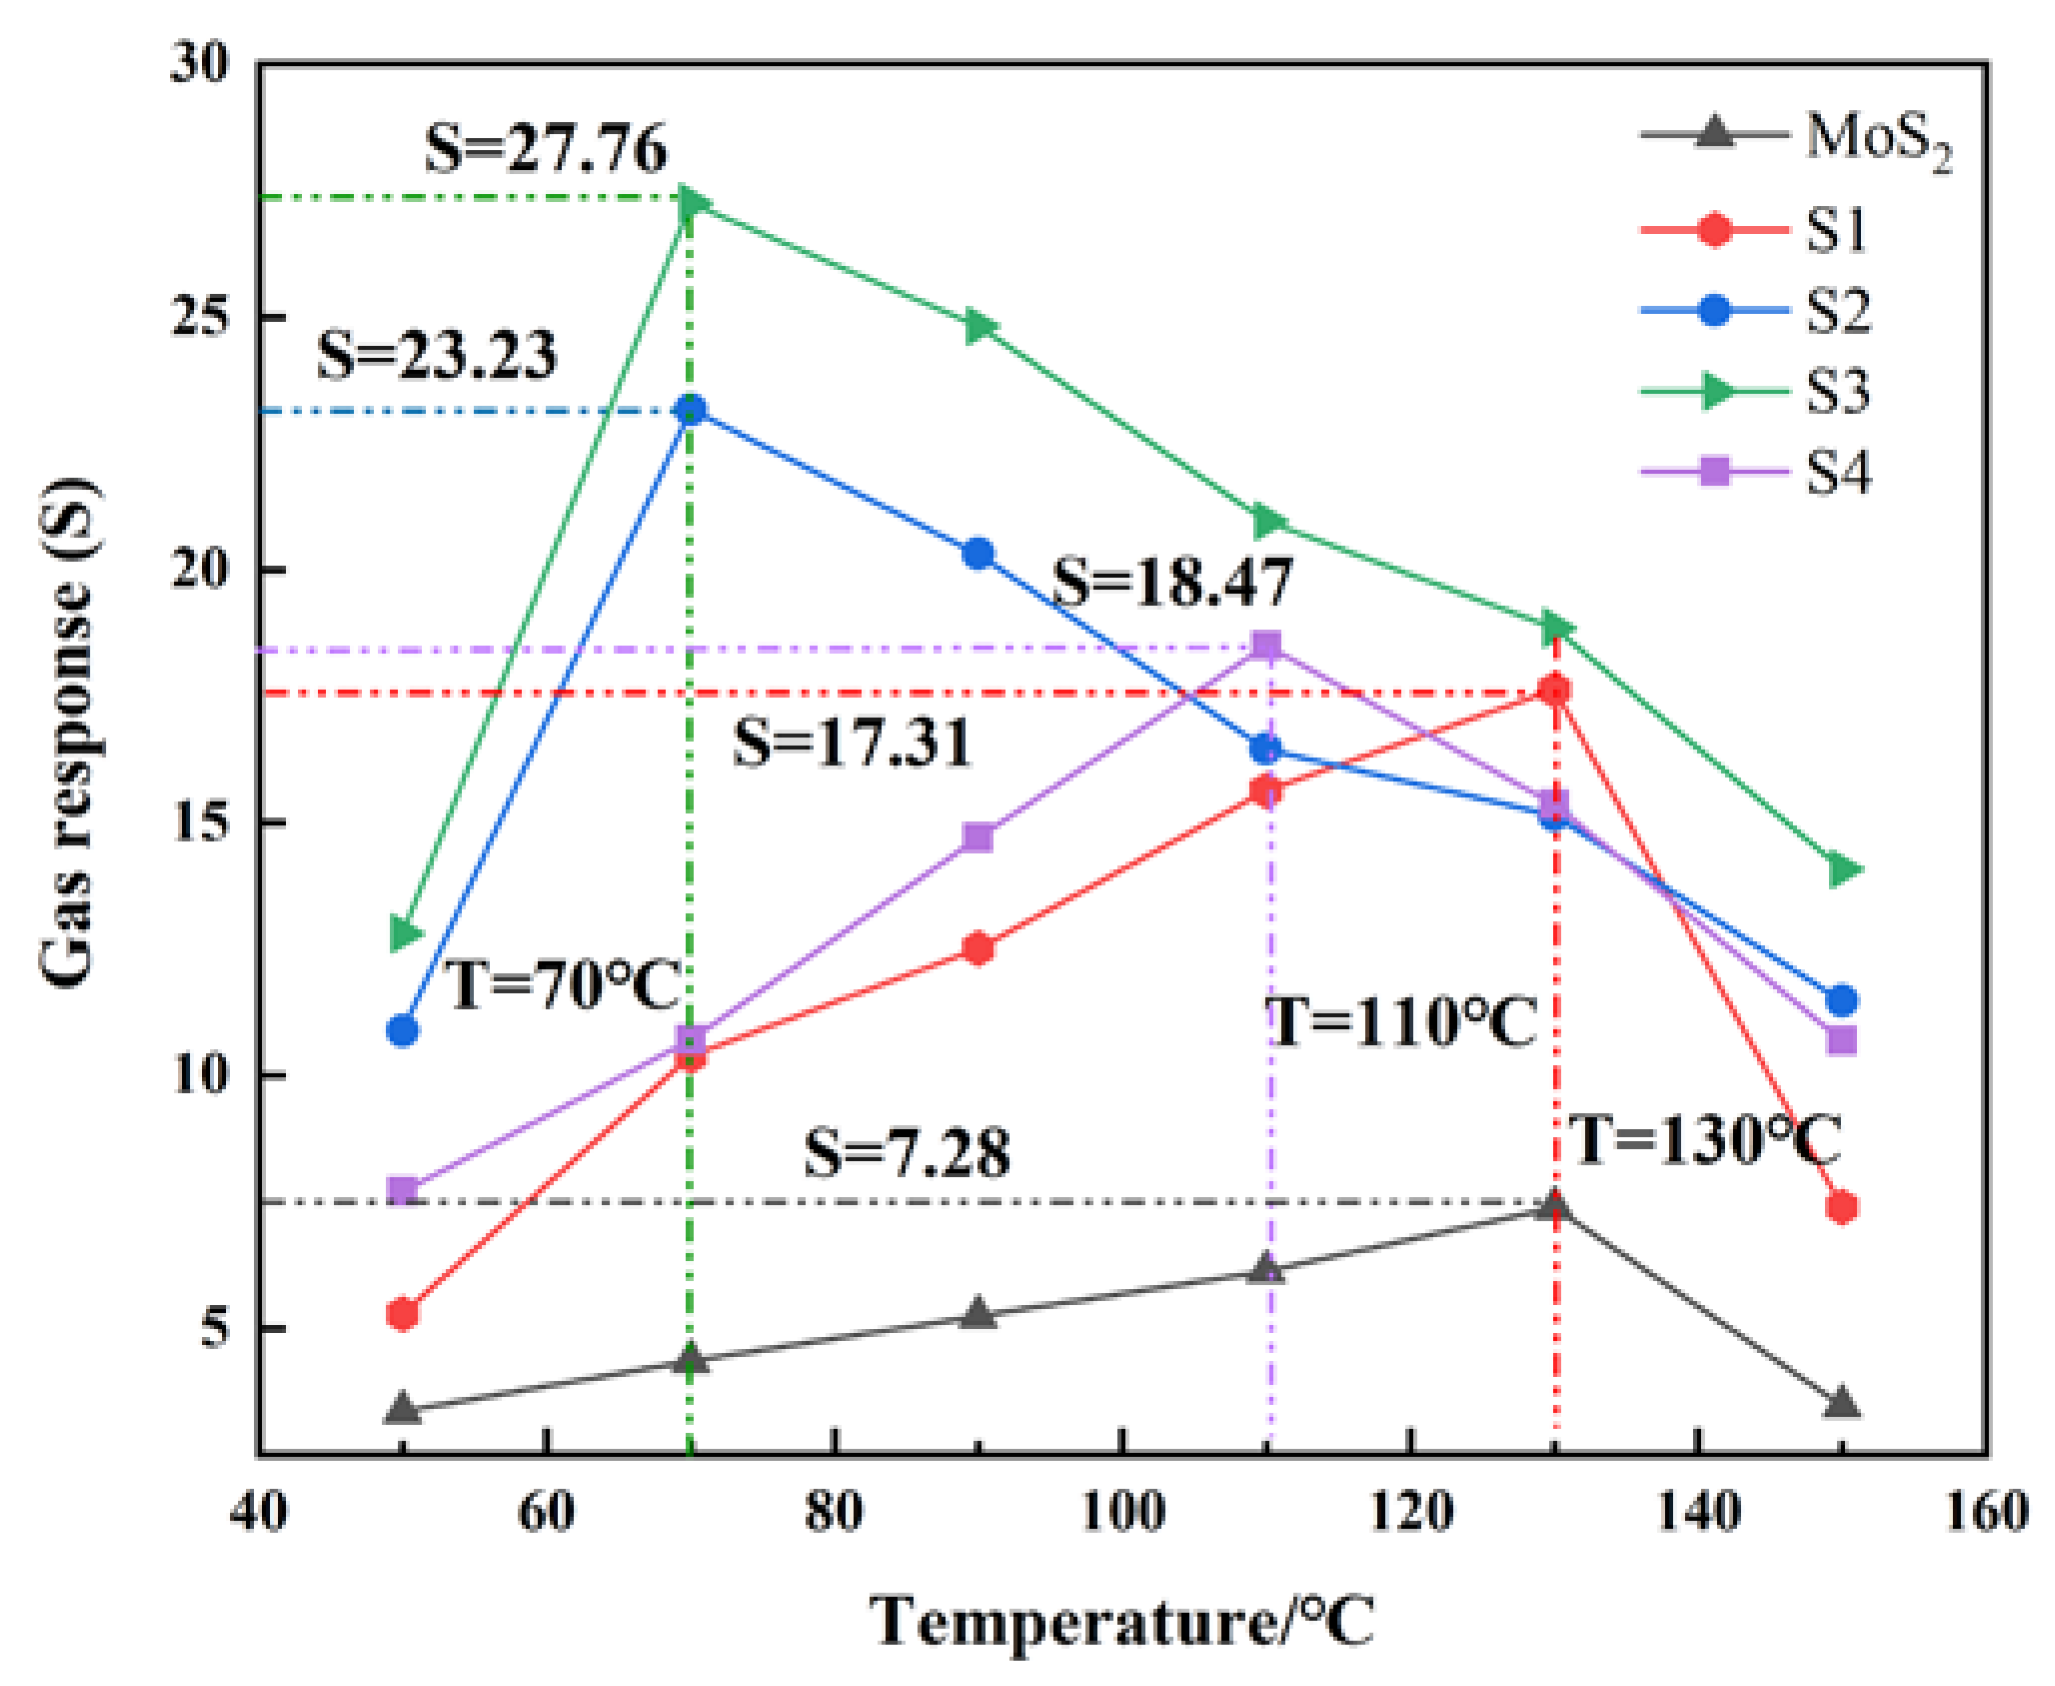
To analyze the influence of the composite structures on the gas-sensing response and find the optimal working temperature of gas sensors, the temperature characteristics of gas-sensing materials are tested. The temperature characteristic curves of each gas-sensing material to 15 μL/L C2H2 are given in Figure 8. Because MoS2 is a narrow-band-gap semiconductor gas-sensing material with low excitation energy, the temperature range is set at 50~150 °C [32,33,34]. It can be seen that the change trend of the gas-sensing response increases first and then decreases accompanied by a rise in working temperature. Among them, the optimal working temperature of pure MoS2 and S1 is at 130 °C, and the corresponding gas-sensing response are 7.28 and 17.31, respectively; the optimal working temperature of S2 and S3 is at 70 °C, and the corresponding gas-sensing responses are 23.23 and 27.76, respectively; the optimal working temperature of S4 with the maximum doping ratio is 110 °C, and the corresponding gas-sensing response is 18.47.
The optimal operating temperature gradually decreases with the doping ratio increasing, and the gas-sensing response of S3 is much higher than other nanocomposite materials and pure MoS2. The phenomenon is explained by the chemical activation energy being small at a low temperature, and the reaction between C2H2 and gas-sensing materials are prevented with the existence of a potential barrier. Therefore, with the increase in temperature, the chemical activation energy increases rapidly and the gas-sensing response enhances. As the temperature rises further, oxygen containing functional groups disappears, which causes the gas response to decrease at a low speed. In a word, as a certain amount of compound ratio increases, the optimal working temperature gradually decreases and the gas-sensing response has also been significantly improved compared to the pure MoS2.
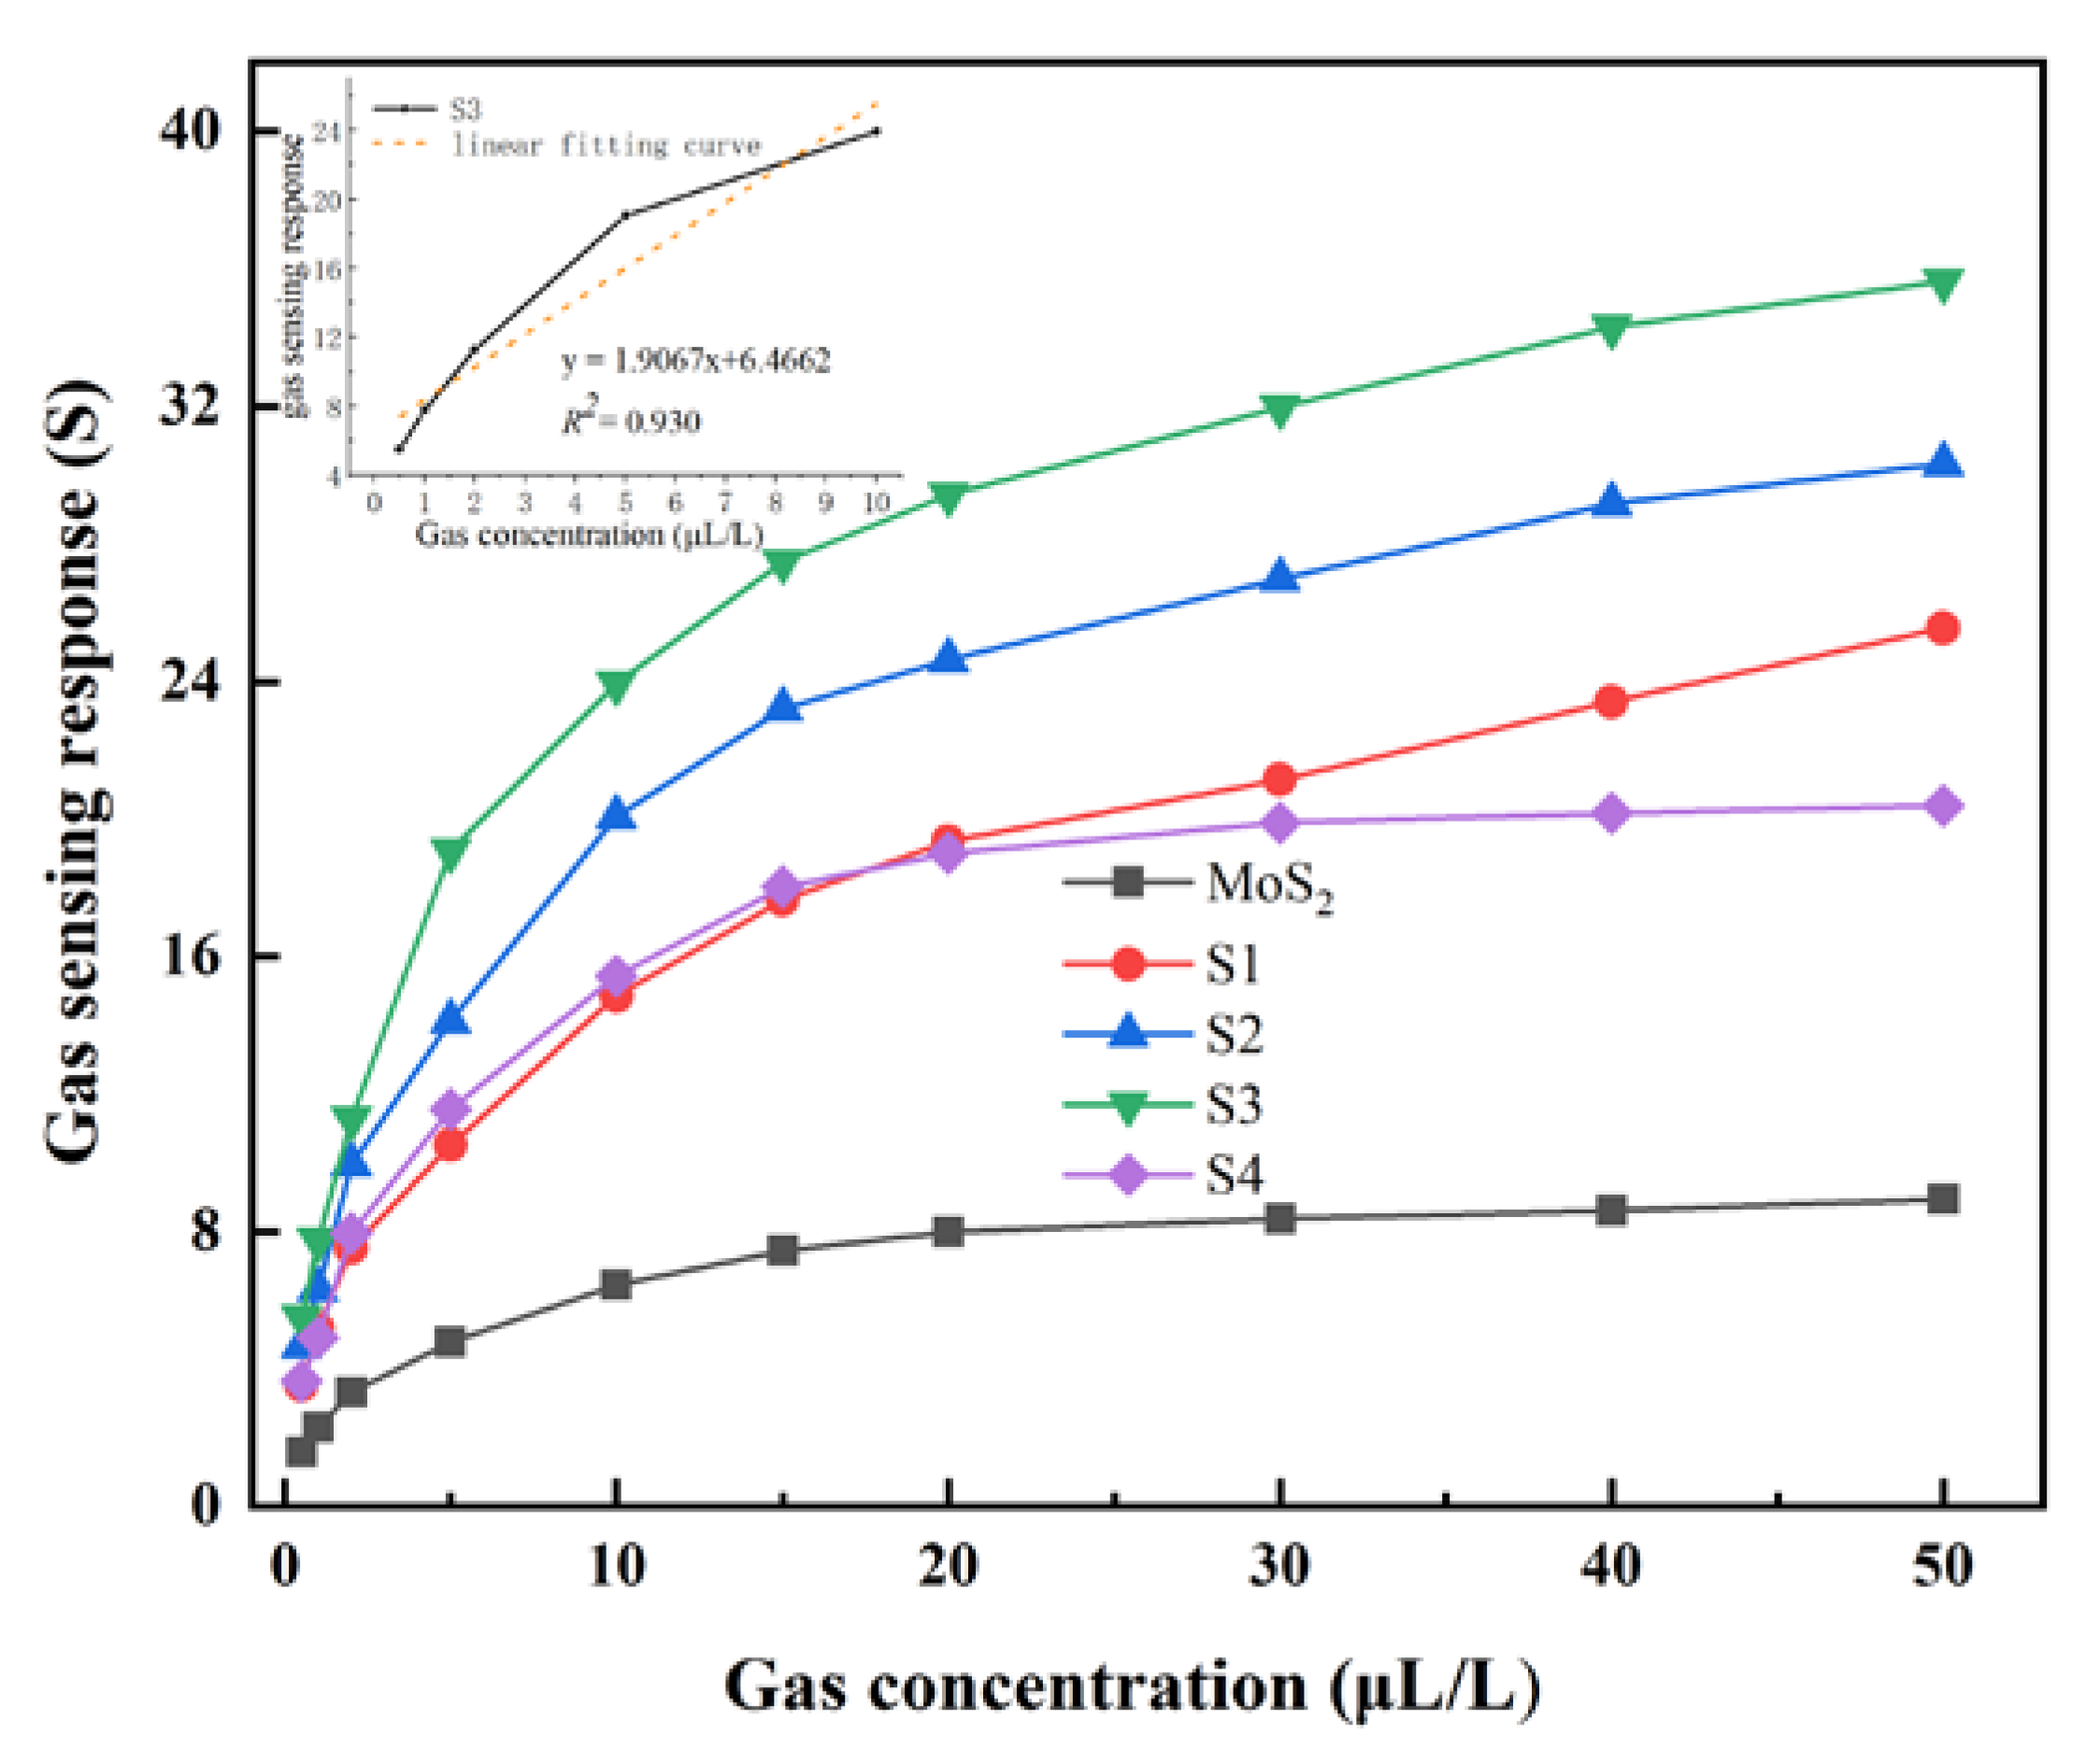
The detection range of the C2H2 gas concentration is selected from 0.5 to 50 μL/L (0.5, 1, 2, 5, 10, 15, 20, 30, 40, 50 μL/L). Figure 9 is the concentration characteristic curve to C2H2 gas, gas-sensing response gradually increases but the growth rate becomes slower with the concentration increasing, which shows that the concentration of C2H2 gas is positive feedback to the response of the material. From the Figure 9, it can also be observed that pure MoS2 exhibits the worst gas-sensing characteristics. When ZnO particles are combined with MoS2, the gas-sensing response value of the material increases significantly. However, the gas-sensing response of S4 showed a relatively large decrease compared with S3. It can be explained that the addition of excessive ZnO particles caused the the pore structure of MoS2 disappears. This phenomenon indicates that the proper doping of a certain concentration of ZnO can have a positive effect on the gas properties of MoS2. Additionally, in the range of 0.1 to 10 μL/L C2H2 gas (the inset of Figure 9), the function after the linear fitting of the gas-sensing material is y = 1.9067x + 6.4662, and the corresponding linear correlation coefficient is 0.930, which indicates a low detection limit of the gas sensors with 5.52 gas-sensing response at 0.5 μL/L C2H2.
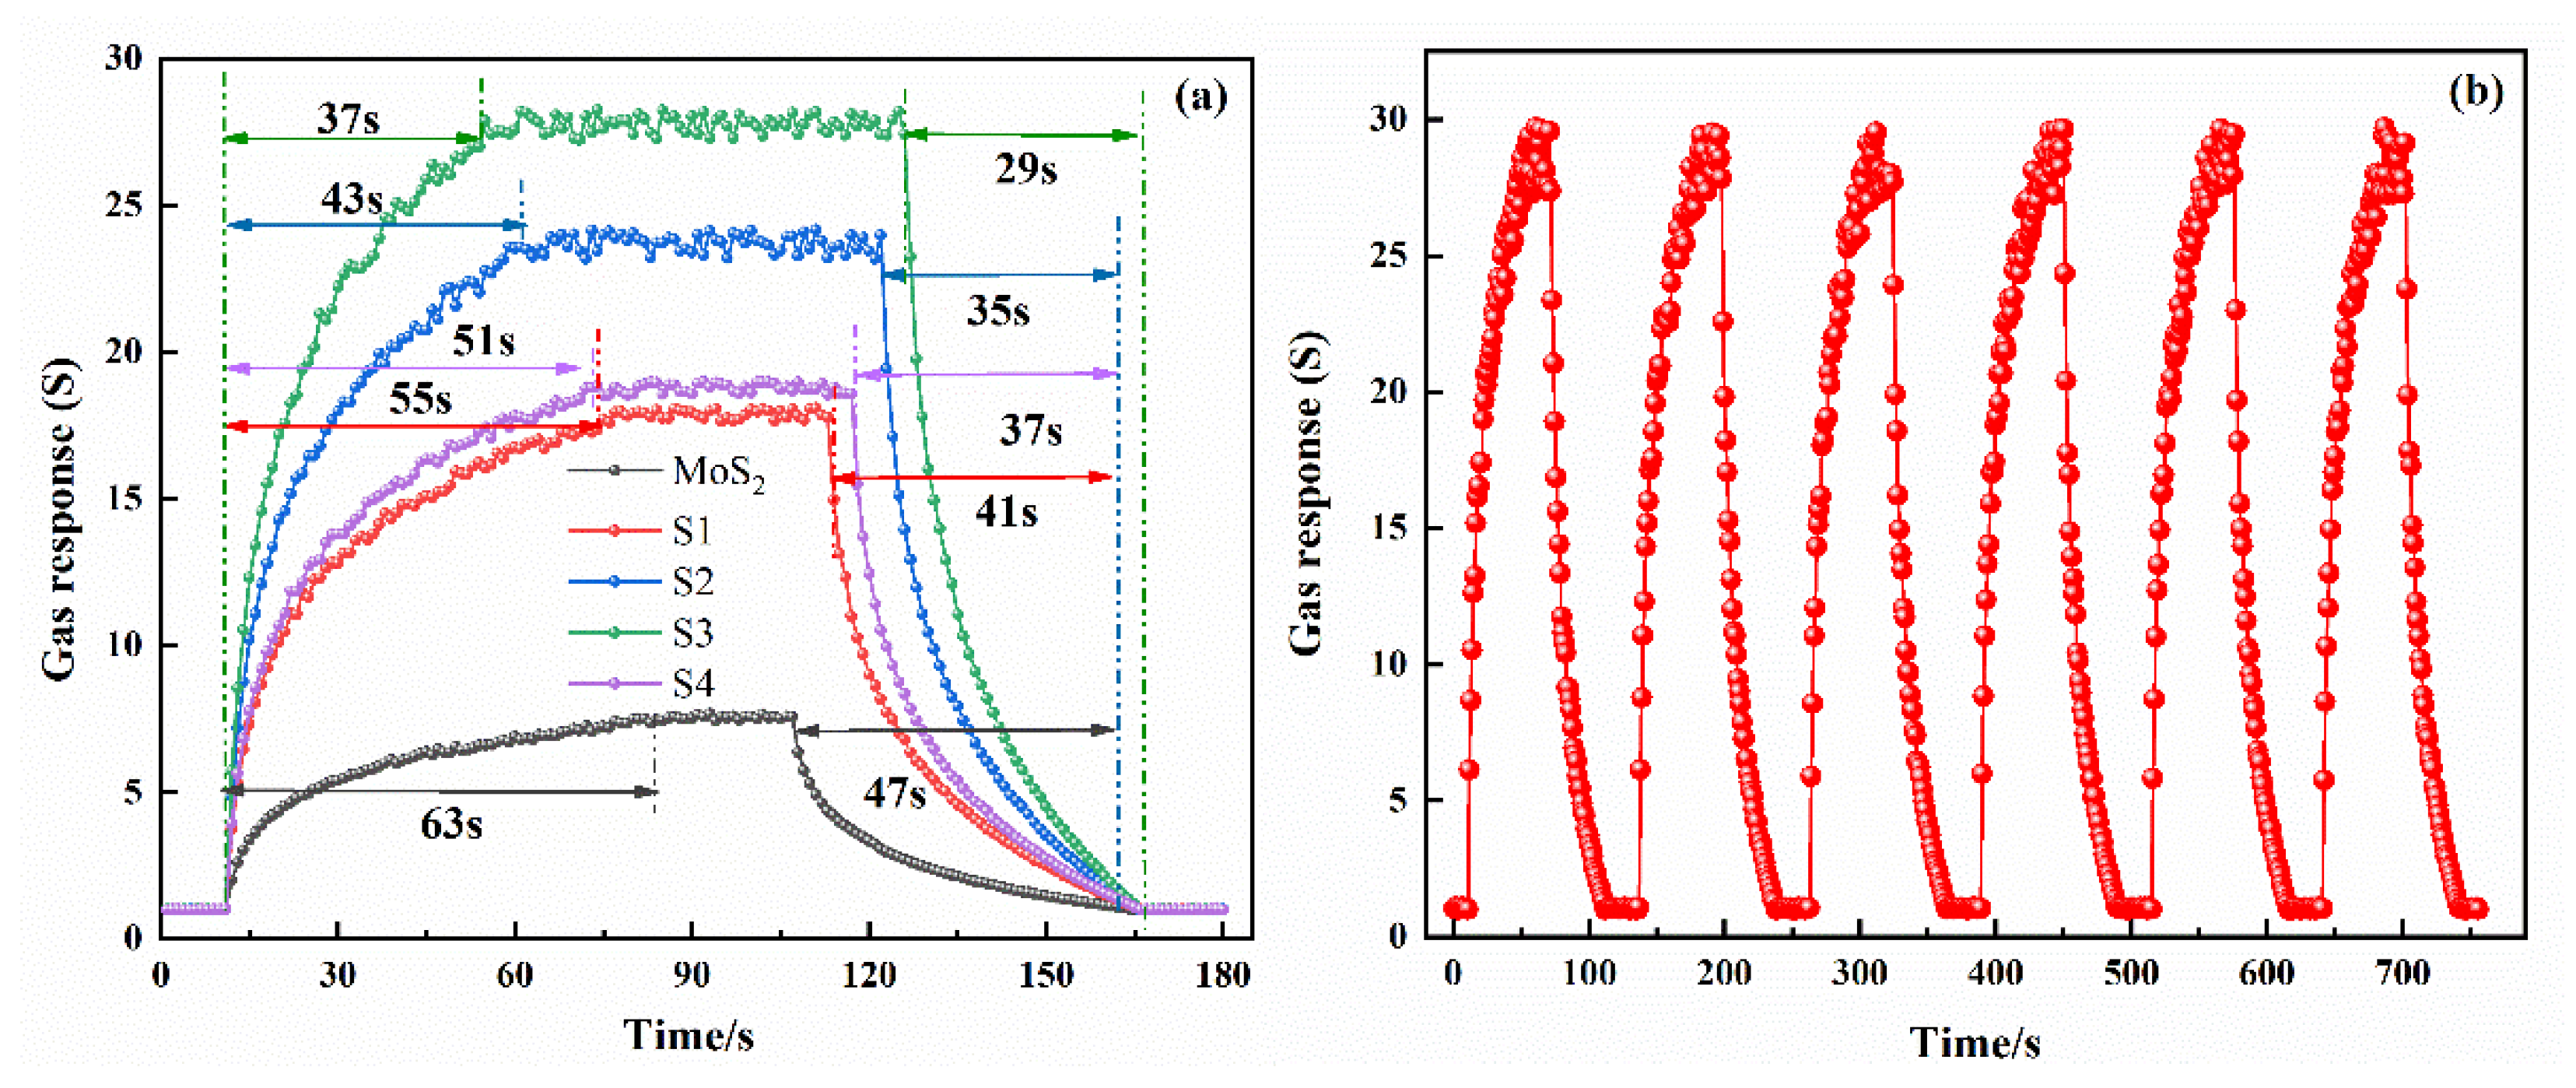
Figure 10a is the dynamic response–recovery characteristic curve of five gas-sensing materials to 15 μL/L C2H2. It can be found that sample S3 showed the fastest response, with a 37 s response time and a 29 s recovery time. Figure 10b is the dynamic response curve of sample S3 under five cycles. It can be found that the gas-sensing response value of S3 composite material does not obviously change during five continuous test cycles, and the time required for each measurement cycle is also approximately equal. The gas-sensing response of each measurement cycle will return to the base point. This phenomenon shows that the test stability of gas-sensing materials is good in a short time.
Figure 11 is the scanning electron micrograph comparison of S3 composite material without aging and after 20 days of aging in a dark vacuum environment. Compared with the Figure 11a without aging, it is obviously found that the crystal structure of ZnO-MoS2 nanocomposites changes greatly, and the sheet structures of MoS2 and the small particles of ZnO appear to grow and agglomerate, which means the porosity of the material decreases and the particle size increases.
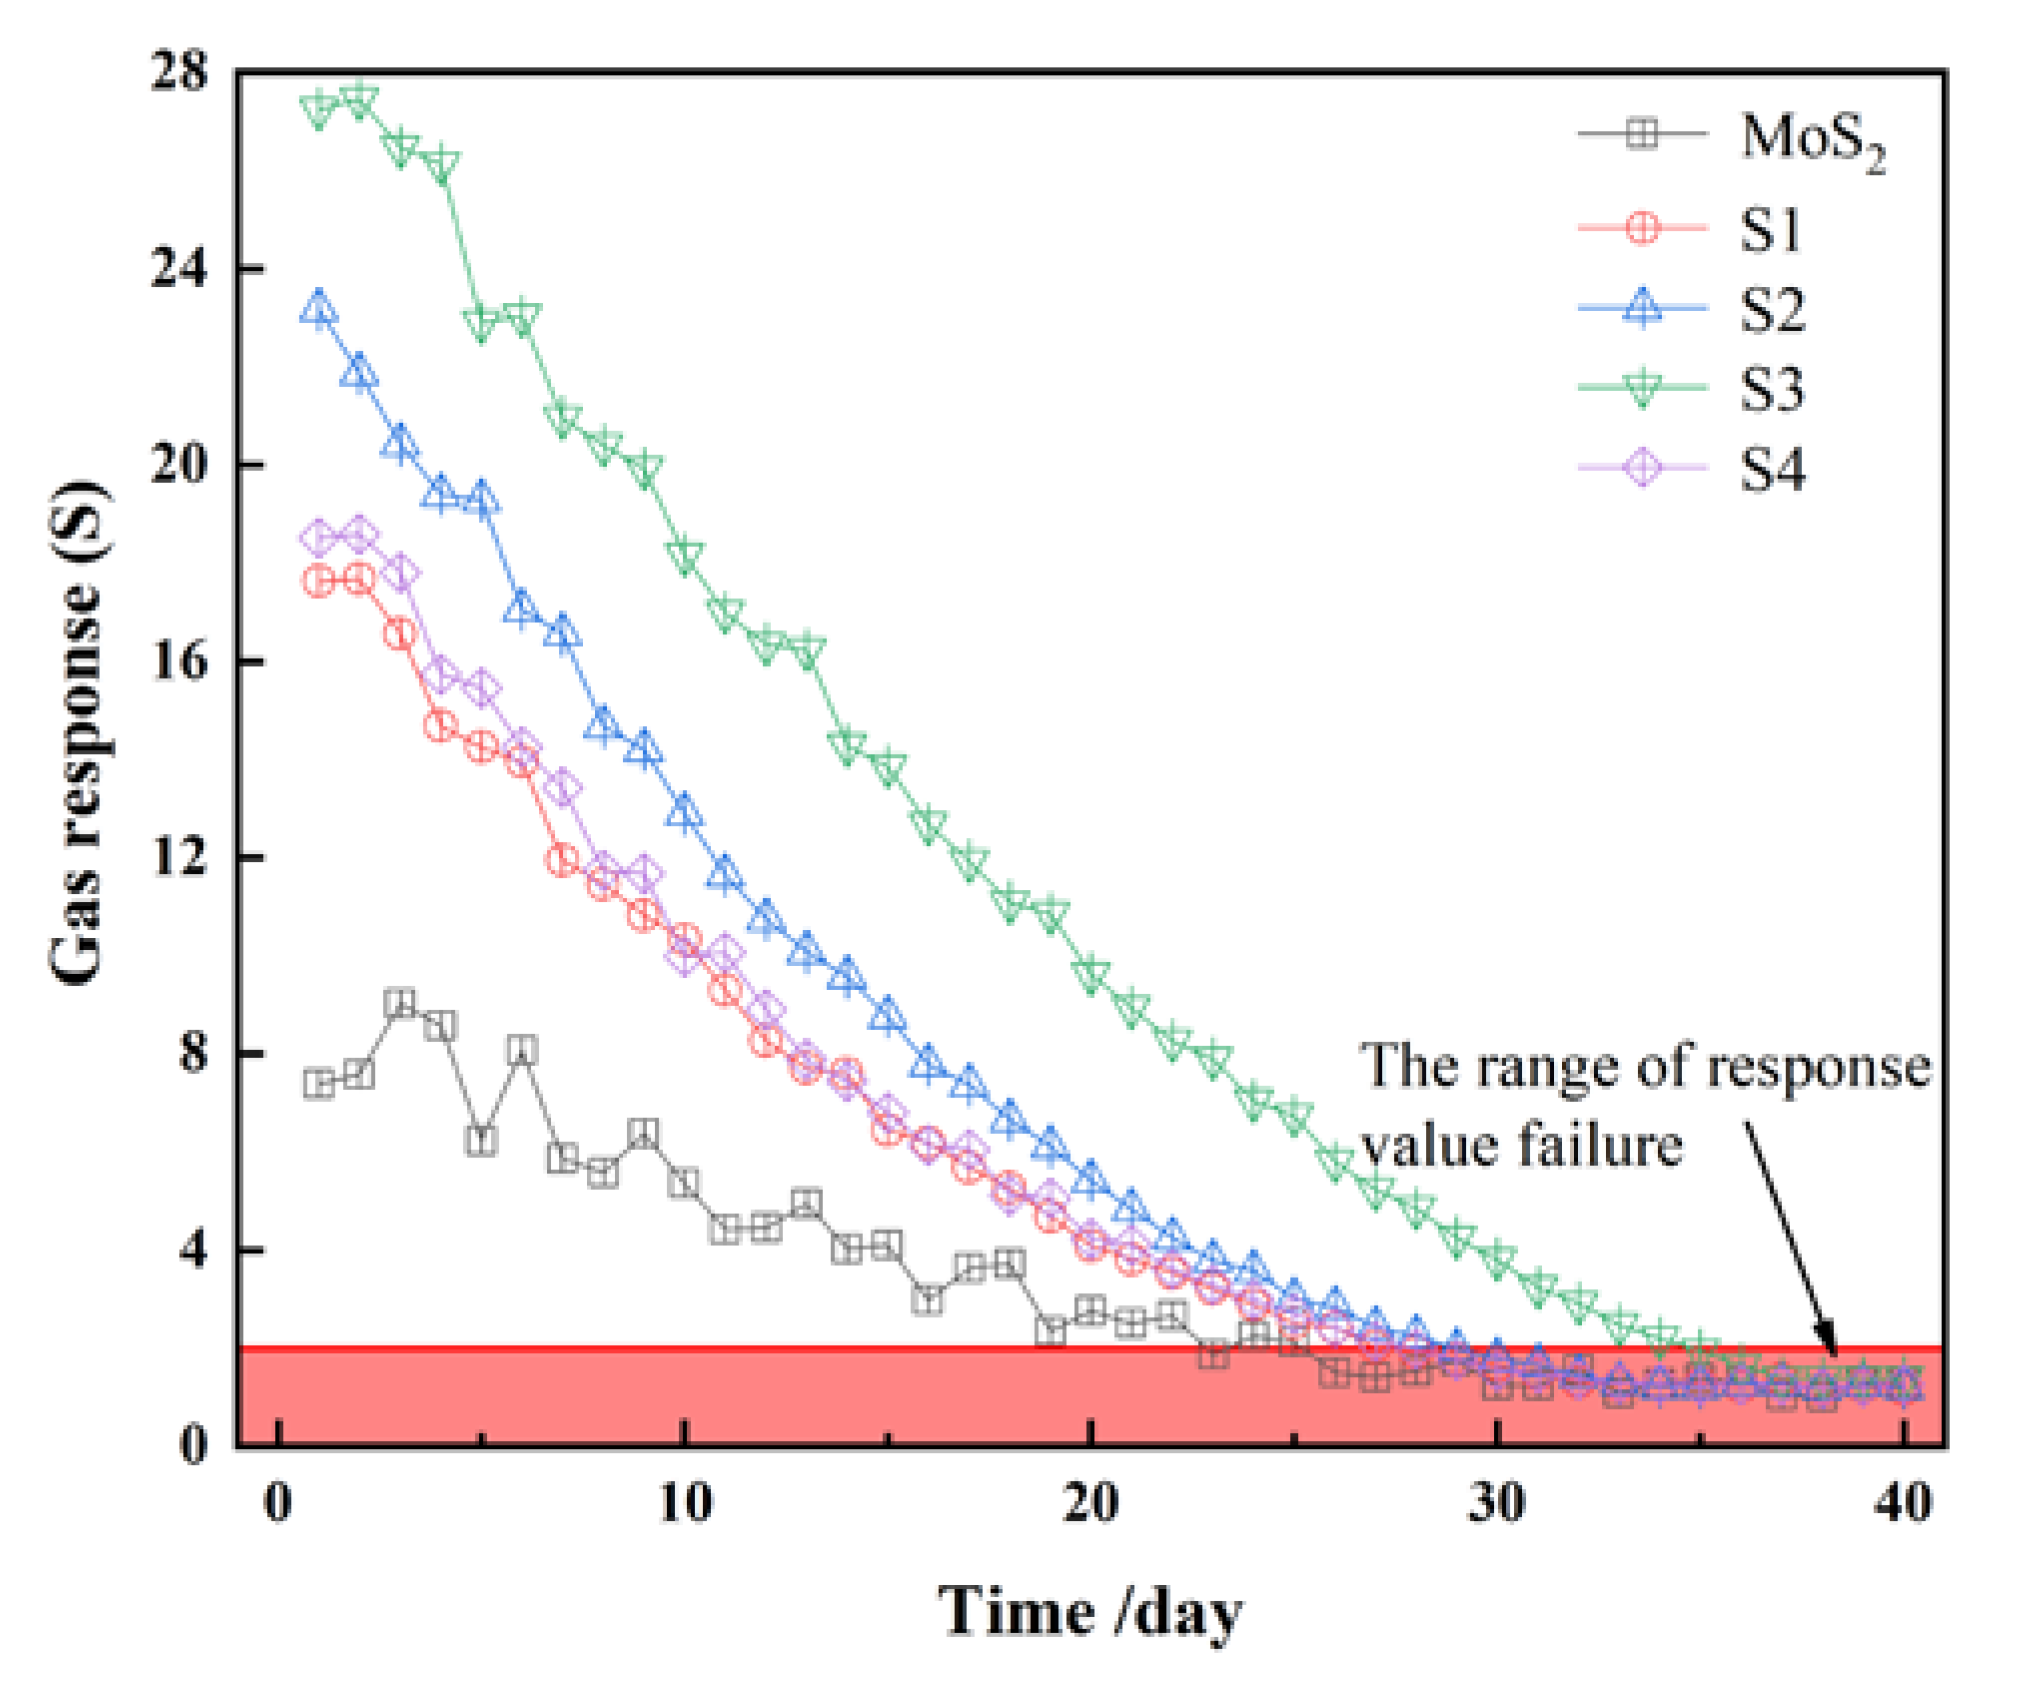
Figure 12 shows the attenuation curve of the gas-sensing response of each material to 15 μL/L C2H2 during the 40-day aging process. The pure MoS2 gas-sensing response value is the smallest. After 24 days of aging, the gas-sensing response drops below 2 and finally jumps between 1 and 1.2. In addition, compared with the composite materials, the decline process of pure MoS2 is not smooth, with a large fluctuation and even a slight increase in the response value after aging. It may be that a few crystals are oxidized during the experimental test, which turns the pure MoS2 into a MoS2-MoO2 composite material and causes an increase in the response value. However, the curves of nanocomposites with a certain proportion of heterojunction structure are no jitter.
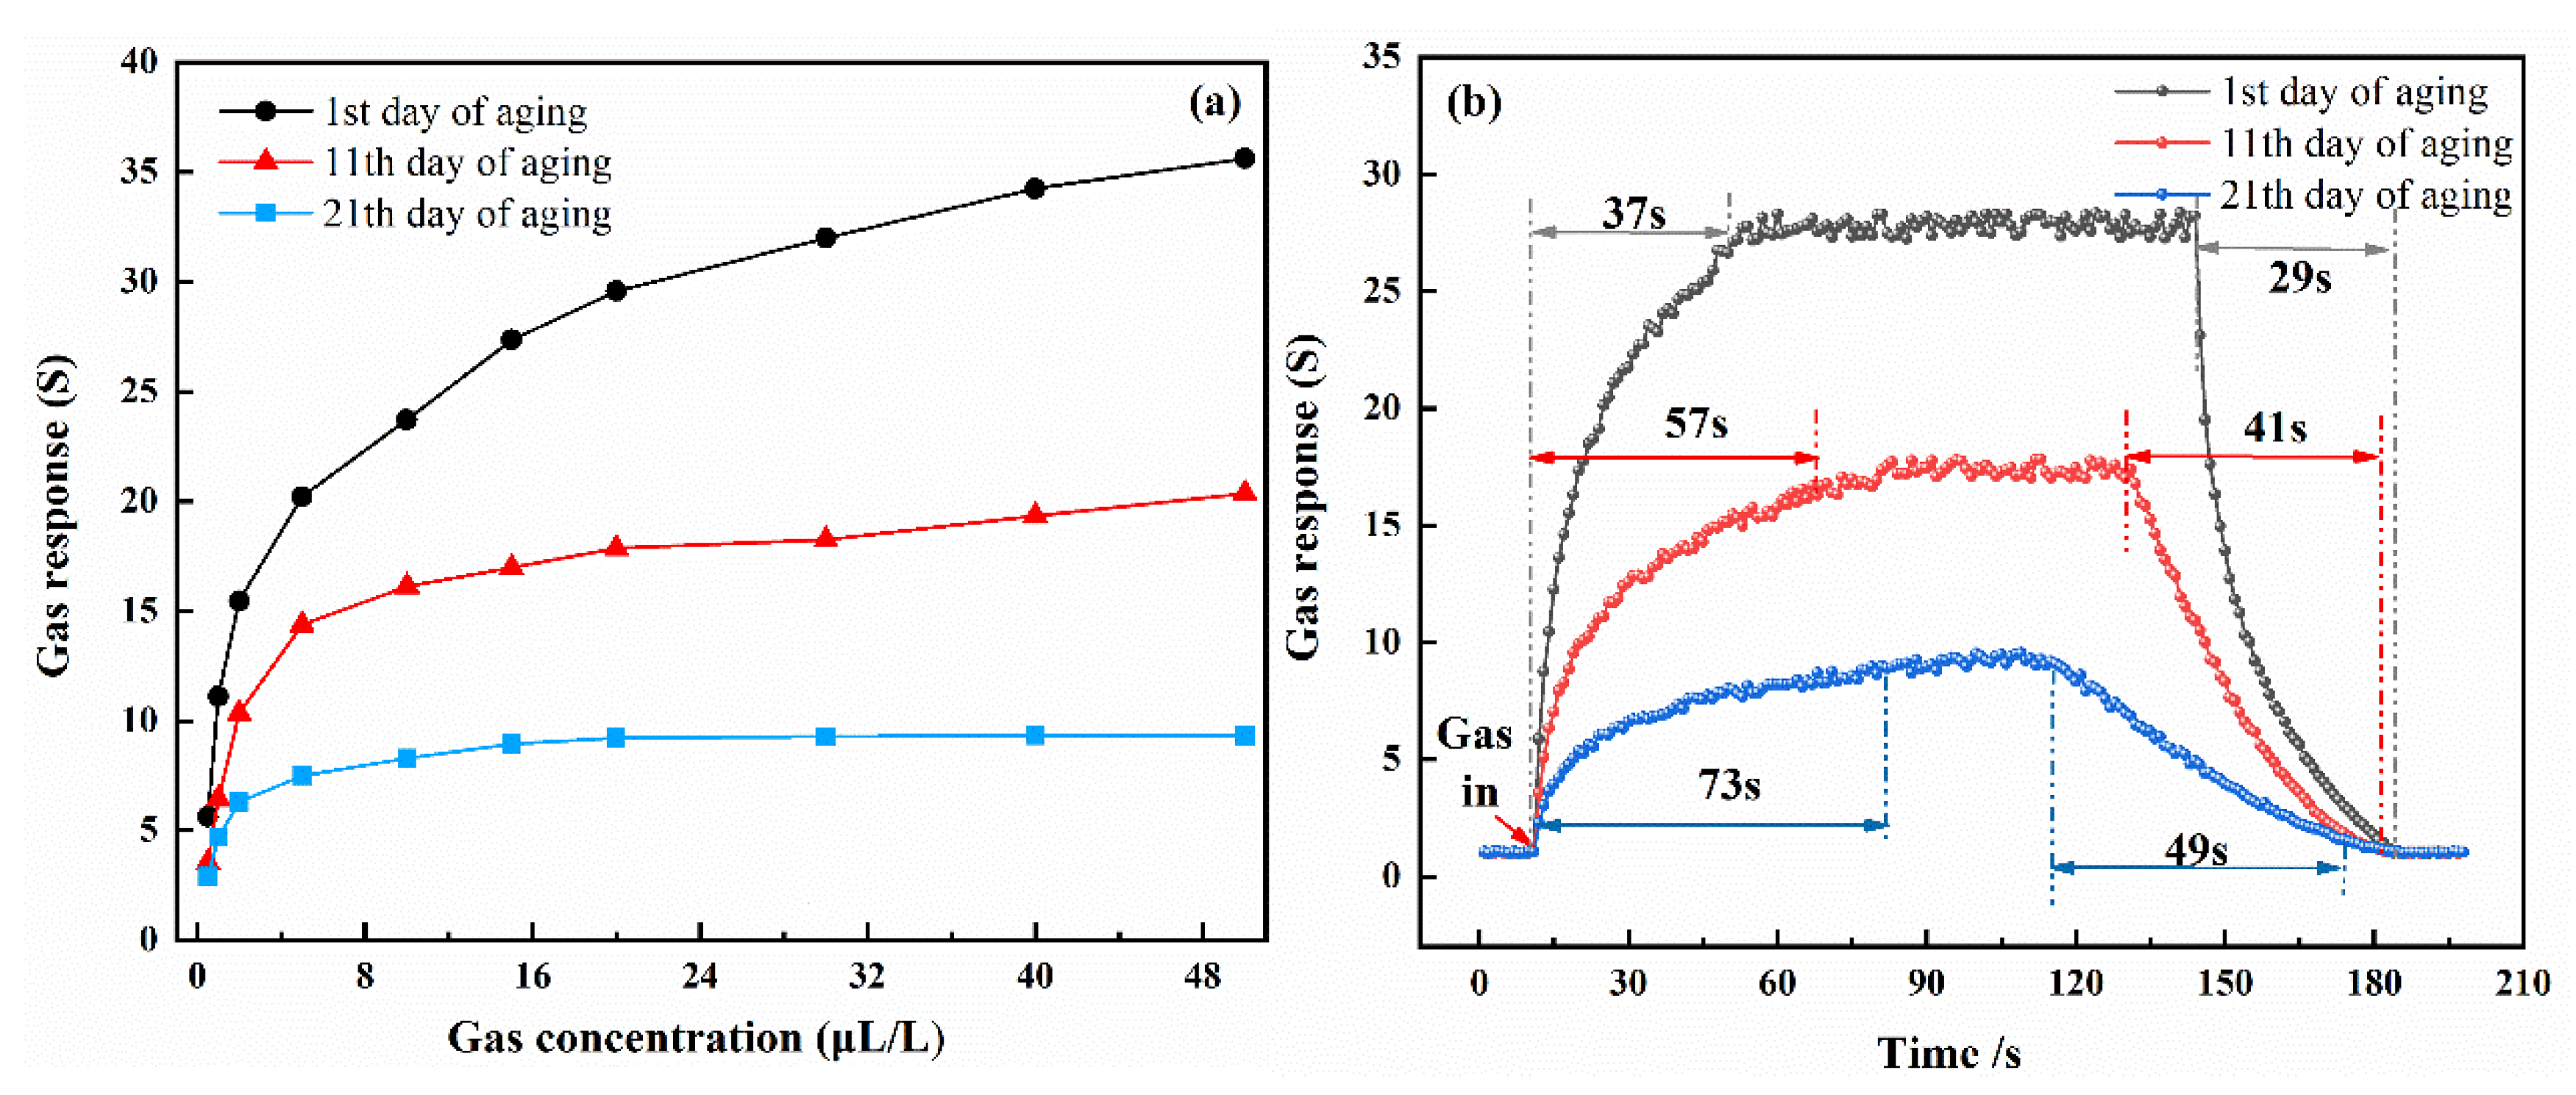
Concentration characteristic curves of sample S3 under different aging days are depicted in Figure 13a. As the aging time increases, the gas-sensing response value also decreases and the attenuation degree is more obvious under high concentration gas. Figure 13b is the dynamic response curve of sample S3 in 15 μL/L C2H2 under different aging days. It can be clearly seen that the response and recovery speed of the material after aging has decreased. The specific response and recovery time are shown in the Figure 13b. It means that the material aging not only causes the attenuation of the response value, but also the response and recovery speed of the material is much slower.

3.3. Gas-Sensing and Aging Mechanism

The sample S3 shows the best gas-sensing performance in all aspects, including response and recovery time, a low temperature, and so on. Meanwhile, sample S1, sample S2 and sample S4 all present better gas-sensing characteristics, and the optimal working temperature of ZnO-MoS2 nanocomposites with four different doping ratios is also lower than the pure MoS2. Therefore, a sensing mechanism should be proposed to give an explanation to the above phenomenon.
Through the above experimental results with bad gas-sensing response to C2H2 gas and the Fermi level close to valence band (EV), it can be drawn that MoS2 performed p-type property [35,36]. When MoS2 is in the air at ambient temperature, oxygen molecules are absorbed on the surface of MoS2 and capture electrons from conduction band (EC) [37,38,39]. The processes of these transformations are as follows (Equations (1)–(4)):
O 2 ( gas ) O 2 ( ads )
O 2 ( ads ) + e O 2 ( ads ) ( T < 100   ° C )
O 2 ( ads ) + e 2 O ( ads ) ( 100 < T < 300   ° C )
O ( ads ) + e O 2 ( ads ) ( T > 300   ° C )
When C2H2 as reducing gas is injected into the sealed vessel, it will react with oxygen ions and release electrons to MoS2.The process is presented below in Equations (5)–(7) [40,41]. It will cause resistance decrease because the electrons were liberated, causing the depletion layer width decrease.
C 2 H 2 ( gas ) + 5 2 O 2 ( ads ) 2 CO 2 + H 2 O + 5 2 e ( T < 100   ° C )
C 2 H 2 ( gas ) + 5 O ( ads ) 2 CO 2 + H 2 O + 5 e ( 100 < T < 300   ° C )
C 2 H 2 ( gas ) + 5 O 2 ( ads ) 2 CO 2 + H 2 O + 10 e ( T > 300   ° C )
For sample S3 gas sensor with optimal performances, some possible reasons will be tried to give as follows. The main reasons are the positive reaction between two sensing materials and p-n heterojunctions formed between MoS2 nanosheets and ZnO nanoparticles. Based on the thermionic conduction mechanism, it can be concluded that electrons with higher energy are easier to move and the holes are prevented migrating from ZnO to MoS2 due to the exsistence of potential barrier [42,43,44,45,46]. So, the barrier height and electrons itself energy will be important decisive elements. When the nanocomposites are in the air, oxygen molecules will grasp electrons from the conduction band of ZnO nanoparticles causing the formation of depletion of ZnO with larger width than pure ZnO [47]. Meanwhile, the number of holes of ZnO nanoparticles will increase. All of these changes will form the barrier height (Figure 14).
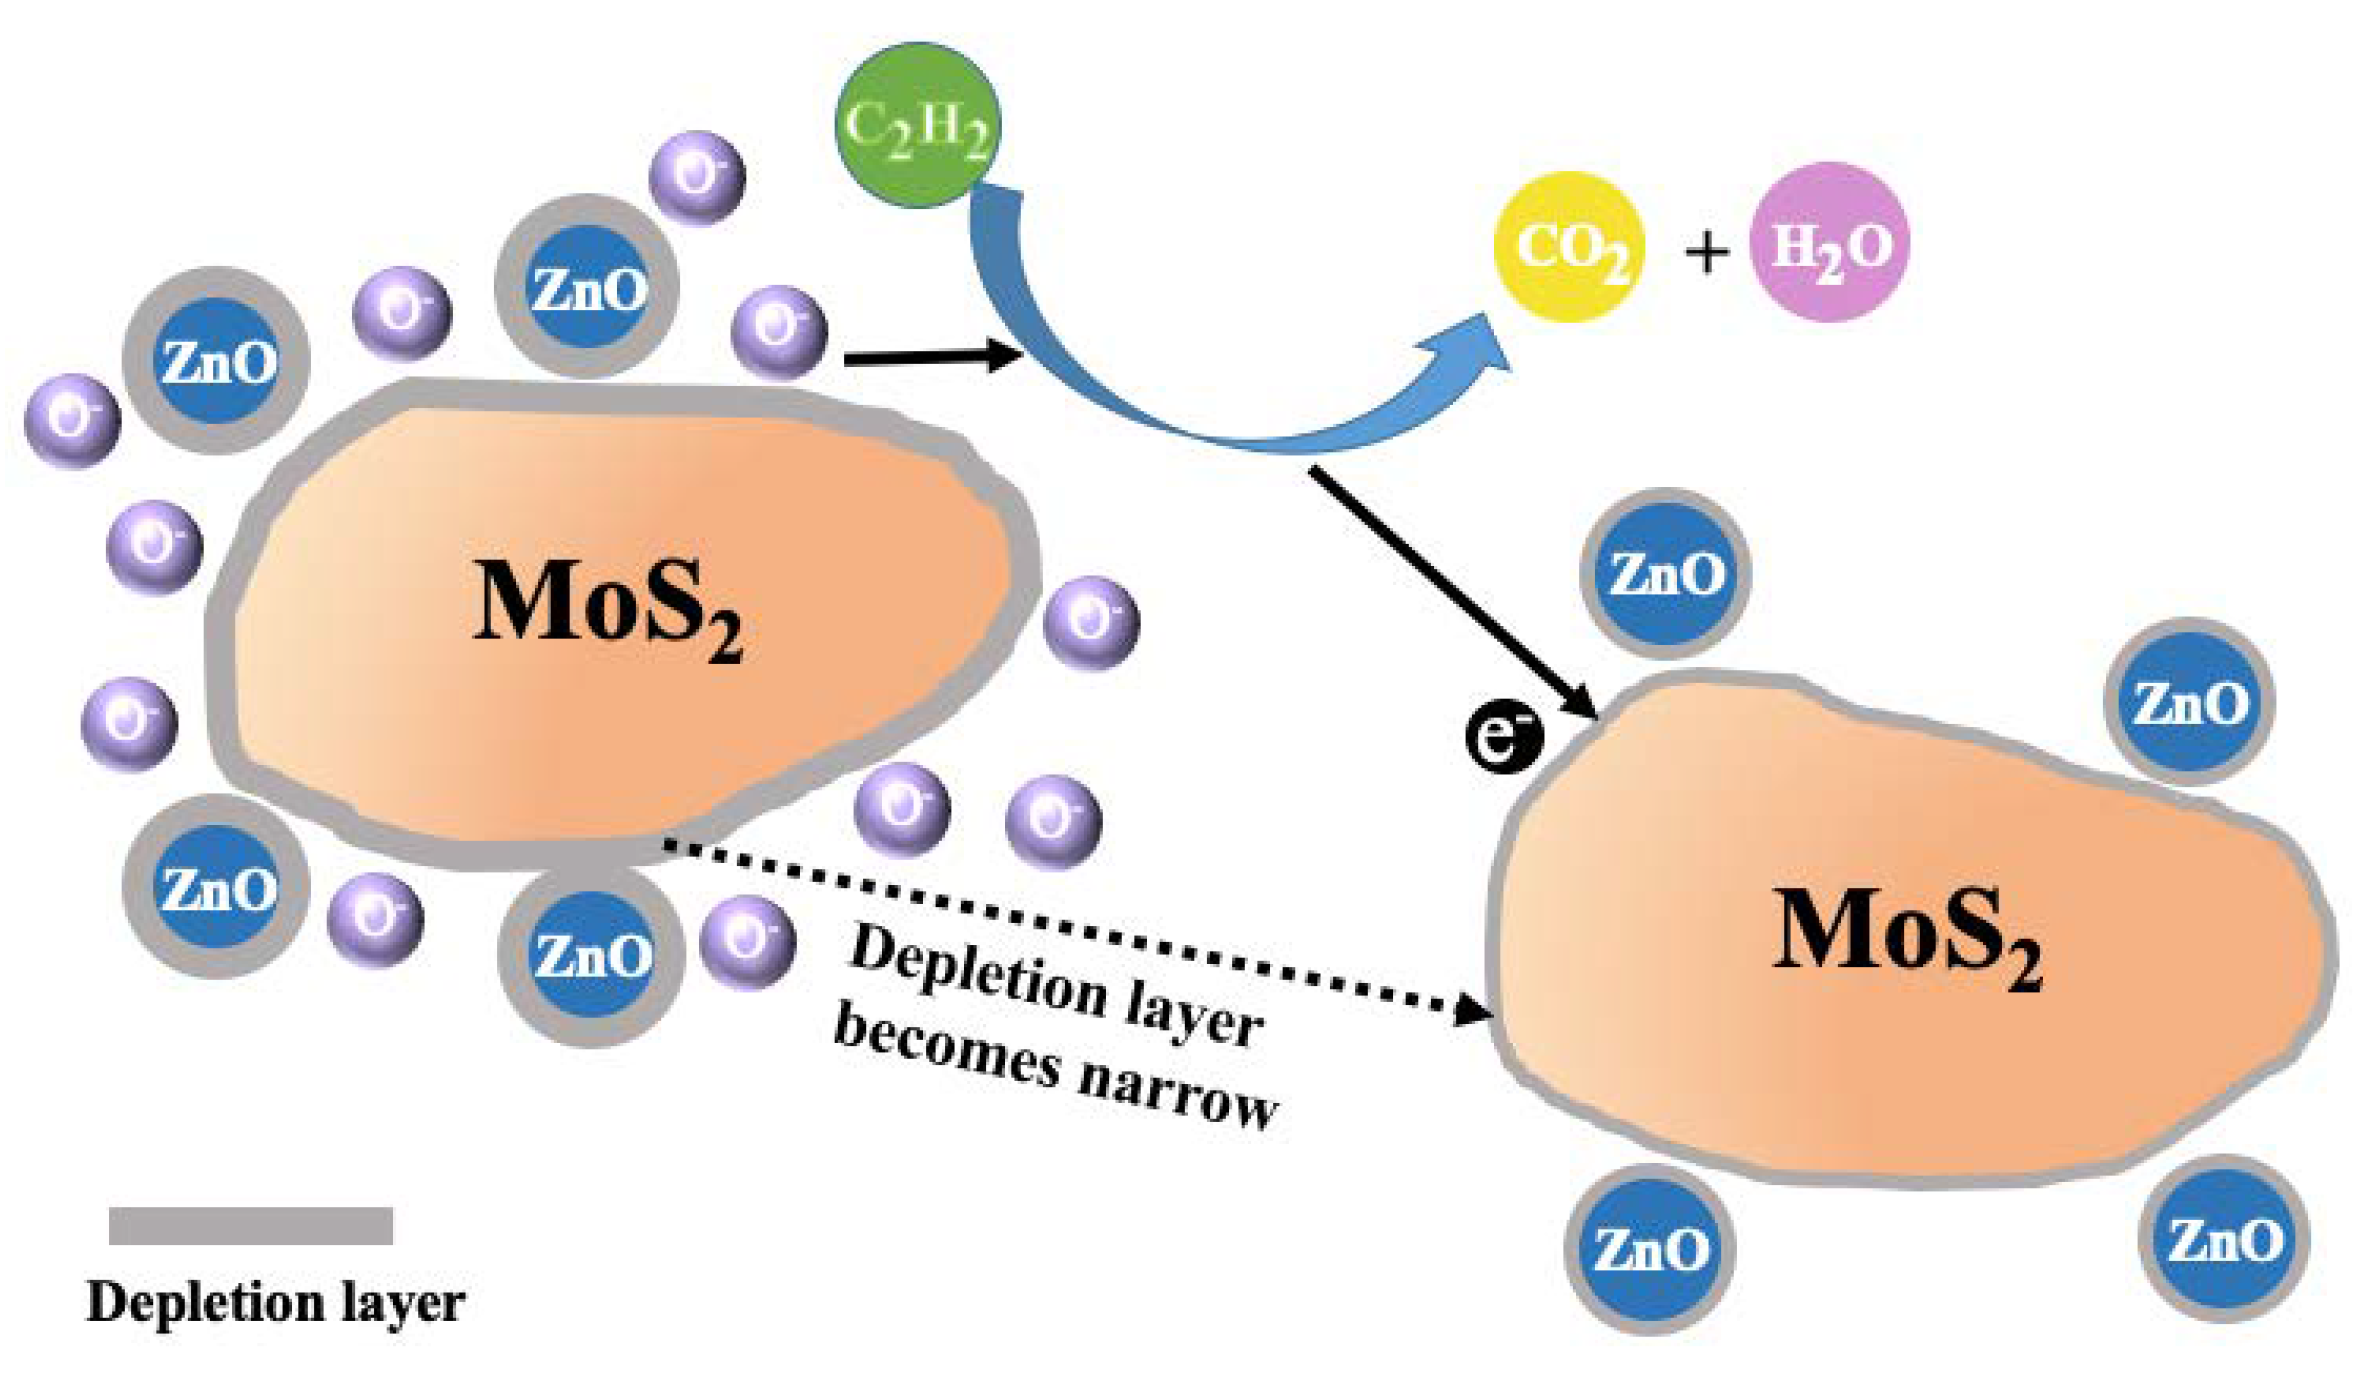
C2H2 will react with oxygen ions and release electrons to the ZnO when nanocomposites are surrounded by C2H2 gas, as illustrated in Figure 15. This will cause the depletion of ZnO decrease and the barrier height reduce pristine level. Because of the huger change in the width of the depletion layer, the response value increases more obviously than that of pure MoS2.

4. Conclusions

The ZnO-MoS2 nanocomposites were prepared by the two-step hydrothermal method and proved by the consequences of SEM, XRD, TEM and XPS. The acetylene sensing performances of ZnO-MoS2 nanocomposites were greatly improved, which exhibited superior repeatability and good long-term stability. Meanwhile, due to the formation of p-n heterojunctions and active interaction, the optimal working temperature of acetylene gas sensors dropped to 70 °C. In addition, ZnO-MoS2 nanocomposites increase the thickness of the depletion layer and increase the resistance change rate after reacting with acetylene. The gas-sensing mechanism can draw the conclusion that the ZnO-MoS2 nanocomposites can reduce the working temperature, thereby delaying the aging.

Author Contributions

S.W., W.C. and J.L. conceived and designed the experiments; Z.S. and H.Z. performed the experiments; S.W. analyzed the data; S.W. wrote the paper. S.W. and W.Z. reviewed and revised the manuscript. All authors have read and agreed to the published version of the manuscript.

Funding

This work was supported by National Key Research and Development Program 2018 YFB2100100.

Acknowledgments

I would like to express my great appreciation to my advisor Weigen Chen, teacher Wen Zeng and all my fellow from my research group.

Conflicts of Interest

The authors declare no conflict of interest.

References

  1. Regnima, G.O.; Betié, A.; Koffi, T. Monitoring power transformers oils deterioration using structured laser illumination planar imaging. Measurement 2017, 113, 38–45. [Google Scholar]
  2. Arabul, A.Y.; Kumru, C.F.; Arabul, F.K. Experimental investigation on creep characteristic of the spacer between winding turns of power transformers. Trans. Inst. Meas. Control 2019, 153, 1167–1175. [Google Scholar]
  3. Liu, Y.; Li, H.; Yu, Z. Reliability evaluation method for AC/DC hybrid distribution power network considering cascaded multiport power electronic transformer. IET Gener. Transm. Distrib. 2019, 13, 5357–5364. [Google Scholar]
  4. Ding, J.; Li, X.; Cao, J. New sensor for gases dissolved in transformer oil based on solid oxide fuel cell. Sens. Actuators B Chem. 2014, 202, 232–239. [Google Scholar]
  5. Kunicki, M.; Wotzka, D. A classification method for select defects in power transformers based on the acoustic signals. Sensors 2019, 19, 564577. [Google Scholar]
  6. Fei, S.W.; Wang, M.J.; Miao, Y.B. Particle swarm optimization-based support vector machine for forecasting dissolved gases content in power transformer oil. Energy Convers. Manag. 2009, 50, 1604–1609. [Google Scholar]
  7. Chatterjee, A.; Bhattacharjee, P.; Roy, N.K.; Kumbhakar, P. Usage of nanotechnology based gas sensor for health assessment and maintenance of transformers by DGA method. Int. J. Electr. Power Energy Syst. 2013, 45, 137–141. [Google Scholar]
  8. Meira, M.; Ruschetti, C.; Alvarez, R. Dissolved gas analysis differences between natural esters and mineral oils used in power transformers: A review. IET Gener. Transm. Distrib. 2019, 13, 5441–5448. [Google Scholar]
  9. Memmel, E.; Peters, D.; Voelker, R. Simulation of vertical power flow at MV/HV transformers for quantification of curtailed renewable power. IET Renew. Power Gener. 2019, 13, 3071–3079. [Google Scholar]
  10. Song, L.; Yue, H.; Li, H. Hierarchical porous ZnO microflowers with ultra-high ethanol gas-sensing at low concentration. Chem. Phys. Lett. 2018, 699, 1–7. [Google Scholar]
  11. Lu, G.; Xu, J.; Sun, J. UV-enhanced room temperature NO2 sensor using ZnO nanorods modified with SnO2 nanoparticles. Sens. Actuators B Chem. 2012, 162, 82–88. [Google Scholar] [CrossRef]
  12. Sun, J.; Xu, J.; Yu, Y. UV-activated room temperature metal oxide based gas sensor attached with reflector. Sens. Actuators B Chem. 2012, 169, 291–296. [Google Scholar] [CrossRef]
  13. Fan, S.W.; Srivastava, A.K.; Dravid, V.P. UV-activated room-temperature gas sensing mechanism of polycrystalline ZnO. Appl. Phys. Lett. 2009, 95, 142106. [Google Scholar] [CrossRef]
  14. Matsuura, Y.; Takahata, K. Stabilization of SnO2 sintered gas sensors. Sens. Actuators B 1991, 5, 205–209. [Google Scholar] [CrossRef]
  15. Korotcenkov, G.; Cornet, A.; Rossinyol, E.; Arbiol, J.; Brinzari, V.; Blinov, Y. Faceting characterization of tin dioxide nanocrystals deposited by spray pyrolysis from stannic chloride water solution. Thin Solid Films 2004, 471, 310–319. [Google Scholar] [CrossRef]
  16. Zhang, J.; Liu, X.; Neri, G. Nanostructured Materials for Room-Temperature Gas Sensors. Adv. Mater. 2016, 28, 795–831. [Google Scholar] [CrossRef] [PubMed]
  17. Smulko, J.M.; Trawka, M.; Granqvist, C.G. New approaches for improving selectivity and sensitivity of resistive gas sensors: A review. Sens. Rev. 2015, 35, 340–347. [Google Scholar]
  18. Arya, S.K.; Subramanian, K.; Hayde, S. Advances in materials for room temperature hydrogen sensors. Analyst 2012, 137, 2743–2756. [Google Scholar] [CrossRef]
  19. Dey, A. Semiconductor metal oxide gas sensors: A review. Mater. Sci. Eng. 2018, 229, 206–217. [Google Scholar] [CrossRef]
  20. Akinwande, D.; Huyghebaert, C.; Wang, C.H. Graphene and two-dimensional materials for silicon technology. Nature 2019, 573, 507–518. [Google Scholar] [CrossRef]
  21. Gong, S.H.; Alpeggiani, F.; Sciacca, B. Nanoscale chiral valley-photon interface through optical spin-orbit coupling. Science 2018, 359, 443–455. [Google Scholar] [CrossRef] [PubMed] [Green Version]
  22. Ji, D.; Cai, S.; Paudel, T.R. Freestanding crystalline oxide perovskites down to the monolayer limit. Nature 2019, 570, 87–101. [Google Scholar] [CrossRef] [PubMed]
  23. Jiang, Y.; Chen, Z.; Hang, Y. Electron ptychography of 2D materials to deep sub-angstrom resolution. Nature 2018, 559, 343–355. [Google Scholar] [CrossRef] [PubMed]
  24. Jin, C.; Kim, J.; Utama, M.I.B. Imaging of pure spin-valley diffusion current in WS2-WSe2 heterostructures. Science 2018, 360, 893–896. [Google Scholar] [CrossRef] [Green Version]
  25. Wang, L.; Wang, S.; Wang, Y. Synthesis of hierarchical SnO2 nanostructures assembled with nanosheets and their improved gas sensing properties. Sens. Actuators B Chem. 2013, 188, 85–93. [Google Scholar] [CrossRef]
  26. Yan, A.; Xie, C.; Zeng, D. Synthesis, formation mechanism and sensing properties of WO3 hydrate nanowire netted-spheres. Mater. Res. Bull. 2010, 45, 1541–1547. [Google Scholar] [CrossRef]
  27. Wu, W.; Tang, S.; Gu, J. Realizing semiconductor to metal transition in graphitic ZnO and MoS2 nanocomposite with external electric field. Rsc. Adv. 2015, 5, 99153–99163. [Google Scholar] [CrossRef]
  28. Kumar, R.; Goel, N.; Mishra, M. Growth of MoS2-MoO3 Hybrid Microflowers via Controlled Vapor Transport Process for Efficient Gas Sensing at Room Temperature. Adv. Mater. Interfaces 2018, 5, 1356–1365. [Google Scholar] [CrossRef]
  29. Korotcenkov, G.; Cho, B.K. Metal oxide composites in conductometric gas sensors: Achievements and challenges. Sens. Actuators B Chem. 2017, 244, 182–210. [Google Scholar] [CrossRef]
  30. Gu, C.; Huang, J.; Wu, Y. Preparation of porous flower-like ZnO nanostructures and their gas-sensing property. J. Alloys Compd. 2011, 509, 4499–4504. [Google Scholar] [CrossRef]
  31. Chen, Y.; Li, X.G.; Li, X.X. UV activated hollow ZnO microspheres for selective ethanol sensors at low temperatures. Sens. Actuators B Chem. 2016, 232, 158–164. [Google Scholar] [CrossRef]
  32. Kelly, A.G.; Hallam, T.; Backes, C. All-printed thin-film transistors from networks of liquid-exfoliated nanosheets. Science 2017, 356, 69–72. [Google Scholar] [CrossRef] [PubMed]
  33. Lien, D.H.; Uddin, S.Z.; Yeh, M. Device technology electrical suppression of all nonradiative recombination pathways in monolayer semiconductors. Science 2019, 364, 468–477. [Google Scholar] [CrossRef] [PubMed] [Green Version]
  34. Xiang, R.; Inoue, T.; Zheng, Y. One-dimensional van der Waals heterostructures. Science 2020, 367, 537–542. [Google Scholar] [CrossRef] [Green Version]
  35. Tammanoon, N.; Wisitsoraat, A.; Sriprachuabwong, C. Ultra-Sensitive NO2 Sensor Based on Ohmic Metal-Semiconductor Interfaces of Electrolytically Exfoliated Graphene/Flame-Spray-Made SnO2 Nanoparticles Composite Operating at Low Temperatures. ACS Appl. Mater. Interface 2015, 7, 24338–24352. [Google Scholar] [CrossRef]
  36. Garg, R.; Dutta, N.; Choudhury, N. Work Function Engineering of Graphene. Nanomaterials 2014, 4, 267–300. [Google Scholar] [CrossRef] [Green Version]
  37. Quang, P.L.; Cuong, N.D.; Hoa, T.T. Simple post-synthesis of mesoporous p-type Co3O4 nanochains for enhanced H2S gas sensing performance. Sens. Actuators B Chem. 2018, 270, 158–166. [Google Scholar] [CrossRef]
  38. Urasinskawojcik, B.; Vincent, T.A.; Chowdhury, M.F. Ultrasensitive WO3 gas sensors for NO2 detection in air and low oxygen environment. Sens. Actuators B Chem. 2017, 239, 1051–1059. [Google Scholar] [CrossRef]
  39. Korotcenkov, G.; Boris, I.; Brinzari, V.; Han, S.H. The role of doping effect on the response of SnO2-based thin film gas sensors: Analysis based on the results obtained for Co-doped SnO2 films deposited by spray pyrolysis. Sens. Actuators B Chem. 2013, 182, 112–124. [Google Scholar] [CrossRef]
  40. Zhang, D.; Liu, A.; Chang, H. Room-temperature high-performance acetone gas sensor based on hydrothermal synthesized SnO2-reduced graphene oxide hybrid composite. RSC Adv. 2015, 83, 3016–3022. [Google Scholar] [CrossRef]
  41. Zhang, Y.B.; Yin, J.; Li, L. Enhanced ethanol gas-sensing properties of flower-like p-CuO/n-ZnO heterojunction nanorods. Sens. Actuators B Chem. 2014, 202, 500–507. [Google Scholar] [CrossRef]
  42. Acharya, S.; Bangera, K.V.; Shivakumar, G.K. Conduction Mechanism in n-CdSe/p-ZnTe Heterojunction. J. Electron. Mater. 2016, 45, 3324–3331. [Google Scholar] [CrossRef]
  43. Bai, S.; Liu, J.; Guo, J. Facile preparation of SnO2/NiO composites and enhancement of sensing performance to NO2. Sens. Actuators B Chem. 2017, 249, 22–29. [Google Scholar] [CrossRef]
  44. Hu, J.; Yang, J.; Wang, W.; Xue, Y.; Sun, Y.; Li, P.; Lian, K.; Zhang, W.; Chen, L.; Shi, J.; et al. Synthesis and gas sensing properties of NiO/SnO2 hierarchical structures toward ppb-level acetone detection. Mater. Res. Bull. 2018, 102, 294–303. [Google Scholar] [CrossRef]
  45. Ju, D.; Xu, H.; Xu, Q. High triethylamine-sensing properties of NiO/SnO2 hollow sphere P–N heterojunction sensors. Sens. Actuators B Chem. 2015, 215, 39–44. [Google Scholar] [CrossRef]
  46. He, J.; Jiao, W.; Zhang, L. Preparation and gas-sensing performance of SnO2/NiO composite oxide synthesized by microwave-assisted liquid phase deposition. Particuology 2018, 41, 118–125. [Google Scholar] [CrossRef]
  47. Zhu, L.; Li, Y.; Zeng, W. Enhanced ethanol sensing and mechanism of Cr-doped ZnO nanorods: Experimental and computational study. Ceram. Int. 2017, 43, 14873–14879. [Google Scholar] [CrossRef]
Figure 1. (a) Planar sensor substrate construction. (b) Sensor base construction.
Nanomaterials 10 01902 g001
Figure 2. Gas-sensing test flow diagram.
Nanomaterials 10 01902 g002
Figure 3. Preprocessing time curve of S3 composite material at 15 μL/L C2H2.
Nanomaterials 10 01902 g003
Figure 4. (a) X-ray diffraction (XRD) data of MoS2 and (b) ZnO-MoS2 with different composite ratios.
Nanomaterials 10 01902 g004
Figure 5. (a) Scanning electron microscopy (SEM) of pure MoS2, (b) sample S1, (c) sample S2, (d) sample S3, (e) sample S4.
Nanomaterials 10 01902 g005
Figure 6. (a) Transmission electron microscopy (TEM) of ZnO-MoS2 nanocomposite S3. (b) HRTEM of MoS2 and (c) ZnO particles
Nanomaterials 10 01902 g006
Figure 7. X-ray photoelectron spectroscopy (XPS) data graph in ZnO-MoS2 nanocomposite in S3: (a) all elements spectrum; (b) Mo 3 d spectrum; (c) S 2 p spectrum; (d) Zn 2 p spectrum; (e) O 1 s spectrum.
Nanomaterials 10 01902 g007aNanomaterials 10 01902 g007b
Figure 8. Temperature characteristic curve of gas-sensing material to 15 μL/L C2H2.
Nanomaterials 10 01902 g008
Figure 9. Concentration characteristic curve of gas sensitive material to C2H2.
Nanomaterials 10 01902 g009
Figure 10. (a) Dynamic response–recovery characteristic curve of each gas-sensing material to 15 μL/L C2H2. (b) Repeatability experiment of S3 composite material.
Nanomaterials 10 01902 g010
Figure 11. (a) SEM of S3 composite material without aging and (b) aged for 20 days.
Nanomaterials 10 01902 g011
Figure 12. Gas-sensing response curve of each gas-sensing material during the 40-day aging process.
Nanomaterials 10 01902 g012
Figure 13. (a) Concentration characteristic curves of sample S3 under different aging time. (b) Dynamic response–recovery characteristic curve of S3 sample under different aging time.
Nanomaterials 10 01902 g013
Figure 14. (a) Schematic diagram of the energy band positions between MoS2 and ZnO before and (b) after contacting.
Nanomaterials 10 01902 g014
Figure 15. Schematic diagrams of surface sensing reaction of the ZnO-MoS2 nanocomposites sensor exposure C2H2 gas.
Nanomaterials 10 01902 g015