


Development of Nanocomposite Microspheres for Nasal Administration of Deferiprone in Neurodegenerative Disorders

 ,
,  ,
,  ,
,  and
and 
Abstract
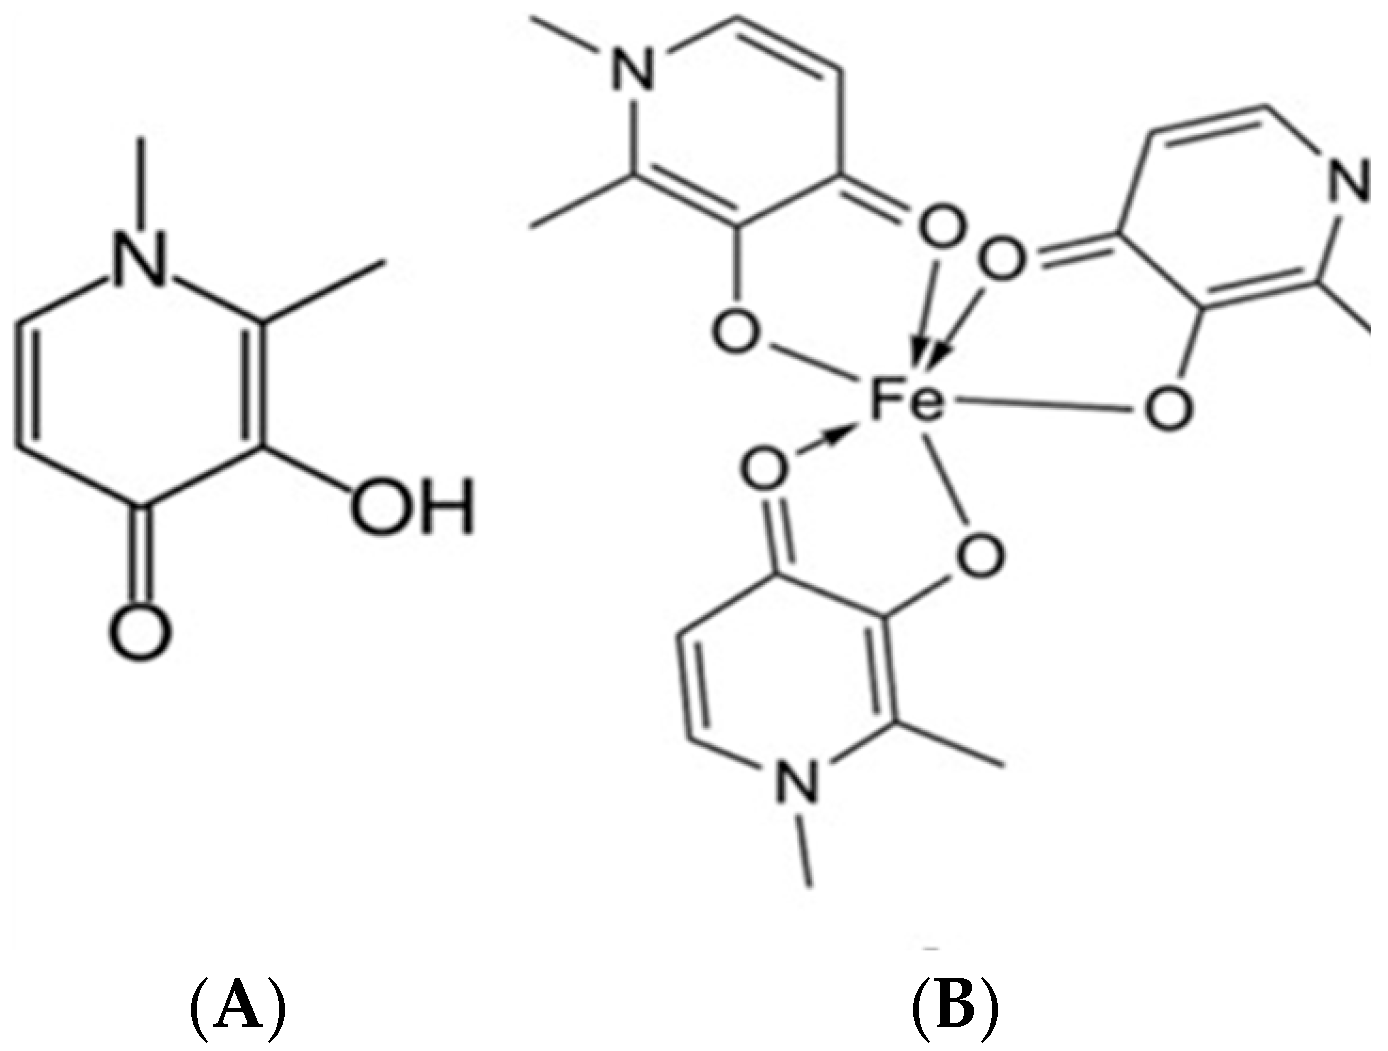
1. Introduction
2. Materials and Methods
2.1. Materials
2.2. Methods
2.2.1. Nanoparticles (NP) Preparation
2.2.2. Preparation of Nanocomposite Microspheres
2.3. Characterization Techniques
2.3.1. Particle Size Analysis, Size Distribution, and Zeta Potential
2.3.2. Scanning Electron Microscopy (SEM)
2.3.3. Transmission Electron Microscopy (TEM)
2.3.4. Fourier-Transform Infrared Spectroscopy (FTIR)
2.3.5. Differential Scanning Calorimetry (DSC)
2.3.6. Production Yield
2.3.7. Estimation of Drug Loading (DL) and Entrapment Efficiency (EE)
2.3.8. In Vitro Drug Release Studies and Release Kinetics
2.3.9. In Vitro Determination of Fe-Chelating Activity of Deferiprone Included in Nanocomposite Microparticles
2.3.10. Determination of the Ability of DFP-Loaded Nanoparticles to Bind Human Serum Albumin (HSA)
2.3.11. Mucoadhesive Ability of the Nanocomposite Microspheres
Statistical Analysis and Processing of Experimental Data from the Mucoadhesive Test and Fe-Chelating Activity
3. Results and Discussion
3.1. Preparation of Poly-ε-Caprolactone Nanoparticles by Double Emulsion/Solvent Evaporation Technique
3.2. Preparation and Characterization of Deferiprone-Loaded Poly-ε-Caprolactone Nanoparticles
3.2.1. Drug Loading and Entrapment Efficiency
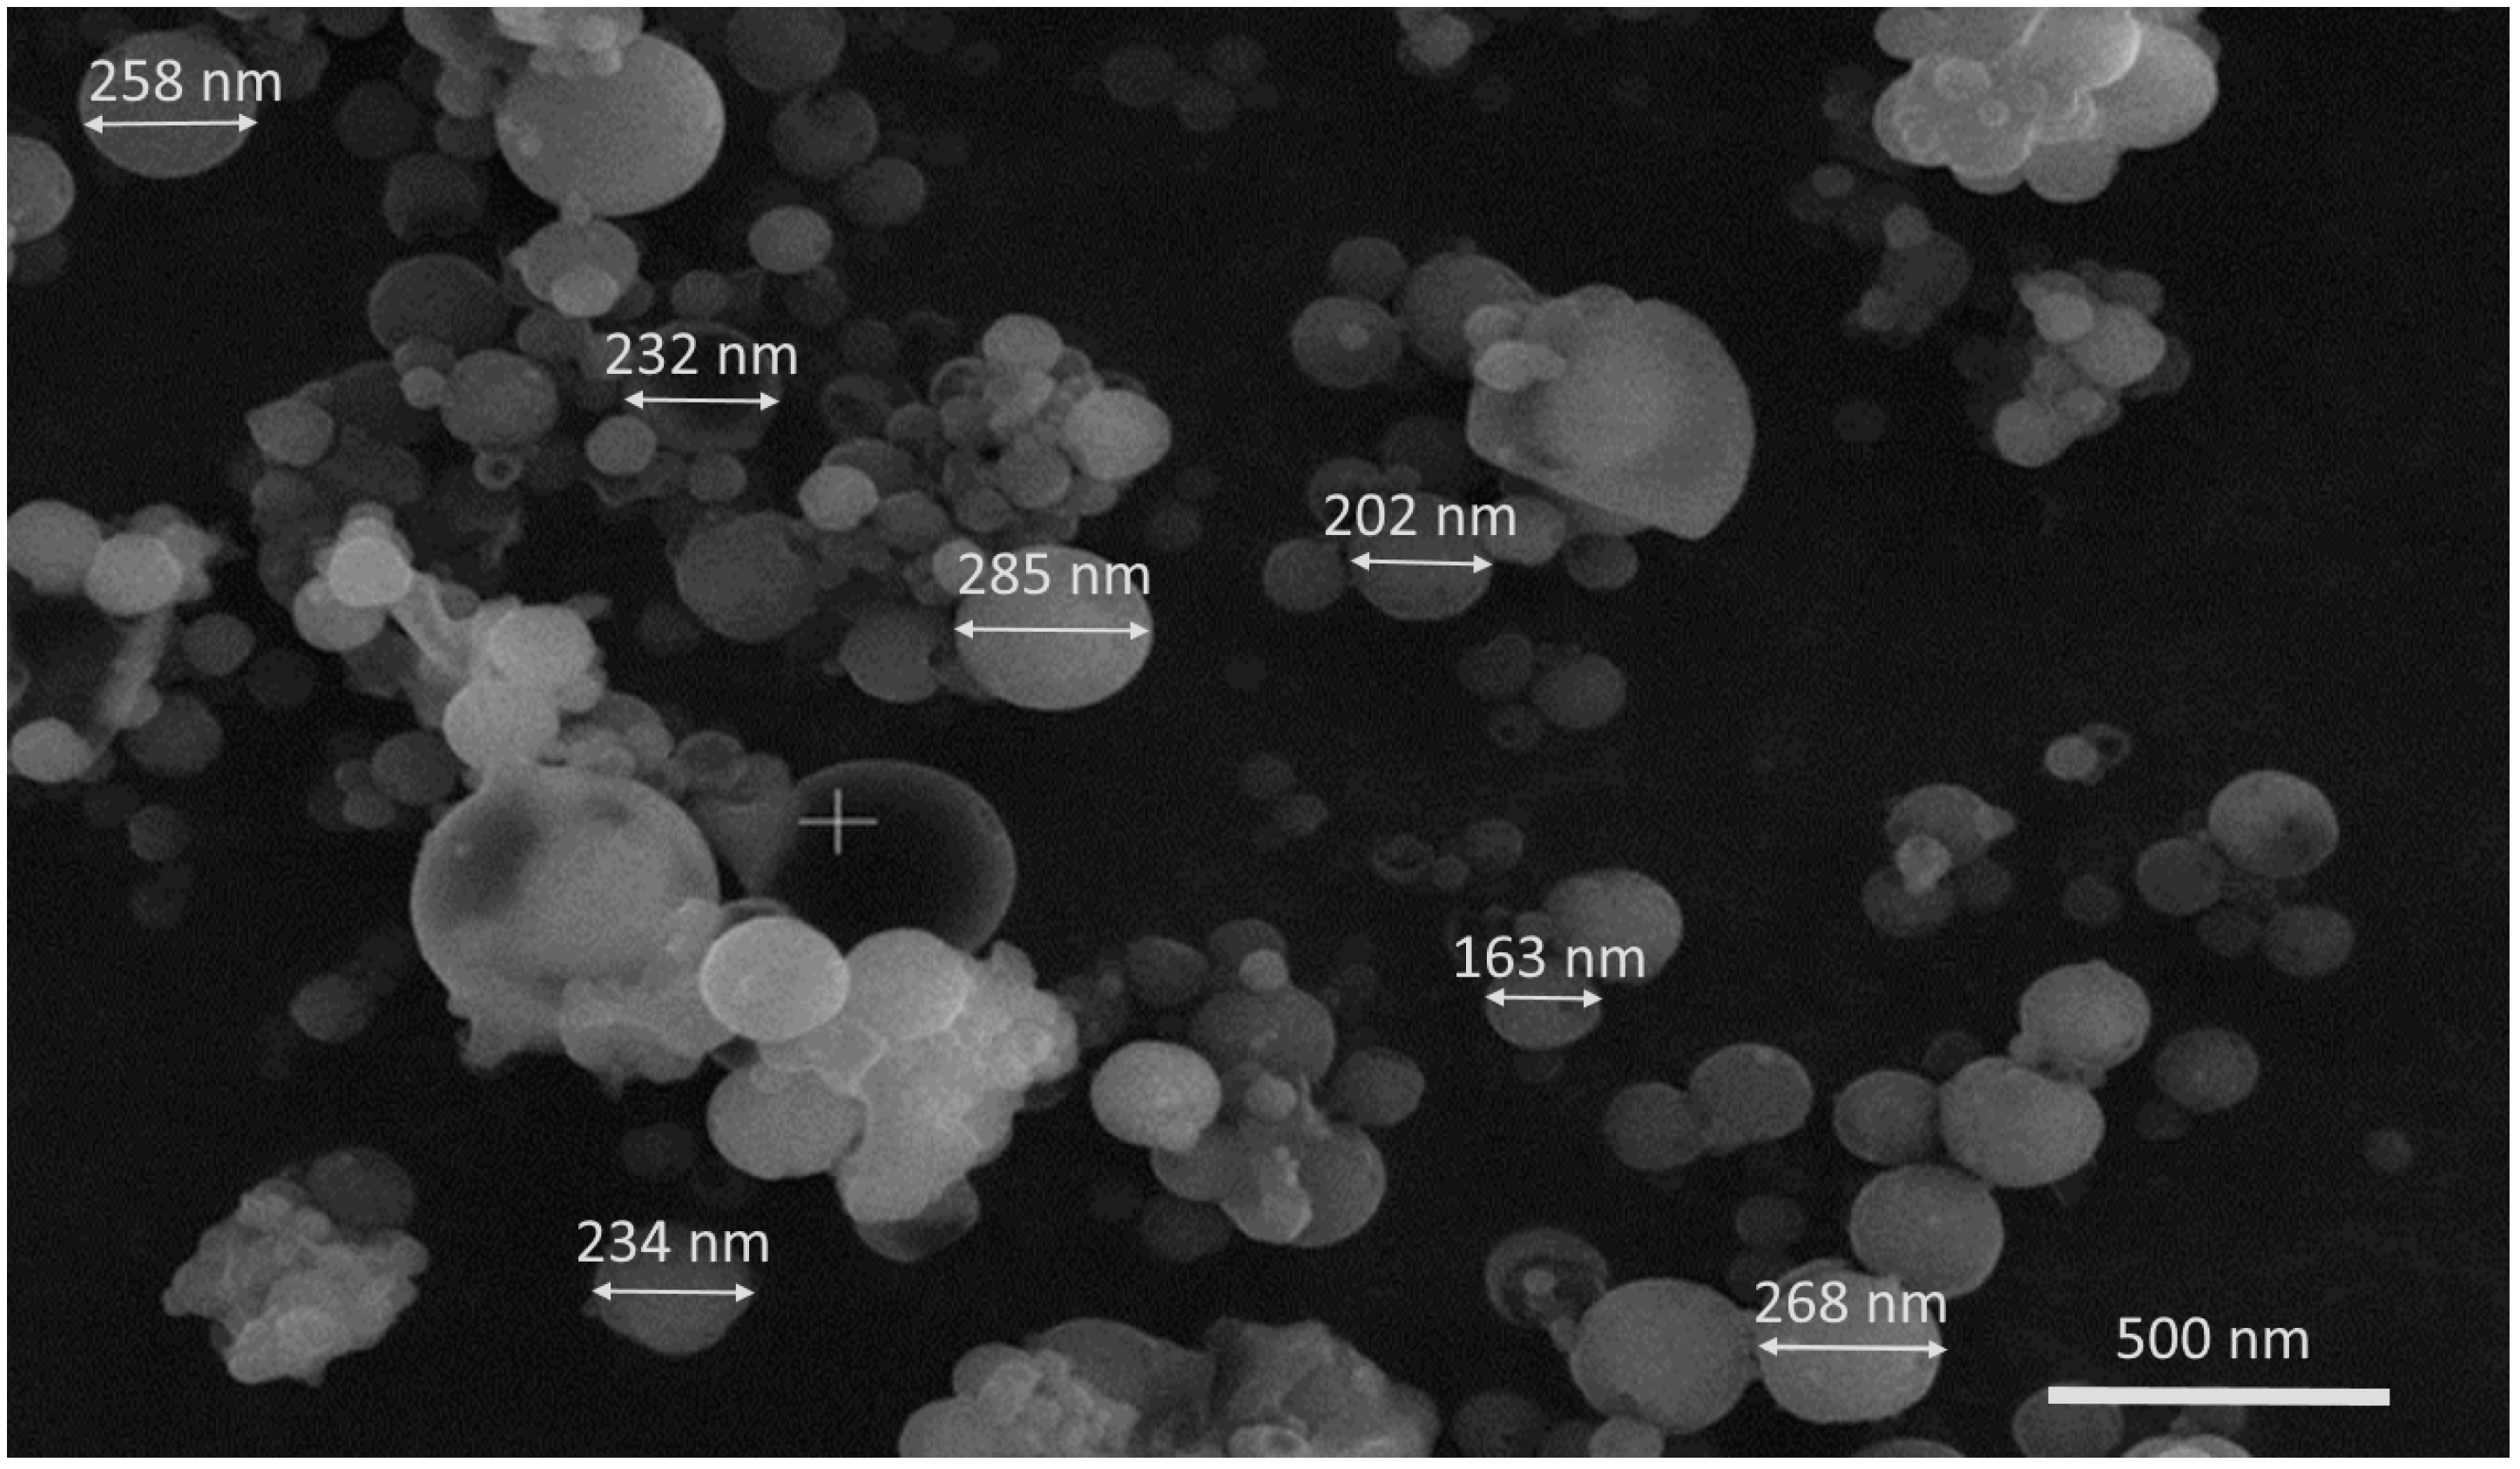
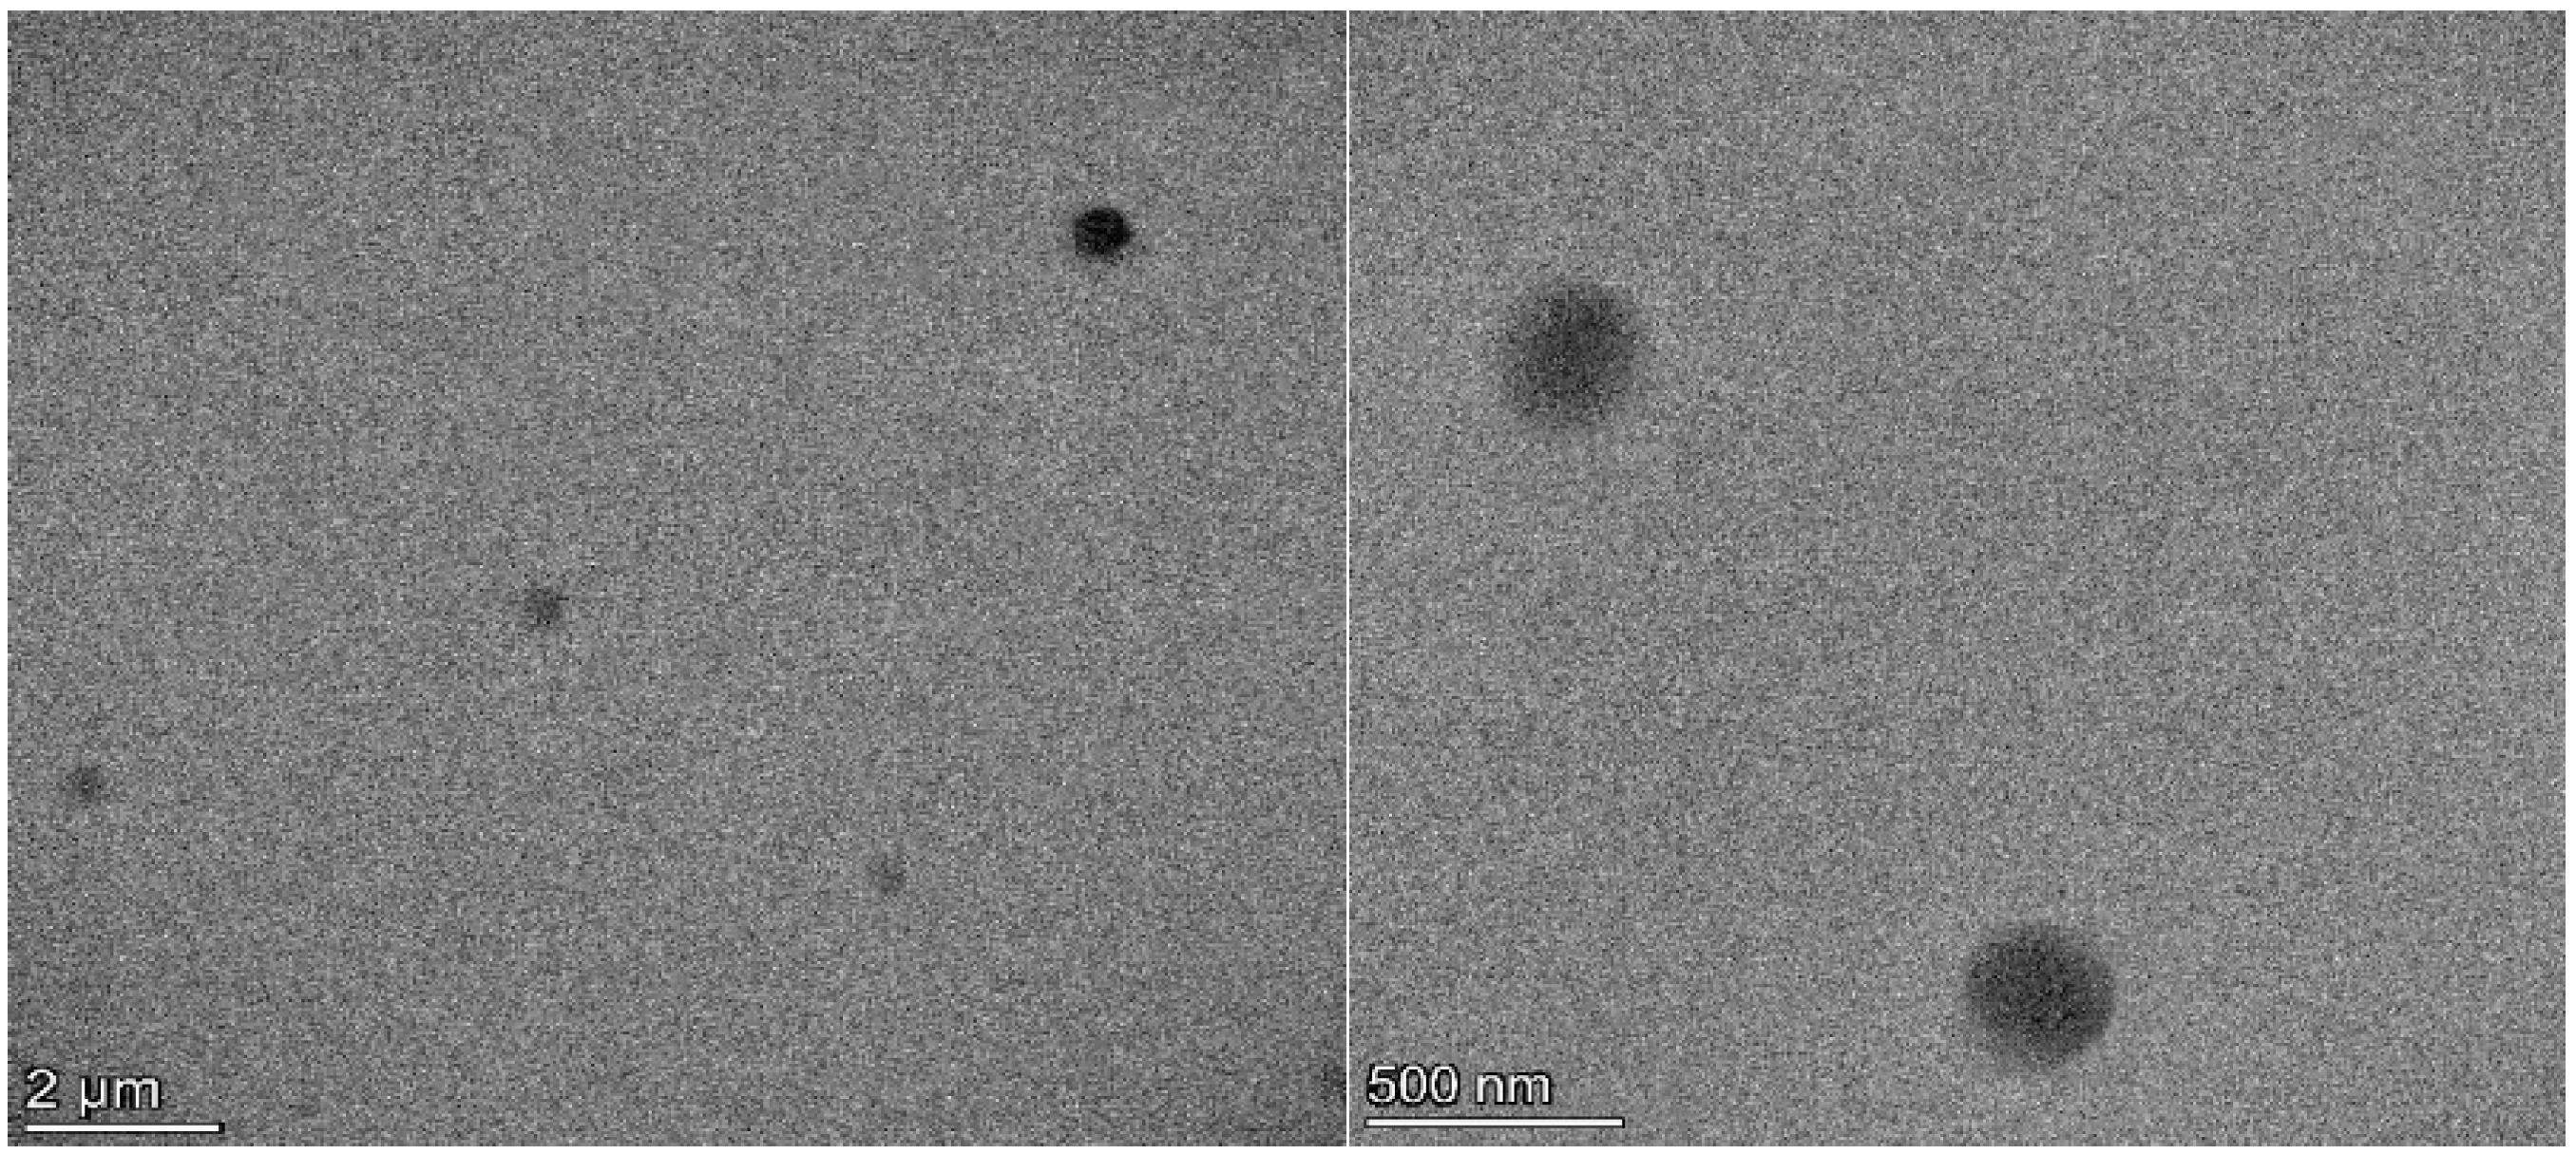
3.2.2. Nanoparticles Shape and Surface Morphology
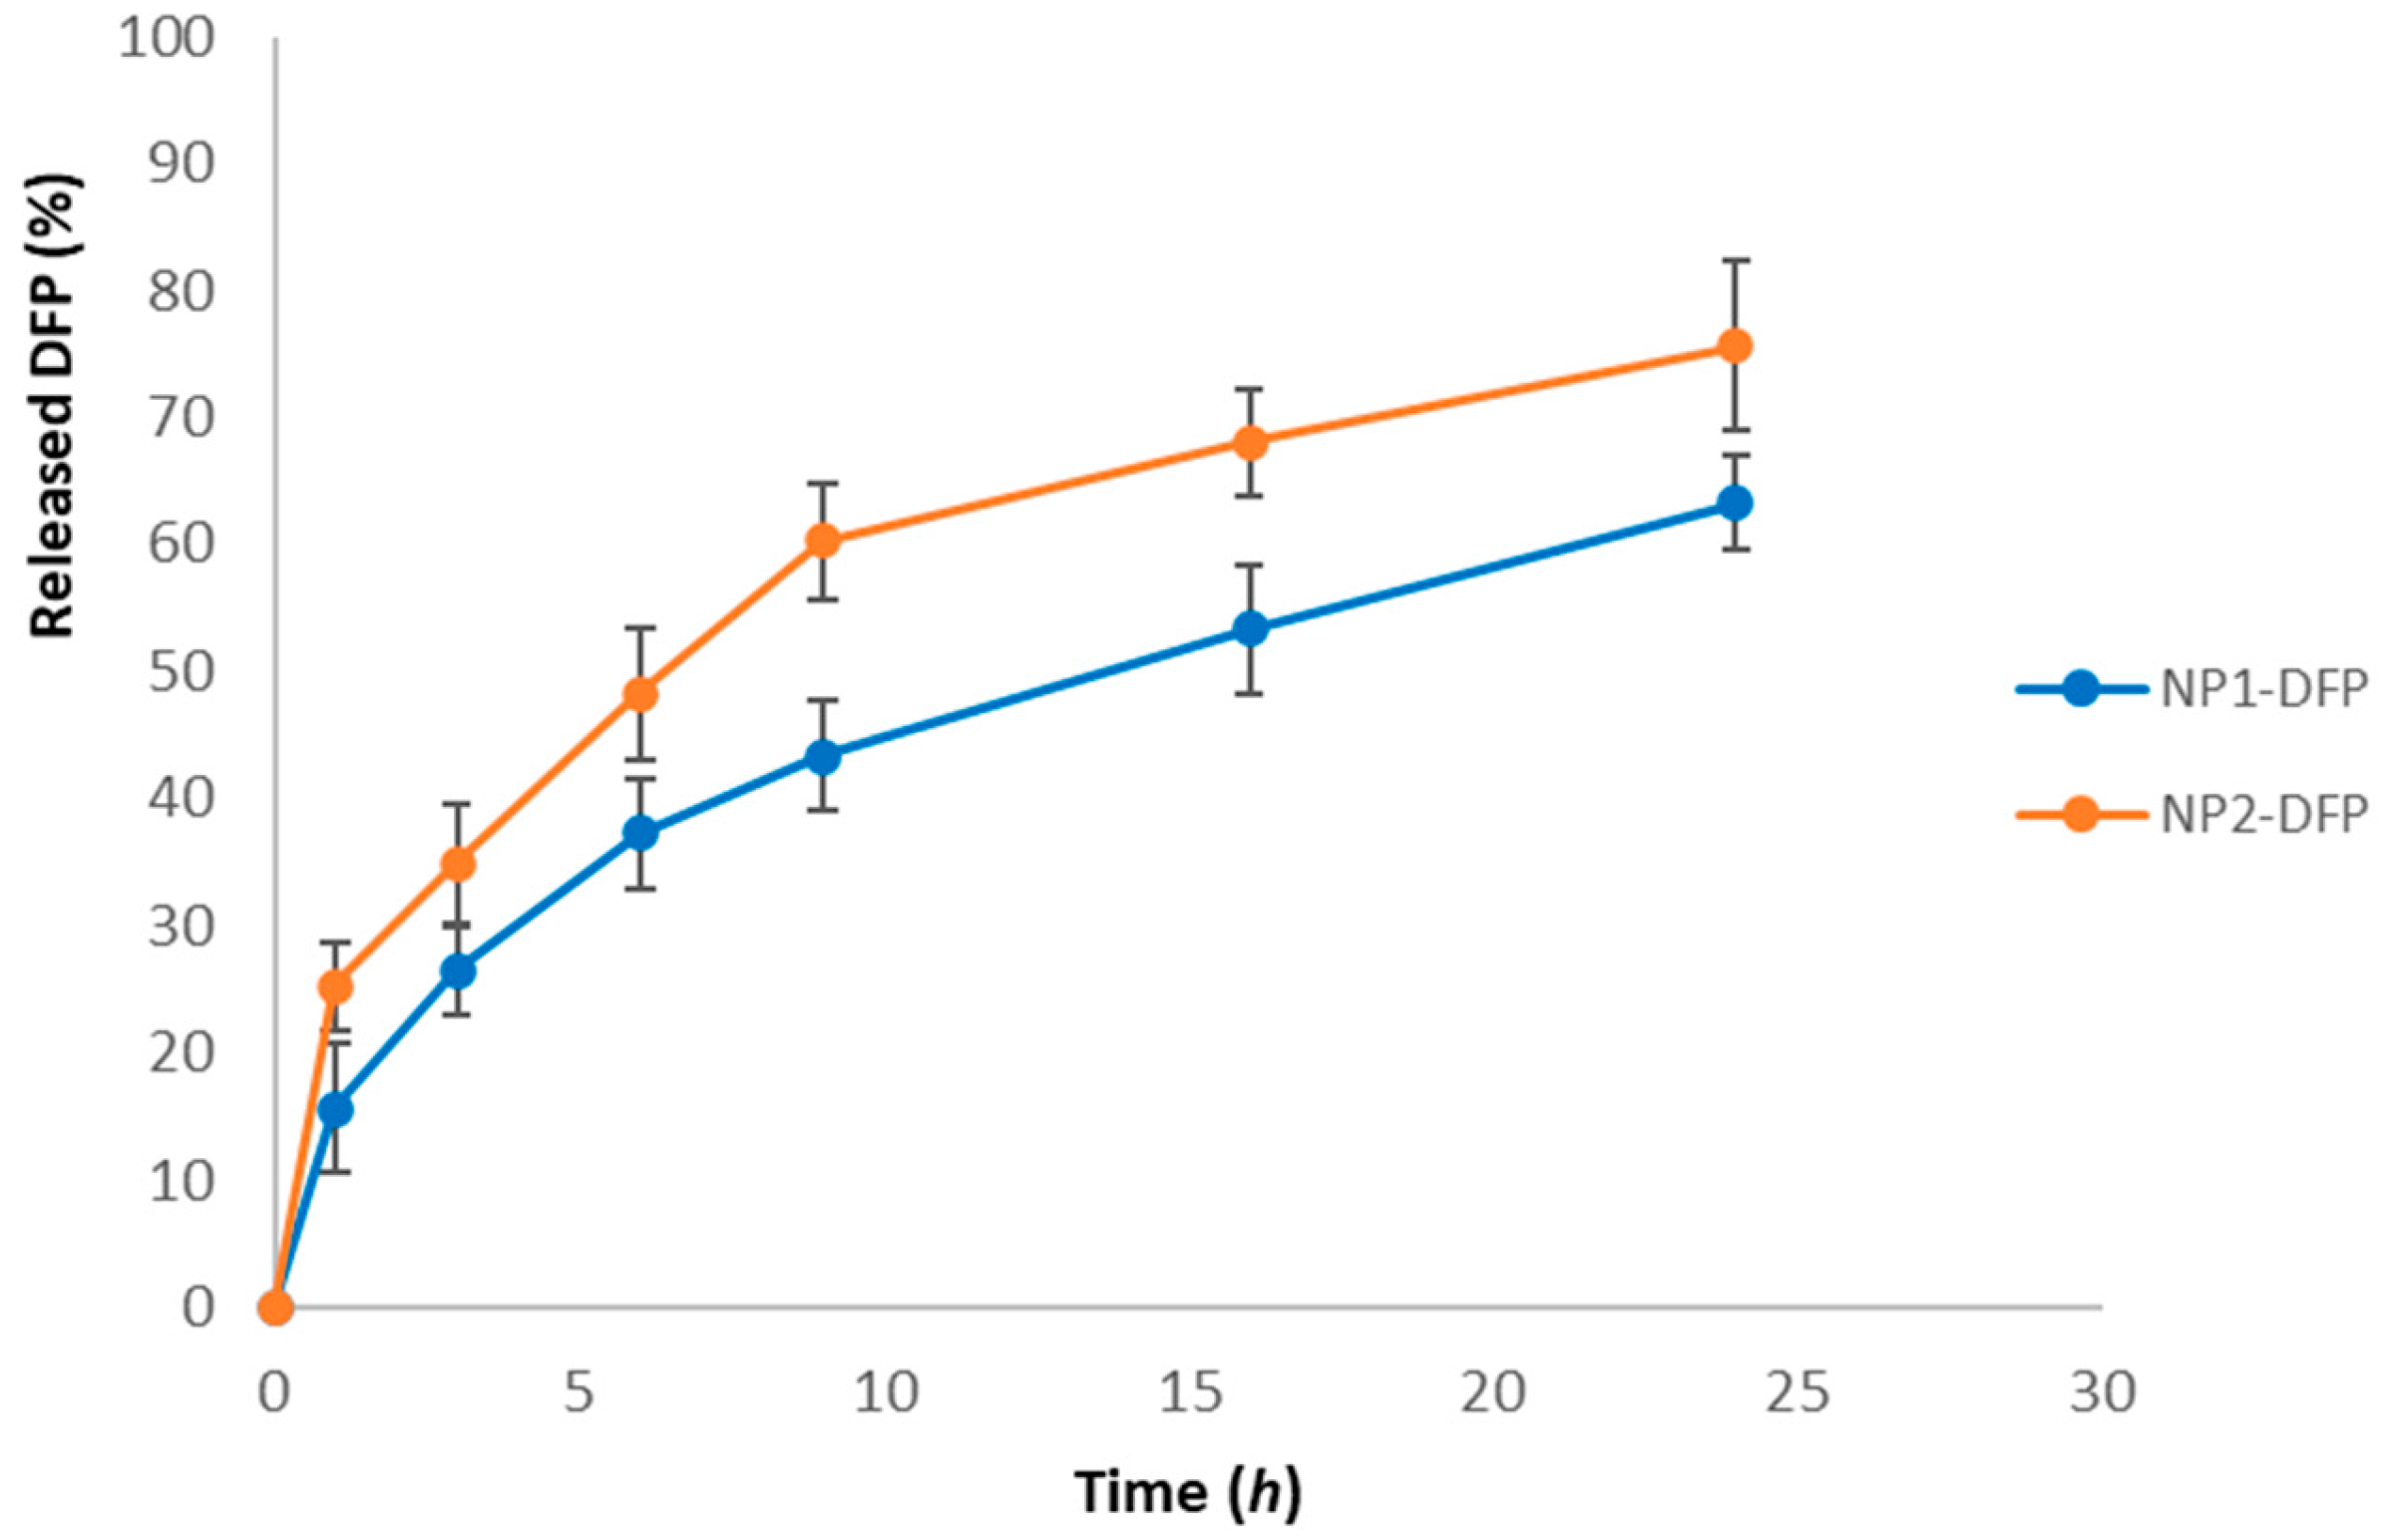
3.2.3. In Vitro Drug Release
3.3. Preparation and Characterization of Deferiprone-Loaded Nanocomposite Microspheres
3.3.1. Optimization of the Microspheres’ Preparation
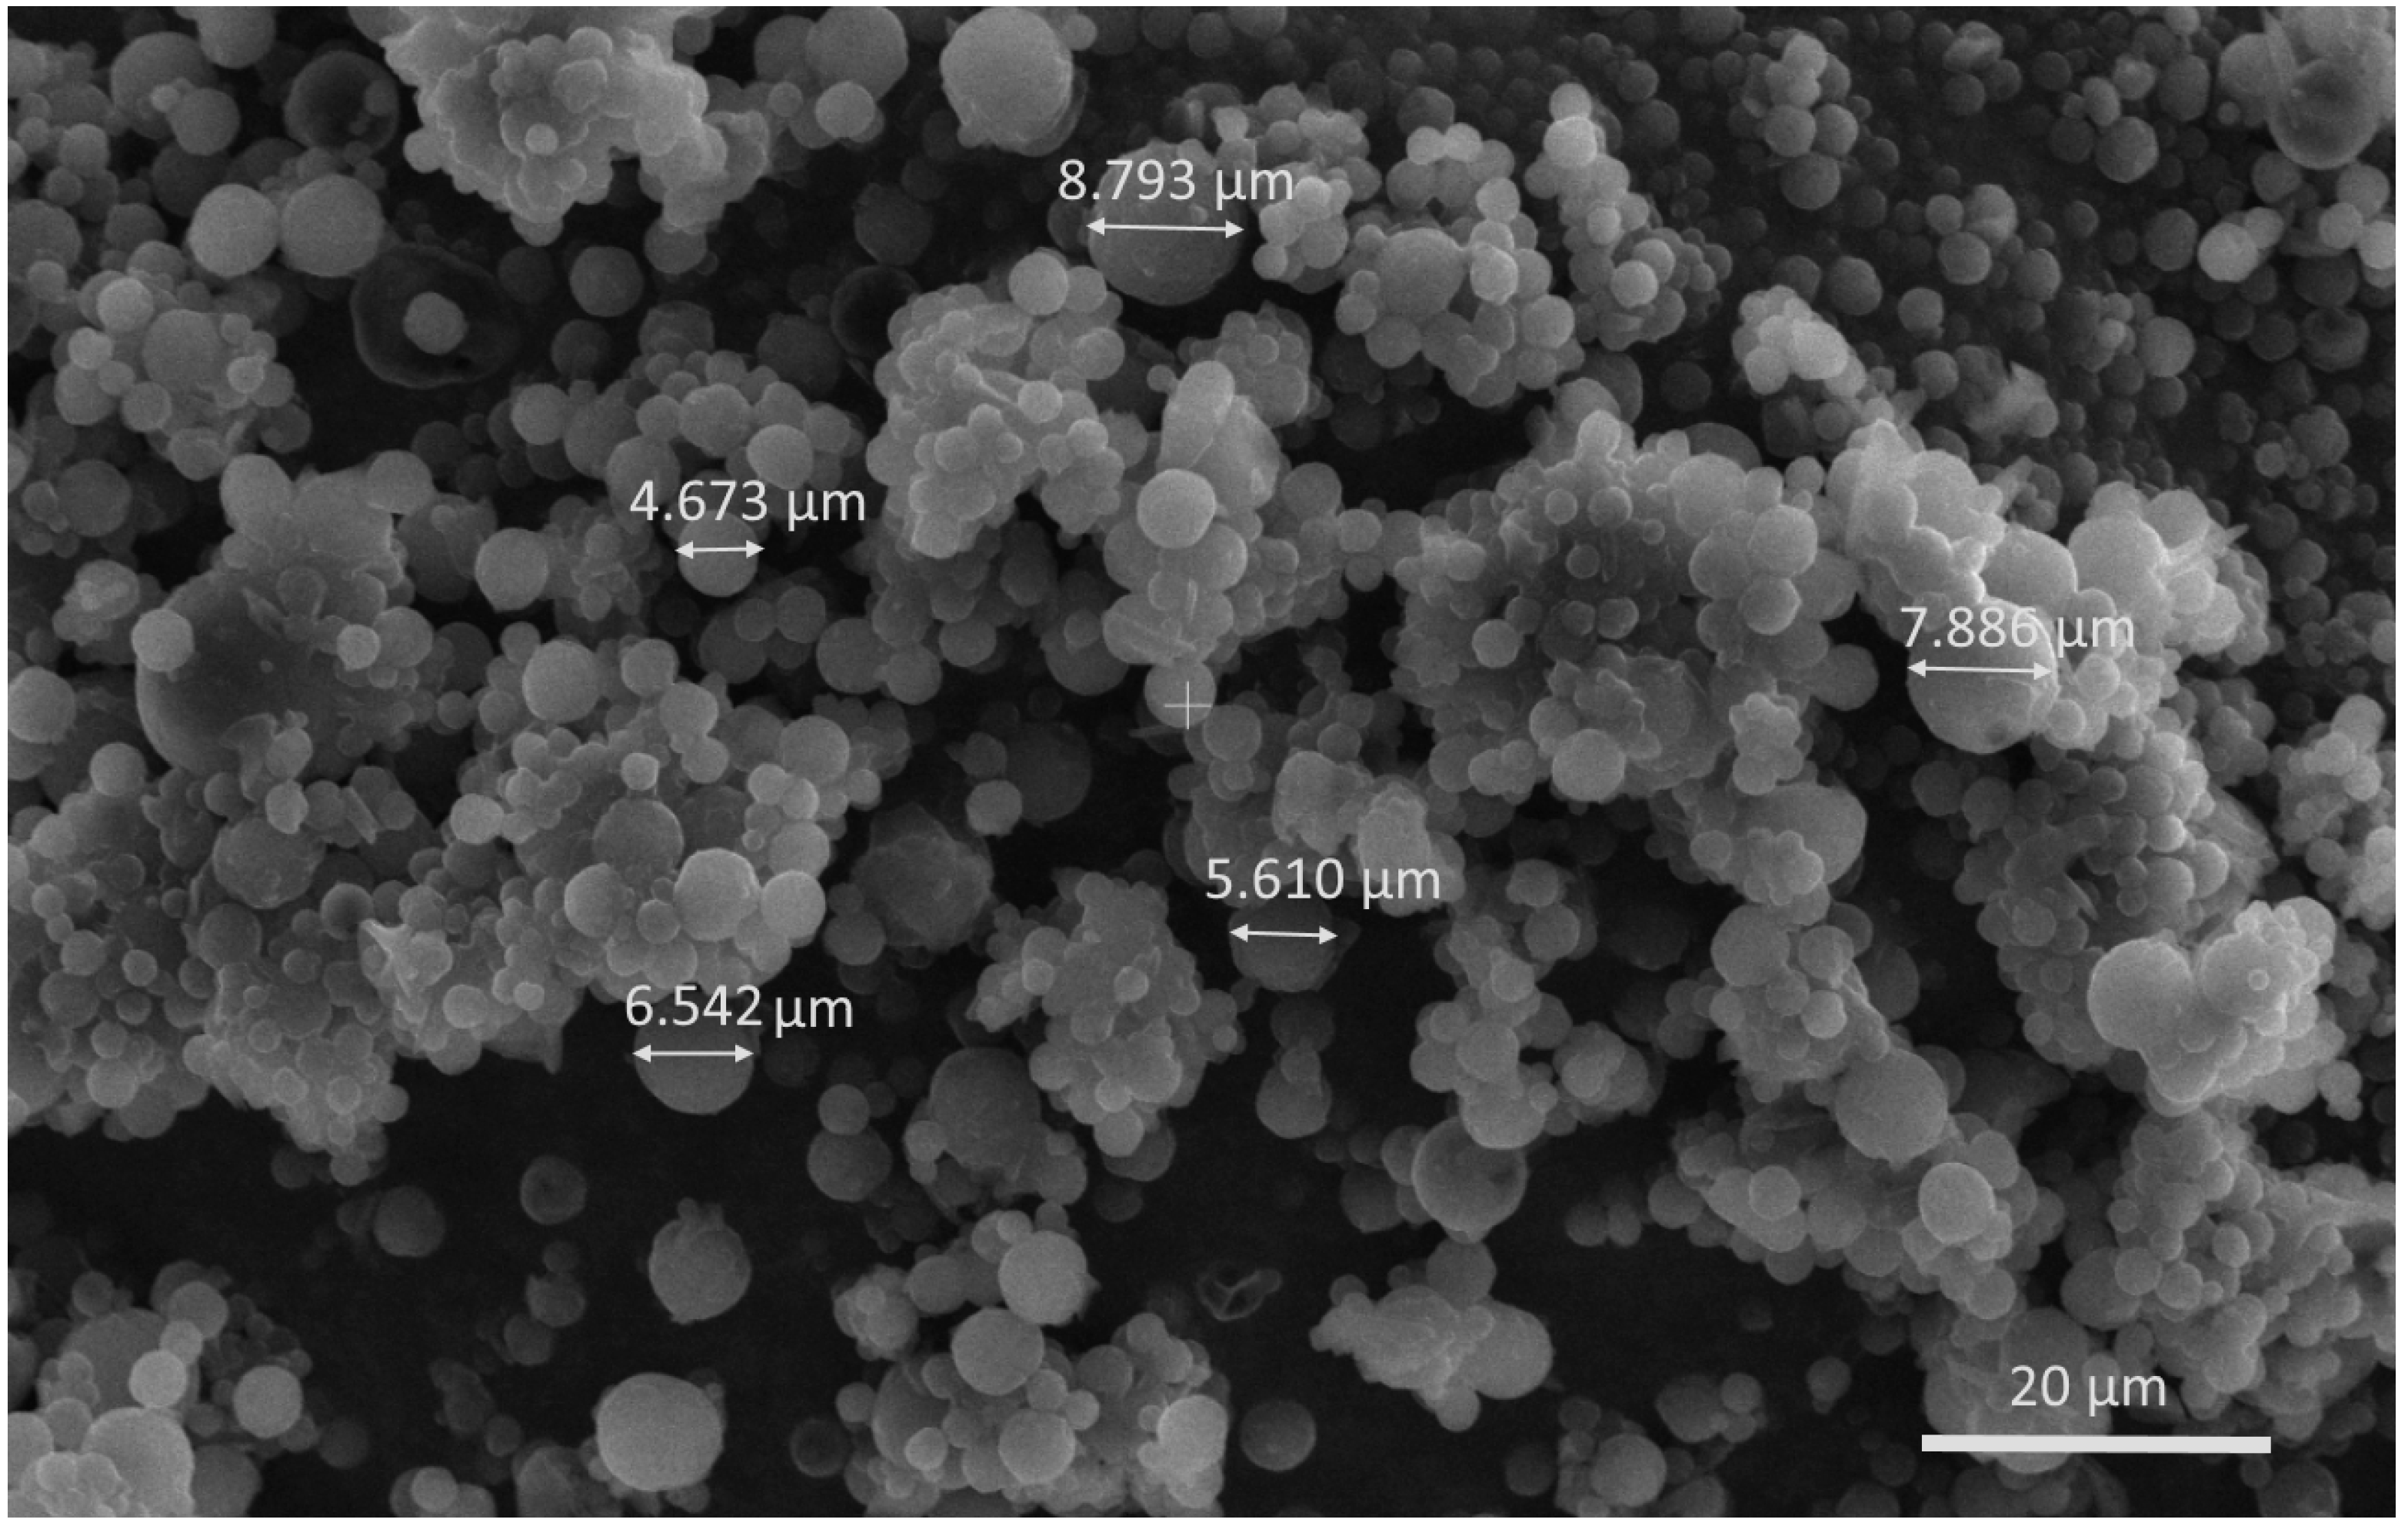
3.3.2. Characterization of Nanocomposite Microspheres
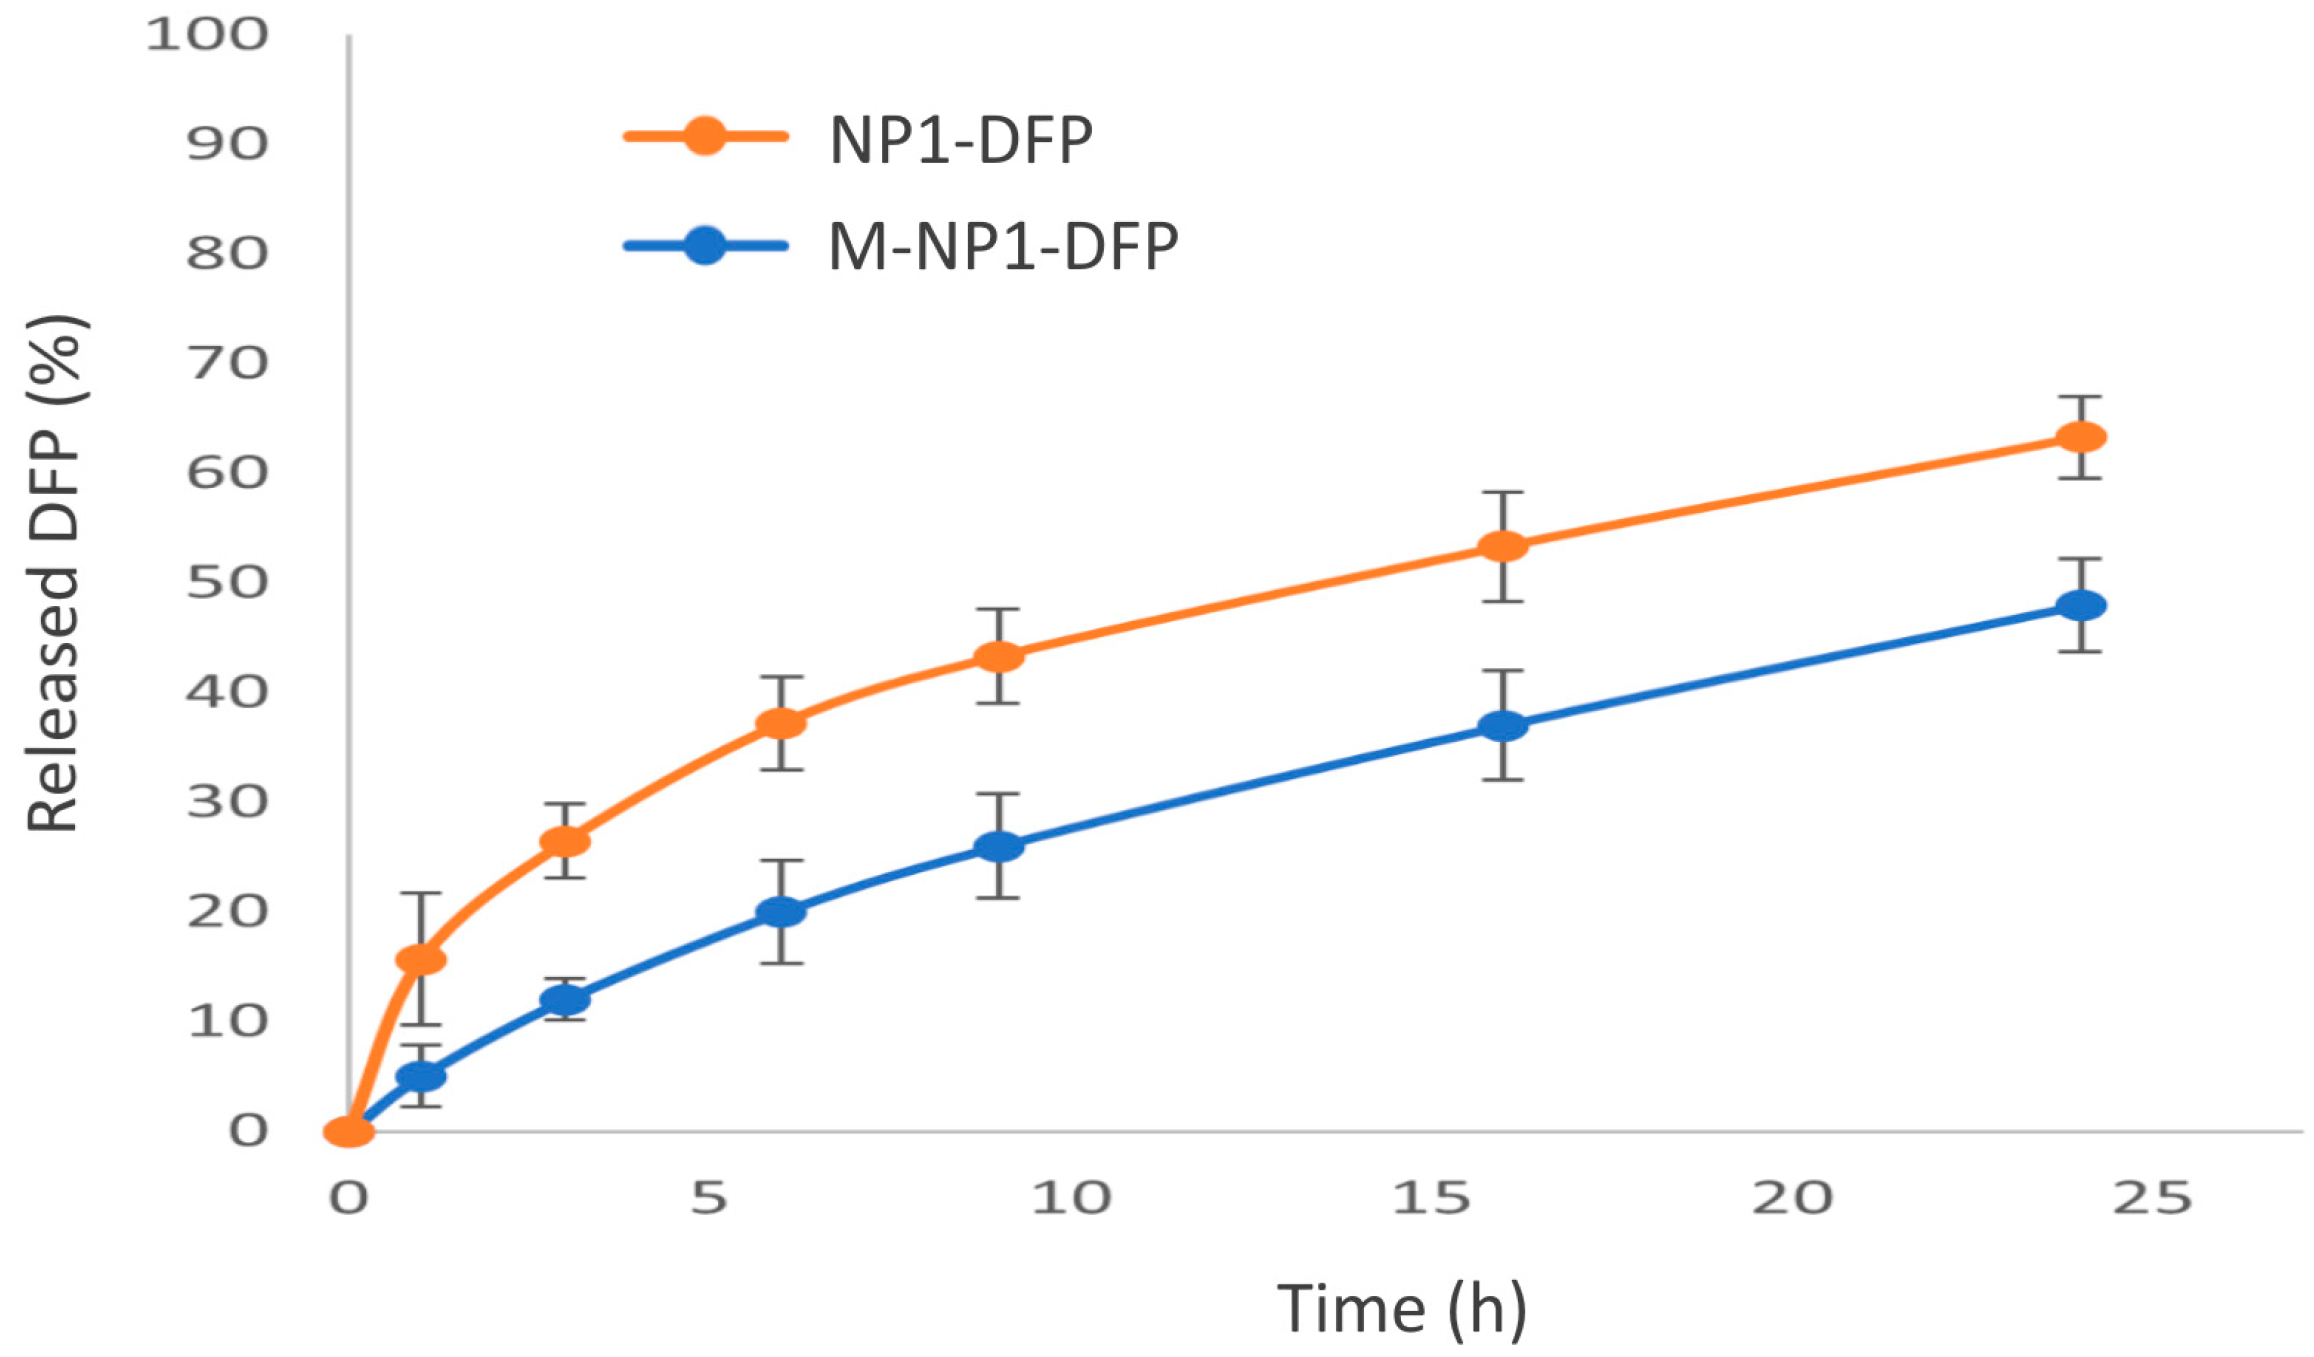
3.3.3. In Vitro Drug Release
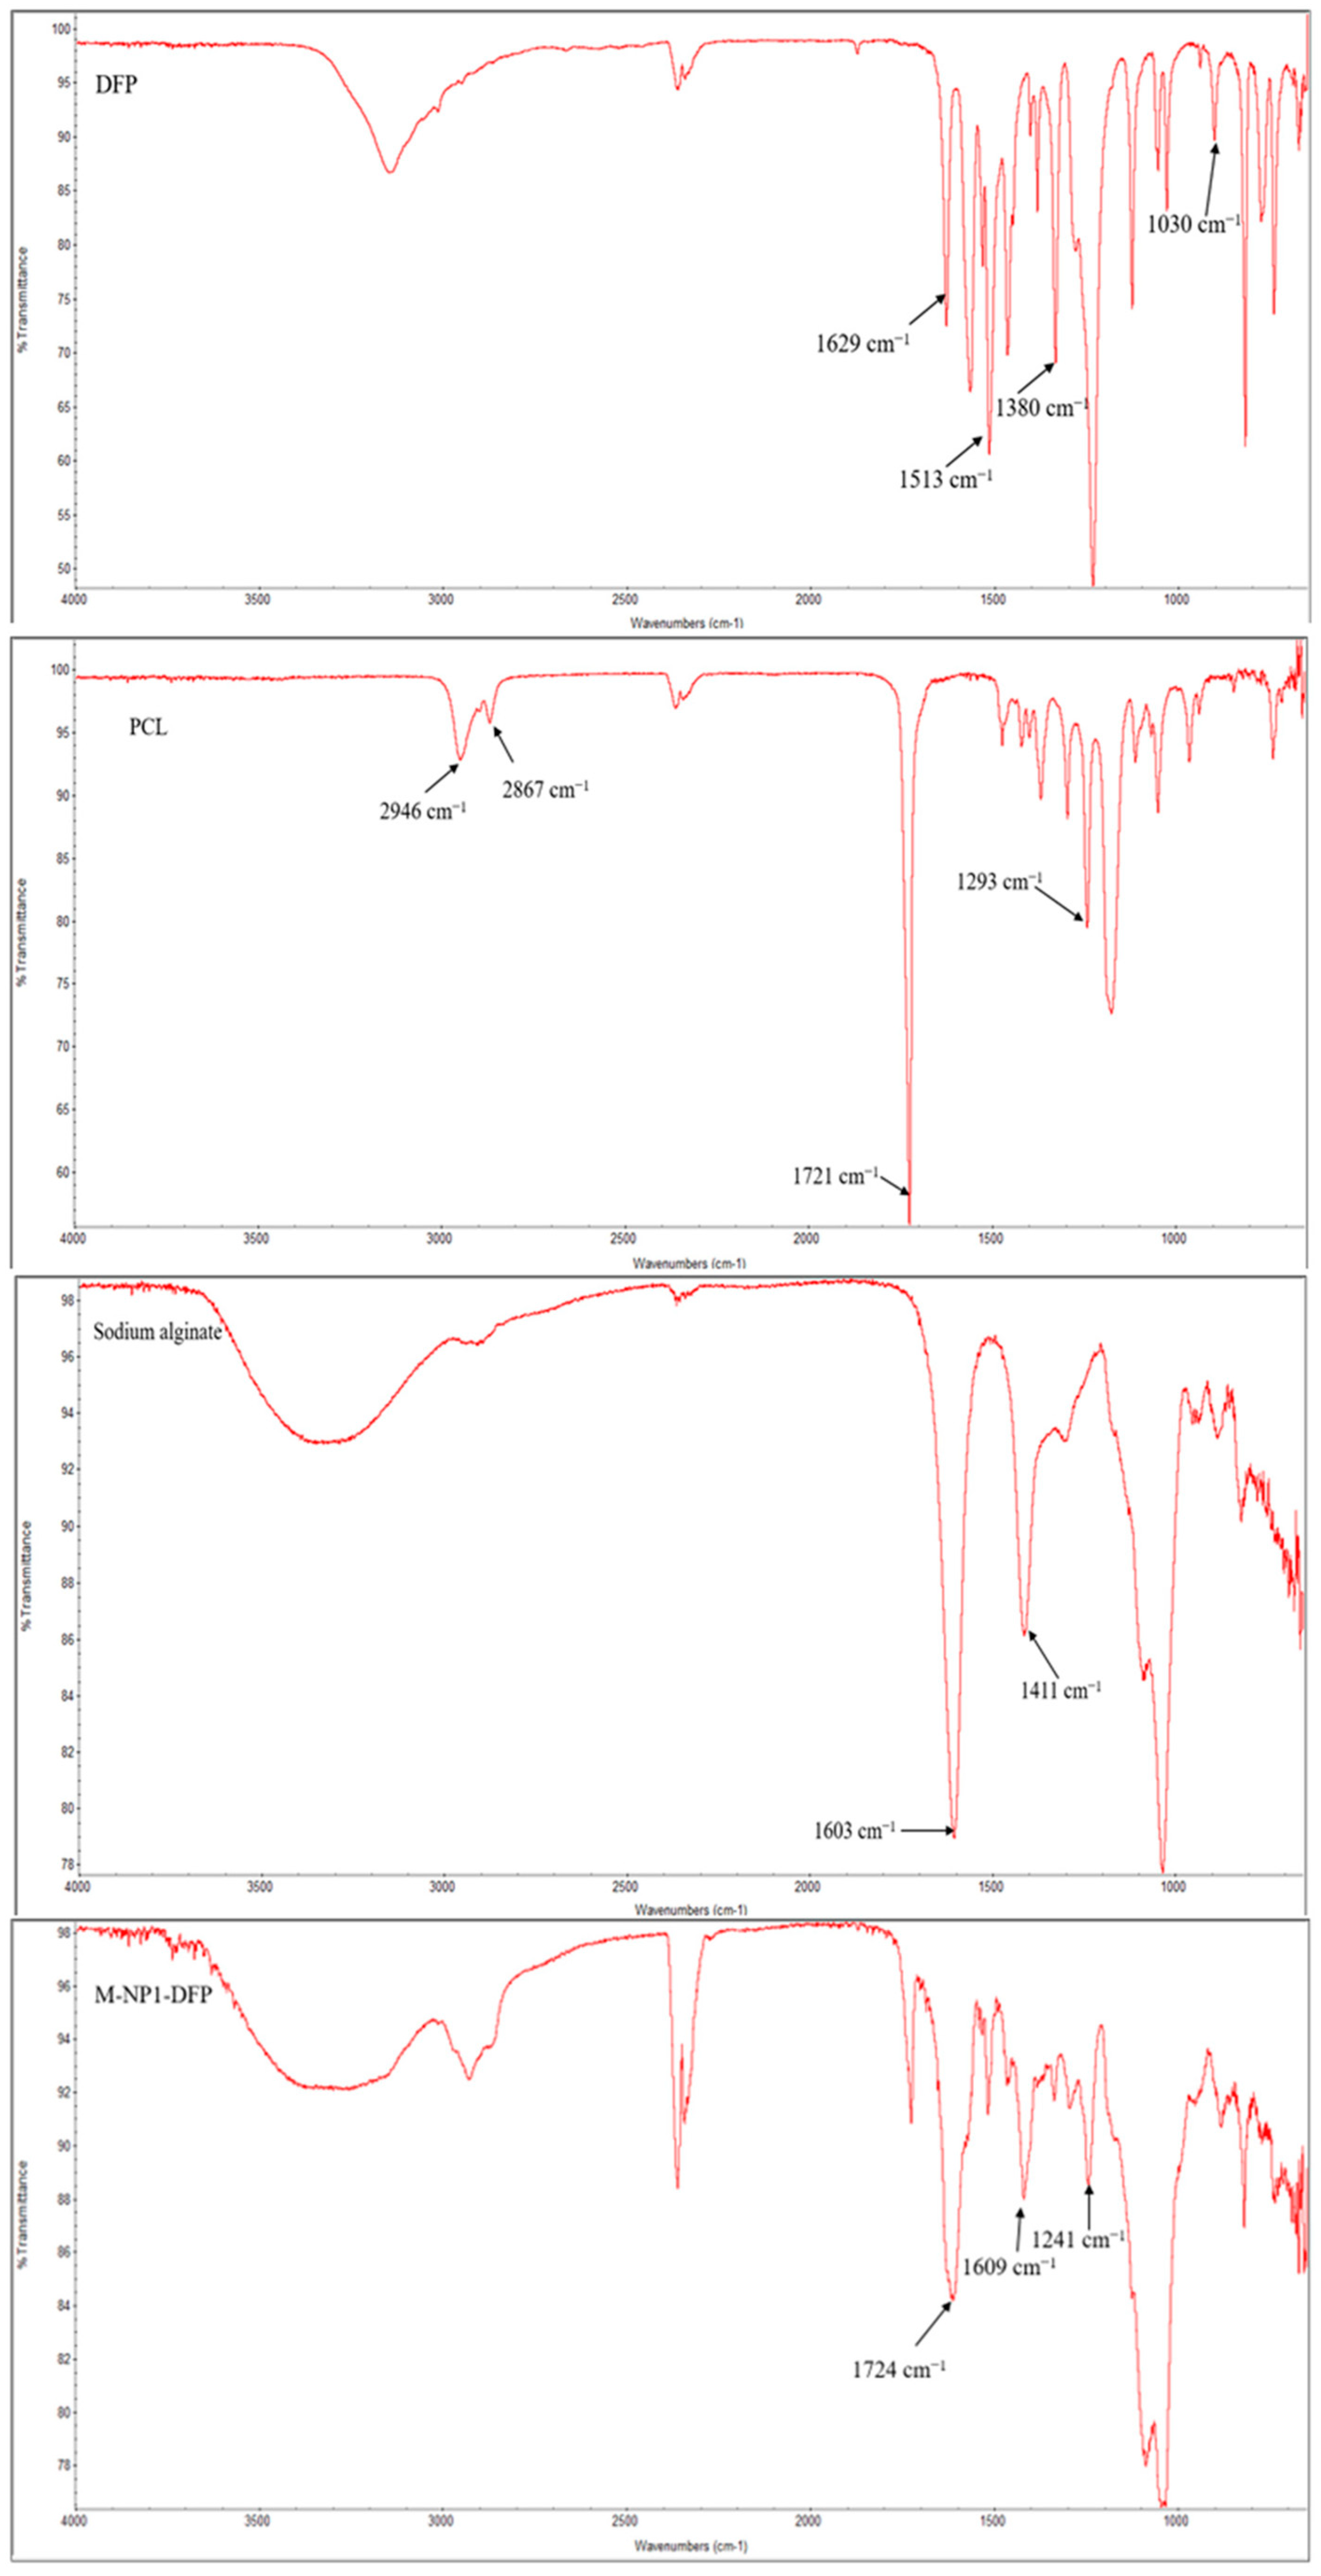
3.3.4. FTIR Spectroscopy
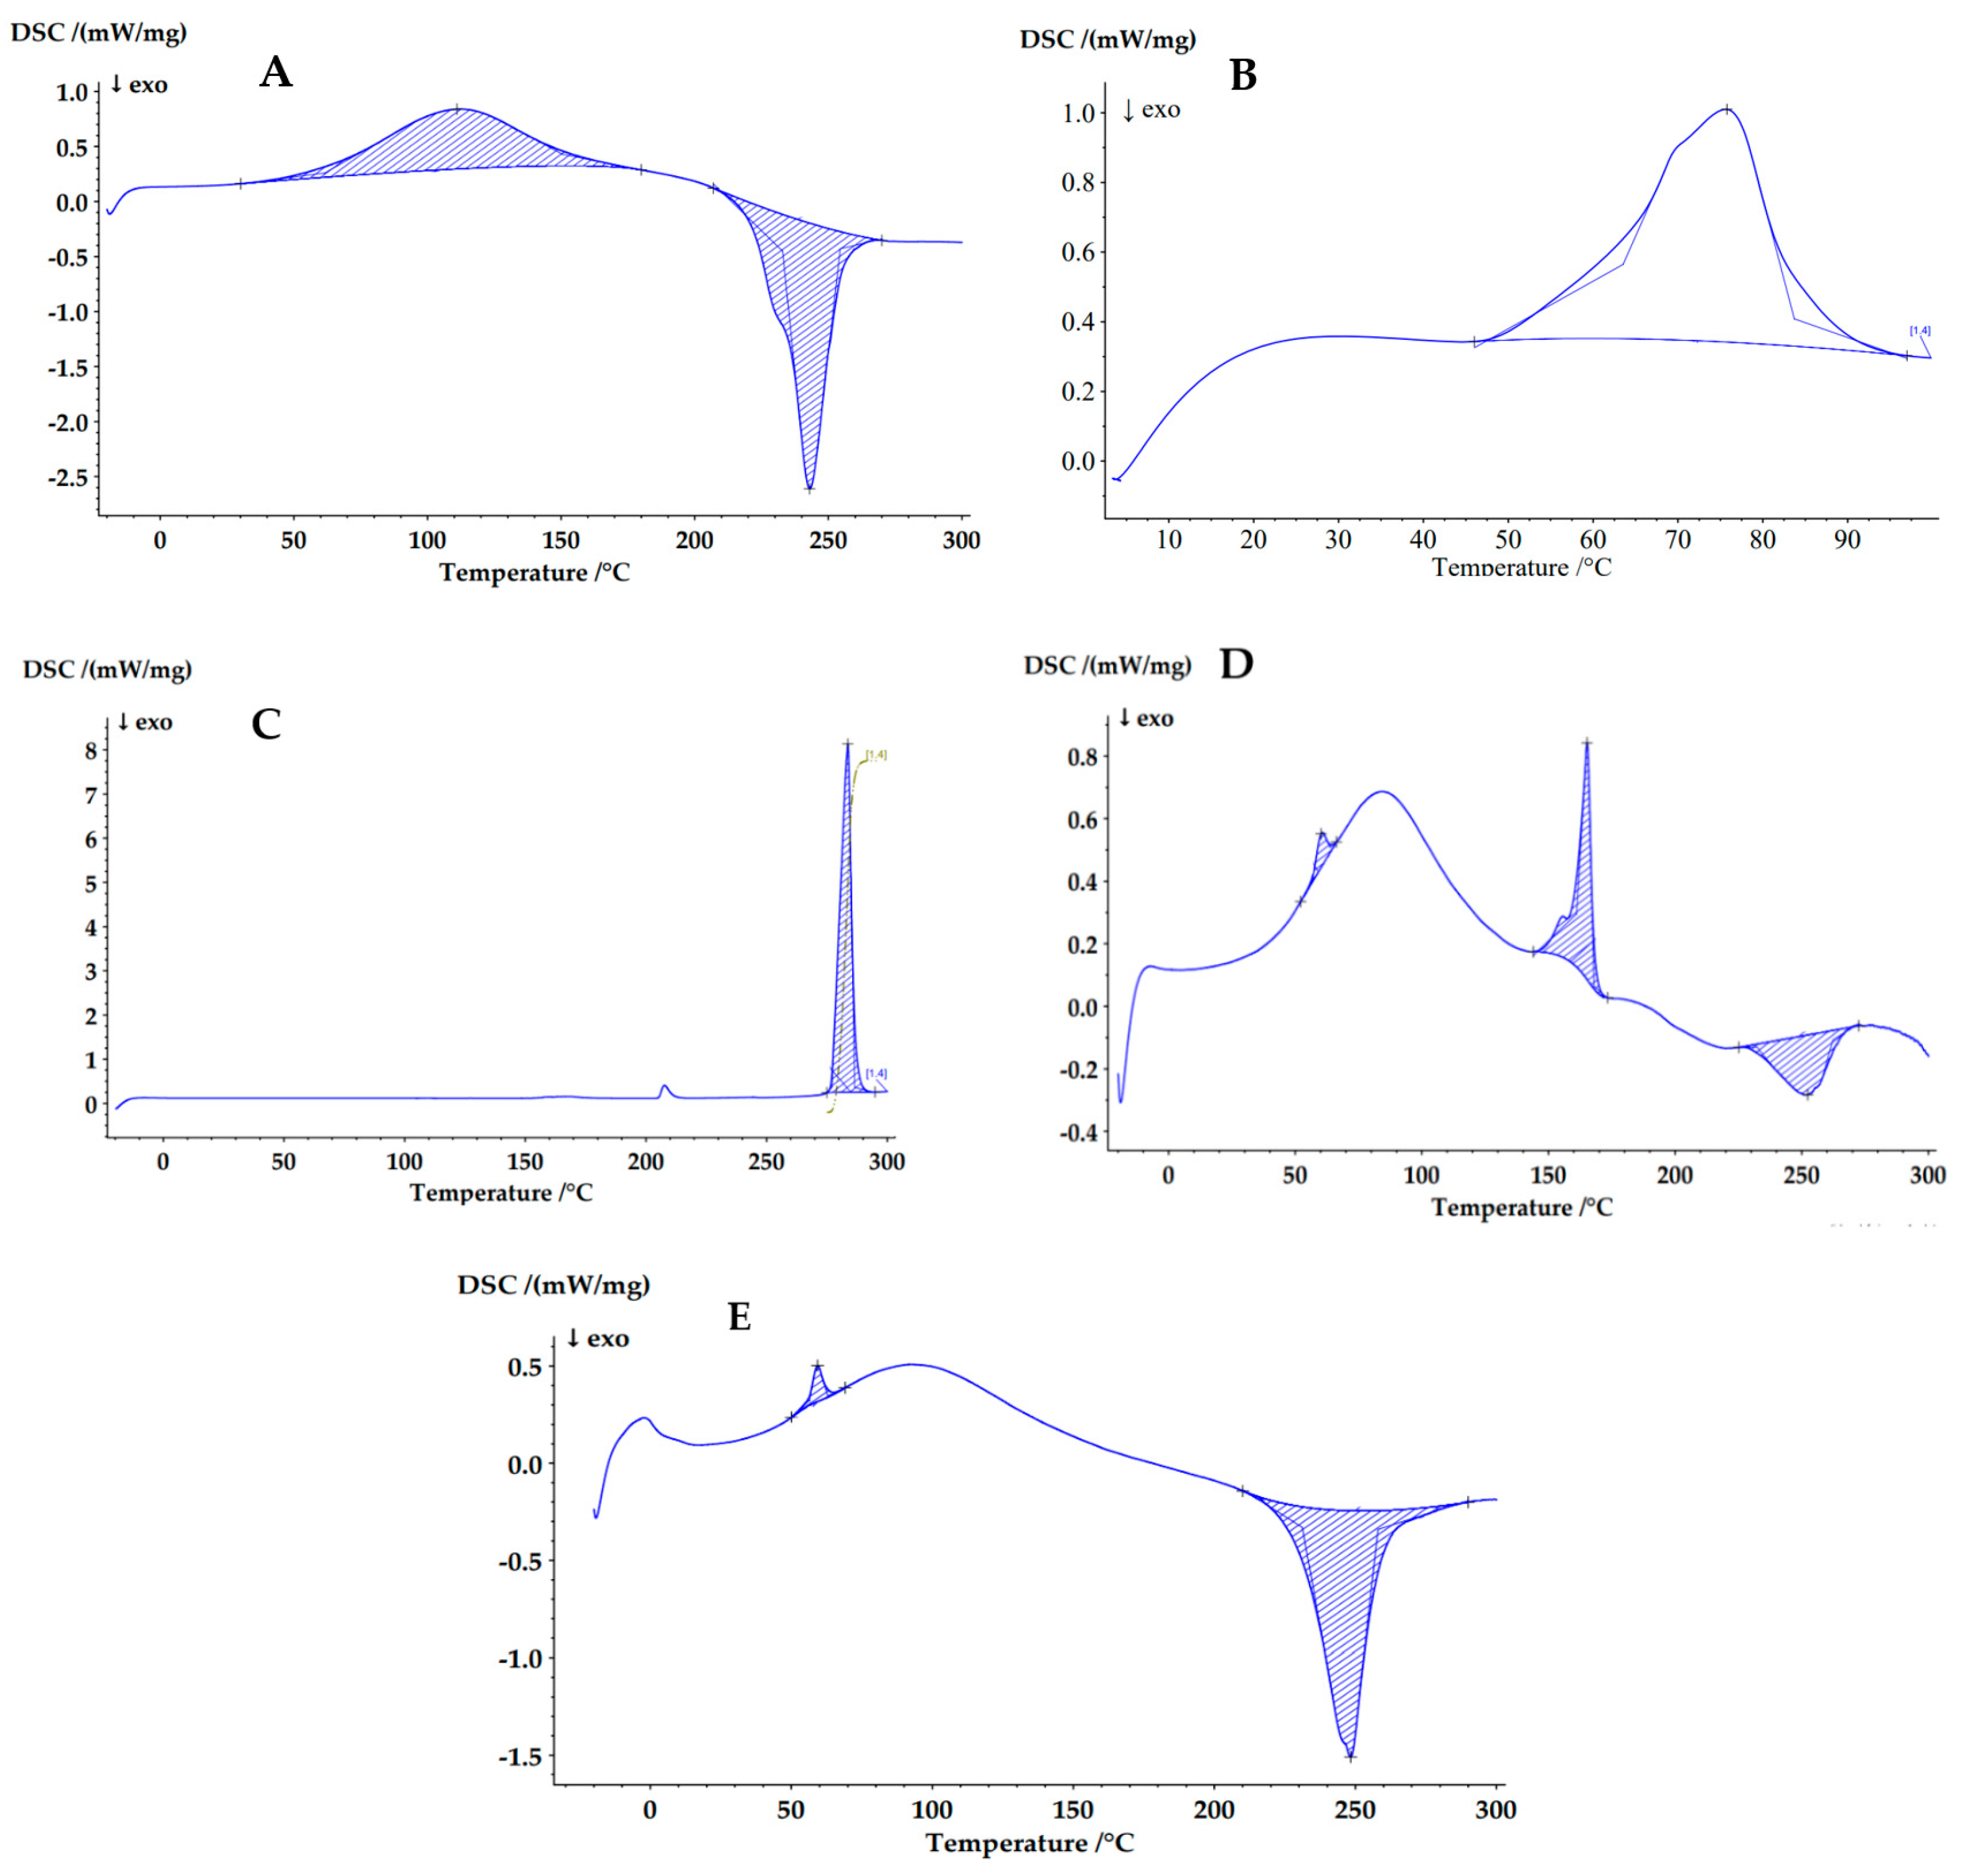
3.3.5. Differential Scanning Calorimetry (DSC)
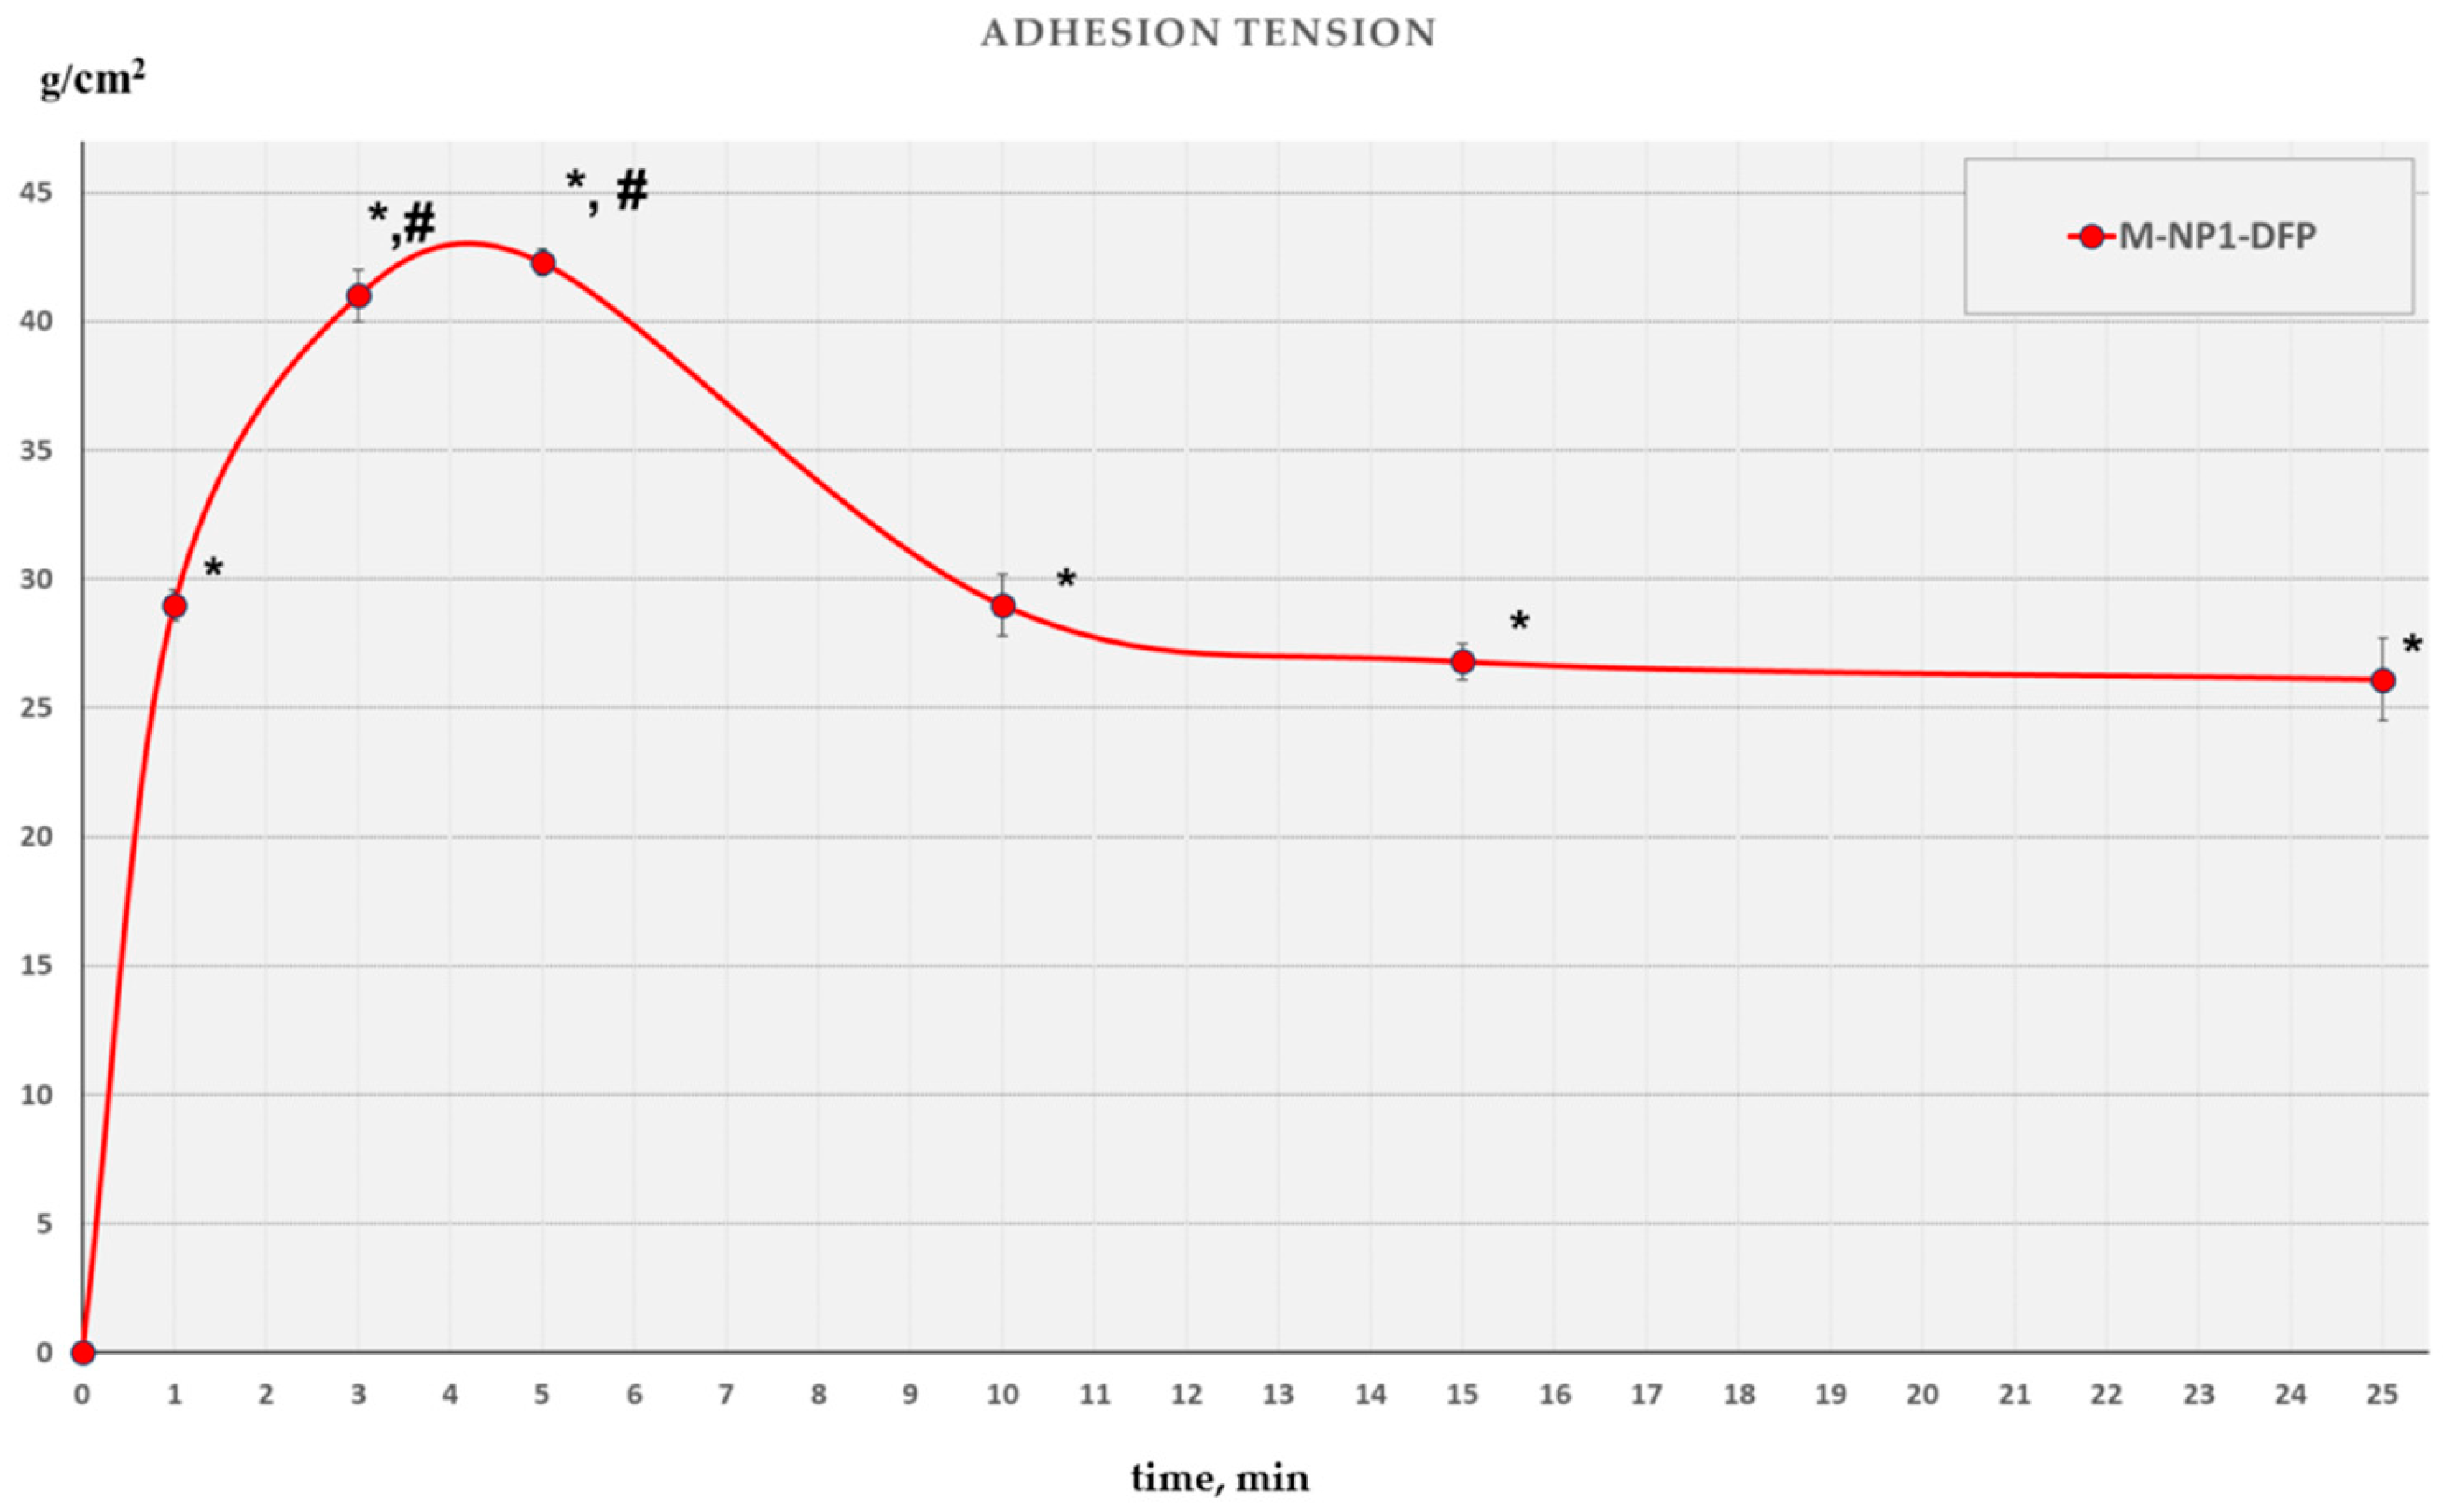
3.3.6. Mucoadhesive Ability
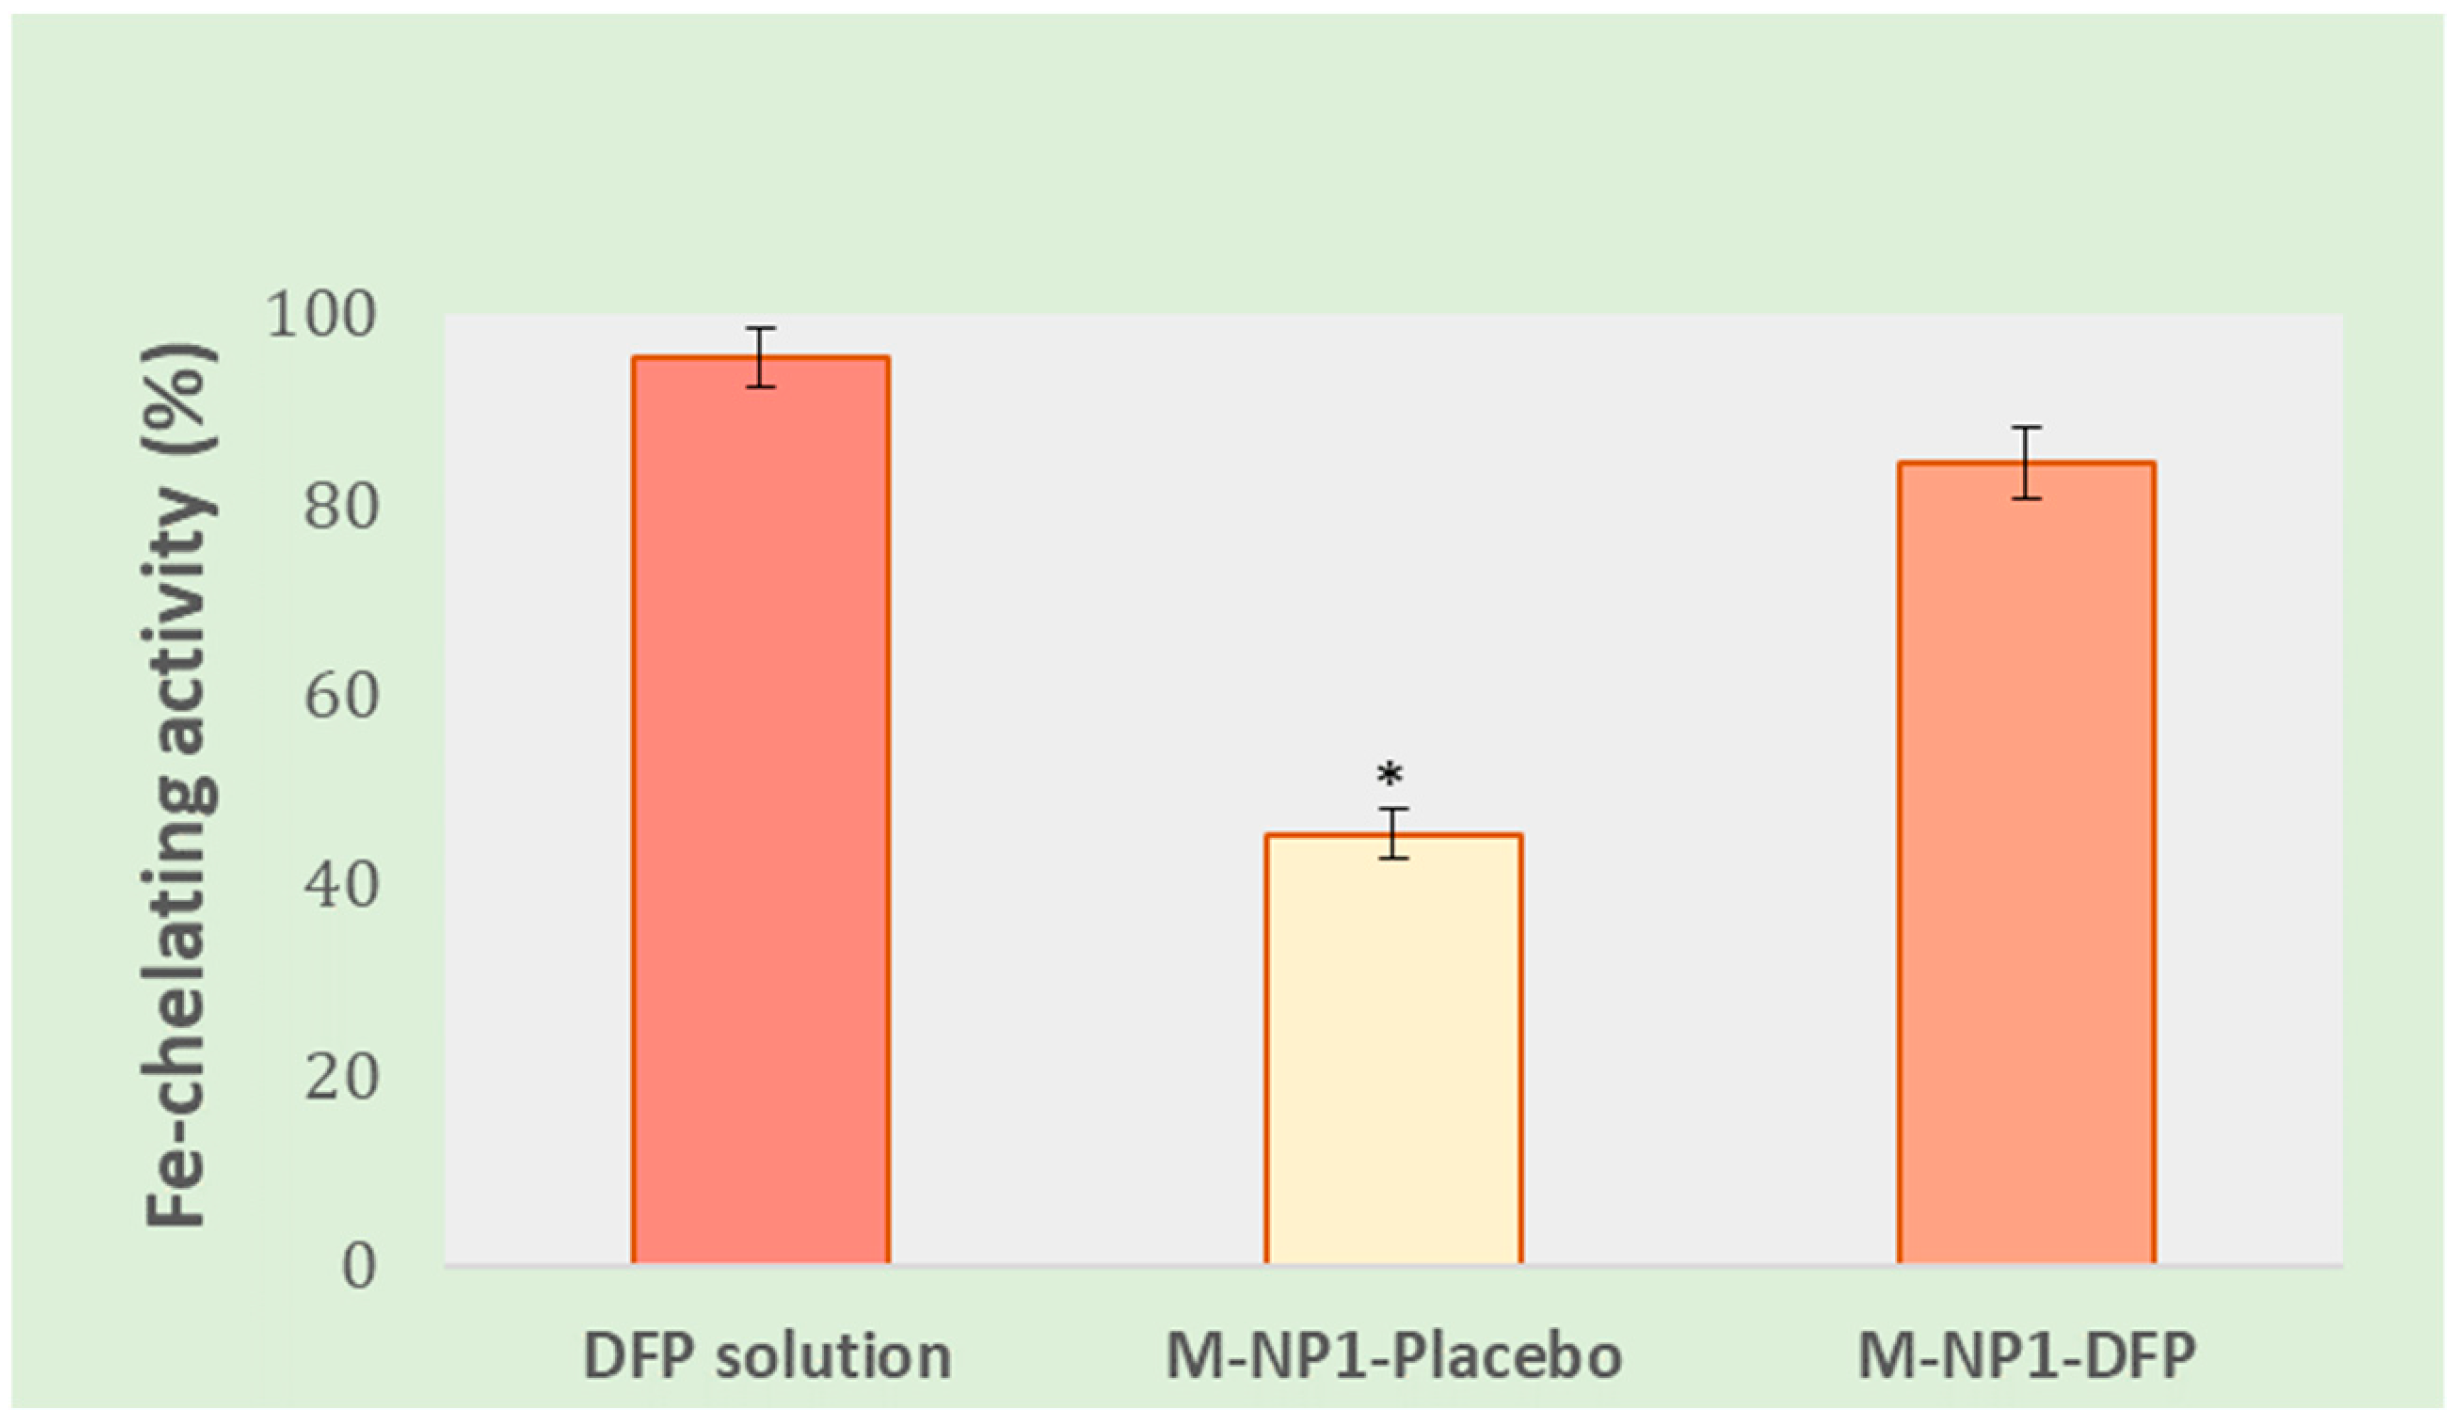
3.3.7. In Vitro Determination of Fe-Chelating Activity
3.3.8. Determination of the Binding Ability of Nanoparticles Loaded with DFP to Human Serum Albumin (HSA)
4. Conclusions
Author Contributions
Funding
Institutional Review Board Statement
Informed Consent Statement
Data Availability Statement
Conflicts of Interest
References
- De la Torre, C.; Ceña, V. The Delivery Challenge in Neurodegenerative Disorders: The Nanoparticles Role in Alzheimer’s Disease Therapeutics and Diagnostics. Pharmaceutics 2018, 10, 190. [Google Scholar] [CrossRef] [PubMed]
- Domínguez-Fernández, C.; Egiguren-Ortiz, J.; Razquin, J.; Gómez-Galán, M.; De las Heras-García, L.; Paredes-Rodríguez, E.; Astigarraga, E.; Miguélez, C.; Barreda-Gómez, G. Review of Technological Challenges in Personalised Medicine and Early Diagnosis of Neurodegenerative Disorders. Int. J. Mol. Sci. 2023, 24, 3321. [Google Scholar] [CrossRef] [PubMed]
- Aragón-González, A.; Shaw, P.J.; Ferraiuolo, L. Blood–Brain Barrier Disruption and Its Involvement in Neurodevelopmental and Neurodegenerative Disorders. Int. J. Mol. Sci. 2022, 23, 15271. [Google Scholar] [CrossRef] [PubMed]
- Xu, H.; Wang, Y.; Song, N.; Wang, J.; Jiang, H.; Xie, J. New Progress on the Role of Glia in Iron Metabolism and Iron-Induced Degeneration of Dopamine Neurons in Parkinson’s Disease. Front. Mol. Neurosci. 2017, 10, 455. [Google Scholar] [CrossRef]
- Ward, R.J.; Dexter, D.T.; Crichton, R.R. Neurodegenerative diseases and therapeutic strategies using iron chelators. J. Trace Elem. Med. Biol. 2015, 31, 267–273. [Google Scholar] [CrossRef]
- Long, H.Z.; Zhou, Z.W.; Cheng, Y.; Luo, H.Y.; Li, F.J.; Xu, S.G.; Gao, L.C. The Role of Microglia in Alzheimer’s Disease from the Perspective of Immune Inflammation and Iron Metabolism. Front. Aging Neurosci. 2022, 14, 888989. [Google Scholar] [CrossRef]
- Kenkhuis, B.; Somarakis, A.; de Haan, L.; Dzyubachyk, O.; Ijsselsteijn, M.E.; de Miranda, N.F.C.C.; Lelieveldt, B.P.F.; Dijkstra, J.; van Roon-Mom, W.M.C.; Höllt, T.; et al. Iron loading is a prominent feature of activated microglia in Alzheimer’s disease patients. Acta Neuropathol. Commun. 2021, 9, 27. [Google Scholar] [CrossRef]
- Wang, M.; Tang, G.; Zhou, C.; Guo, H.; Hu, Z.; Hu, Q.; Li, G. Revisiting the intersection of microglial activation and neuroinflammation in Alzheimer’s disease from the perspective of ferroptosis. Chem. Biol. Interact. 2023, 375, 110387. [Google Scholar] [CrossRef] [PubMed]
- Kontoghiorghes, G.J. The Vital Role Played by Deferiprone in the Transition of Thalassaemia from a Fatal to a Chronic Disease and Challenges in Its Repurposing for Use in Non-Iron-Loaded Diseases. Pharmaceuticals 2023, 16, 1016. [Google Scholar] [CrossRef]
- Hoyes, K.P.; Porter, J.B. Subcellular distribution of desferrioxamine and hydroxypyridin-4-one chelators in K562 cells affects chelation of intracellular iron pools. Br. J. Haematol. 1993, 85, 393–400. [Google Scholar] [CrossRef]
- Bellanti, F.; Danhof, M.; Della Pasqua, O. Population pharmacokinetics of deferiprone in healthy subjects. Br. J. Clin. Pharmacol. 2014, 78, 1397–1406. [Google Scholar] [CrossRef] [PubMed]
- Patharapankal, E.J.; Ajiboye, A.L.; Mattern, C.; Trivedi, V. Nose-to-Brain (N2B) Delivery: An Alternative Route for the Delivery of Biologics in the Management and Treatment of Central Nervous System Disorders. Pharmaceutics 2024, 16, 66. [Google Scholar] [CrossRef] [PubMed]
- Gandhi, S.; Shastri, D.H.; Shah, J.; Nair, A.B.; Jacob, S. Nasal Delivery to the Brain: Harnessing Nanoparticles for Effective Drug Transport. Pharmaceutics 2024, 16, 481. [Google Scholar] [CrossRef] [PubMed]
- Jin, Z.; Guo, G.; Yu, A.; Qian, H.; Tong, Z. Comparative Analysis of Micrometer-Sized Particle Deposition in the Olfactory Regions of Adult and Pediatric Nasal Cavities: A Computational Study. Pharmaceutics 2024, 16, 722. [Google Scholar] [CrossRef]
- Cheng, Y.S. Mechanisms of pharmaceutical aerosol deposition in the respiratory tract. AAPS PharmSciTech 2014, 15, 630–640. [Google Scholar] [CrossRef]
- Rassu, G.; Soddu, E.; Cossu, M.; Gavini, E.; Giunchedi, P.; Dalpiaz, A. Particulate formulations based on chitosan for nose-to-brain delivery of drugs. J. Drug Deliv. Sci. Technol. 2016, 32, 77–87. [Google Scholar] [CrossRef]
- Dalpiaz, A.; Gavini, E.; Colombo, G.; Russo, P.; Bortolotti, F.; Ferraro, L.; Tanganelli, S.; Scatturin, A.; Menegatti, E.; Giunchedi, P. Brain uptake of an anti-ischemic agent by nasal administration of microparticles. J. Pharm. Sci. 2008, 97, 4889–4903. [Google Scholar] [CrossRef]
- Maaz, A.; Blagbrough, I.S.; De Bank, P.A. In Vitro Evaluation of Nasal Aerosol Depositions: An Insight for Direct Nose to Brain Drug Delivery. Pharmaceutics 2021, 13, 1079. [Google Scholar] [CrossRef]
- Ugwoke, M.I.; Agu, R.U.; Verbeke, N.; Kinget, R. Nasal mucoadhesive drug delivery: Background, applications, trends and future perspectives. Adv. Drug Deliv. Rev. 2005, 57, 1640–1665. [Google Scholar] [CrossRef]
- Adnet, T.; Groo, A.-C.; Picard, C.; Davis, A.; Corvaisier, S.; Since, M.; Bounoure, F.; Rochais, C.; Le Pluart, L.; Dallemagne, P.; et al. Pharmacotechnical Development of a Nasal Drug Delivery Composite Nanosystem Intended for Alzheimer’s Disease Treatment. Pharmaceutics 2020, 12, 251. [Google Scholar] [CrossRef]
- Yarragudi, S.B.; Kumar, H.; Jain, R.; Tawhai, M.; Rizwan, S. Olfactory Targeting of Microparticles through Inhalation and Bi-directional Airflow: Effect of Particle Size and Nasal Anatomy. J. Aerosol Med. Pulm. Drug Deliv. 2020, 33, 258–270. [Google Scholar] [CrossRef] [PubMed]
- Dinis, T.C.; Maderia, V.M.; Almeida, L.M. Action of phenolic derivatives (acetaminophen. salicylate. and 5-aminosalicylate) as inhibitors of membrane lipid peroxidation and as peroxyl radical scavengers. Arch. Biochem. Biophys. 1994, 315, 161–169. [Google Scholar] [CrossRef] [PubMed]
- Peters, T. All about Albumin: Biochemistry. Genetics. and Medical Applications. In 2—The Albumin Molecule: Its Structure and Chemical Properties; Academic Press: San Diego, CA, USA, 1995. [Google Scholar] [CrossRef]
- Ray, A.; Seth, B.K.; Pal, U.; Basu, S. Nickel(II)-Schiff base complex recognizing domain ii of bovine and human serum albumin: Spectroscopic and docking studies. Acta Part A Mol. Biomol. Spectrosc. 2012, 92, 164–174. [Google Scholar] [CrossRef] [PubMed]
- Davidovich-Pinhas, M.; Harari, O.; Bianco-Peled, H. Evaluating the mucoadhesive properties of drug delivery systems based on hydrated thiolated alginate. J. Control. Release 2009, 136, 38–44. [Google Scholar] [CrossRef]
- Tangri, P.; Khurana, S.; Satheesh, M. Mucoadhesive drug delivery: Mechanism and method of evaluation. Int. J. Pharma Bio. Sci. 2011, 2, 458–467. [Google Scholar]
- Woertz, C.; Preis, M.; Breitkreutz, J.; Kleinebudde, P. Assessment of test methods evaluating mucoadhesive polymers and dosage forms: An overview. Eur. J. Pharm. Biopharm. 2013, 85, 843–853. [Google Scholar] [CrossRef] [PubMed]
- Yang, Y.Y.; Chung, T.S.; Ng, N.P. Morphology, drug distribution, and in vitro release profiles of biodegradable polymeric microspheres containing protein fabricated by double-emulsion solvent extraction/evaporation method. Biomaterials 2001, 22, 231–241. [Google Scholar] [CrossRef]
- Mudrić, J.; Šavikin, K.; Ibrić, S.; Đuriš, J. Double emulsions (W/O/W emulsions): Encapsulation of Plant Biactives. Lek. Sirovine 2019, 39, 76–83. [Google Scholar] [CrossRef]
- Raviadaran, R.; Muthoosamy, K.; Manickam, S. Simple and multiple emulsions emphasizing on industrial applications and stability assessment. In Food Process Engineering and Quality Assurance, 1st ed.; Mohan, C.O., Carvajal-Millan, E., Ravishankar, C.N., Haghi, A.K., Eds.; Apple Academic Press: Oakville, ON, Canada, 2018; pp. 179–230. [Google Scholar] [CrossRef]
- Alex, A.T.; Joseph, A.; Shavi, G.; Rao, J.V.; Udupa, N. Development and evaluation of carboplatin-loaded PCL nanoparticles for intranasal delivery. Drug Deliv. 2016, 23, 2144–2153. [Google Scholar] [CrossRef]
- Woodruff, M.A.; Hutmacher, D.W. The return of a forgotten polymer—Polycaprolactone in the 21st century. Prog. Polym. Sci. 2010, 35, 1217–1256. [Google Scholar] [CrossRef]
- Mohamed, R.M.; Yusoh, K. A Review on the Recent Research of Polycaprolactone (PCL). Adv. Mater. Res. 2015, 1134, 249–255. [Google Scholar] [CrossRef]
- Bhadran, A.; Shah, T.; Babanyinah, G.K.; Polara, H.; Taslimy, S.; Biewer, M.C.; Stefan, M.C. Recent Advances in Polycaprolactones for Anticancer Drug Delivery. Pharmaceutics 2023, 15, 1977. [Google Scholar] [CrossRef] [PubMed]
- Sinha, V.R.; Bansal, K.; Kaushik, R.; Kumria, R.; Trehan, A. Poly-epsilon-caprolactone microspheres and nanospheres: An overview. Int. J. Pharm. 2004, 278, 1–23. [Google Scholar] [CrossRef]
- Javed, I.; Ranjha, N.M.; Mahmood, K.; Kashif, S.; Rehman, M.; Usman, F. Drug release optimization from microparticles of poly (E-caprolactone) and hydroxypropyl methylcellulose polymeric blends: Formulation and characterization. J. Drug Deliv. Sci. Technol. 2014, 24, 607–612. [Google Scholar] [CrossRef]
- Jeong, J.C.; Lee, J.; Cho, K. Effects of crystalline microstructure on drug release behavior of poly(epsilon-caprolactone) microspheres. J. Control. Release 2003, 92, 249–258. [Google Scholar] [CrossRef]
- Aguilar-De-Leyva, A.; Gonçalves-Araujo, T.; Daza, V.; Caraballo, I. A new deferiprone controlled release system obtained by ultrasound-assisted compression. Pharm. Dev. Technol. 2014, 19, 728–734. [Google Scholar] [CrossRef] [PubMed]
- Lukova, P.; Katsarov, P. Contemporary Aspects of Designing Marine Polysaccharide Microparticles as Drug Carriers for Biomedical Application. Pharmaceutics 2023, 15, 2126. [Google Scholar] [CrossRef]
- Cherait, A.; Banks, W.A.; Vaudry, D. The Potential of the Nose-to-Brain Delivery of PACAP for the Treatment of Neuronal Disease. Pharmaceutics 2023, 15, 2032. [Google Scholar] [CrossRef]
- Ziaee, A.; Albadarin, A.B.; Padrela, L.; Femmer, T.; O’Reilly, E.; Walker, G. Spray drying of pharmaceuticals and biopharmaceuticals: Critical parameters and experimental process optimization approaches. Eur. J. Pharm. Sci. 2019, 127, 300–318. [Google Scholar] [CrossRef]
- Lai, J.; Azad, A.K.; Sulaiman, W.M.A.W.; Kumarasamy, V.; Subramaniyan, V.; Alshehade, S.A. Alginate-Based Encapsulation Fabrication Technique for Drug Delivery: An Updated Review of Particle Type, Formulation Technique, Pharmaceutical Ingredient, and Targeted Delivery System. Pharmaceutics 2024, 16, 370. [Google Scholar] [CrossRef]
- Sundararajan, P.; Moser, J.; Williams, L.; Chiang, T.; Riordan, C.; Metzger, M.; Zhang-Plasket, F.; Wang, F.; Collins, J.; Williams, J. Driving Spray Drying towards Better Yield: Tackling a Problem That Sticks Around. Pharmaceutics 2023, 15, 2137. [Google Scholar] [CrossRef] [PubMed]
- Poozesh, S.; Bilgili, E. Scale-up of pharmaceutical spray drying using scale-up rules: A review. Int. J. Pharm. 2019, 562, 271–292. [Google Scholar] [CrossRef]
- Henriques, P.; Fortuna, A.; Doktorovová, S. Spray dried powders for nasal delivery: Process and formulation considerations. Eur. J. Pharm. Biopharm. 2022, 176, 1–20. [Google Scholar] [CrossRef] [PubMed]
- Katsarov, P.; Pilicheva, B.; Manev, H.; Lukova, P.; Kassarova, M. Optimization of Chitosan Microspheres Spray Drying via 32 Full Factorial Design. Folia Medica 2017, 59, 310–317. [Google Scholar] [CrossRef] [PubMed]
- Bagheri, L.; Madadlou, A.; Yarmand, M.; Mousavi, M.E. Spray-dried alginate microparticles carrying caffeine-loaded and potentially bioactive nanoparticles. Food Res. Int. 2014, 62, 1113–1119. [Google Scholar] [CrossRef]
- Ehrick, J.D.; Shah, S.A.; Shaw, C.; Kulkarni, V.S.; Coowanitwong, I.; De, S.; Suman, J.D. Considerations for the Development of Nasal Dosage Forms. Sterile Prod. Dev. 2013, 6, 99–144. [Google Scholar] [CrossRef]
- Scherließ, R. Nasal formulations for drug administration and characterization of nasal preparations in drug delivery. Ther. Deliv. 2020, 11, 183–191. [Google Scholar] [CrossRef]
- Tiozzo Fasiolo, L.; Manniello, M.D.; Tratta, E.; Buttini, F.; Rossi, A.; Sonvico, F.; Bortolotti, F.; Russo, P.; Colombo, G. Opportunity and challenges of nasal powders: Drug formulation and delivery. Eur. J. Pharm. Sci. 2018, 113, 2–17. [Google Scholar] [CrossRef]
- Maury, M.; Murphy, K.; Kumar, S.; Shi, L.; Lee, G. Effects of process variables on the powder yield of spray-dried trehalose on a laboratory spray-dryer. Eur. J. Pharm. Biopharm. 2005, 59, 565–573. [Google Scholar] [CrossRef]
- Hussein, N.; Omer, H.; Ismael, A.; Albed Alhnan, M.; Elhissi, A.; Ahmed, W. Spray-dried alginate microparticles for potential intranasal delivery of ropinirole hydrochloride: Development, characterization and histopathological evaluation. Pharm. Dev. Technol. 2020, 25, 290–299. [Google Scholar] [CrossRef]
- Dukovski, B.J.; Mrak, L.; Winnicka, K.; Szekalska, M.; Juretić, M.; Filipović-Grčić, J.; Pepić, I.; Lovrić, J.; Hafner, A. Spray-Dried Nanoparticle-Loaded Pectin Microspheres for Dexamethasone Nasal Delivery. Dry. Technol. 2019, 37, 1915–1925. [Google Scholar] [CrossRef]
- Alhalaweh, A.; Andersson, S.; Velaga, S.P. Preparation of zolmitriptan-chitosan microparticles by spray drying for nasal delivery. Eur. J. Pharm. Sci. 2009, 38, 206–214. [Google Scholar] [CrossRef] [PubMed]
- De, A.; Chakraborty, S.; Mukherjee, A.; Chattopadhyay, J. Formulation of the In-Situ Forming Mucoadhesive Nasal Gel of Salbutamol Using Pluronic F-127 as Thermo sensative Gel Forming Polymer. Int. J. Res. Pharm. Biomed. Sci. 2014, 4, 926–933. [Google Scholar]
- Pamlényi, K.; Kristó, K.; Sovány, T.; Regdon, G., Jr. Development and evaluation of bioadhesive buccal films based on sodium alginate for allergy therapy. Heliyon 2022, 8, 10364. [Google Scholar] [CrossRef]
- Ghorab, D.; Refai, H.; Tag, R. Preparation and evaluation of fenoterol hydrobromide suppositories. Drug Discov. Ther. 2011, 5, 311–318. [Google Scholar] [CrossRef]
- Prasanthi, N.L.; Krishna, C.S.; Gupta, M.E.; Manikiran, S.S.; Rao, N.R. Design and development of sublingual fast dissolving films for an antiasthmatic drug. Der Pharm. Lett. 2011, 3, 382–395. [Google Scholar]
- Purushothaman, M.; Dhanapal, R.; Vijayakumar, S.; Ratna, V.J. Development of sustained release matrix tablets of salbutamol sulphate using different polymers. Int. J. Adv. Pharm. 2012, 3, 5–8. [Google Scholar]
- Sivaprakasam, S.; Khatiwada, S.P.; Sivasubramanian, J. Comparative study of desferrioxamine and deferiprone protects against aluminum induced compositional, structural and functional changes in liver tissue of mice (mus musculus) investigated by FT-IR spectroscopy. Biomed. Prev. Nutr. 2014, 4.2, 231–238. [Google Scholar]
- Badri, W.; Miladi, K.; Robin, S.; Viennet, C.; Nazari, Q.A.; Agusti, G.; Fessi, H.; Elaissari, A. Polycaprolactone Based Nanoparticles Loaded with Indomethacin for Anti-Inflammatory Therapy: From Preparation to Ex Vivo Study. Pharm. Res. 2017, 34, 1773–1783. [Google Scholar] [CrossRef]
- Badita, C.R.; Aranghel, D.; Burducea, C.; Mereuta, P. Characterization of sodium alginate based films. Rom. J. Phys. 2020, 65, 1–8. [Google Scholar]
- Gizurarson, S. The effect of cilia and the mucociliary clearance on successful drug delivery. Biol. Pharm. Bull. 2015, 38, 497–506. [Google Scholar] [CrossRef] [PubMed]
- Merkus, F.W.; Verhoef, J.C.; Schipper, N.G.; Marttin, E. Nasal mucociliary clearance as a factor in nasal drug delivery. Adv. Drug Deliv. Rev. 1998, 29, 13–38. [Google Scholar] [CrossRef] [PubMed]
- Chowdary, K.P.; Rao, Y.S. Design and in vitro and in vivo evaluation of mucoadhesive microcapsules of glipizide for oral controlled release: A technical note. AAPS PharmSciTech. 2003, 4, E39. [Google Scholar] [CrossRef]
- Bassi da Silva, J.; Ferreira, S.B.d.S.; Reis, A.V.; Cook, M.T.; Bruschi, M.L. Assessing Mucoadhesion in Polymer Gels: The Effect of Method Type and Instrument Variables. Polymers 2018, 10, 254. [Google Scholar] [CrossRef]
- Singh, I.; Vikas, R. Techniques for the Assessment of Mucoadhesion in Drug Delivery Systems: An Overview. J. Adhes. Sci. Technol. 2012, 26, 2251–2267. [Google Scholar] [CrossRef]
- Sreeram, K.J.; Yamini Shrivastava, H.; Nair, B.U. Studies on the nature of interaction of iron(III) with alginates. Biochim. Biophys. Acta. 2004, 1670, 121–125. [Google Scholar] [CrossRef] [PubMed]
- Picón-Pagès, P.; Bonet, J.; García-García, J.; Garcia-Buendia, J.; Gutierrez, D.; Valle, J.; Gómez-Casuso, C.E.; Sidelkivska, V.; Alvarez, A.; Perálvarez-Marín, A.; et al. Human Albumin Impairs Amyloid β-peptide Fibrillation Through its C-terminus: From docking Modeling to Protection Against Neurotoxicity in Alzheimer’s disease. Comput. Struct. Biotechnol. J. 2019, 17, 963–971. [Google Scholar] [CrossRef]
- Yuan, L.; Cao, Y.; Luo, Q.; Yang, W.; Wu, X.; Yang, X.; Wu, D.; Tan, S.; Qin, G.; Zhou, J.; et al. Pullulan-Based Nanoparticle-HSA Complex Formation and Drug Release Influenced by Surface Charge. Nanoscale Res. Lett. 2018, 13, 317. [Google Scholar] [CrossRef]
- Dai, J.; Chen, C.; Yin, M.; Li, H.; Li, W.; Zhang, Z.; Wang, Q.; Du, Z.; Xu, X.; Wang, Y. Interactions between gold nanoparticles with different morphologies and human serum albumin. Front. Chem. 2023, 11, 1273388. [Google Scholar] [CrossRef]
- Maffre, P.; Brandholt, S.; Nienhaus, K.; Shang, L.; Parak, W.J.; Nienhaus, G.U. Effects of surface functionalization on the adsorption of human serum albumin onto nanoparticles—A fluorescence correlation spectroscopy study. Beilstein J. Nanotechnol. 2014, 7, 2036–2047. [Google Scholar] [CrossRef]


| Conditions | Primary Emulsion’s Parameters (W1/O) | Double Emulsion’s Parameters W1/O/W2 | Average Particle Size (nm) ± SD | ||||
|---|---|---|---|---|---|---|---|
| Inner Phase, W1 (mL) | Stirring Speed (rpm) | Span 85 (%) | Polysorbate 20(%) | Outer Phase, W2 (mL) | Stirring Speed (rpm) | ||
| Stirring speed for W1/O | 1.0 | 11,000 | 1.0 | 1.0 | 50.0 | 25,000 | 356 ± 65 |
| 1.0 | 16,000 | 1.0 | 1.0 | 50.0 | 25,000 | 310 ± 25 | |
| 1.0 | 21,000 | 1.0 | 1.0 | 50.0 | 25,000 | 270 ± 21 | |
| Stirring speed for W1/O/W2 | 1.0 | 21,000 | 1.0 | 1.0 | 50.0 | 16,000 | 865 ± 18 |
| 1.0 | 21,000 | 1.0 | 1.0 | 50.0 | 21,000 | 350 ± 32 | |
| 1.0 | 21,000 | 1.0 | 1.0 | 50.0 | 25,000 | 274 ±12 | |
| Concentration of Span 85 | 1.0 | 21,000 | - | 1.0 | 50.0 | 25,000 | unstable W1/O |
| 1.0 | 21,000 | 0.5 | 1.0 | 50.0 | 25,000 | 480 ± 29 | |
| 1.0 | 21,000 | 1.0 | 1.0 | 50.0 | 25,000 | 290 ± 16 | |
| Concentration of Polysorbate 20 | 1.0 | 21,000 | 1.0 | 0.5 | 50.0 | 25,000 | 310 ± 27 |
| 1.0 | 21,000 | 1.0 | 1.0 | 50.0 | 25,000 | 278 ± 10 | |
| 1.0 | 21,000 | 1.0 | 1.5 | 50.0 | 25 000 | 254 ± 8 | |
| Volume of W1 | 1.0 | 21,000 | 1.0 | 1.0 | 50.0 | 25,000 | 285 ± 11 |
| 1.5 | 21,000 | 1.0 | 1.0 | 50.0 | 25,000 | 310 ± 7 | |
| 2.0 | 21,000 | 1.0 | 1.0 | 50.0 | 25,000 | 369 ± 13 | |
| Volume of W2 | 1.0 | 21,000 | 1.0 | 1.0 | 20.0 | 25,000 | 420 ± 21 |
| 1.0 | 21,000 | 1.0 | 1.0 | 30.0 | 25,000 | 390 ± 19 | |
| 1.0 | 21,000 | 1.0 | 1.0 | 50.0 | 25,000 | 266 ± 8 | |
| Primary Emulsion’s Parameters W1/O | Double Emulsion’s Parameters W1/O/W2 | |||||
|---|---|---|---|---|---|---|
| Inner Phase, W1 (mL) | Stirring Speed (rpm) | PCL (%) | Span 85 (%) | Polysorbate 20 (%) | Outer Phase, W2 (mL) | Stirring Speed (rpm) |
| 1.0 | 21,000 | 0.5 | 1.0 | 1.0 | 50.0 | 25,000 |
| Sample Code | DFP (mg) | PCL (14 kDa) (mg) | PCL (80 kDa) (mg) | DFP: PCL | Mean Diameter (nm) | PDI | ζ-Potential (mV) |
|---|---|---|---|---|---|---|---|
| NP1-DFP | 12.5 | 25.0 | - | 1:2 | 213 ± 56 | 0.820 | −12.70 ± 0.5 |
| NP2-DFP | 12.5 | - | 25.0 | 1:2 | 241 ± 91 | 0.535 | −18.22 ± 0.1 |
| Sample Code | pH W1 | pH W2 | DEE (%) | DL (%) |
|---|---|---|---|---|
| NP1-DFP | 6.0 | 6.0 | 3.31 ± 0.97 | 1.62 ± 0.42 |
| NP2-DFP | 6.0 | 6.0 | 2.72 ± 0.12 | 1.34 ± 0.06 |
| NP1-DFP | 2.6 | 7.4 | 22.00 ± 2.16 | 9.08 ± 0.95 |
| NP2-DFP | 2.6 | 7.4 | 17.15 ± 0.80 | 7.40 ± 0.50 |
| Mean Diameter (µm) | DEE (%) | DL (%) | Yield (%) |
|---|---|---|---|
| 6.05 ± 1.78 | 36.28 ± 0.32 | 5.18 ± 0.06 | 86.93 ± 3.04 |
| Sample | Area (J/g) | Peak (°C) | Onset (°C) | End (°C) | Width (°C) | Height (mW/mg) |
|---|---|---|---|---|---|---|
| Sodium alginate | 200.0 | 111.0 | 61.6 | 150.2 | 69.3 | 0.543 |
| −257.2 | 243.0 | 232.9 | 254.5 | 21.6 | 2.414 | |
| poly-ε-caprolactone (PCL) | 71.19 | 75.8 | 63.5 | 83.7 | 20.5 | 0.6681 |
| Deferiprone (DFP) | 262.4 | 283.7 | 277.2 | 286.5 | 6.4 | 7.881 |
| Microcomposite particles (M-NP1-DFP) | 3.1 | 60.2 | 56.8 | 63.7 | 5.3 | 0.1078 |
| 29.93 | 165.2 | 161.2 | 168.0 | 6.2 | 0.757 | |
| −24.39 | 252.4 | 232.4 | 262.2 | 24.7 | 0.1912 | |
| M-NP-Placebo | 5.41 | 59.3 | 56.4 | 62.9 | 5.0 | 0.185 |
| −147.8 | 248.3 | 231.1 | 258.0 | 20.8 | 1.264 |
Disclaimer/Publisher’s Note: The statements, opinions and data contained in all publications are solely those of the individual author(s) and contributor(s) and not of MDPI and/or the editor(s). MDPI and/or the editor(s) disclaim responsibility for any injury to people or property resulting from any ideas, methods, instructions or products referred to in the content. |
© 2024 by the authors. Licensee MDPI, Basel, Switzerland. This article is an open access article distributed under the terms and conditions of the Creative Commons Attribution (CC BY) license (https://creativecommons.org/licenses/by/4.0/).
Share and Cite
Boyuklieva, R.; Katsarov, P.; Zagorchev, P.; Abarova, S.; Hristozova, A.; Pilicheva, B. Development of Nanocomposite Microspheres for Nasal Administration of Deferiprone in Neurodegenerative Disorders. J. Funct. Biomater. 2024, 15, 329. https://doi.org/10.3390/jfb15110329
Boyuklieva R, Katsarov P, Zagorchev P, Abarova S, Hristozova A, Pilicheva B. Development of Nanocomposite Microspheres for Nasal Administration of Deferiprone in Neurodegenerative Disorders. Journal of Functional Biomaterials. 2024; 15(11):329. https://doi.org/10.3390/jfb15110329
Chicago/Turabian StyleBoyuklieva, Radka, Plamen Katsarov, Plamen Zagorchev, Silviya Abarova, Asya Hristozova, and Bissera Pilicheva. 2024. "Development of Nanocomposite Microspheres for Nasal Administration of Deferiprone in Neurodegenerative Disorders" Journal of Functional Biomaterials 15, no. 11: 329. https://doi.org/10.3390/jfb15110329
APA StyleBoyuklieva, R., Katsarov, P., Zagorchev, P., Abarova, S., Hristozova, A., & Pilicheva, B. (2024). Development of Nanocomposite Microspheres for Nasal Administration of Deferiprone in Neurodegenerative Disorders. Journal of Functional Biomaterials, 15(11), 329. https://doi.org/10.3390/jfb15110329